Article

Coefficient of Thermal Expansion of RCA Concrete Made by Equivalent Mortar Volume

School of Architectural Engineering, Hongik University, 2639 Sejong-ro, Jochiwon, Sejong 30016, Korea
*
Author to whom correspondence should be addressed.
Appl. Sci. 2021, 11(17), 8214; https://doi.org/10.3390/app11178214
Submission received: 19 July 2021 / Revised: 20 August 2021 / Accepted: 31 August 2021 / Published: 4 September 2021
(This article belongs to the Section Civil Engineering)

Abstract

:

Featured Application

Coefficient of thermal expansion of RCA concrete prepared by the equivalent mortar volume mix design was over 6–7% lower than that of RCA concrete by conventional mix design, at the same RCA replacement ratio. Additionally, it was similar to or 1–2% lower than that of the natural coarse aggregate concrete.

Abstract

The present study was conducted to experimentally verify if the coefficient of thermal expansion (COTE) of recycled aggregate concrete is proportional to the volume of the original virgin aggregate in the total recycled aggregate concrete mix. Three types of recycled concrete aggregate (RCA) were crushed from: railroad concrete sleepers; precast (PC) culverts; commercial recycling plant. RCA concretes were mixed using two concrete mixing methods: conventional mix method and equivalent mortar volume (EMV) method. And by varying the replacement ratio, three test series were made. Test results showed that at the same RCA replacement ratio of 68%, the COTE of RCA concrete prepared by the EMV mix design was over 6–7% lower than that of RCA concrete made with the conventional mix method. It was also similar to or 1–2% lower than that of the natural coarse aggregate concrete. This may be because the conventional mix method does not take into account the residual mortar content attached to RCA. This results in a decrease in the volumetric ratio of the original virgin aggregate and a relative increase in the volumetric ratio of the mortar (or cement paste).

1. Introduction

Cracks in concrete structures are caused largely by the load, but they may also be caused by material characteristics such as creep or environmental factors such as temperature and humidity. In particular, curling occurs in concrete pavement due to changes of temperature and humidity. In concrete overlay pavement construction, when the two materials have different coefficients of thermal expansion (COTE), delamination may be caused at the interface between existing concrete pavement and overlaying material due to thermal instability [1,2]. To prevent that, the Texas Department of Transportation sets the upper limit of COTE of concrete in its specifications. Continuous reinforced concrete pavement (CRCP) is often adopted as a form of concrete pavement, and the COTE of concrete is known to have an impact on the initial behavior of the CRCP [3]. Since the COTE of river gravel is higher than that of limestone by 30% on average, initial cracking can easily occur in CRCP prepared using river gravel [4].
Due to the recent impact of global warming, blow-up of road pavement is often reported in Korea. The Korean government has promoted for 2 years a study to analyze the causes of blow-up and to prepare countermeasures [5]. As possible causes of blow-up, it is analyzed whether the joint space of 6 m is too wide compared to the current concrete pavement thickness (300 mm) or whether the problem comes from the pavement mix [5,6]. Unfortunately, the efforts made by scholars to apply high-quality recycled aggregates to concrete pavement have ended in failure, because, although not clarified yet, the COTE of RCA concrete is larger than that of conventional concrete prepared by mixing natural coarse aggregate, possibly making the concrete pavement vulnerable to blow-up.
In other aspects, global warming problems led some researchers to consider sustainability including environmental benefits and innovative new materials and construction methods incorporating various other eco-friendly supplementary cementitious materials [7,8,9]. Heat energy was harvested from geothermal pavement constructed with construction and demolition waste materials [7]. The solar radiation can be absorbed by placing pipes in the pavement systems and circulating water in the pipes to collect the heat energy, to maximize the sustainability and energy efficiency of the infrastructures [7]. Feasibility of using demolished concrete block (DCB) was explored in a continued effort of material recycling [8]. The DCBs were used with self-compacting concrete (SCC) to produce DCB-filled-concrete since SCC can easily fill up the voids between DCBs. In addition to the traditional material testing properties such as mechanical strength and durability properties, the importance of the sustainability indicator which is a function of strength, resilience, ecology and economy has been emphasized [9].
The COTE of concrete is dependent on the concrete mixes [10,11,12,13], ages [10,11,12,13,14,15], humidity conditions [10,11,12,13,16,17], temperature cycles [18,19,20] and types of aggregate [10,11,12,13,21,22,23,24,25,26,27,28,29,30,31,32,33,34,35,36,37,38,39]. Since the COTE of cement paste is generally higher than that of aggregate, the COTE of concrete may differ according to the volumetric ratio of the aggregate in the mix [10,11,12,13]. A large difference of the COTE between cement paste and aggregate has a significant impact on concrete durability [13].
Byfor [12] reported, based on data provided by Alexanderson [14] and Weigler and Karl [15], that the COTE shows a noticeable increase in the early material ages, but gradually decreases with an increase in age.
It is generally known that the COTE of moist cured specimens is higher than that of air-dried specimens [16]. However, Zoldners [17] more systematically reported variations of the COTE according to the relative humidity; the results are accepted as generalizations in well-known textbooks on concrete, such as Mindess [10] and Nerville [11]. In detail, the COTE of concrete is small at a relative humidity of about 20% but drastically increases at a relative humidity of 60–70%, showing its smallest value at a relative humidity of 100% [17]. Based on these results, the AASHTO TP 60 [18] provides a method for estimating the COTE while immersing a concrete specimen in a water bath.
Helmuth [19] showed that the COTE is dependent on the temperature cycle. The COTE during a temperature rise is different from that during a temperature drop, and the difference is introduced as the effect of thermal creep. Considering this, the AASHTO TP 60 [18] stipulates that a temperature cycle including an interval of temperature rise from 10 °C to 50 °C and an interval of temperature drop from 50 °C to 10 °C should be repeated several times, and the mean value of the COTE when the COTE difference in consecutive intervals is within 0.3 × 10⁻⁶ °C should be considered as the final COTE. Reference [20] provides a test method prepared by partially modifying the AASHTO TP 60 method.
The most influential factor in the COTE of concrete is the type of coarse aggregate [10,11,12,13] because coarse aggregate has the largest volumetric ratio in a concrete mix. Kawaguchi [13] reported that the COTE was highest in concrete prepared using quartzite as aggregate and lowest in limestone concrete. It was also reported that the COTE increased with increases in the amount of SiO2, which is consistent with the finding that quartzite has the highest SiO2 content and limestone has the lowest. The COTE according to the type of aggregate is also consistent with the data reported by Mindess [10]. Although Mindess [10] reported that the COTE of sandstone was considerably high, it was found to be moderate in the study by Kawaguchi [13] and in our previous study [1]. On the other hand, the data from FHWA [22] showed that the COTE was highest in chert, followed by sandstone and quartzite, with that of limestone being the second lowest and that of rhyolite being the lowest. It is notable that the Eurocode [23] provided through experiments a COTE value for sintered fly ash, as aggregate, which falls between the lowest COTE values of marble and limestone. Zhou et al. [24] predicted the COTE of concrete by varying the shape of aggregate (circle, ellipsoid, square, rectangular) and using a self-consistent method; however, the effect of aggregate shape was found to be almost negligible.
It is particularly known that the COTE of recycled concrete aggregate (RCA) is affected by not only the type of original virgin aggregate but also by the residual mortar (RM) attached to RCA [1,22,23,24,25]. Generally, the COTE value of mortar or RM is higher than that of concrete [10,11,13]. Few studies have been conducted to measure the COTE of RCA, and most previous studies have been focused on concrete pavement [22,23,24,25,26,27,28,29,30,31,32,33,34,35,36,37,38,39] because the application of RCA is mainly concentrated on road applications. Previous reports showed that the COTE of RCA concrete generally increases as the replacement ratio of RCA increases [22,25,26,27,28,29,30,31]. However, there have been various other reports recently indicating that the COTE of RCA concrete is retained [32,33,34,35] or even decreases [36,37,38,39] with increase of RCA replacement ratio.
Hansen [26], ACPA [27] and NCHRPP [28] reported that the COTE of concrete increased to 30% with the increase of RCA replacement ratio. The test, performed with core specimens taken from 5 test sections of the Transportation Departments of four states in the United States, showed that the COTE of RCA concrete specimens was retained in 1 section but increased in 4 sections up to 9–23% [29,30]. Sadati and Khayat [31] reported that when RCA was used at a ratio of 40%, the COTE of the concrete increased to 10%. Because of this, paving with RCA concrete by the Transportation Department was discontinued in some states in the United States [29,31]. Our previous study also showed that the COTE of concrete with 100% RCA replacement ratio increased by 5–9% in comparison with that of reference concrete containing natural aggregates [25].
On the contrary, according to Won [32,33], concrete prepared by using RCA at a replacement ratio of 100% in which silicious river gravel was used as the original virgin aggregate showed a COTE that was similar to the COTE of the natural aggregate concrete in actual road sites. Khayat and Sadati [34] reported that RCA concrete of which replacement ratio was within 15–40% did not show a significant difference in the COTE compared to the conventional concrete. Bekoe et al. [35] also reported that the COTE of concrete prepared by using RCA remained similar at a replacement ratio up to 50%.
On the other hand, Smith [36,37] reported that the COTE decreased by up to 40% as RCA replacement ratio increased by 50%, and explained that the cause of the decrease was the use of high-quality RCA (with limestone as the original virgin aggregate). Pickel [38] showed that the COTE is dependent on RCA replacement ratio and the degree of RCA saturation; when RCA was fully saturated and the replacement ratio was 30%, the COTE of concrete was considerably reduced. According to Wen et al. [39], the COTE of pavement concrete mix decreased by 10% when RCA replacement ratio was 45% and fly ash was used at a ratio of 20%.
Therefore, the present study was conducted to show that the COTE of RCA concrete is proportional to the volumetric ratio of the original virgin aggregate in the total mix. Three types of RCA (one crushed from railroad concrete sleepers; one crushed from precast (PC) culverts; and one obtained from a commercial recycling plant) were mixed using two concrete mix designs (conventional mix design and equivalent mortar volume (EMV) mix design) and by varying the replacement ratio relative to that of natural coarse aggregate, which was used as a reference. The experiment was performed in 3 test series. Even if the replacement percentage of natural coarse aggregate with RCA is the same among the coarse aggregates included in a certain mix, the volumetric ratio of the original virgin aggregate is larger in mixes prepared by modified EMV mix design than in those prepared by the conventional ACI mix design method. Therefore, one of the main purposes of the present study was to examine the difference of the COTE between the two mixes.

2. Experimental Program

2.1. RCA Productions

Three types of RCA were used in the present study: ‘RR’ from Railway PC sleepers (Figure 1a); ‘RP’ from PC culverts (Figure 1b); and ‘RA’ from the IS recycling plant in Korea. The PC sleepers, having a compressive strength of about 35 MPa, were manufactured according to the Korean Railway Standards [40] by steam curing at a maximum aggregate size of 20 mm and water-cement ratio of 35% or lower. The PC sleepers were then crushed in a plant into ‘RR’, having a maximum aggregate size of 20 mm. The second type, ‘RP,’ was obtained from crushing PC culverts having a maximum aggregate size of 20 mm and a compressive strength of 35 MPa. ‘RA,’ obtained from a recycling plant, was prepared by crushing old concrete from the same source into a size of 20 mm. It should be noted that the old railway PC sleepers were used about for 20 years, while the old PC culverts were laid out in the open area at best for a year and old concrete structures for ‘RA’ more than 20 years.
Old concrete structures were crushed using a hydraulic breaker, and foreign materials such as rail pads and wires in the railway PC sleepers and reinforcing rebars in the PC culverts and other structures were collected by separation. Ton bags of initially crushed RCA were then transported to the recycling plant and treated by four, six, and three additional crushing process steps (combinations of jaw crusher and impact crusher) for ‘RR’, ‘RP’, ‘RA,’ respectively. Finally, RCA products were obtained. The original coarse aggregate sources of the old railway sleepers and the old PC culverts were granite.

2.2. Aggregates Properties

Table 1 shows the specific gravity, and water absorption of 3 types of RCA, 2 types of natural coarse aggregate (NCA), and 2 types of fine aggregate. The specific gravity and the water absorption of the RR produced from concrete sleepers were 2.48% and 4.53%, respectively, and those of the RP, produced from concrete culvert, were 2.60% and 2.62%, respectively, and those of the RA, produced from a plant, were 2.52% and 3.82%, respectively.
Crushed granite was used as NCA; its specific gravity and water absorption were 2.65% and 0.70%, respectively, in test series 1, and 2.71% and 0.37%, respectively, in test series 2. River sand was used as fine aggregate; its specific gravity and water absorption were 2.56, 2.60 and 1.10, 0.95 respectively for fine aggregate 1 and fine aggregate 2. Table 2 provides details of the test series.
The thermal treatment method suggested by Juan and Gutierrez [41] was applied to calculate the RMC value of RCA. The prepared RCA samples were heated in an electric furnace at 500 °C for 2 h, and the heated samples were taken out of the electric furnace and immersed in ice water to apply a heat shock to separate the mortar. The measurements were inserted into Equation (1) to calculate the RMC values. The RMC values calculated for RR, RP and RA were 39.9%, 20.0% and 25.0%, respectively.
RMC = (WRCA − WOVA)/WRCA × 100
In Equation (1), WRCA denotes the weight of RCA dried in a dryer after the first sampling; WOVA is the weight of the original virgin aggregate (OVA) obtained by drying the sample in a dryer after removing the RM.

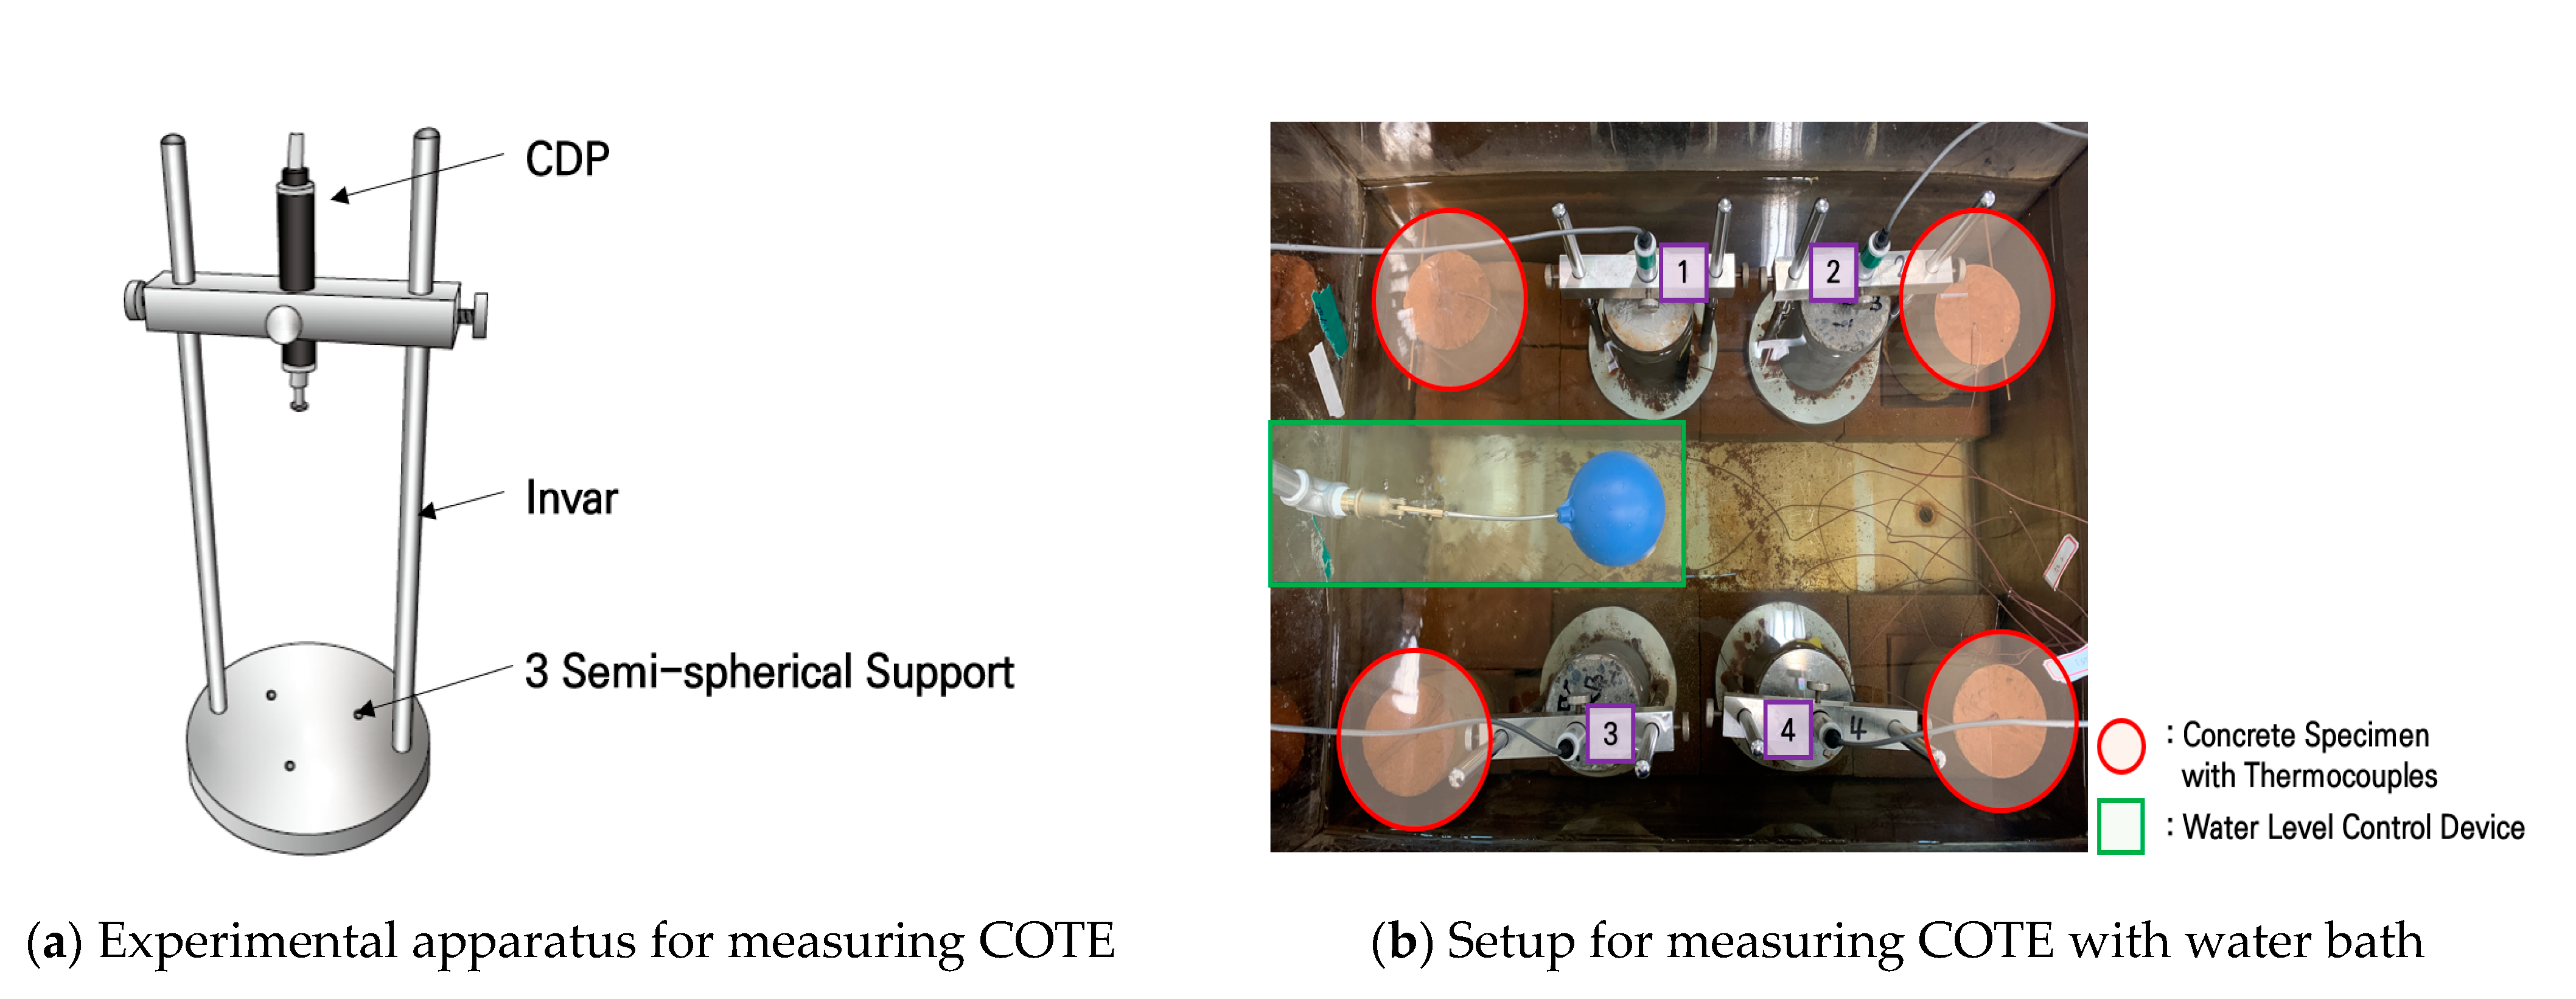
3. Experimental Tests

3.1. Mix Design

The experiment was performed using Type I Portland cement, of which the specific gravity and specific surface area were 3.15 and 3380 cm2/g, respectively. The experiment consisted of 23 test series. In test series 2 and 3, Type C fly ash was added at a ratio of 10% relative to the cement. The chemical admixture used in the present experiment was a polycarboxylate-based air-entraining agent and a water-reducing agent from a South Korean vendor (Econex Co., Pyeongtaek, Korea). All the aggregates were prepared under saturated-surface-dry conditions.
The first mix series consisted of 5 mixes having a compressive strength of 35 MPa, which is the standard for manufacturing railway PC sleepers. The tests were performed using the ‘RR’ aggregates obtained by crushing old PC sleepers. The mix symbols shown in Table 2 are described below. The first letter ‘C’ means the conventional ACI mix design, and the letter ‘E’ means the EMV mix design. The following letters ‘NR’ mean the crushed natural aggregate used for railway sleepers. As described above, ‘RR’ means RCA produced from railway sleepers. CRR68 and CRR33 represent the mixes prepared by respectively replacing 68% and 33% of the total coarse aggregates with the RR recycled aggregates. ‘ERR68′ in ERR68 and ERR68-2 means that the mixes were prepared using EMV mix design by replacing 68% of the aggregates with the ‘RR’ recycled aggregates. In addition, ‘-2′ is a scale factor meaning that 1/2 of the RM suggested by the modified EMV mix design was treated with aggregates, and the remaining 1/2 was considered as mortar [42].
The second mix series consisted of 5 mixes prepared using the ‘RP’ recycled aggregates produced from old PC culverts. The conventional ACI mix design and the EMV mix design were also applied to the second mix series. The CRP and ERP series of mix series 2 were prepared respectively by using concrete in which the RP recycled aggregate was coated with a cement paste dissociation agent for chloride penetration resistance, and concrete to which cement paste dissociation agent was not applied [43].
The third mix series consisted of 4 mixes. The first three mixes were prepared by applying the same mix design as in the second mix series, and the fourth was prepared by using the ‘RA’ recycled aggregate to compare the physical properties between the different types of aggregate.
A pan mixer that allows for mixing at a volume of 60 L was used to perform the experiment in a laboratory located at Hongik University, Korea. The coarse aggregate and fine aggregate were added to the mixer and mixed together for about 30 s. Then, cementitious materials were further added and stirred for 30 s. After that, admixtures, carefully diluted in water, were added and mixed for 2 min.

3.2. Specimen Preparation

Concrete specimens were prepared using plastic molds and a predetermined consolidation method [44]. The specimens were demolded after 24 h. All the specimens were cured for at least 1 year before being used in the experiment. The size of the cylindrical specimens was a base diameter of 100 mm and a height of 200 mm.
The COTE of the concrete specimens was measured according to the AASHTO TP-60 method using CDP displacement transducer [18]. As shown in Figure 2, an invar material, rarely affected by temperature change, was used as a support frame, and was mounted on the base plate. The CDP was installed at the top and connected with a data logger to measure the real-time variation of the length of the specimens depending on the temperature. Three semispherical supports were arranged on the base plate at equal intervals so that the specimens could be firmly settled. The internal temperature of concrete was controlled by fabricating 4 temperature specimens into which thermocouple wires were inserted. The temperature specimens were installed at each corner of the water bath and connected to the data logger to measure the real-time temperature. The mean values from the temperature data were used in the analysis of the specimen temperature. In addition, to avoid the effect of vapor on CDP, the lid of the water bath was removed during the experimentation. The water level was controlled by applying a water level control device to prevent changes of water level in the water bath.
As shown in Figure 3, the water bath temperature was gradually increased from 10 °C, the initial temperature, to 50 °C at 5 h, and kept at 50 °C for 3 h. Subsequently, the temperature was gradually decreased to 10 °C over 5 h and kept at 10 °C for 3 h. This temperature cycle was repeated.
The COTE of the concrete specimens was corrected using SUS-304 as a correction specimen. The COTE of the individual concrete specimens was corrected using Equation (2):
α t r u e = α n o m ± α r e f
αtrue: Corrected COTE (×10−6/°C)
αnom: Measured COTE (×10−6/°C)
αref: COTE correction factor calculated from SUS-304 (×10−6/°C)

4. Test Results

4.1. Basic Properties

The COTE of the SUS-304 specimen, the reference specimen applied to Equation (2) for calculating the COTE of concrete specimens, was measured using a thermomechanical analyzer (TMA). For analysis of the experimental results, the COTE of the mortar, aggregate and cement paste, used for the composite model, was also measured using the TMA. The specimens employed by the TMA had cylindrical shapes of 8 × 25 mm. Figure 4 shows photos of the specimens applied to the TMA, and Table 3 shows the results of the COTE measurement.
As pretreatment for analyzing the COTE results of concrete specimens using the composite model, mortar specimens were prepared using the mix applied to mix series 1 and the one applied to mix series 2 and 3, and the elastic modulus of the mortar specimens at the age of 28 days was acquired, as shown in Table 4.

4.2. Concrete COTE Test Results

Figure 5a shows the COTE of the concrete specimens of mix series 1. The error bar graph in Figure 5a represents the mean values of the individual. The values for CNR and ERR68-2 are the mean of 4 specimens, and the values for the other types of specimens are each the mean of 3 specimens. The mean CTE of the CNR specimen prepared using the reference natural coarse aggregate was 8.47 × 10⁻⁶/°C, and the mean COTE values of the CRR68, CRR33, ERR68 and ERR68-2 specimens were 8.91, 8.93, 8.38 and 8.28 × 10⁻⁶/°C, respectively. The error of the reference CNR specimen and ERR68-2 was large in comparison with the mean values.
Figure 5b shows the COTE values relative to the COTE of the reference CNR specimen. The COTE values of the CRR68 and CRR33 specimens were 5.2% and 5.4% higher, respectively, in comparison with the COTE of the reference specimen. On the contrary, the COTE values of the ERR68 and ERR68-2 specimens were 1.1% and 2.3% lower, respectively. Therefore, compared with the CR-mixes prepared by the conventional mix design, the COTE of the ER-mixes was lower by 6–7%.
Figure 6a shows the mean COTE values of the concrete specimens of mix series 2. The specimens of mix series 2 were prepared using concrete mix that had been used for manufacturing PC culverts, and RP recycled aggregate obtained by crushing old PC culverts was applied.
In mix series 2, the mean COTE of the CNR specimen prepared using the reference natural coarse aggregate was 8.54 × 10⁻⁶/°C, and the mean COTE values of the CRP25 and CRP50 specimens, prepared using the conventional concrete mix design and RP at 25% and 50%, were 8.66 and 8.59 × 10⁻⁶/°C, respectively. The COTE values of the ERP25 and ERP50 specimens, prepared by EMV mix design, were coincidently the same at 8.45 × 10⁻⁶/°C. The value of the CNP specimen is the mean of 3 specimens, and the values for the CRP25, CRP50, ERP25 and ERP50 specimens are each the mean of 6 specimens.
As described above, the CRP and ERP series of mix series 2 were prepared respectively by using concrete in which RP recycled aggregate was coated with a cement paste dissociation agent intended for chloride penetration resistance, and concrete to which the cement paste dissociation agent was not applied. Assuming the coating agent did not affect the COTE, the COTE of the CRP series and ERP series specimens were each calculated as the mean of 6 COTE values. The errors of the CRP25 and ERP50 specimens were larger than those of the other specimens.
Figure 6b shows the COTE relative to the mean COTE of the reference CNP specimen. The COTE values of the CRP25 and CRP50 specimens were 1.3% and 0.6% higher, respectively, than the COTE of the reference specimen. On the contrary, the COTE values of the ERP25 and ERP50 specimens were 1% and 1.1% lower, respectively.
Figure 7a shows the mean COTE of the concrete specimens of mix series 3. The specimens of mix series 3 were prepared using the same PC culvert concrete mix as used in mix series 2, and by adding RA as another recycled aggregate. In mix series 3, the mean COTE of the CNR specimen prepared using the reference natural coarse aggregate was 8.17 × 10⁻⁶ /°C, and the mean COTE values of the CRP50 specimen, prepared by applying the conventional concrete mix design and using 50% RP, and the ERP50, prepared by applying EMV mix design and using 50% RP, were 8.40 and 7.96 × 10⁻⁶/°C, respectively. The mean COTE of the ERA specimens prepared by applying the EMV mix design and using 50% RA was 8.11 × 10⁻⁶/°C.
Figure 7b shows the COTE values relative to the COTE of the reference CNP specimen. Compared with the COTE of the reference specimen, the COTE of the CRP50 specimen, prepared by applying the conventional mix design, was 2.8% higher, and the COTE values of the ERP50 and ERA50 specimens, prepared by applying the EMV mix design, were 2.6% and 0.8% lower, respectively.
The CNP, CRP50 and ERP50 specimens of mix series 2 and mix series 3 were each prepared by applying the same mix design, and thus the mean COTE values obtained from the two mix series were calculated and compared, as shown in Figure 8. Compared with the reference CNP specimen, the COTE of the CRP50 specimen, prepared by applying the conventional mix design, was higher by 2.3%, and that of the ERP50 specimen, prepared by applying the EMV mix design, was lower by 0.5% and thus are considered almost the same. Therefore, the results showed that the COTE of RCA concrete specimens prepared by applying the EMV mix design was lower than those of specimens prepared by applying the conventional mix design.

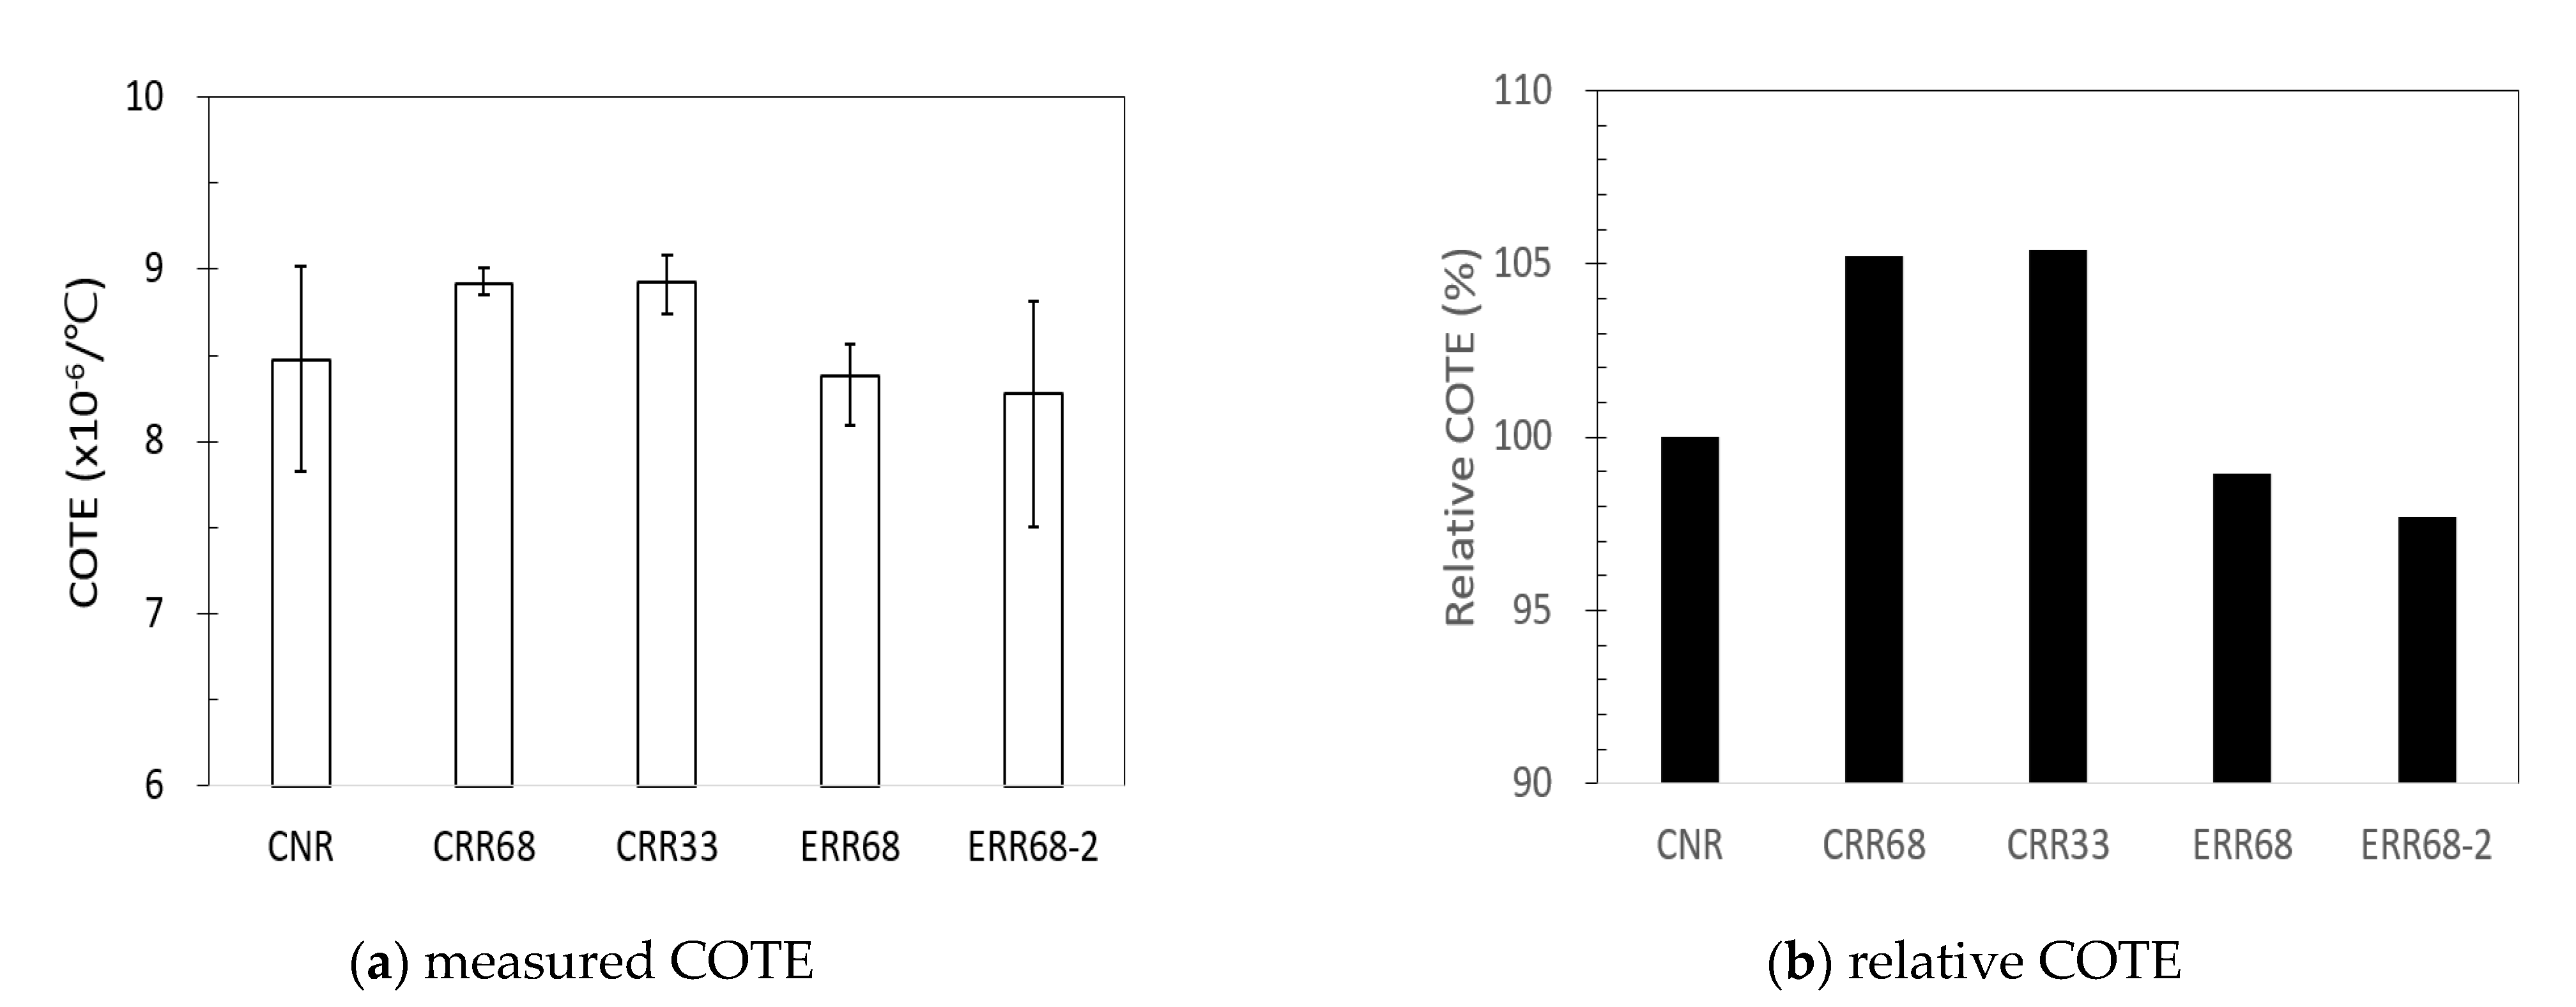
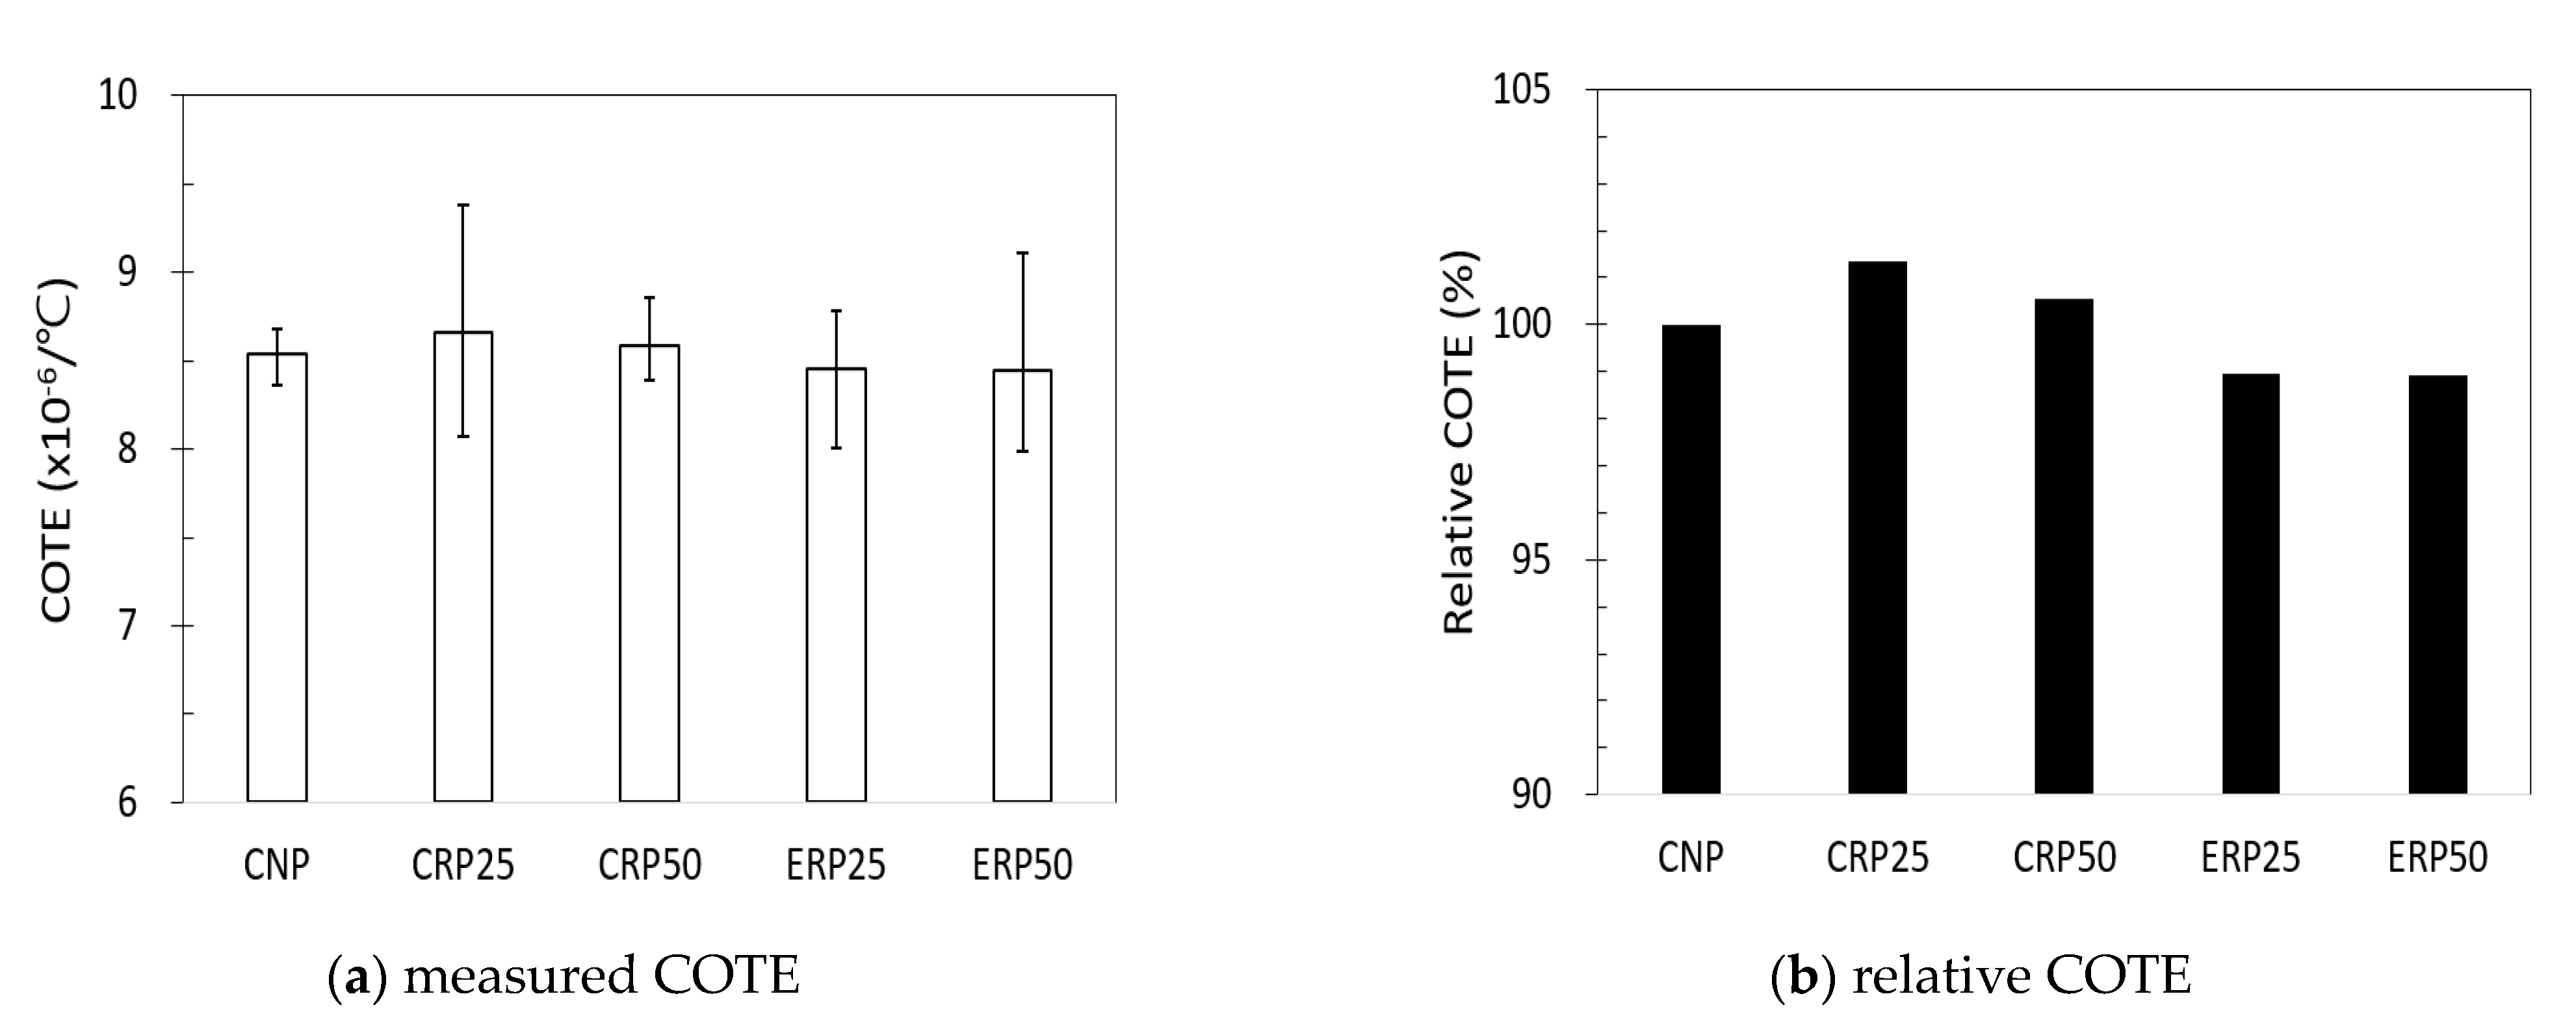
4.2.1. Dependence of Total Coarse Aggregate Volume

In the present study, both RCA and NCA were based on similar granite aggregates, and thus the effect of the aggregate type was considered to be negligible. Assuming that concrete comprises coarse aggregate and mortar (water, cement, fine aggregate, air void), it was predicted that the COTE of concrete would increase as the volumetric ratio of mortar increased or that the COTE of concrete would decrease as the volumetric ratio of the coarse aggregate increased.
Using Equation (3), the total coarse aggregate volume in the mix was calculated using the data shown in Table 1 and Table 2:
V T C A = W N C A S G N C A × 1000 + W R C A × ( 1 R M C S ) S G R C A × 1000
where V T C A is the sum of the volume of natural aggregate ( W N C A S G N C A × 1000 ) and the volume of original virgin aggregate ( W R C A × ( 1 R M C S ) S G R C A × 1000 ) and where S G N C A and S G R C A are the specific gravities of natural coarse aggregate and of RCA, respectively; RMC is residual mortar content from Equation (2) and ‘S’ is a scale factor, as explained before and in reference [42].
Figure 9 illustrates the quadratic relations of the mean COTE values of the specimens prepared by applying the individual mixes of mix series 1–3 and the volumetric ratio of coarse aggregate of the individual mixes. In test series 1, the volumetric ratios of the coarse aggregate of the reference CNR mix and the ERR68 and ERR68-2 specimens of the EMV mix were 0.34, 0.35 and 0.35, respectively. The volumetric ratios of the coarse aggregate of the CRR68 and CRR33 specimens of the conventional mix design were 0.24 and 0.29, respectively. Figure 9a shows that as the total volumetric ratio of the virgin coarse aggregate in the recycled aggregate mix increased, the COTE of concrete specimens decreased with a determination coefficient of 0.98. As also described in many previous reports, our results clearly show that the volumetric ratio of the aggregate is one of the factors influencing the COTE of concrete specimens.
In test series 2, on the contrary, the volumetric ratios of the coarse aggregate of the reference CNR mix and the ERP25 and ERP50 specimens of the EMV mix were all about 0.39. The volumetric ratios of the coarse aggregate of the CRP25 and CRP50 specimens of the conventional mix design were 0.36 and 0.34, respectively. As shown in Figure 9b, with the determination coefficient of 0.95, the COTE of concrete specimens still decreased as the total volumetric ratio of the virgin coarse aggregate in the recycled aggregate mix increased.
On the other hand, in mix series 3, besides the specimens prepared using the same mix design as used for mix series 2, additional specimens were prepared by applying the RA aggregate and the EMV mix design. Figure 9c shows the experimental results obtained from the specimens as a function of the total coarse aggregate volume. The volumetric ratio of the coarse aggregate was about 0.39 in the reference CNP specimen and in the ERP50 and ERA50 specimens of the EMV mix design. The volumetric ratio of the coarse aggregate of the CRP50 specimen, prepared by the conventional mix design, was 0.34. Figure 9c shows that as the total volumetric ratio of the virgin coarse aggregate in the recycled aggregate mix increased, the COTE of the concrete specimens decreased with a determination coefficient of 0.99. However, it is reported by literature [10,11,12,21] that the COTE value of concrete is proportional to the volume ratio of total coarse aggregate. Further study is needed to verify if the COTE value of concrete is linear or nonlinear to the volume ratio of total coarse aggregate.

4.2.2. Predicted COTE Values

Since concrete is a composite including various materials, the COTE of concrete may be determined from the COTEs of the individual components. Two models have traditionally been presented for this: one is the parallel model; the other is the series model [10]. Hirsh [46] combined the two models and presented the following composite equation:
α c   = X ( α m V m + α a V a ) + ( 1 X ) α m V m E m + α a V a E a V m E m + V a E a
where
α m , α a = COTE of mortar and aggregate, respectively
V m , V a = volume fraction of mortar and aggregate, respectively
E m , E a = elastic modulus of mortar and aggregate, respectively
X = relative proportions of materials conforming with the upper and lower bound solution.
It should be noted that Hirsh’s model becomes the series model when XX = 1, while it becomes the parallel model when XX = 0.
Table 3 and Table 4 summarizes the input variables of the Hirsh model. The elastic moduli of the CNR, CRR68, CRR33, ER68 and ER68-2 specimens at the age of 28 days in mix series 1 were 27.1, 24.8, 25.8, 26.1 and 26.9 GPa, respectively [42], and those of the CNP, CRP25, CRP50, ERP25 and ERP50 specimens in mix series 2 were 27.7, 27.7, 26.3, 26.4 and 27.2 GPa, respectively [43]. Since the elastic modulus of concrete and that of the mortar used in the present study, as shown in Table 4, were very similar to each other, the parallel part in the Hirsh model was neglected. Therefore, the condition of XX = 1 was applied.
Under the assumption that XX = 1, the input variables in Table 3 were substituted into the Hirsh model to predict the COTEs of the specimens prepared under different conditions; the results of the curve fitting of the COTEs are shown in Figure 10. Figure 10a,c shows that the predicted COTE values fit well to the measured COTE values with determination coefficient of 0.85 and 0.86, respectively by linear relationships in Mix 1 and Mix 3. However, the determination coefficient was lower in mix series 2 than in mix series 1 or 3, because RCA replacement ratios were 33% and 68% in mix series 1 and 25% and 50% in mix series 2. As a result, the distribution of the total coarse aggregate ratio, represented by the x-axis of the plot shown in Figure 9, is closer among the specimens in mix series 2 than in mix series 1. The difference between the predicted values and the measured values may have resulted because the α a   and α m values were obtained using a dilatometer type TMA, but the COTE value of concrete was obtained under saturated conditions in a bath in which RH = 100% according to the AASHTO-TP60.

5. Conclusions

The present study was conducted to experimentally verify that the COTE of RCA concrete is dependent on the volume of the original virgin aggregate in the total RCA concrete mix. Three types of RCA (one crushed from railroad concrete sleepers; one crushed from precast (PC) culverts; and one obtained from a commercial recycling plant) were mixed by two concrete mixing methods (conventional mix method and EMV method) and by varying the replacement ratio relative to that of natural coarse aggregate. Three mix series were used in the experiment. The conclusions acquired from the experimental results are described below. It should be noted that because of limited test variables and test numbers in this study, further study is needed for the findings of this study to be generalized to other RCA concrete types (i.e., using RCA from other sources, or having different parameters and exposure conditions).
(1)
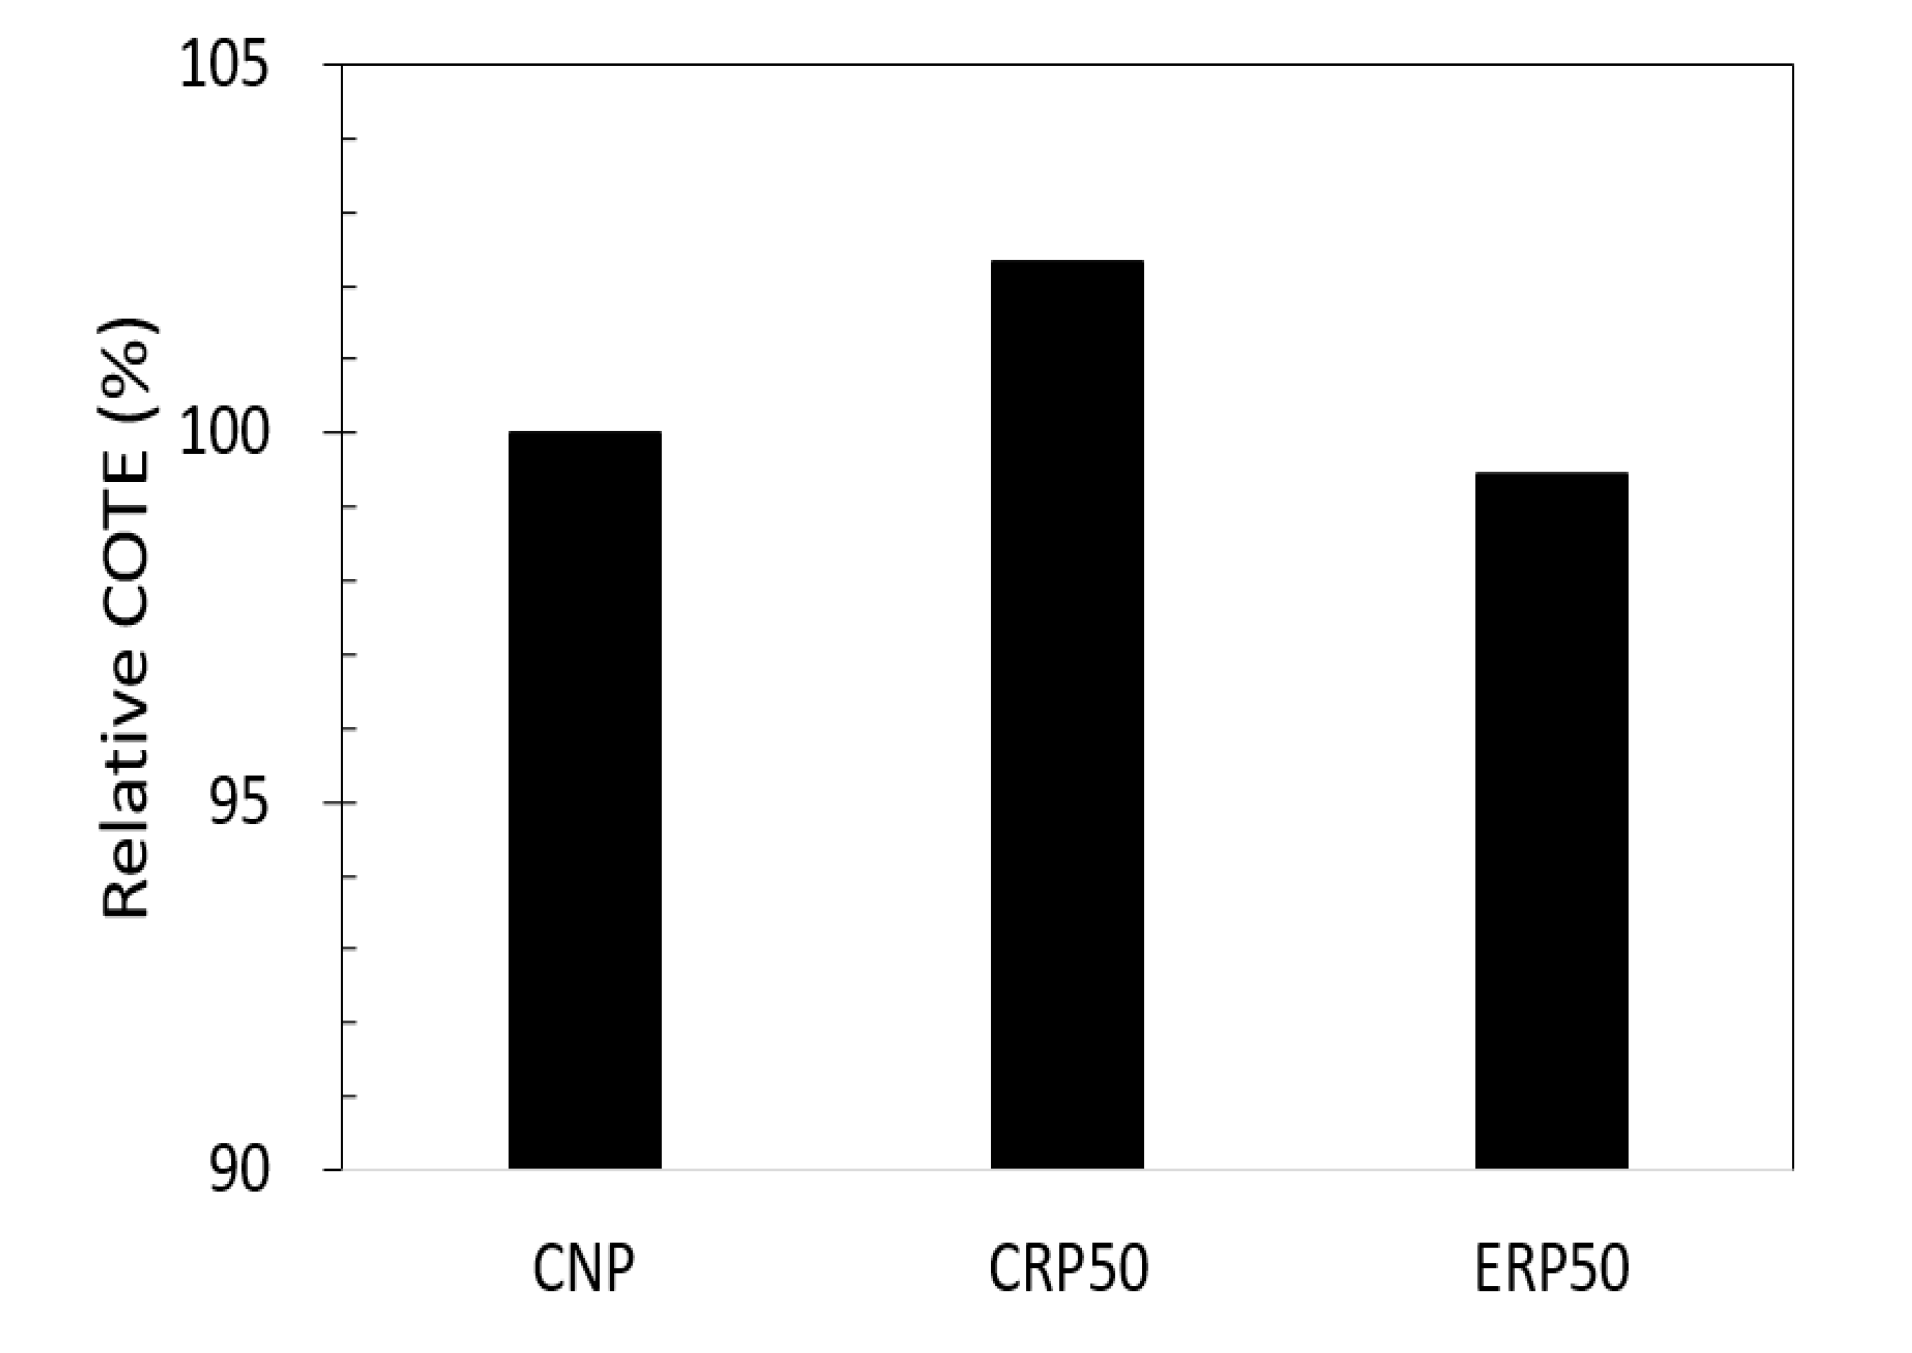
At the same RCA replacement ratio (volumetric ratio of RCA in the total coarse aggregate) of 68%, the COTE of RCA concrete prepared by EMV mix design was over 6–7% lower than that of RCA concrete prepared by conventional mix method, and it was similar to or 1–2% lower than that of the reference natural coarse aggregate concrete.
(2)
For RCA concrete prepared by conventional mix method, which does not take into account the residual mortar content (RMC) attached to RCA, the volumetric ratio of the original virgin aggregate was relatively small and the volumetric ratio of the mortar (or cement paste) was relatively high, and thus the COTE may have increased.
(3)
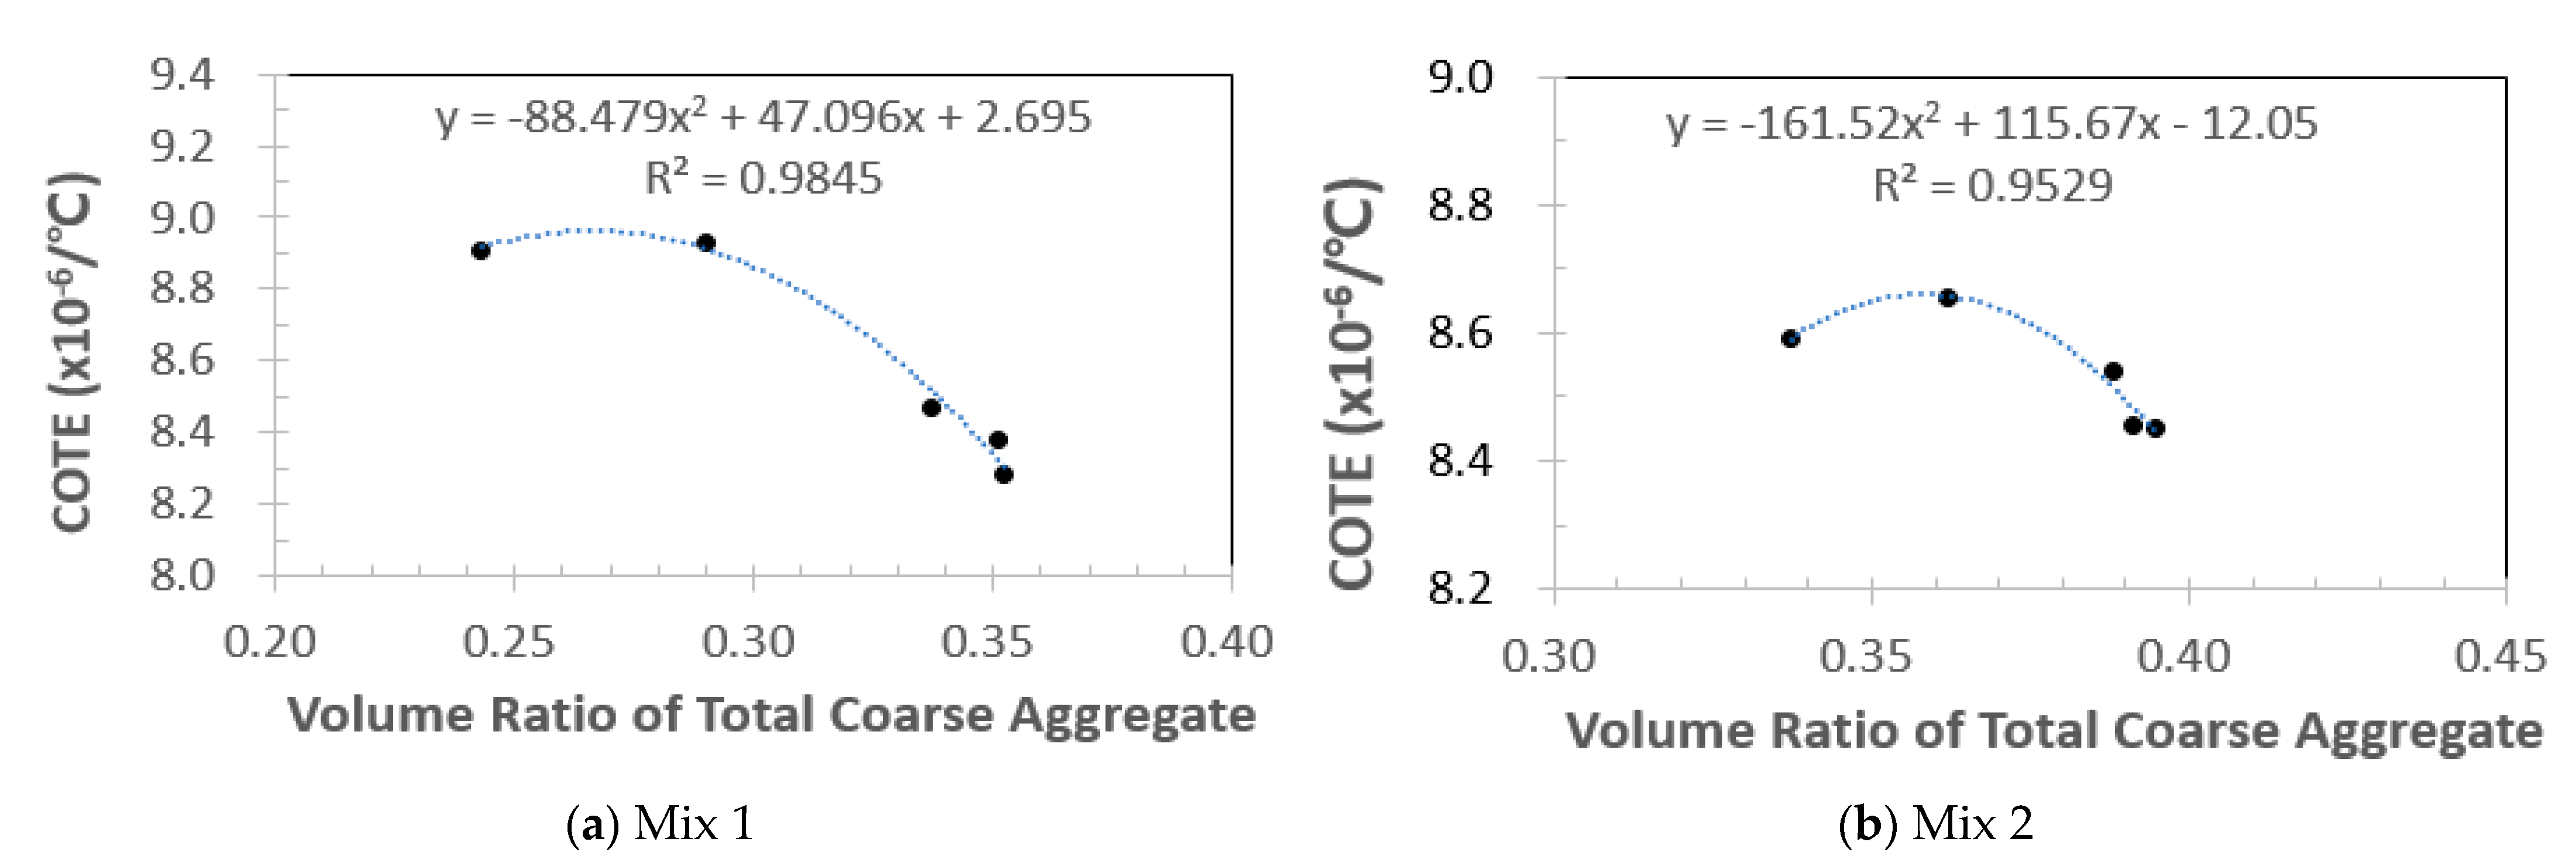
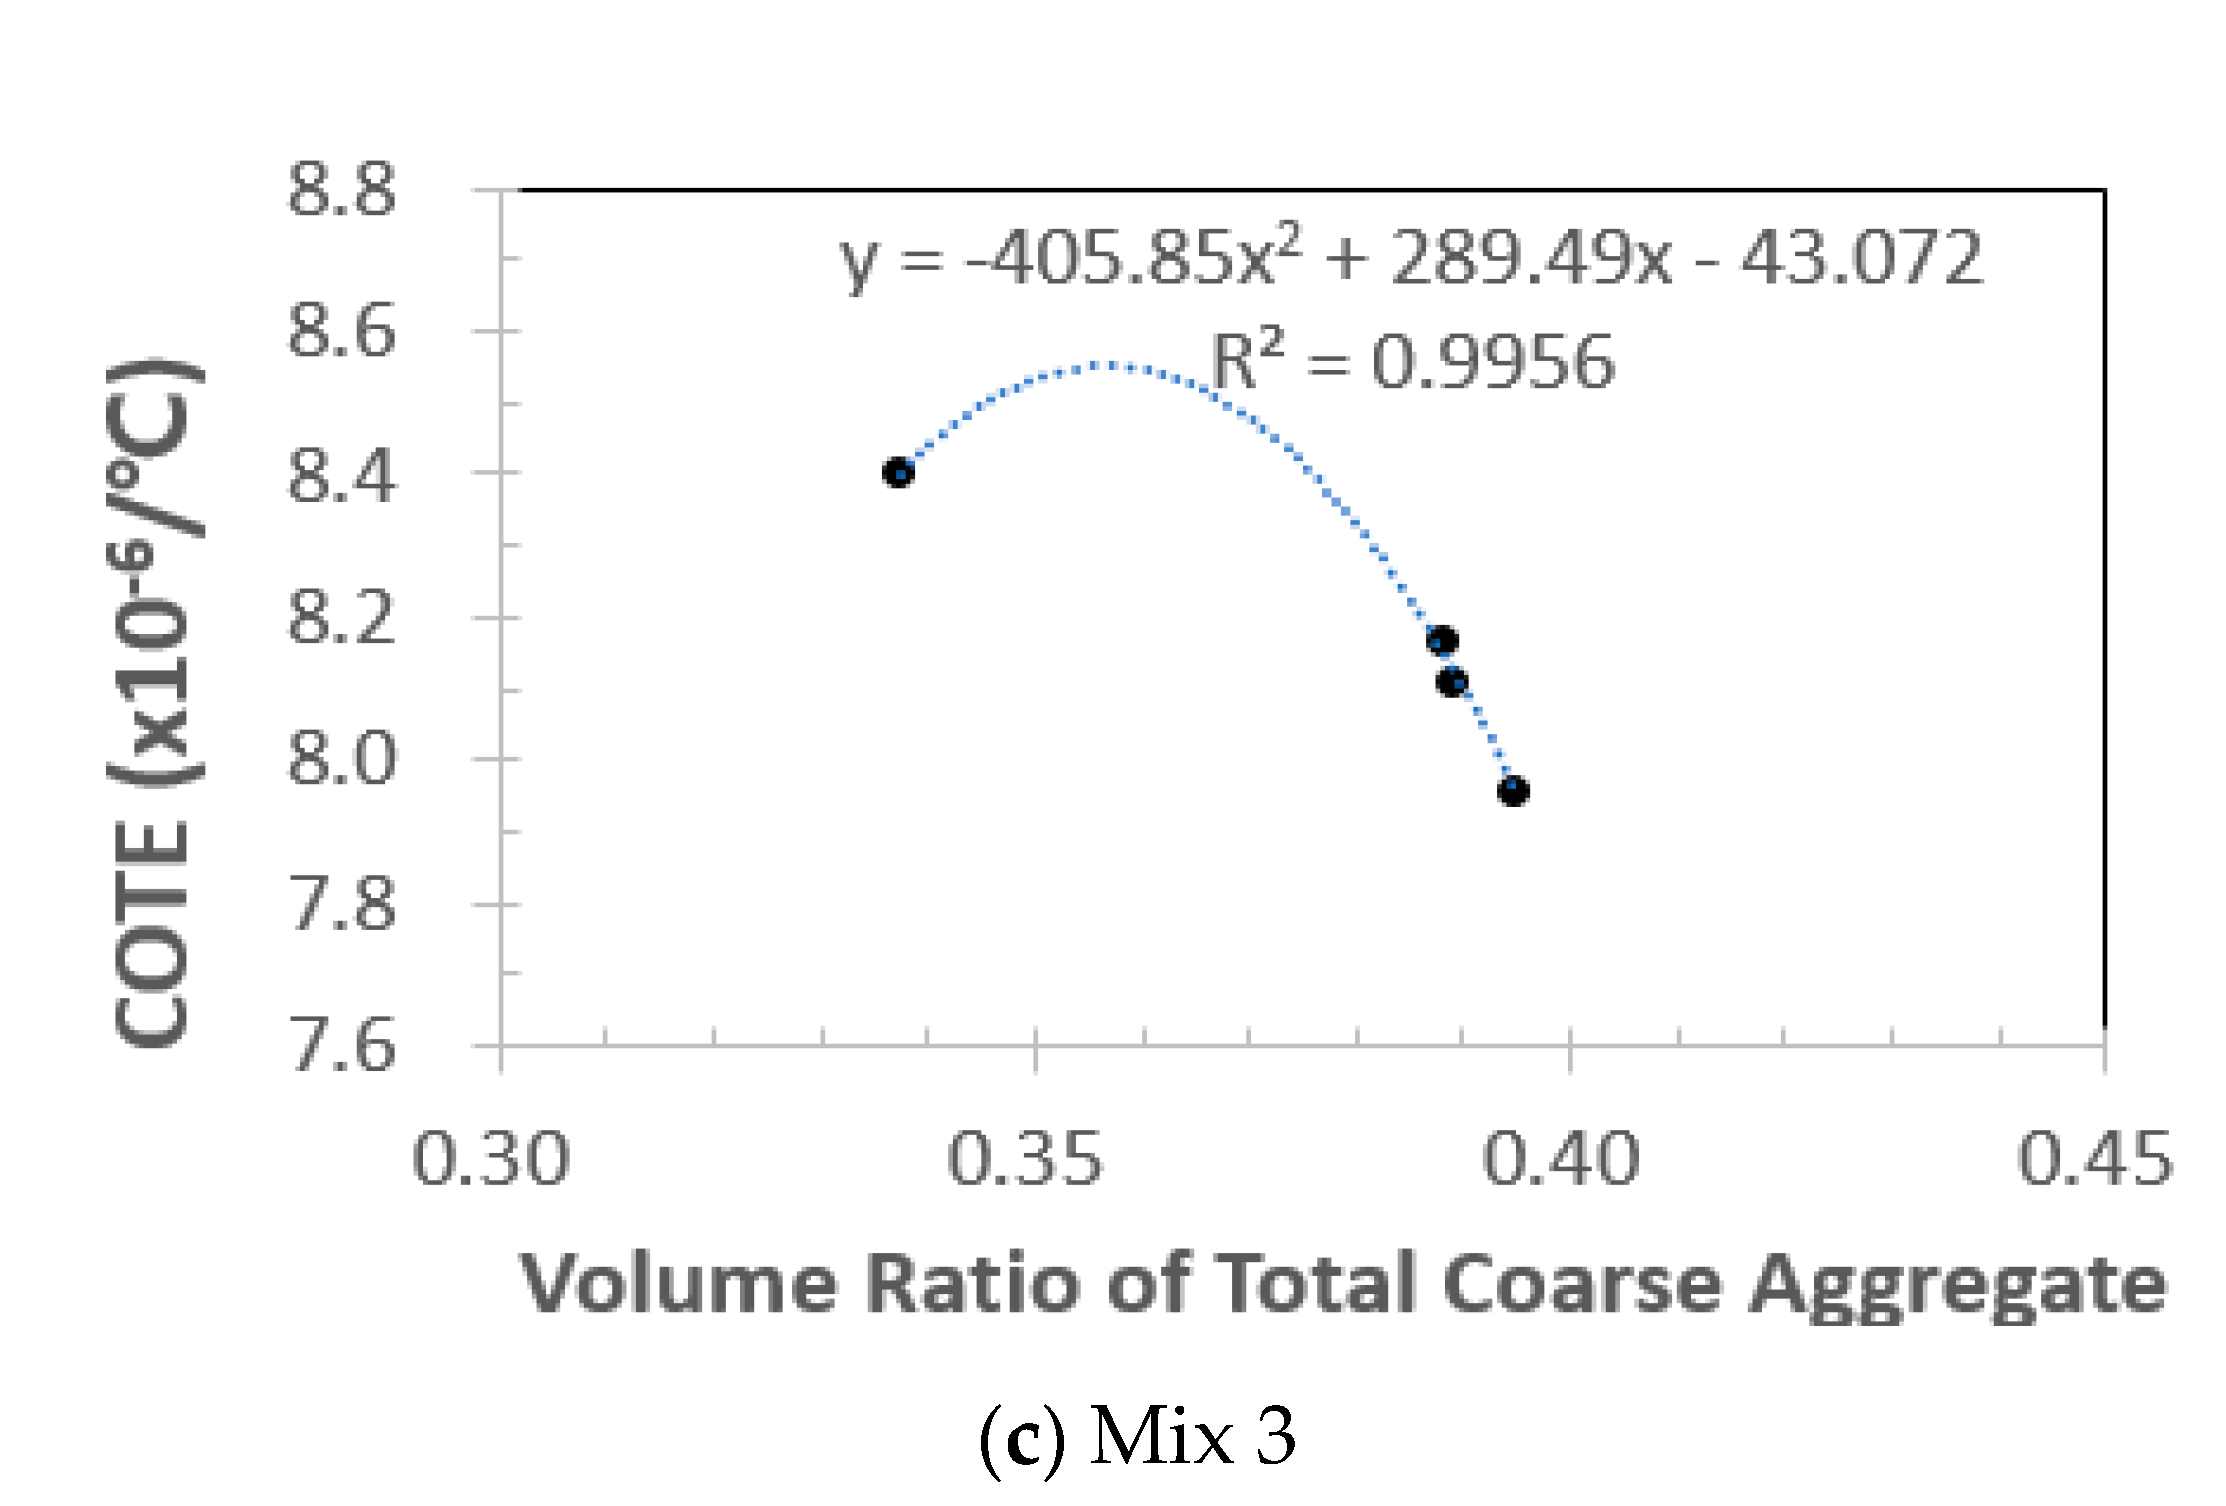
The COTE of RCA concrete is represented in terms of the volumetric ratio of coarse aggregate of the individual mixes by the best fit quadratic curves. However, further study is needed to verify if the COTE value of concrete is linear or nonlinear to the volume ratio of total coarse aggregate.
(4)
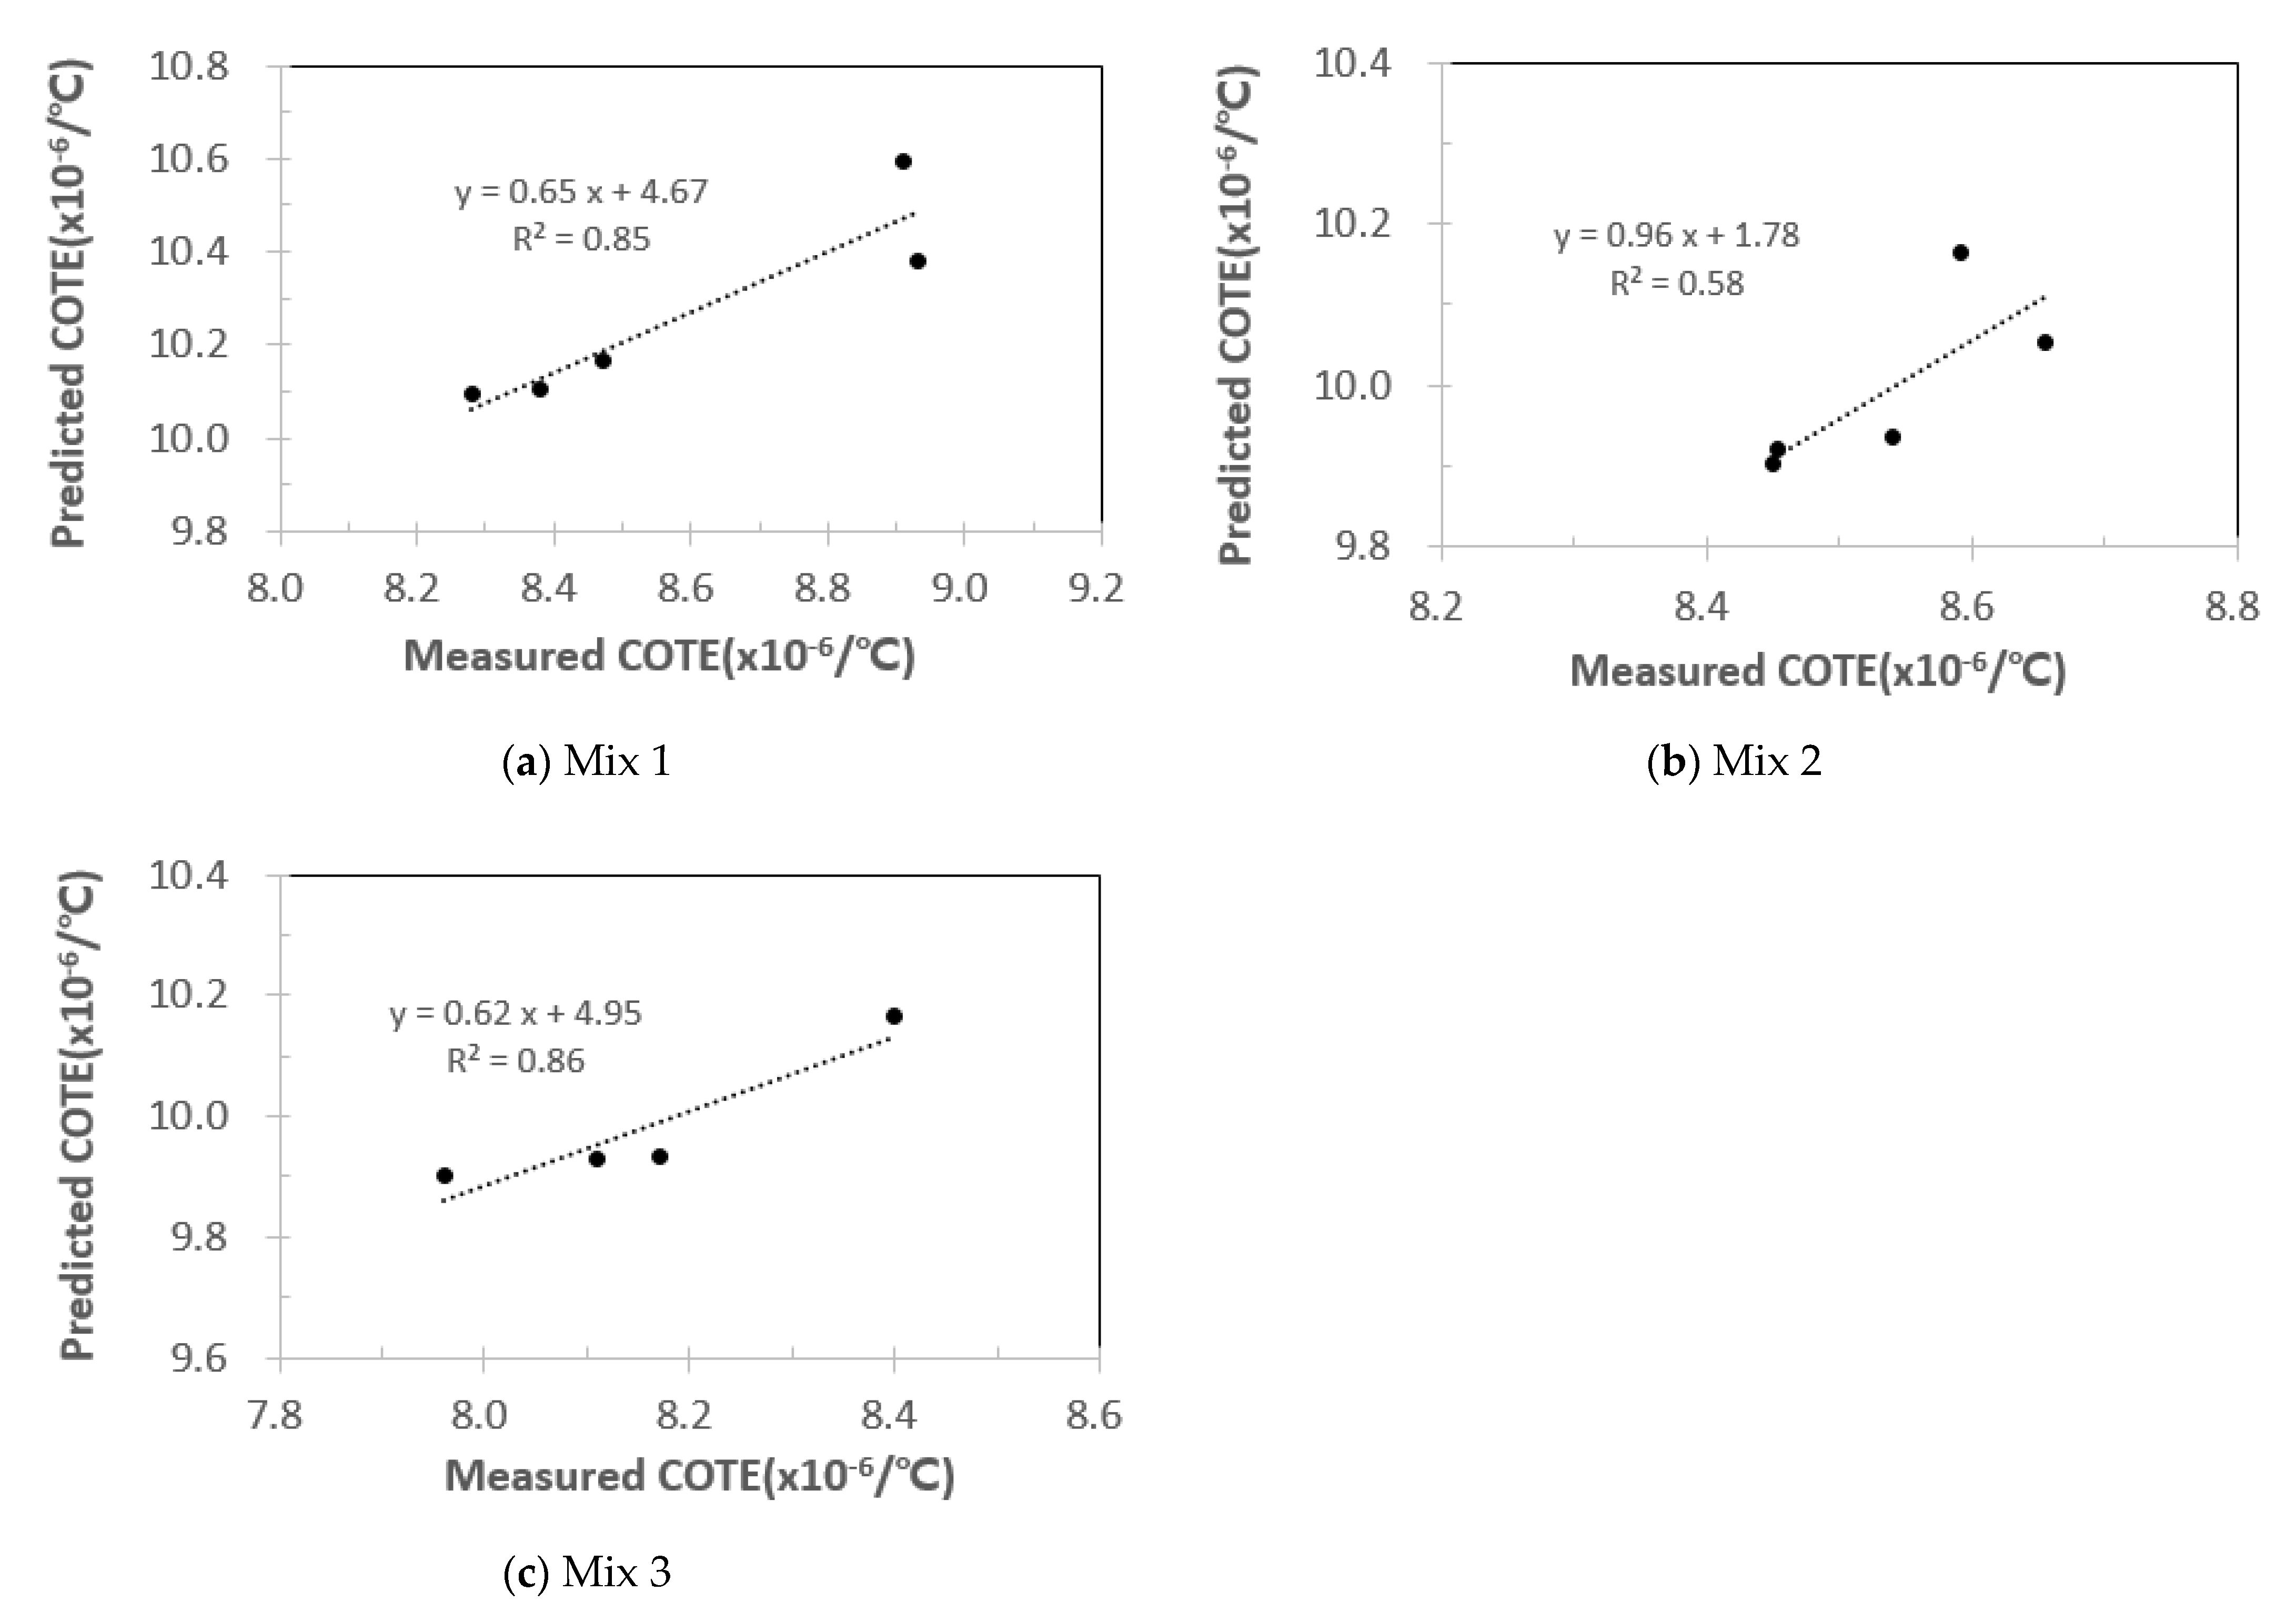
Finally, the predicted COTE obtained by applying the composite series model was slightly higher than the measured COTE, but the determination coefficient was higher than usual, indicating that experimental results obtained in this study are reliable.

Author Contributions

S.Y. conceived, designed the experiments, and wrote the paper; H.L. performed the experiments; S.Y. and H.L. analyzed the data. Both authors have read and agreed to the published version of the manuscript.

Funding

This study was conducted under research Project (21POQW-B152690-03) funded by the Ministry of Land, Infrastructure and Transport (MOLIT) and the Korea Agency for Infrastructure Technology Advancement (KAIA). The authors would like to thank the members of research team, MOLIT and KAIA for their guidance and supports throughout the project.

Institutional Review Board Statement

Not applicable.

Informed Consent Statement

Not applicable.

Data Availability Statement

Data sharing not applicable.

Conflicts of Interest

The authors declare no conflict of interest.

References

  1. Kim, J.; Yang, S.; Kim, N. Influencing factor on thermal coefficient of concrete due to aggregate types. Spring Conf. Korea Concr. Inst. 2003, 15, 249–254. [Google Scholar]
  2. Park, J. Mechanical Strength and Durability Tests on Concrete Mixes Using Recycled Aggregates. Master’s Thesis, Hongik University, Sejong, Korea, 2013. [Google Scholar]
  3. McCullough, B.; Dossey, T. Consideration for high-performance of concrete paving: Recommendations from 20 years of field experience in Texas. Transp. Res. Rec. 1999, 1684, 17–24. [Google Scholar] [CrossRef]
  4. Du, L.; Lukefah, E. Coefficient of Thermal Expansion of Concrete with Different Coarse Aggregates. Presented at the Annual Symposium of the International Center for Aggregate Research, Austin, TX, USA, 12 April 2007. [Google Scholar]
  5. Lee, J.; Son, D.; Ryu, S.; Park, Y. A Study on Preventing Methods of Blow-up for Improving Safety on Expressway; KHC-2020-39-534.9607; Korea Highway Corporation: Gimcheon, Korea, 2020. [Google Scholar]
  6. Chhay, L.; Kim, Y.; Lee, S. Evaluation of trigger temperature for concrete pavement growth based on joint movement data. Constr. Build. Mater. 2021, 278, 121790. [Google Scholar] [CrossRef]
  7. Arulrajah, A.; Ghorbani, B.; Narsilio, G.; Horpibulsuk, S.; Leong, M. Thermal performance of geothermal pavements constructed with demolition wastes. Geomech. Energy Environ. 2021, 28, 100253. [Google Scholar] [CrossRef]
  8. Li, J.; Zhang, J.; Ni, S.; Liu, L.; Walubita, L. Mechanical performance and environmental impacts of self-compacting concrete with recycled demolished concrete blocks. J. Clean. Prod. 2021, 293, 126129. [Google Scholar] [CrossRef]
  9. Hraboa, K.; Lehner, P.; Ghosh, P.; Konecny, P.; Teply, B. Sustainability levels in comparison with mechanical properties and durability of pumice high-performance concrete. Appl. Sci. 2021, 11, 4964. [Google Scholar] [CrossRef]
  10. Mindess, S.; Young, J.; Darwin, D. Concrete, 2nd ed.; Prentice Hall: Hoboken, NJ, USA, 2003. [Google Scholar]
  11. Nerville, A. Properties of Concrete, 4th ed.; John Wiley &Sons, Inc.: Hoboken, NJ, USA, 1996. [Google Scholar]
  12. Byfors, J. Plain Concrete at Early Ages; Swedish Cement and Concrete Research: Göteborg, Sweden, 1980. [Google Scholar]
  13. Kim, J.; Jook, D.; Choi, J.; Kim, G. State-of-arts of primary concrete degradation behaviors due to high temperature and radiation in spent fuel dry storage. J. Nucl. Fuel Cycle Waste Tech. 2018, 16, 243–260. [Google Scholar] [CrossRef]
  14. Alexanderson, J. Strength Losses in Heat Cured Concrete; Swedish Cement and Concrete Research Institute: Stockholm, Sweden, 1972; p. 135. [Google Scholar]
  15. Weigler, H.; Karl, S. Junger Beton: Beanspruchung, Festigkeit, Verformung. Betonwerk Fertigkeit Technik. 1974, 40, 392. [Google Scholar]
  16. Khayat, K. Deterioration of lightweight fly ash concrete due to gradual cryogenic frost cycles. ACI Mater. J. 1991, 77, 233–239. [Google Scholar]
  17. Zolnders, N. Thermal Properties of Concrete under Sustain Elevated Temperature; SP-25; American Concrete Institute: Detroit, Michigan, 1971; pp. 1–31. [Google Scholar]
  18. AASHTO TP 60-00. Standard Test Method for the Concrete Atmospheric Pressure. In State-of-the-ART, Manual of Concrete Practice; ACI: Washington, DC, USA, 2000. [Google Scholar]
  19. Helmuth, R.A. Dimensional changes of hardened Portland cement pastes caused by temperature changes. In Proceedings of the Fortieth Annual Meeting of the Highway Research Board, Washington, DC, USA, 9–13 January 1961; Volume 40, pp. 315–366. [Google Scholar]
  20. Won, M. Improvements of testing procedures for concrete coefficient of thermal expansion. Transp. Res. Rec. 2005, 1919, 23–28. [Google Scholar] [CrossRef]
  21. Hobbs, D. The dependence of the bulk modulus, Young’s modulus, creep, shrinkage and thermal expansion of concrete upon aggregate volume concentration. Mater. Const. 1971, 4, 107–114. [Google Scholar] [CrossRef]
  22. FHWA. Coefficient of Thermal Expansion in Concrete Pavement Design; ACPT Tech Brief-FHWA-HIE-09-105; U.S. Department of Transportation; Federal Highway Administration: Washington, DC, USA, 2011. [Google Scholar]
  23. Bamforth, P.; Chisholm, D.; Gibbs, J.; Harrison, T. Properties of concrete for Use in Eurocode 2; The Concrete Center: London, UK, 2008. [Google Scholar]
  24. Zhou, C.; Feng, D.; Wu, X.; Cao, P.; Fan, X. Prediction of concrete coefficient of thermal expansion by effective self-consistent method considering coarse aggregate shape. J. Mater. Civ. Eng. 2018, 30, 04018312. [Google Scholar] [CrossRef]
  25. Yang, S.; Lee, H.; Kim, N. Measurement for coefficient of thermal expansion of concretes made with recycled concrete aggregates. Int. J. Highw. Eng. 2015, 17, 7–16. [Google Scholar] [CrossRef]
  26. Hansen, T. Recycled aggregates and recycled aggregate concrete second state-of-the-art report developments 1945–1985. Mater. Struct. 1986, 19, 201–246. [Google Scholar] [CrossRef]
  27. Recycling Concrete Pavement, Concrete Paving Technology; EB-043P; American Concrete Pavement Association: Washington, DC, USA, 2009.
  28. NCHRPP Synthesis 435. Reclaimed Asphalt Pavement, Recycled Concrete Aggregate and Construction Demolition Waste. In Recycled Materials and Byproducts in Highway Applications; Transportation Research Board: Washington, DC, USA, 2013; Volume 6. [Google Scholar]
  29. Cuttel, D.; Snyder, M.; Vandenbossche, J.; Wade, M. Performance of Rigid Pavements Containing Recycled Concrete Aggregates, Transportation Research Record 1574; Transportation Research Board: Washington, DC, USA, 1997. [Google Scholar]
  30. Gress, D.; Snyder, M.; Sturtevant, J. Performance of rigid pavements containing recycled concrete aggregates-2006 update. In Proceedings of the Transportation Research Board 86th Annual Meeting, Washington, DC, USA, 21–25 January 2007; pp. 1–28. [Google Scholar]
  31. Sadati, S.; Khayat, K. Field performance of concrete pavement incorporating recycled concrete aggregate. Constr. Build. Mater. 2016, 126, 691–700. [Google Scholar] [CrossRef]
  32. Won, M. Performance of Continuously Reinforced Concrete Pavement Containing Recycled Concrete Aggregate; FHWA/TX-01-1753-1 Report; Texas Department of Transportation: Austin, TX, USA, 2001. [Google Scholar]
  33. Choi, S.; Moon, W. Performance of continuously reinforced concrete pavement containing recycled concrete aggregate. In Proceedings of the GeoHunan International Conference, Changsha, China, 9–11 June 2011; pp. 165–172. [Google Scholar]
  34. Khayat, K.; Sadati, S. High-Volume Recycled Materials for Sustainable Pavement Construction; RECAST UTC #00046727 Report; U.S. Department of Transportation: Washington, DC, USA, 2020; Volume I. [Google Scholar]
  35. Bekoe, P.A.; Tia, M.; Bergin, M.J. Concrete containing recycled concrete aggregate for use in concrete pavement. Transp. Res. Rec. 2010, 2164, 113–121. [Google Scholar] [CrossRef]
  36. Smith, J. Recycled Concrete Aggregate—A Viable Aggregate Source for Concrete Pavements. Ph.D. Thesis, University of Waterloo, Waterloo, ON, Canada, 2009. [Google Scholar]
  37. Smith, J.T.; Tighe, S.L. Recycled concrete aggregate coefficient of thermal expansion: Characterization, variability, and impacts on pavement performance. Transp. Res. Rec. 2009, 2113, 53–61. [Google Scholar] [CrossRef]
  38. Pickel, D. Recycled Concrete Aggregate: Influence of Aggregate Pre-Saturation and Curing Conditions on the Hardened Properties of Concrete. Master’s Thesis, University of Waterloo, Waterloo, ON, Canada, 2014. [Google Scholar]
  39. Wen, H.; McLean, D.; Boyle, S.; Spry, T.; Mjelde, D. Evaluation of Recycled Concrete as Aggregate in New Concrete Pavement; WA-RD 826.1 Report; Washington State Department of Transportation: Spokane, WA, USA, 2014. [Google Scholar]
  40. KRS TR 0008-15(RR), Pre-Stressed Concrete sleeper. Korean Railway Standards. 2006. Available online: www.kric.go.kr (accessed on 31 August 2021).
  41. Juan, M.; Gutierrez, P. Study on the influence of attached mortar content on the properties of recycled concrete aggregate. Constr. Build. Mater. 2009, 23, 872–877. [Google Scholar] [CrossRef]
  42. Yang, S.; Lim, Y. Mechanical strength and drying shrinkage properties of RCA concretes produced from old railway concrete sleepers using by a modified EMV method. Constr. Build. Mater. 2018, 185, 499–507. [Google Scholar] [CrossRef]
  43. Yang, S.; Lee, H. Drying shrinkage and rapid chloride penetration resistance of recycled aggregate concretes using cement paste dissociation agent. Materials 2021, 14, 1–18. [Google Scholar]
  44. ASTM C192, Standard Practice for Making and Curing Concrete Test Specimens in the Laboratory; ASTM International: West Conshohocken, PA, USA, 2012.
  45. Lee, H. An Experimental Study on the Thermal Expansion Coefficient and Rapid Chloride Penetration Resistance of Recycled Aggregate Concrete. Master’s Thesis, Hongik University, Sejong, Korea, 2021. [Google Scholar]
  46. Hirsh, T. Modulus of elasticity of concrete affected by elastic moduli of cement paste matrix and aggregate. J. Am. Concr. Inst. 1962, 59, 427–451. [Google Scholar]
Figure 1. RCA sources.
Applsci 11 08214 g001
Figure 2. Experimental apparatus for measuring COTE and system setup [45].
Applsci 11 08214 g002
Figure 3. Typical temperature cycle applied to concrete specimens [45].
Applsci 11 08214 g003
Figure 4. Cylindrical specimens prepared for TMA.
Applsci 11 08214 g004
Figure 5. COTE and relative values in test series 1.
Applsci 11 08214 g005
Figure 6. COTE and relative values in test series 2.
Applsci 11 08214 g006
Figure 7. COTE and relative values in test series 3.
Applsci 11 08214 g007
Figure 8. Average relative COTE values from mix series 2 and 3.
Applsci 11 08214 g008
Figure 9. COTE values in terms of total coarse aggregate volume ratio.
Applsci 11 08214 g009aApplsci 11 08214 g009b
Figure 10. Predicted COTE values versus measured COTE values in various mixes.
Applsci 11 08214 g010
Table 1. Basic RCA properties.
Test ItemsRR aRP bRA cNCA1NCA2Fine Agg1Fine Agg2
Specific gravity2.482.602.522.652.712.562.60
Absorption ration (%)4.532.623.820.700.371.100.95
RMC (%)39.920.025.0---
Note: a. The first letter ‘R’ refers to RCA, and the second letter ‘R’ means its production from railway sleepers. b. The first letter ‘R’ refers to RCA, and the second letter ‘P’ means its production from PC culvert. c. The first letter ‘R’ refers to RCA, and the second letter ‘A’ means general aggregate produced from a plant.
Table 2. Concrete mixture designs and material quantities.
Test SeriesMixW/CS/aRCA wt %Mix Proportions (kg/m3)
WCSF/ANCARCAAdmixture
1CNR0.3945.30187480739-89404.80
CRR680.3946.568187480739-2755754.80
CRR330.3945.933187480739-5842874.80
ERR680.3931.968145373574-3978304.99
ERR68-20.4038.968172428658-3357004.79
2CNP0.3639.1015839667544.0105102.56
CRP250.3640.42515839669444.07672562.49
CRP500.3641.75015839671244.04994982.49
ERP250.3637.02515238064842.38302762.60
ERP500.3634.65014536361940.35845832.61
3CNP0.3639.1015839667544105102.56
CRP500.3641.750158396712444994982.49
ERP500.3634.65014536361940.35845832.61
ERA500.3634.65014536361940.35845832.61
Table 3. Basic COTE values measured from the TMA.
SpecimensNotationsCOTE (×10−6/°C)
123AverageCoefficient of Variation (%)
SUS-304 α r e f 15.79015.77815.85815.810.002
Cement paste α p 19.72621.25818.65819.881.71
Mortar 1 α m 11.33212.164-11.750.35
Mortar 2 α m 12.08412.430-12.260.06
NCA α a 7.0797.226-7.150.01
RP α R P 8.7059.825-9.260.63
Table 4. Elastic modulus of mortar.
Specimens Notation Elastic Modulus, GPa
1 2 3 Avg. Coefficient of Variation (%)
Mortar 1 E m 25.3 26.2 26.6 26.0 0.44
Mortar 2 E m 25.1 26.0 25.4 25.5 0.21
Publisher’s Note: MDPI stays neutral with regard to jurisdictional claims in published maps and institutional affiliations.

