Article

A Real-Time BLE/PDR Integrated System by Using an Improved Robust Filter for Indoor Position

1
Key Laboratory of Land Environment and Disaster Monitoring, MNR, China University of Mining and Technology, Xuzhou 221116, China
2
School of Environmental Science and Spatial Informatics, China University of Mining and Technology, Xuzhou 221116, China
*
Author to whom correspondence should be addressed.
Appl. Sci. 2021, 11(17), 8170; https://doi.org/10.3390/app11178170
Submission received: 18 June 2021 / Revised: 30 August 2021 / Accepted: 31 August 2021 / Published: 3 September 2021
(This article belongs to the Special Issue Advancing Complexity Research in Earth Sciences and Geography)

Abstract

:
Indoor position technologies have attracted the attention of many researchers. To provide a real-time indoor position system with high precision and stability is necessary under many circumstances. In a real-time position scenario, gross errors of the Bluetooth low energy (BLE) fingerprint method are more easily occurring and the heading angle of the pedestrian will drift without acceleration and magnetic field compensation. A real-time BLE/pedestrian dead-reckoning (PDR) integrated system by using an improved robust filter has been proposed. In the PDR method, the improved Mahony complementary filter based on the pedestrian motion states is adopted to estimate the heading angle reducing the drift error. Then, an improved robust filter is utilized to detect and restrain the gross error of the BLE fingerprint method. The robust filter detected the gross error at different granularity by constructing a robust vector changing the observation covariance matrix of the extended Kalman filter (EKF) adaptively when the application is running. Several experiments are conducted in the true position scenario. The mean position accuracy obtained by the proposed method in the experiment is 0.844 m and RMSE is 0.74 m. Compared with the classic EKF, these two values are increased by 38% and 18%, respectively. The results show that the improved filter can avoid the gross error in the BLE method and provide high precision and scalability in indoor position service.

1. Introduction

With the rapid development of technology and people’s increasing demands for a better life, various applications based on location-based service (LBS) provide a great convenience for people’s life. Position information is the key element for LBS to provide services. Global Navigation Satellite System (GNSS) can provide high accuracy position outdoors. However, the accuracy deteriorates significantly because GNSS signals are unreliable or blocked in indoor environments. To provide a reliable, stable position service in indoor environments, many types of indoor positioning technologies such as wireless fidelity (Wi-Fi) [1,2,3], Bluetooth low energy (BLE) beacons [4,5], radio frequency identification (RFID) [6,7], ultrasonic [8], infrared [9], ultra-wideband (UWB) [10,11], pseudolite [12,13], computer vision [14,15] had been proposed by experts and scholars.
Among them, the positioning techniques based on Wi-Fi are the most popular indoor positioning method due to the wide deployment of Wi-Fi routers in shopping malls, hospitals, airports, and stations. However, the process of Wi-Fi scanning is time-consuming and power-consuming. Many devices have optimized their systems to limit the scanning frequency. According to the latest google android development document [16], it is specified that the scanning frequency of Wi-Fi is limited no more than four times in two minutes after the Android Oreo system. It is difficult for the Wi-Fi-based positioning method to be applied to indoor position service applications with high real-time performance. Fortunately, Bluetooth-based techniques are another good choice to position due to the increased popularity of smartphones along with the development of the Internet of Things. Low cost, power-saving, and ease of deployment without affecting the infrastructures of buildings can avoid the shortcoming of Wi-Fi scanning [17]. Most importantly, the principle of the BLE positioning method is the same as that of Wi-Fi. Some of the current Wi-Fi positioning algorithms can be directly used for BLE positioning [18]. The fingerprint-based method of BLE is one of the popular approaches for the indoor position which can offer many advantages for the realizable position accuracy and is infrastructure-free. However, the radio signals of BLE can be affected by the multipath effect and device heterogeneity [19] which cause the signal to change during offline acquisition and online position, resulting in the error in the positioning process.
In short, all of these indoor position techniques mentioned above have both advantages and disadvantages. It is the focus of researchers to propose a fusion of indoor position methods to keep a balance among accuracy, coverage, cost, and complexity. Common fusion position methods include multimodal fingerprinting, triangulation-based fusion, and pedestrian dead reckoning (PDR)-based fusion [20]. The PDR-based fusion method which combines PDR with wireless localization methods is widely used in the literature. PDR is a self-positioning method that provides a relatively high accuracy position estimation based on the smartphone’s built-in sensors, but it suffers from the drift problem, resulting in huge cumulative error for long-time positioning [21]. By contrast, wireless positioning method such as BLE fingerprint position can obtain absolute position without cumulative error but has poor accuracy position estimation. Fusing PDR with wireless localization methods which are often known as Bayes filter, Kalman Filter (KF), Extended Kalman filter (EKF), or particle filter (PF) can make up for both methods’ shortcomings to provide high accuracy and stable position service. The PF has good performance in solving nonlinear problems but suffers from a high computational load. In our research, the fusion EKF algorithm was chosen to combine PDR with the BLE fingerprint position method in the real-time integrated system. To inhibit the outliers from the BLE fingerprint method, a robust filter based on EKF was proposed to compensate for the gross error in the real-time positioning procedure. Our contributions are as follows:
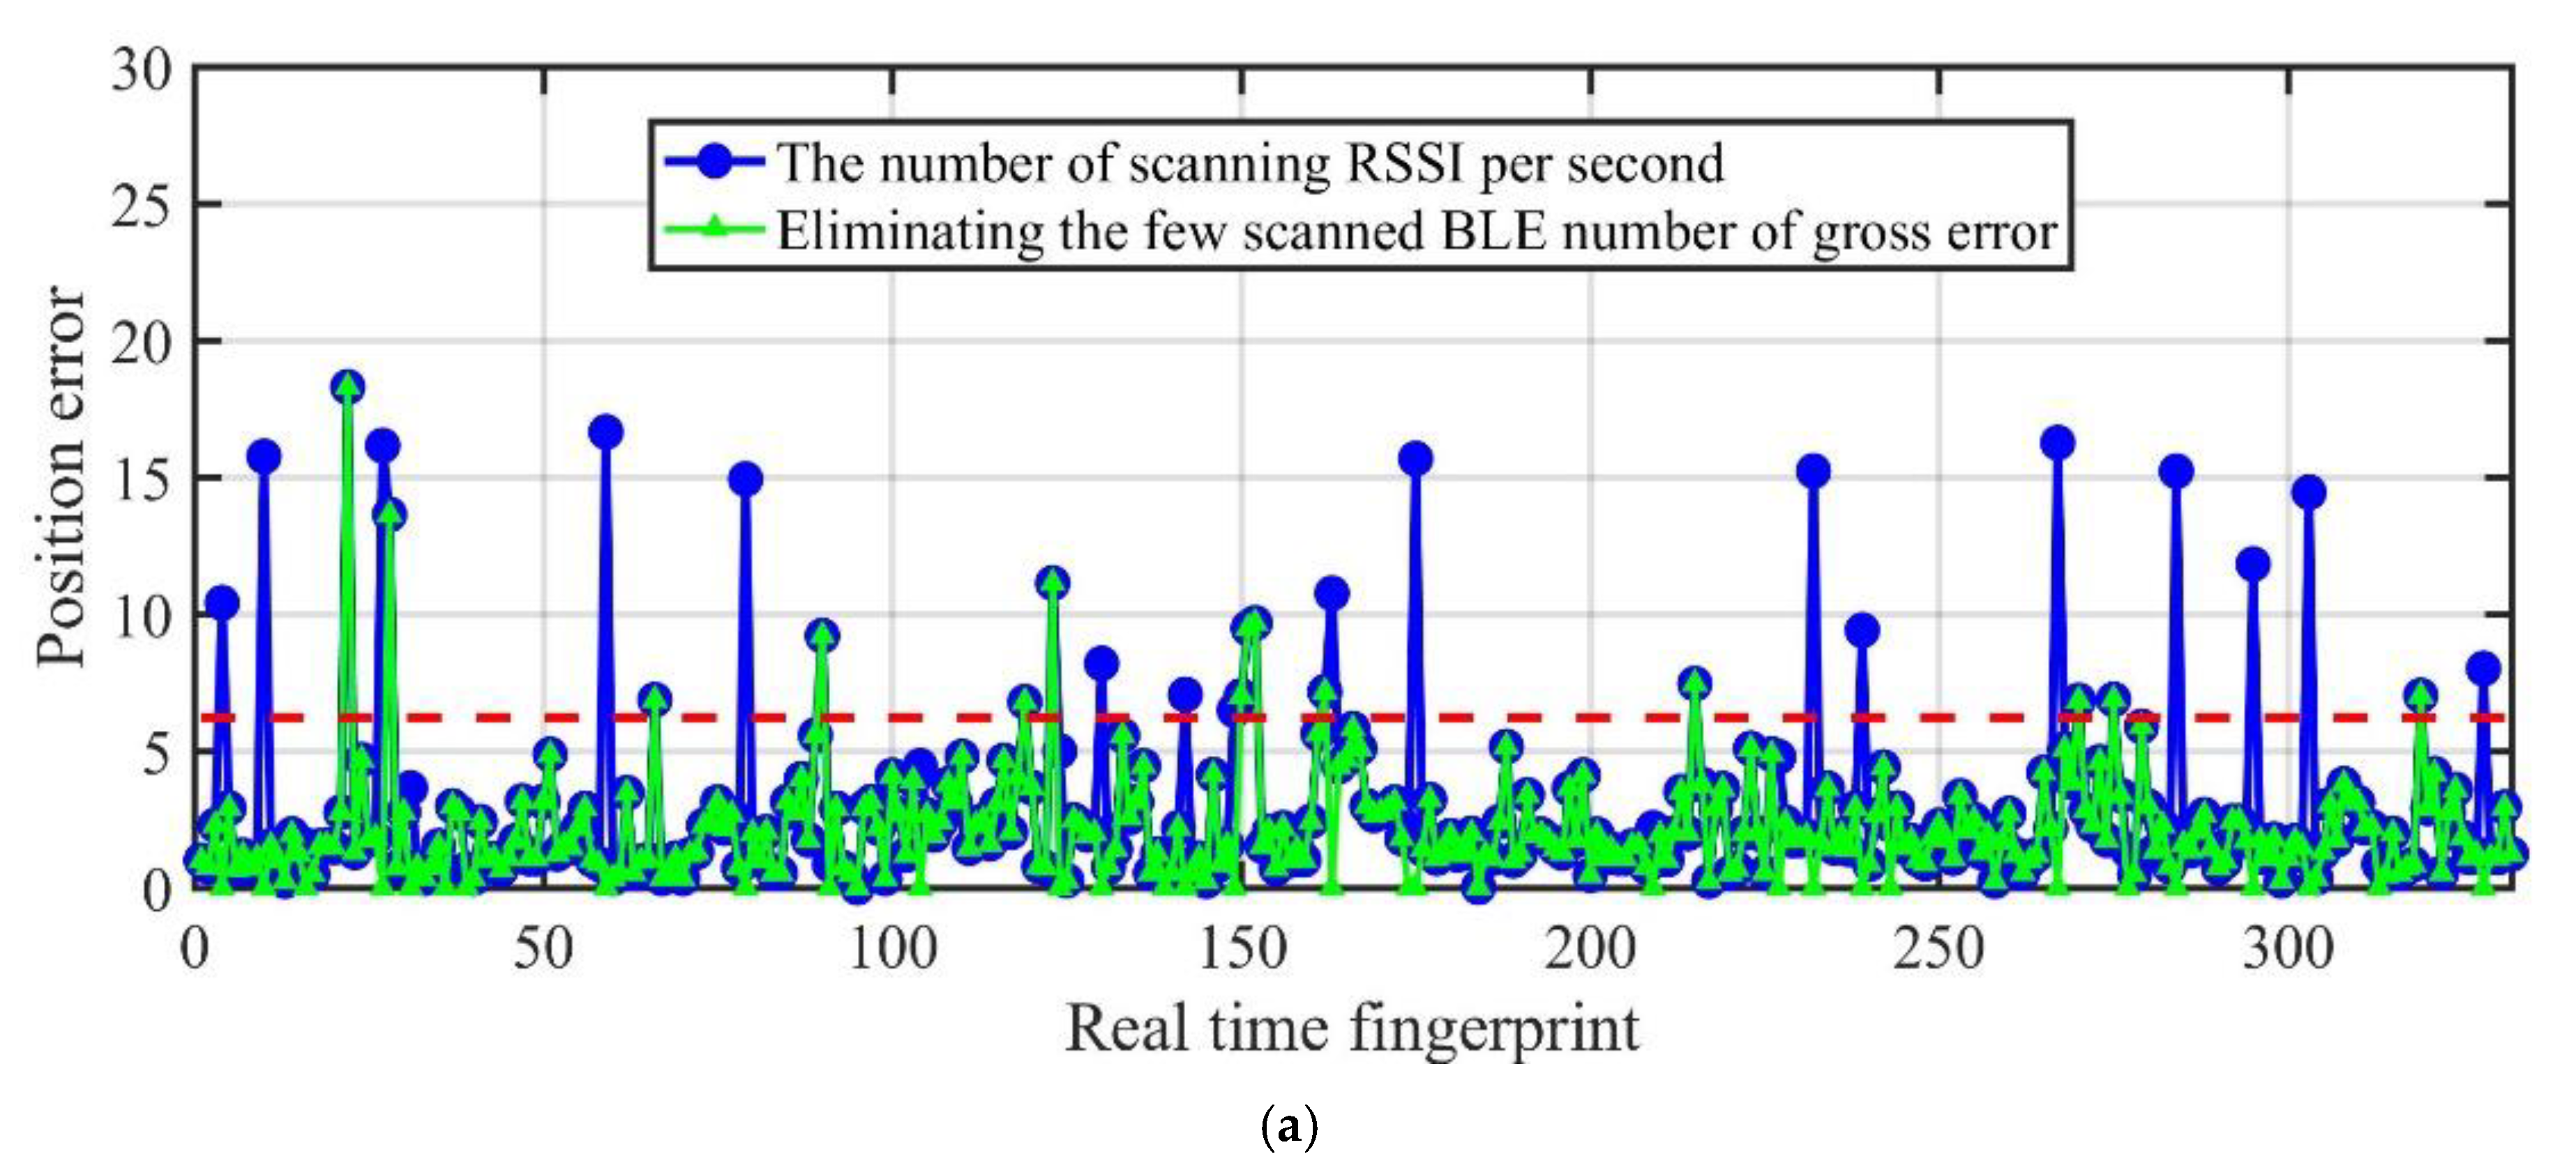
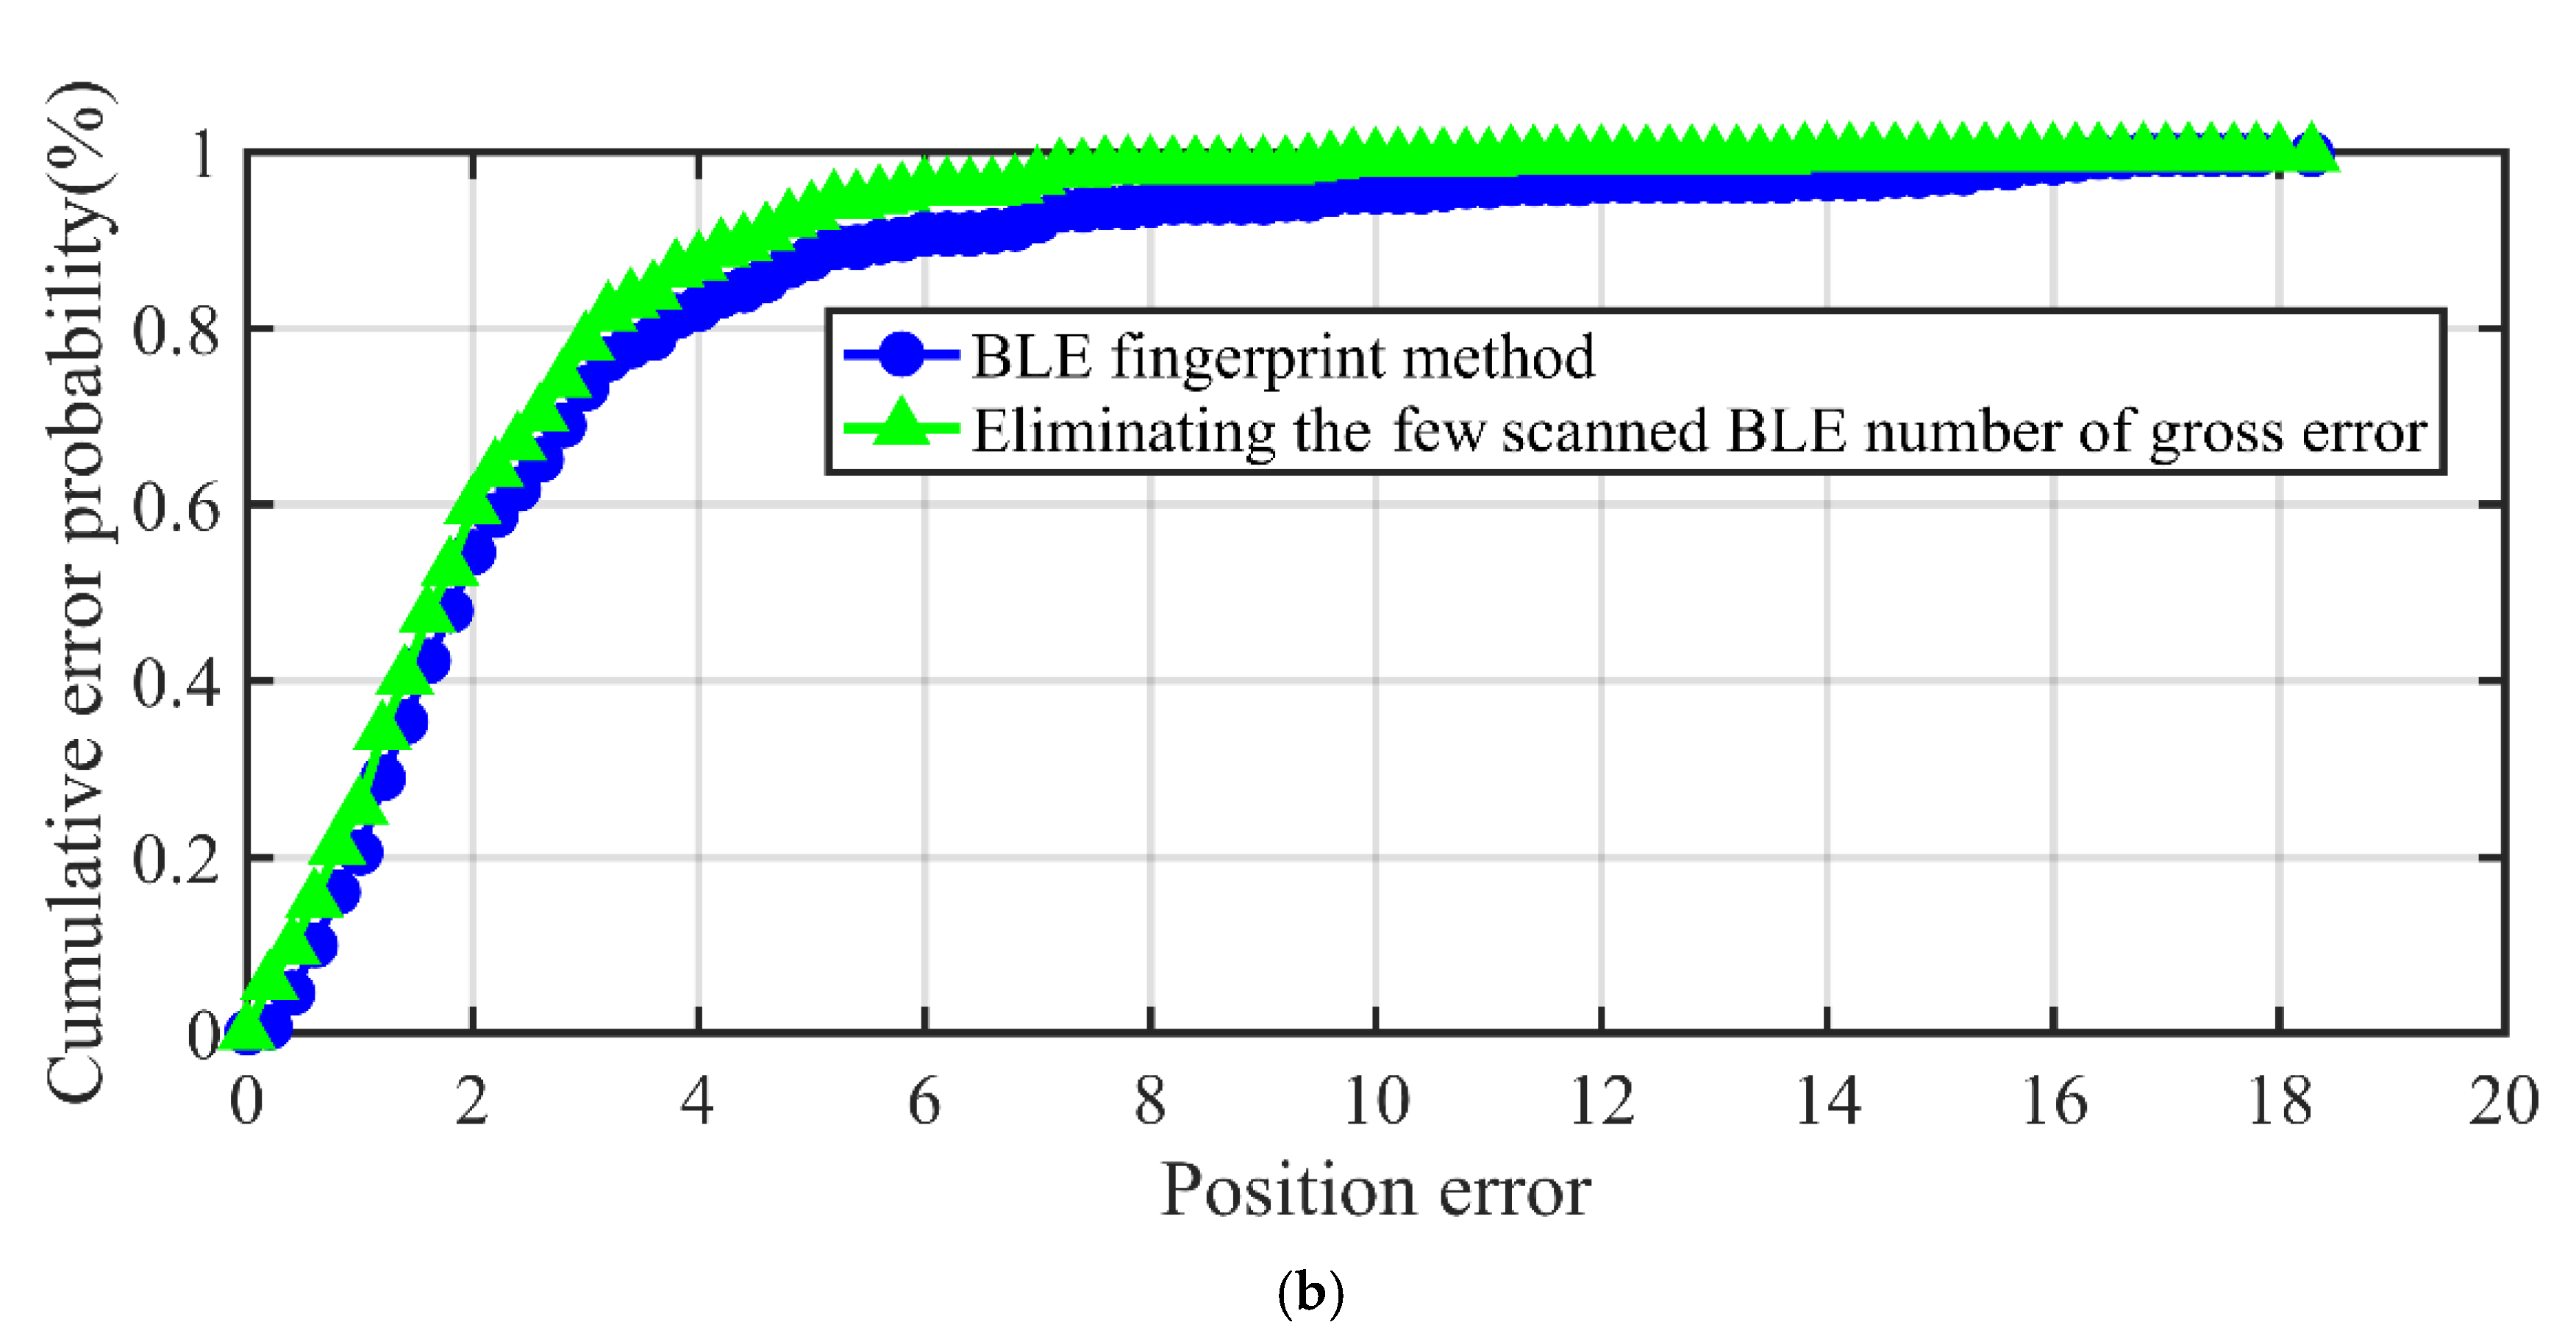
  • We found that the errors of the BLE fingerprint method are not only related to the signal fluctuation but are also affected by scanning numbers of BLE beacons after statistically analyzing the real-time signal data in a harsh environment. When the scanning BLE beacon numbers are few, coarse errors will more likely occur;
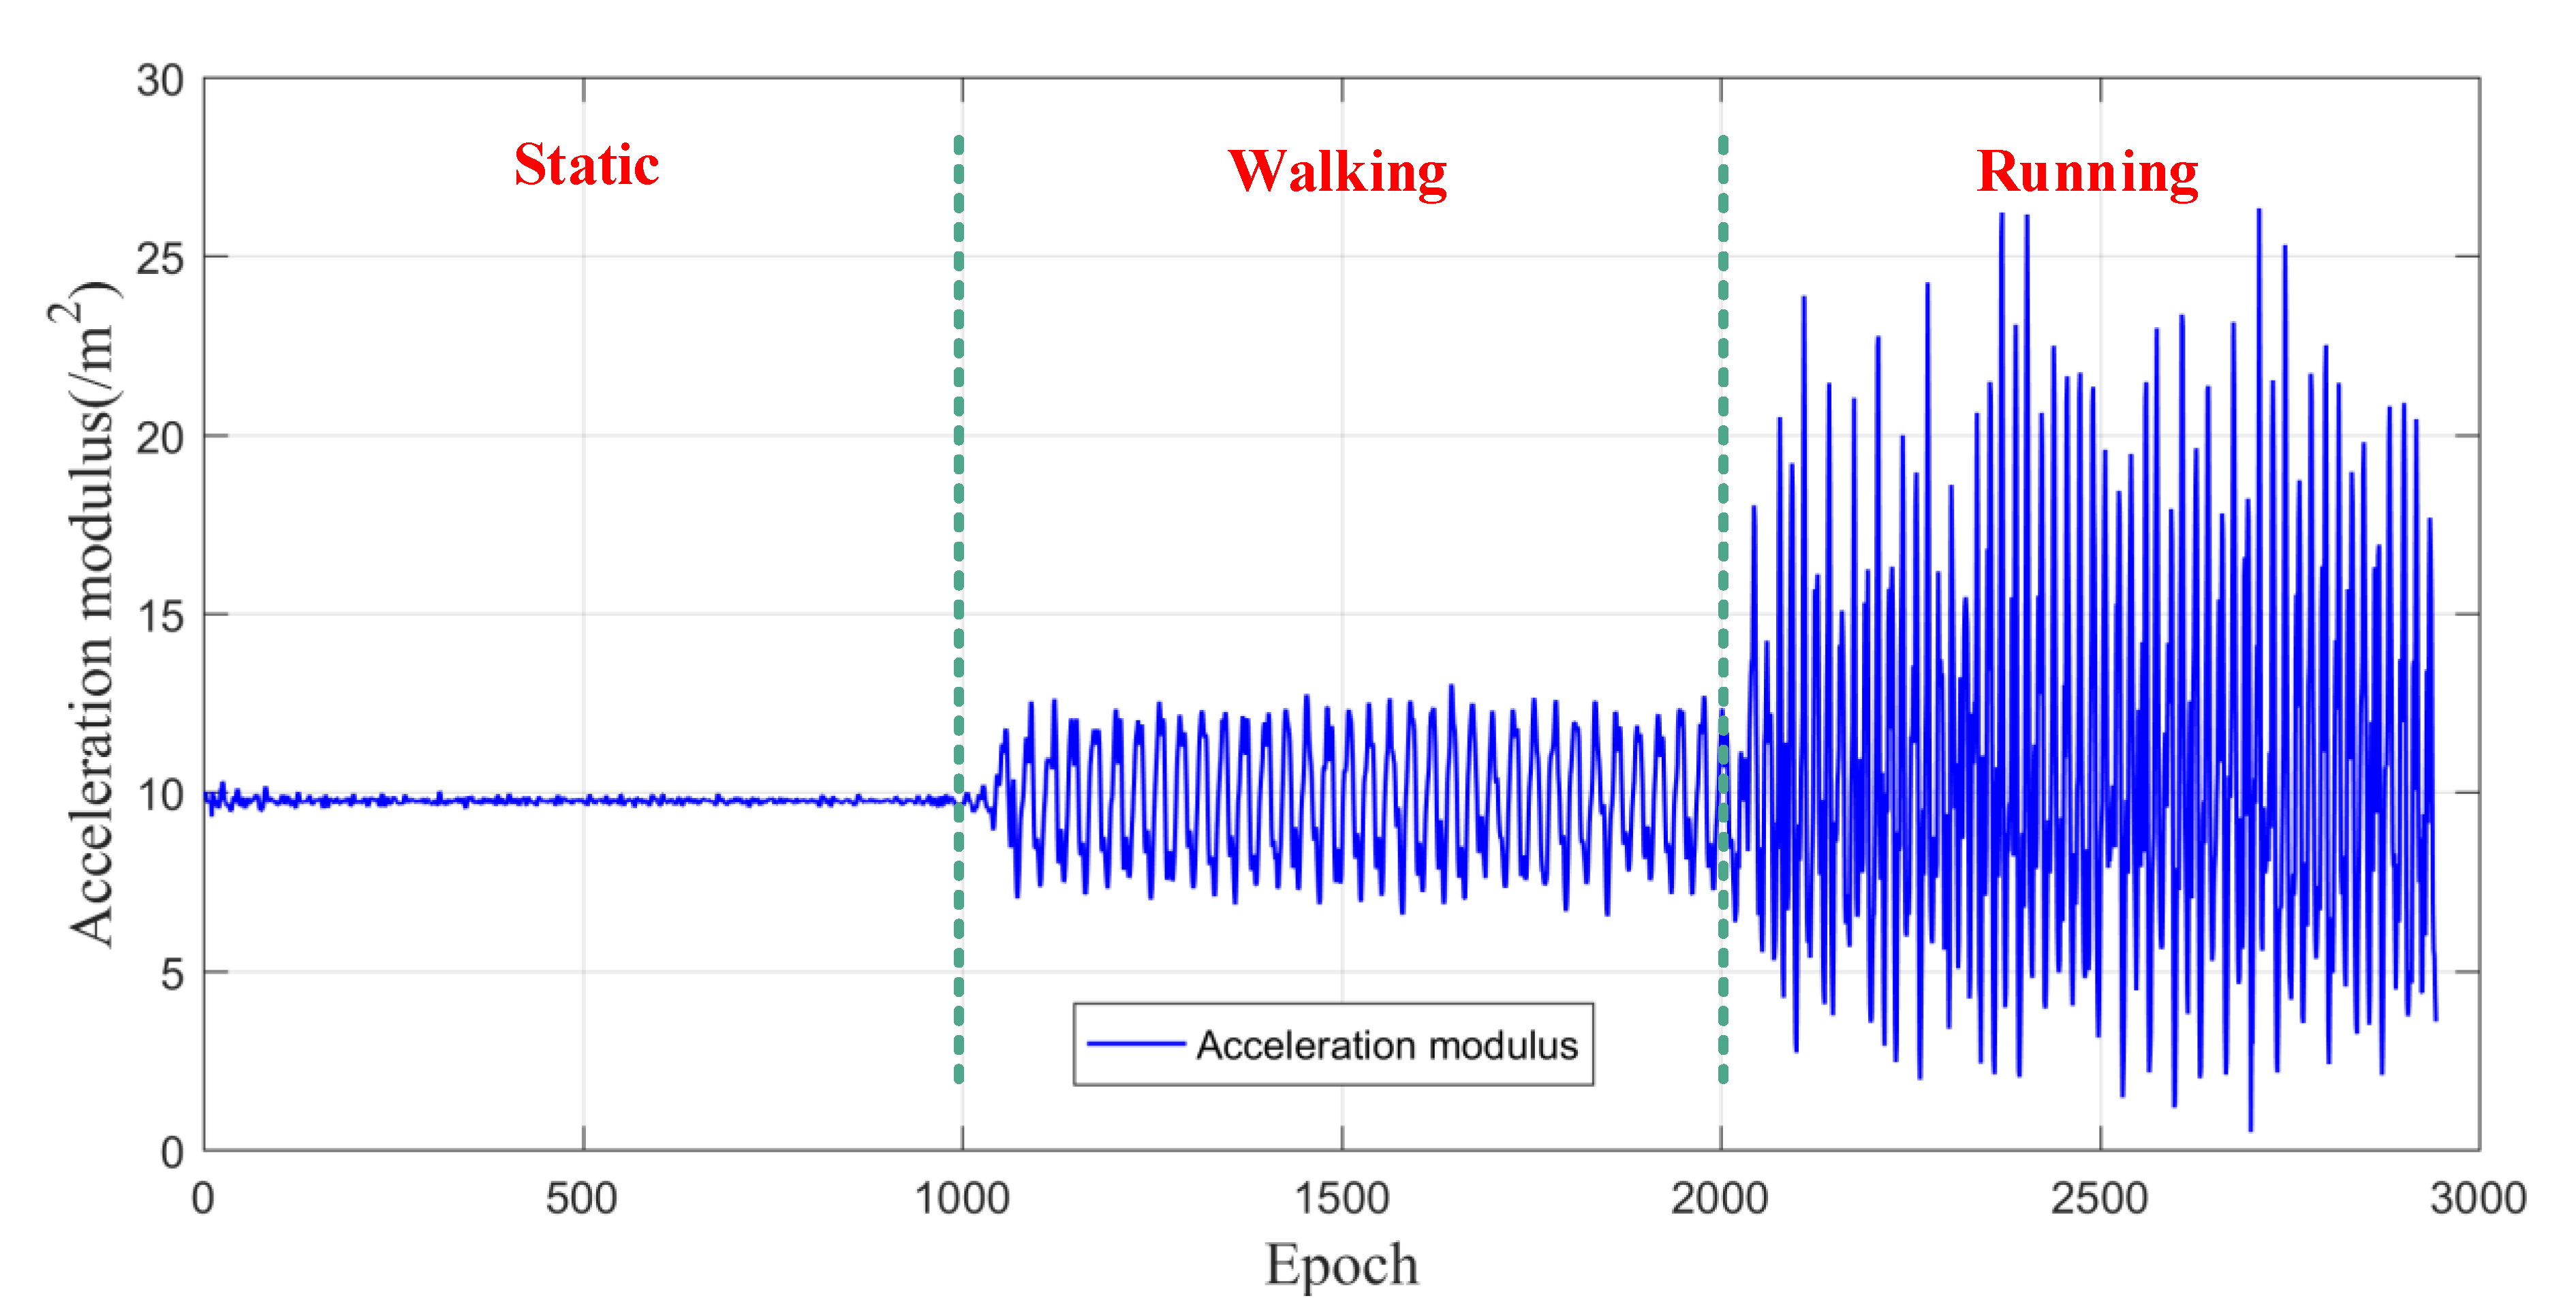
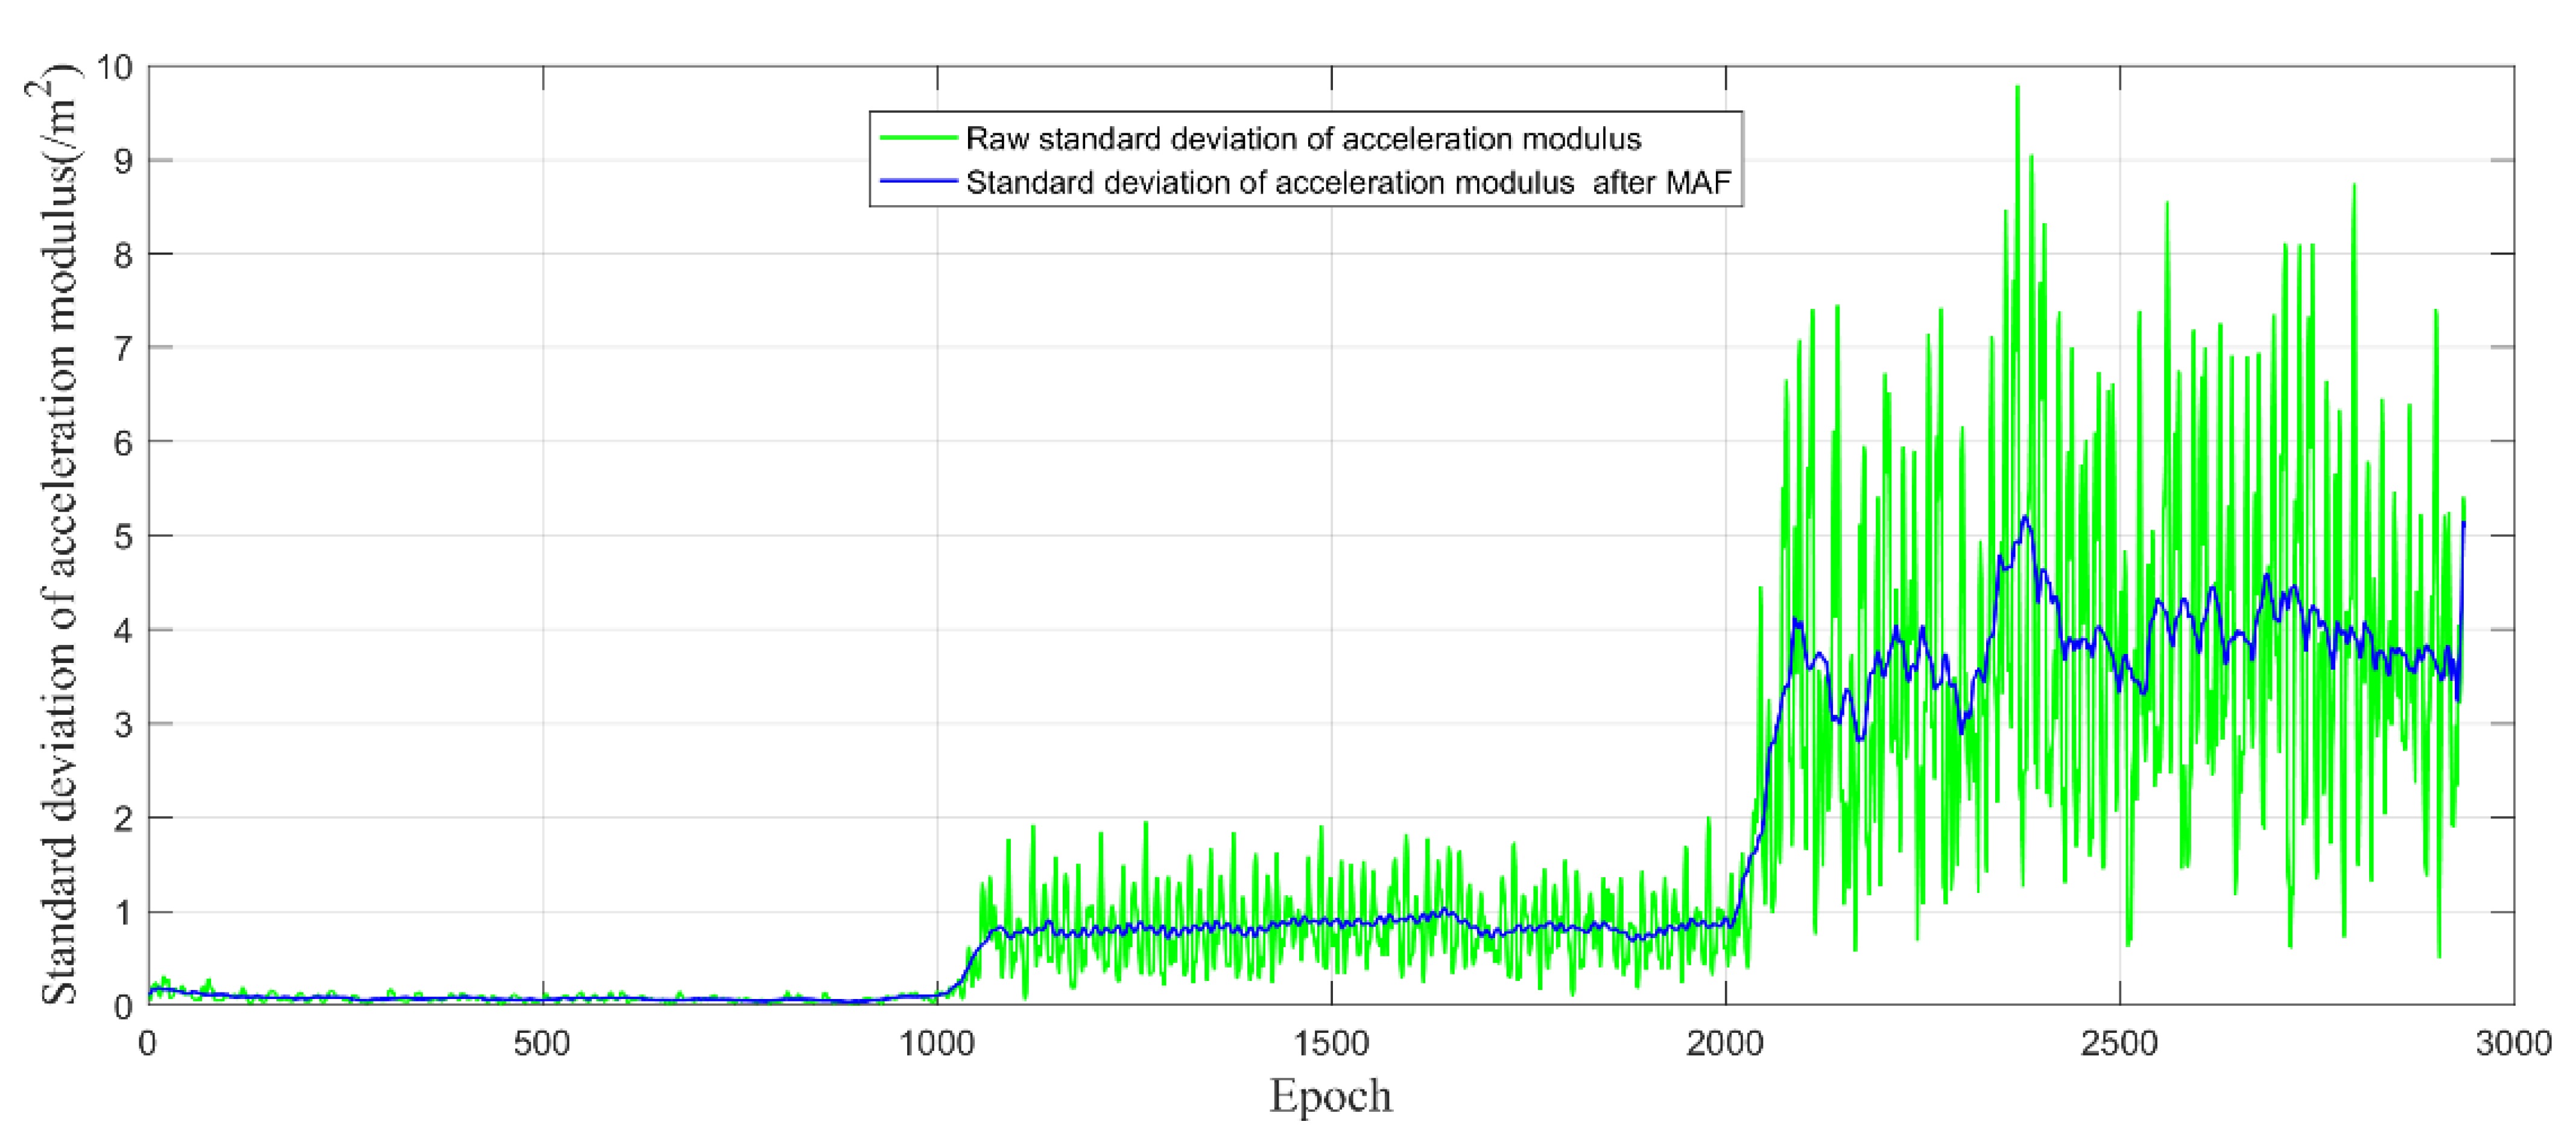
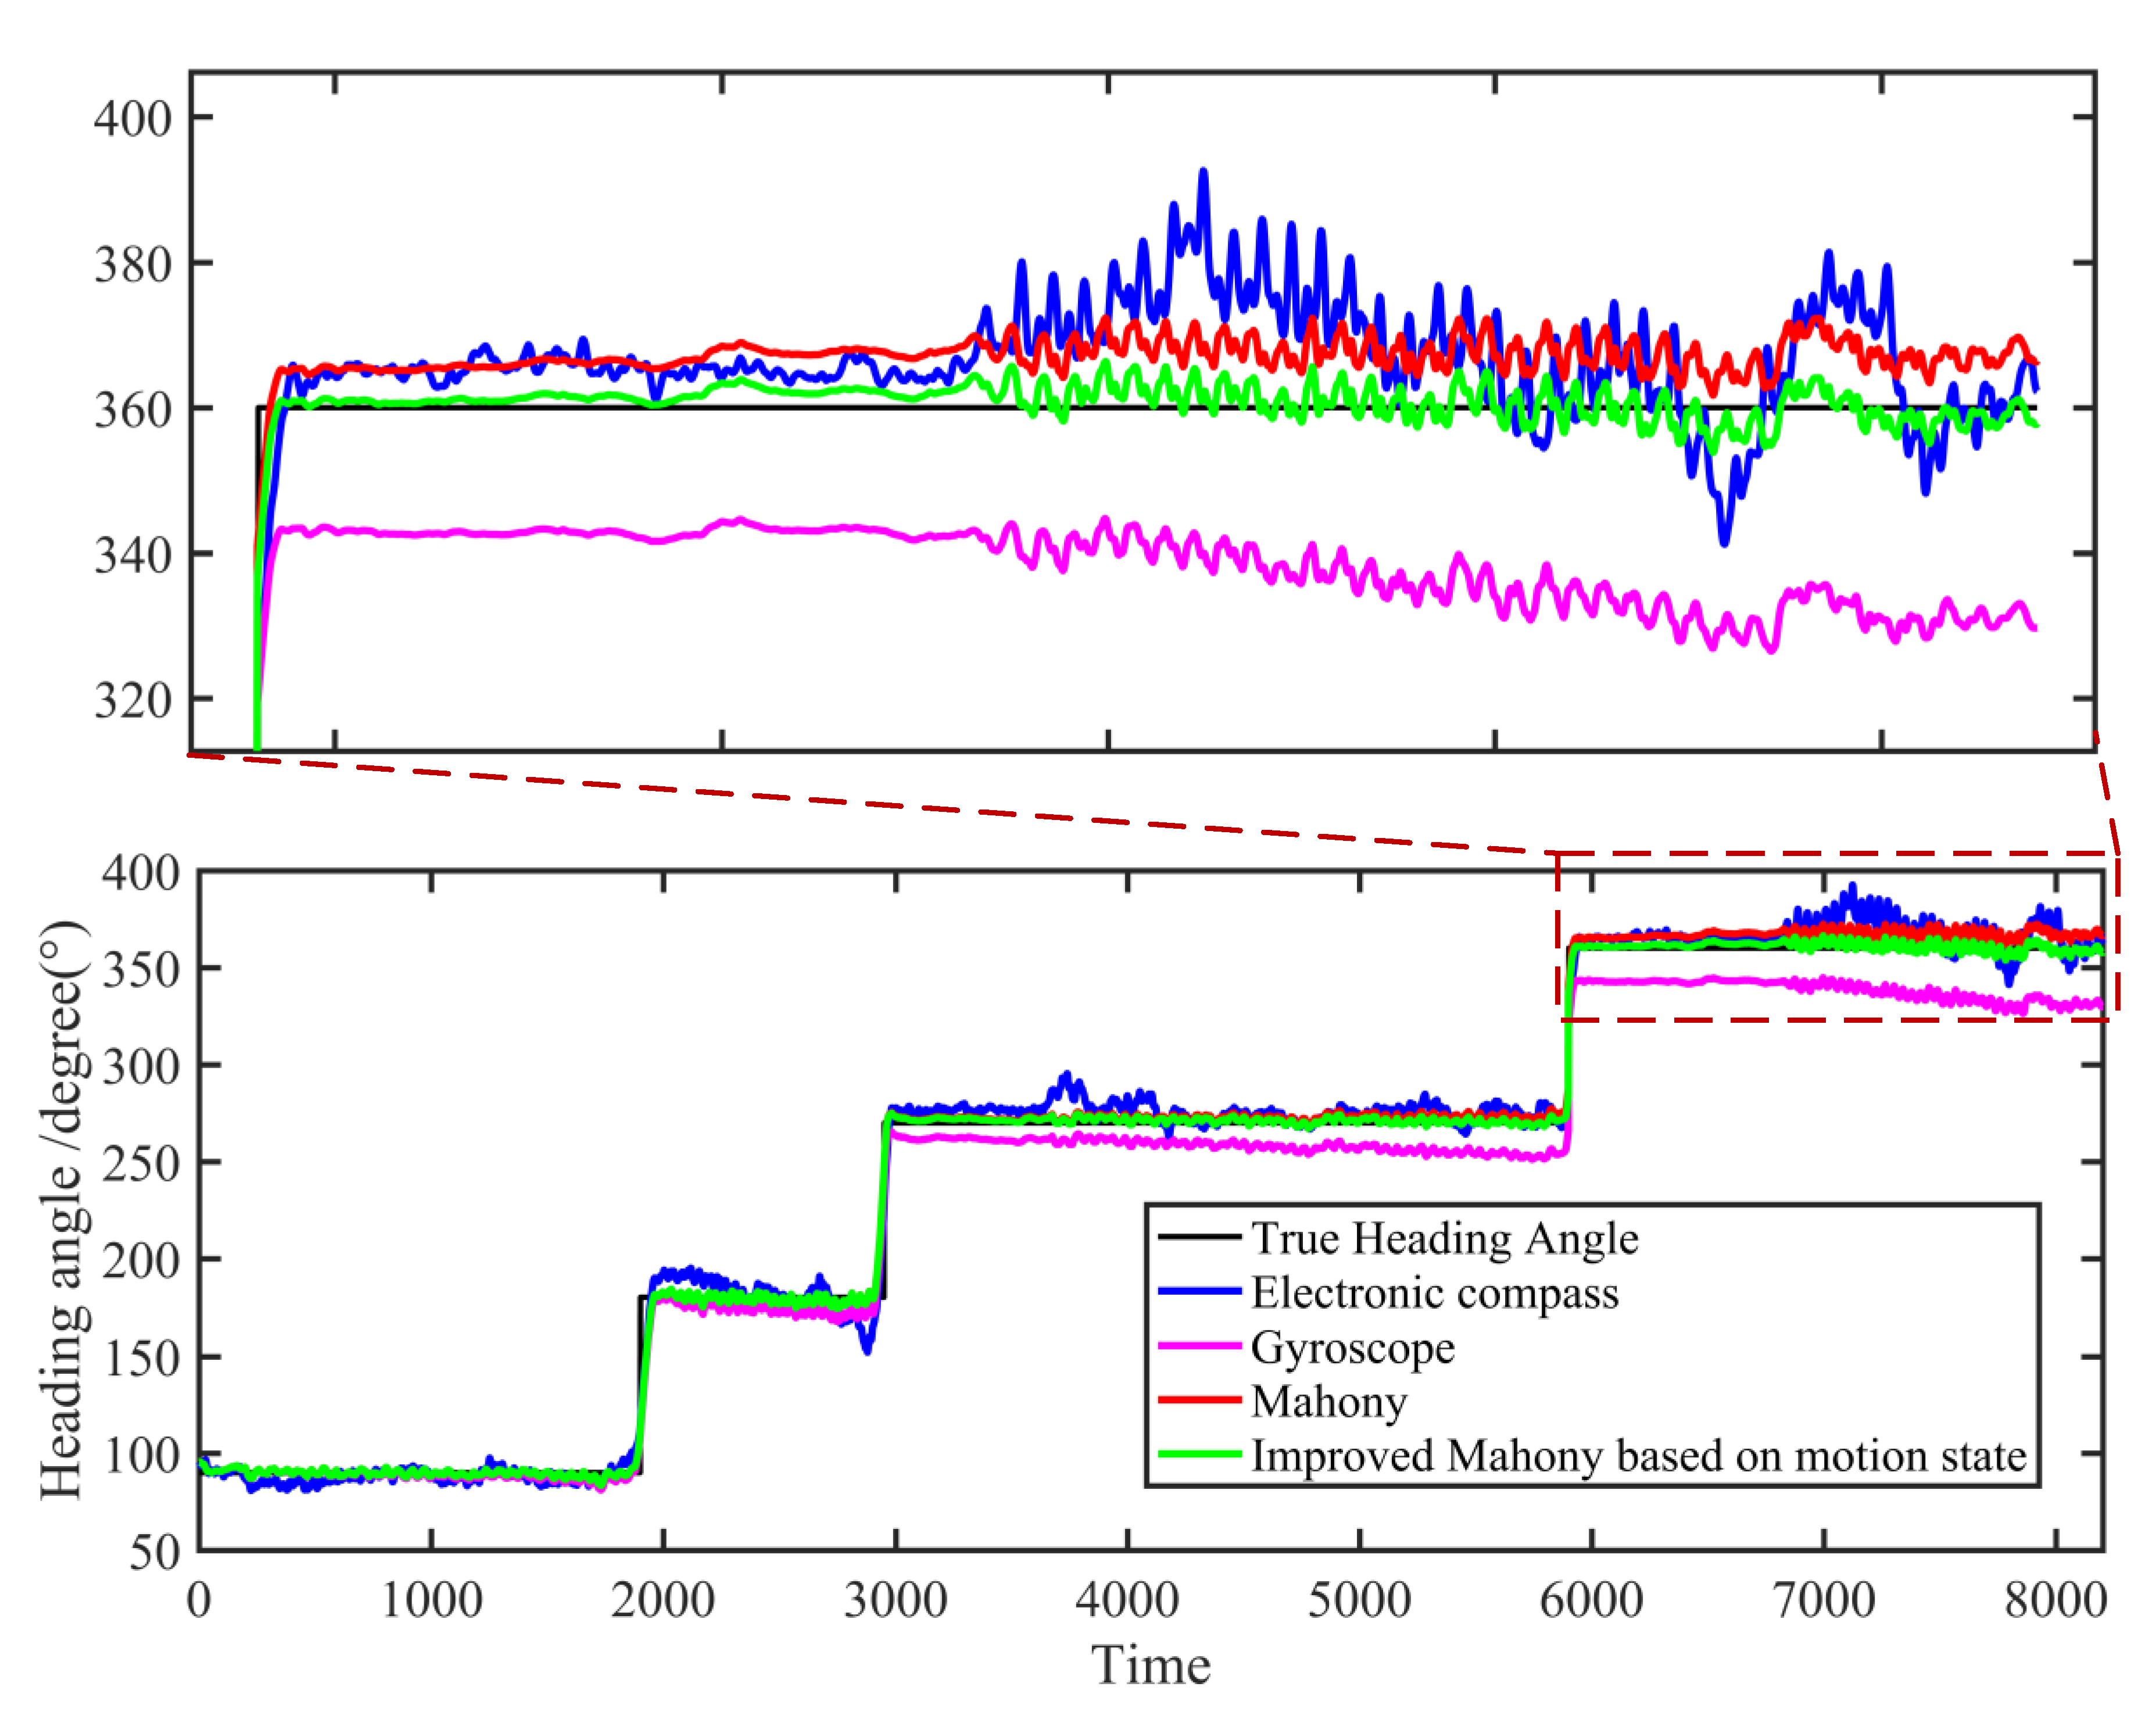
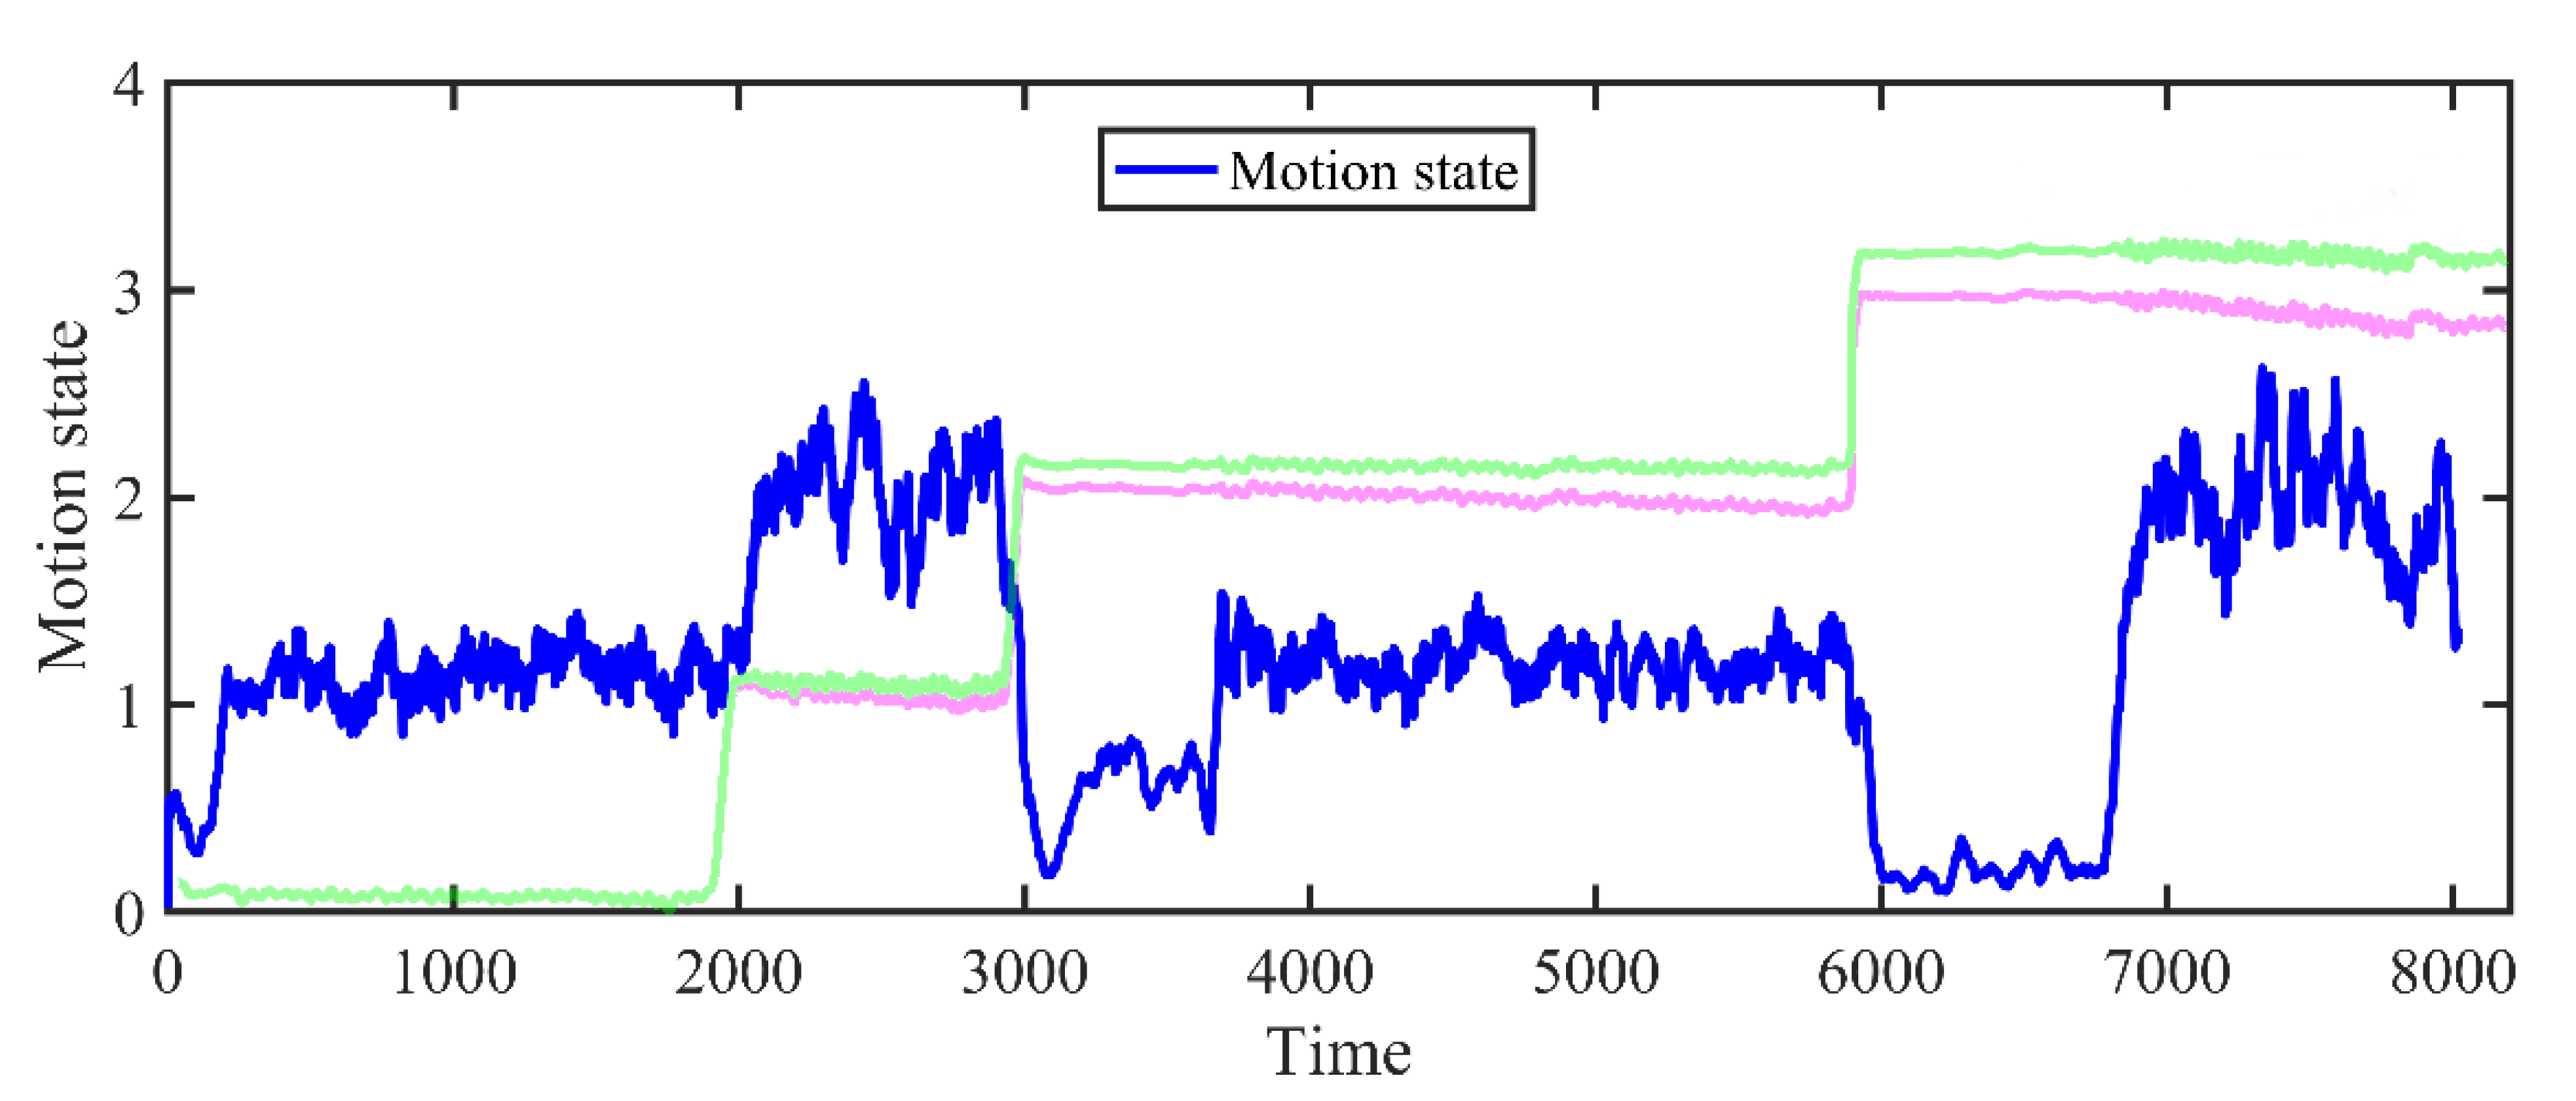
  • We found that the accuracy of the heading is also affected by the motion states of the pedestrian. An improved Mahony complementary filter is introduced to keep the heading angle stable by adaptively changing the control parameters in the filter after considering the different people’s motion states;
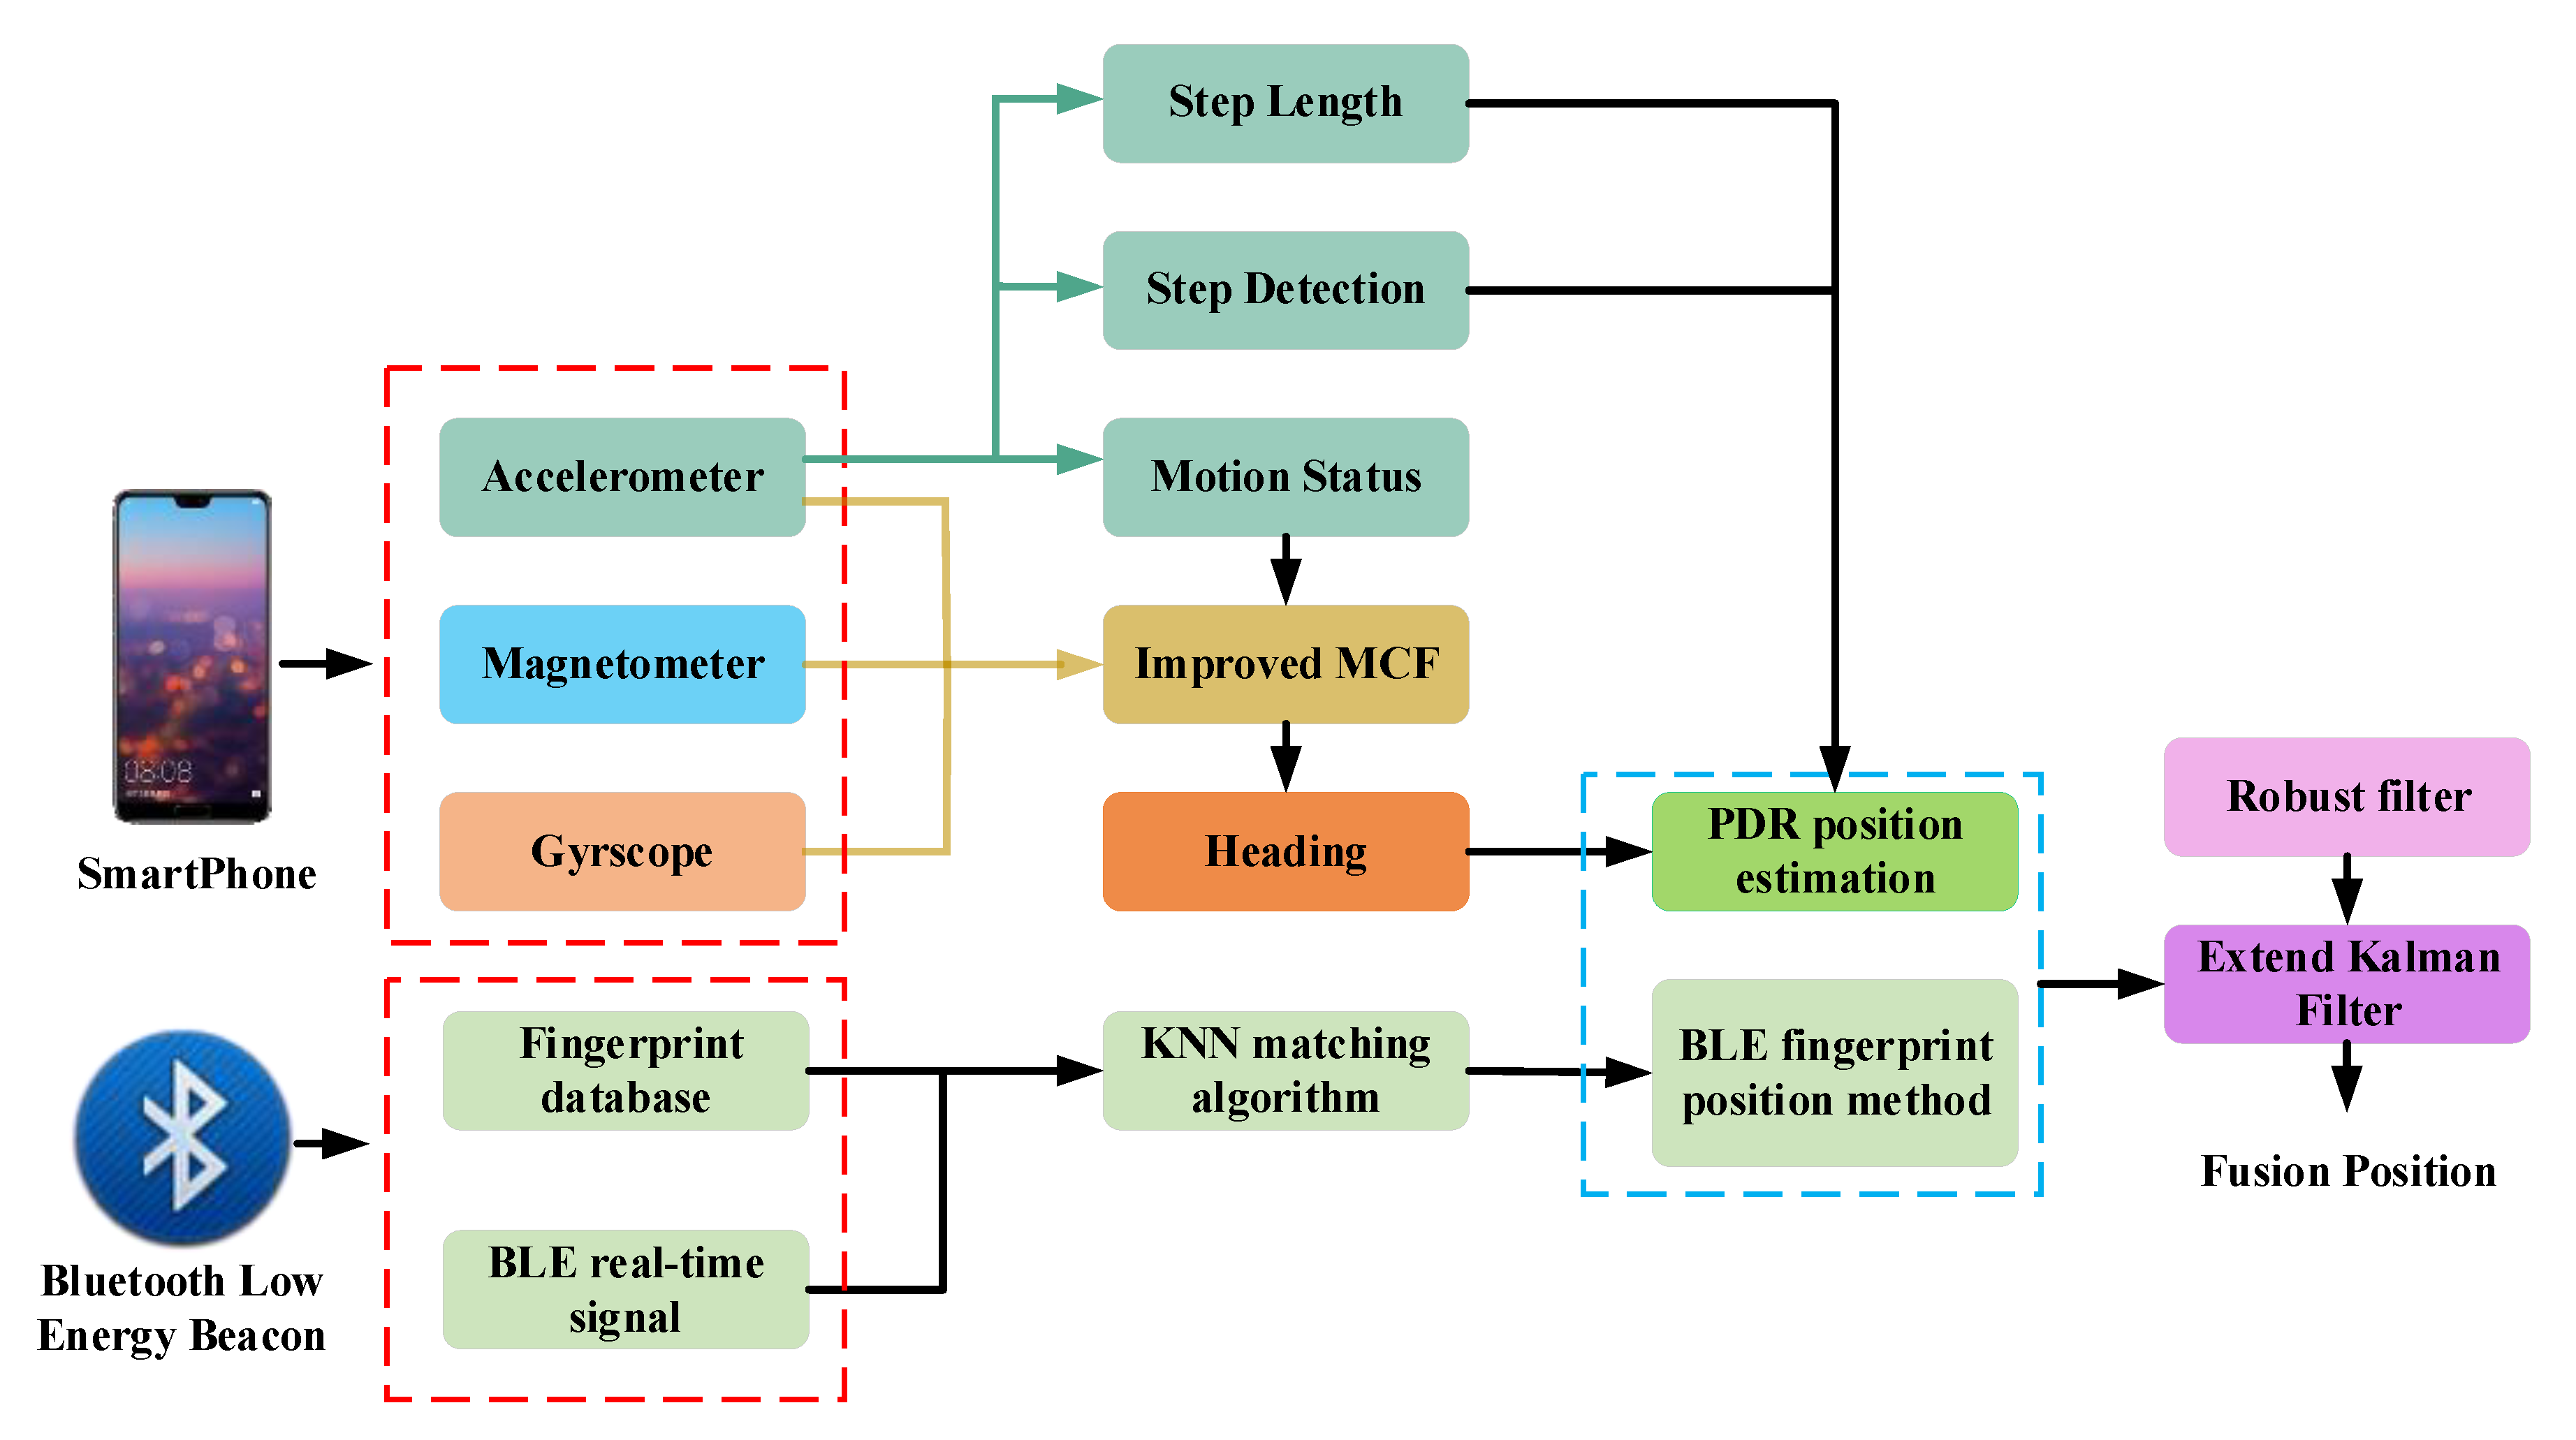
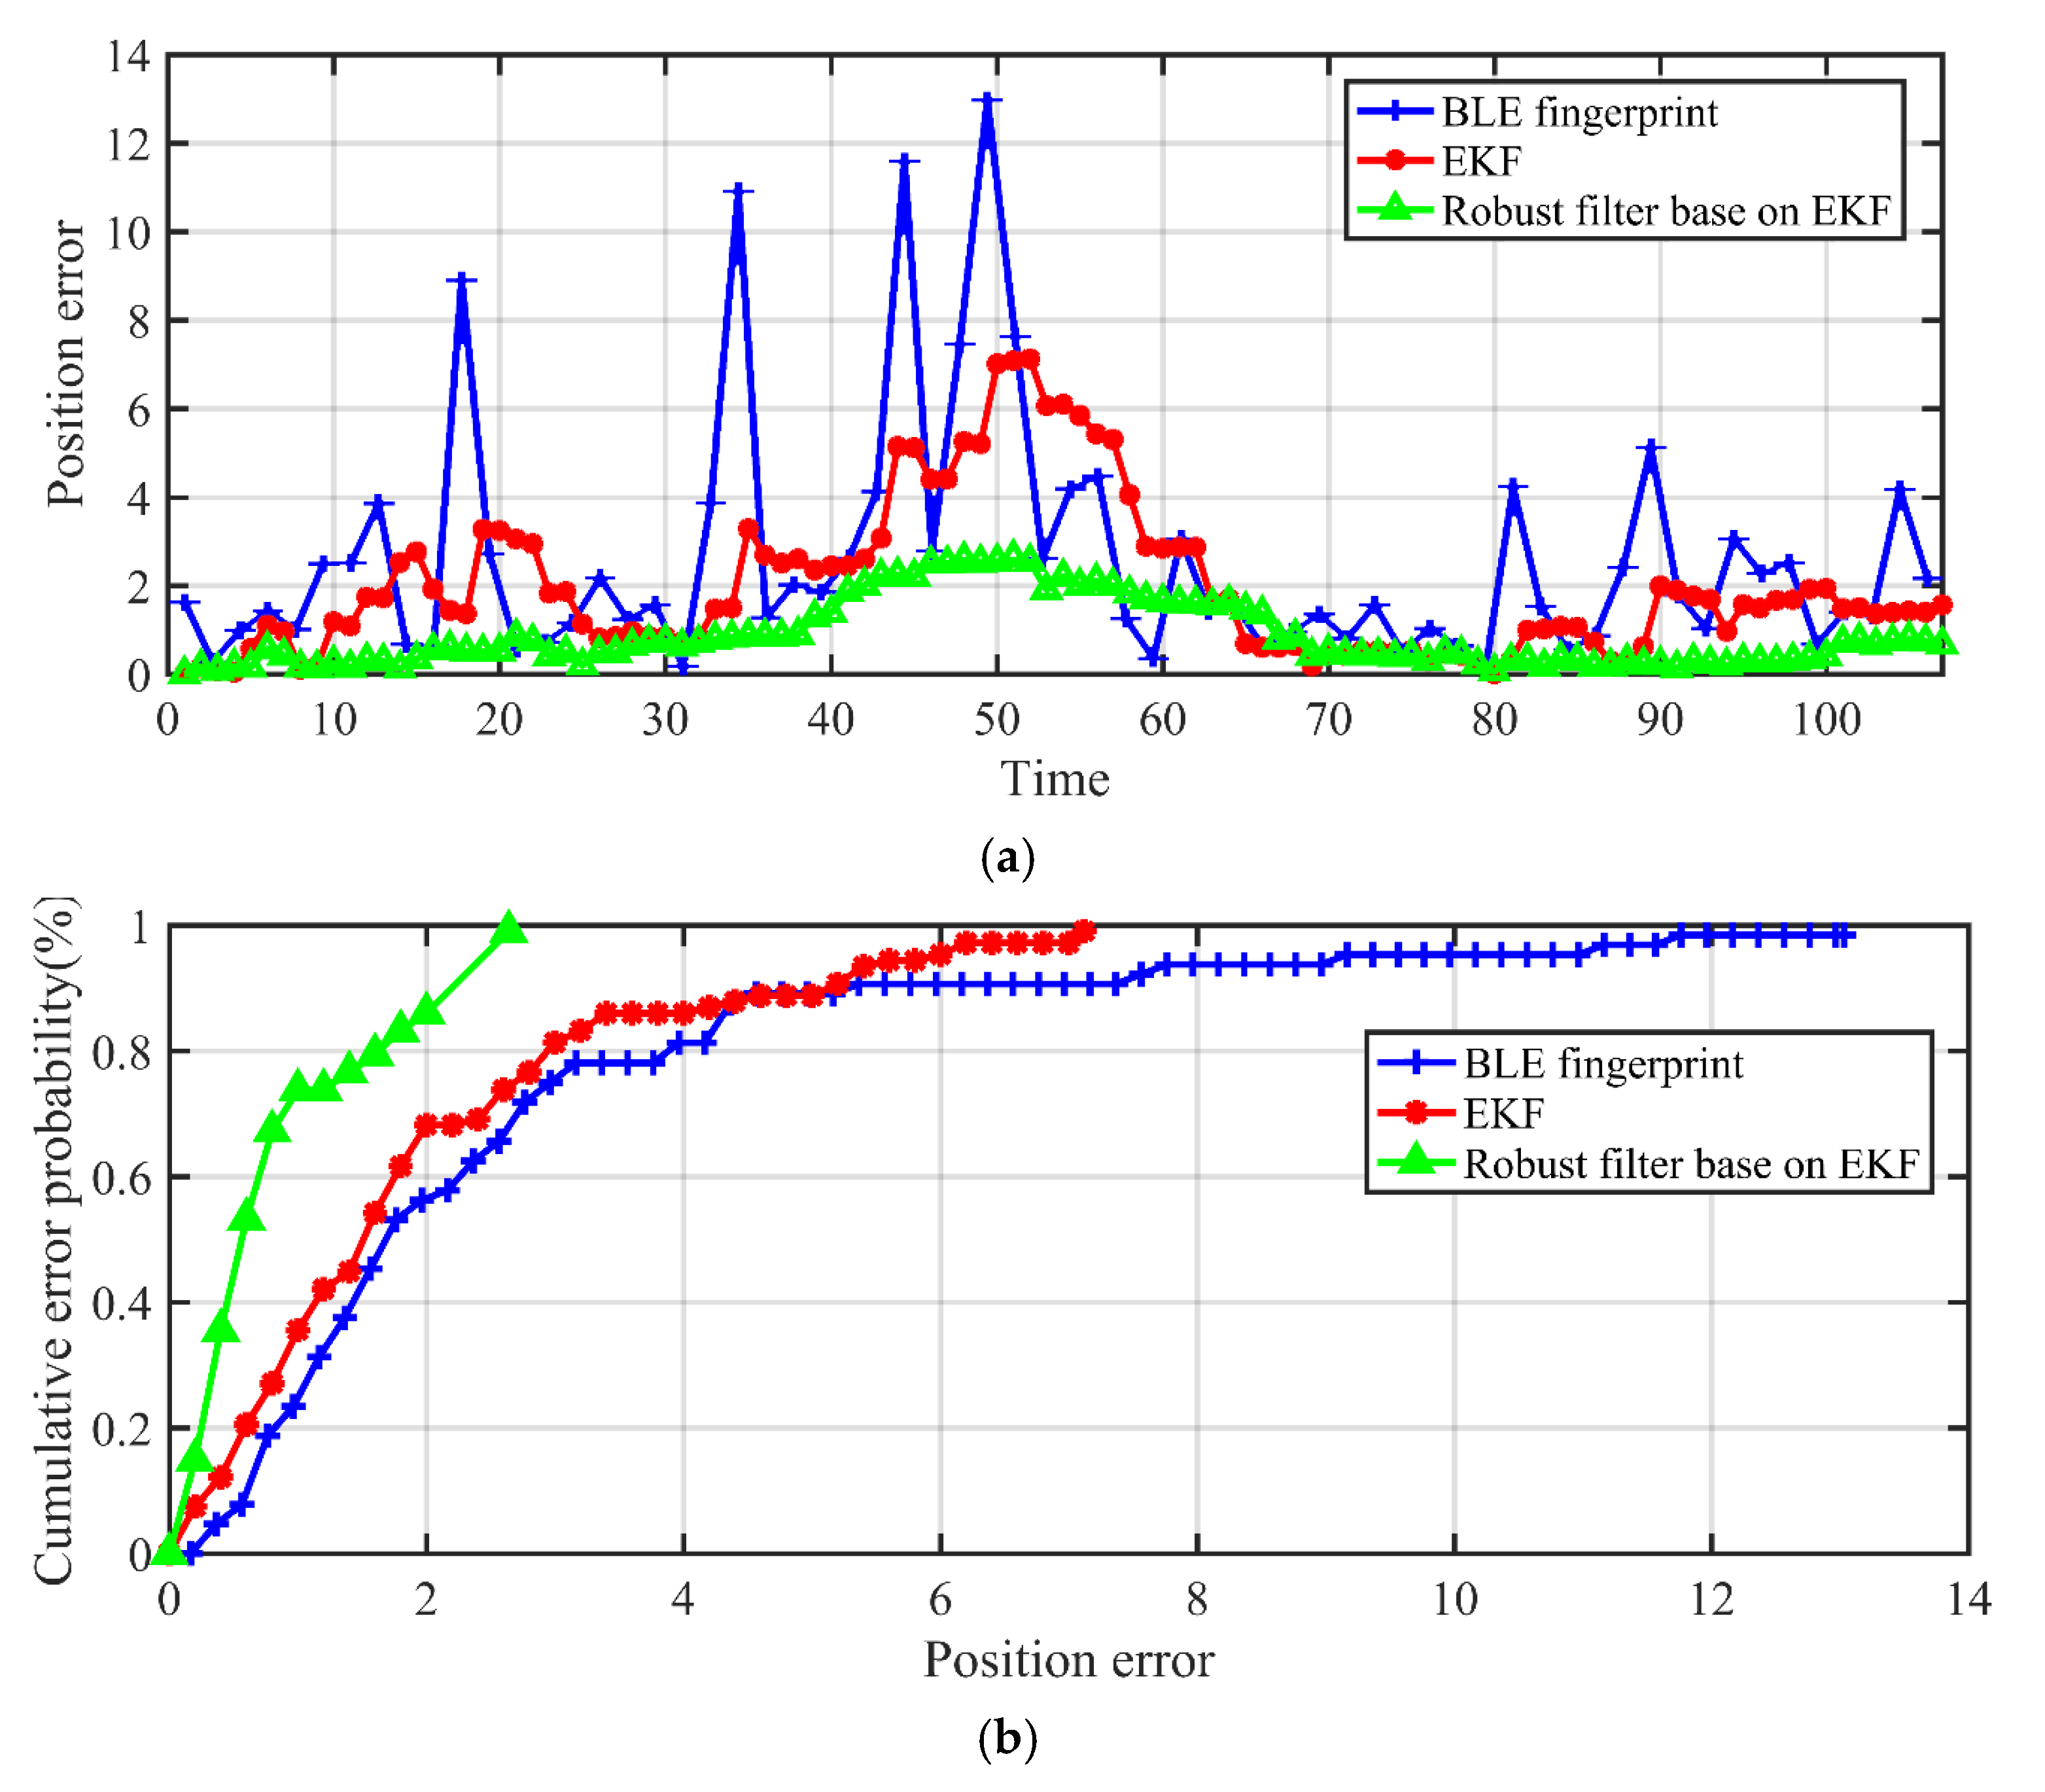
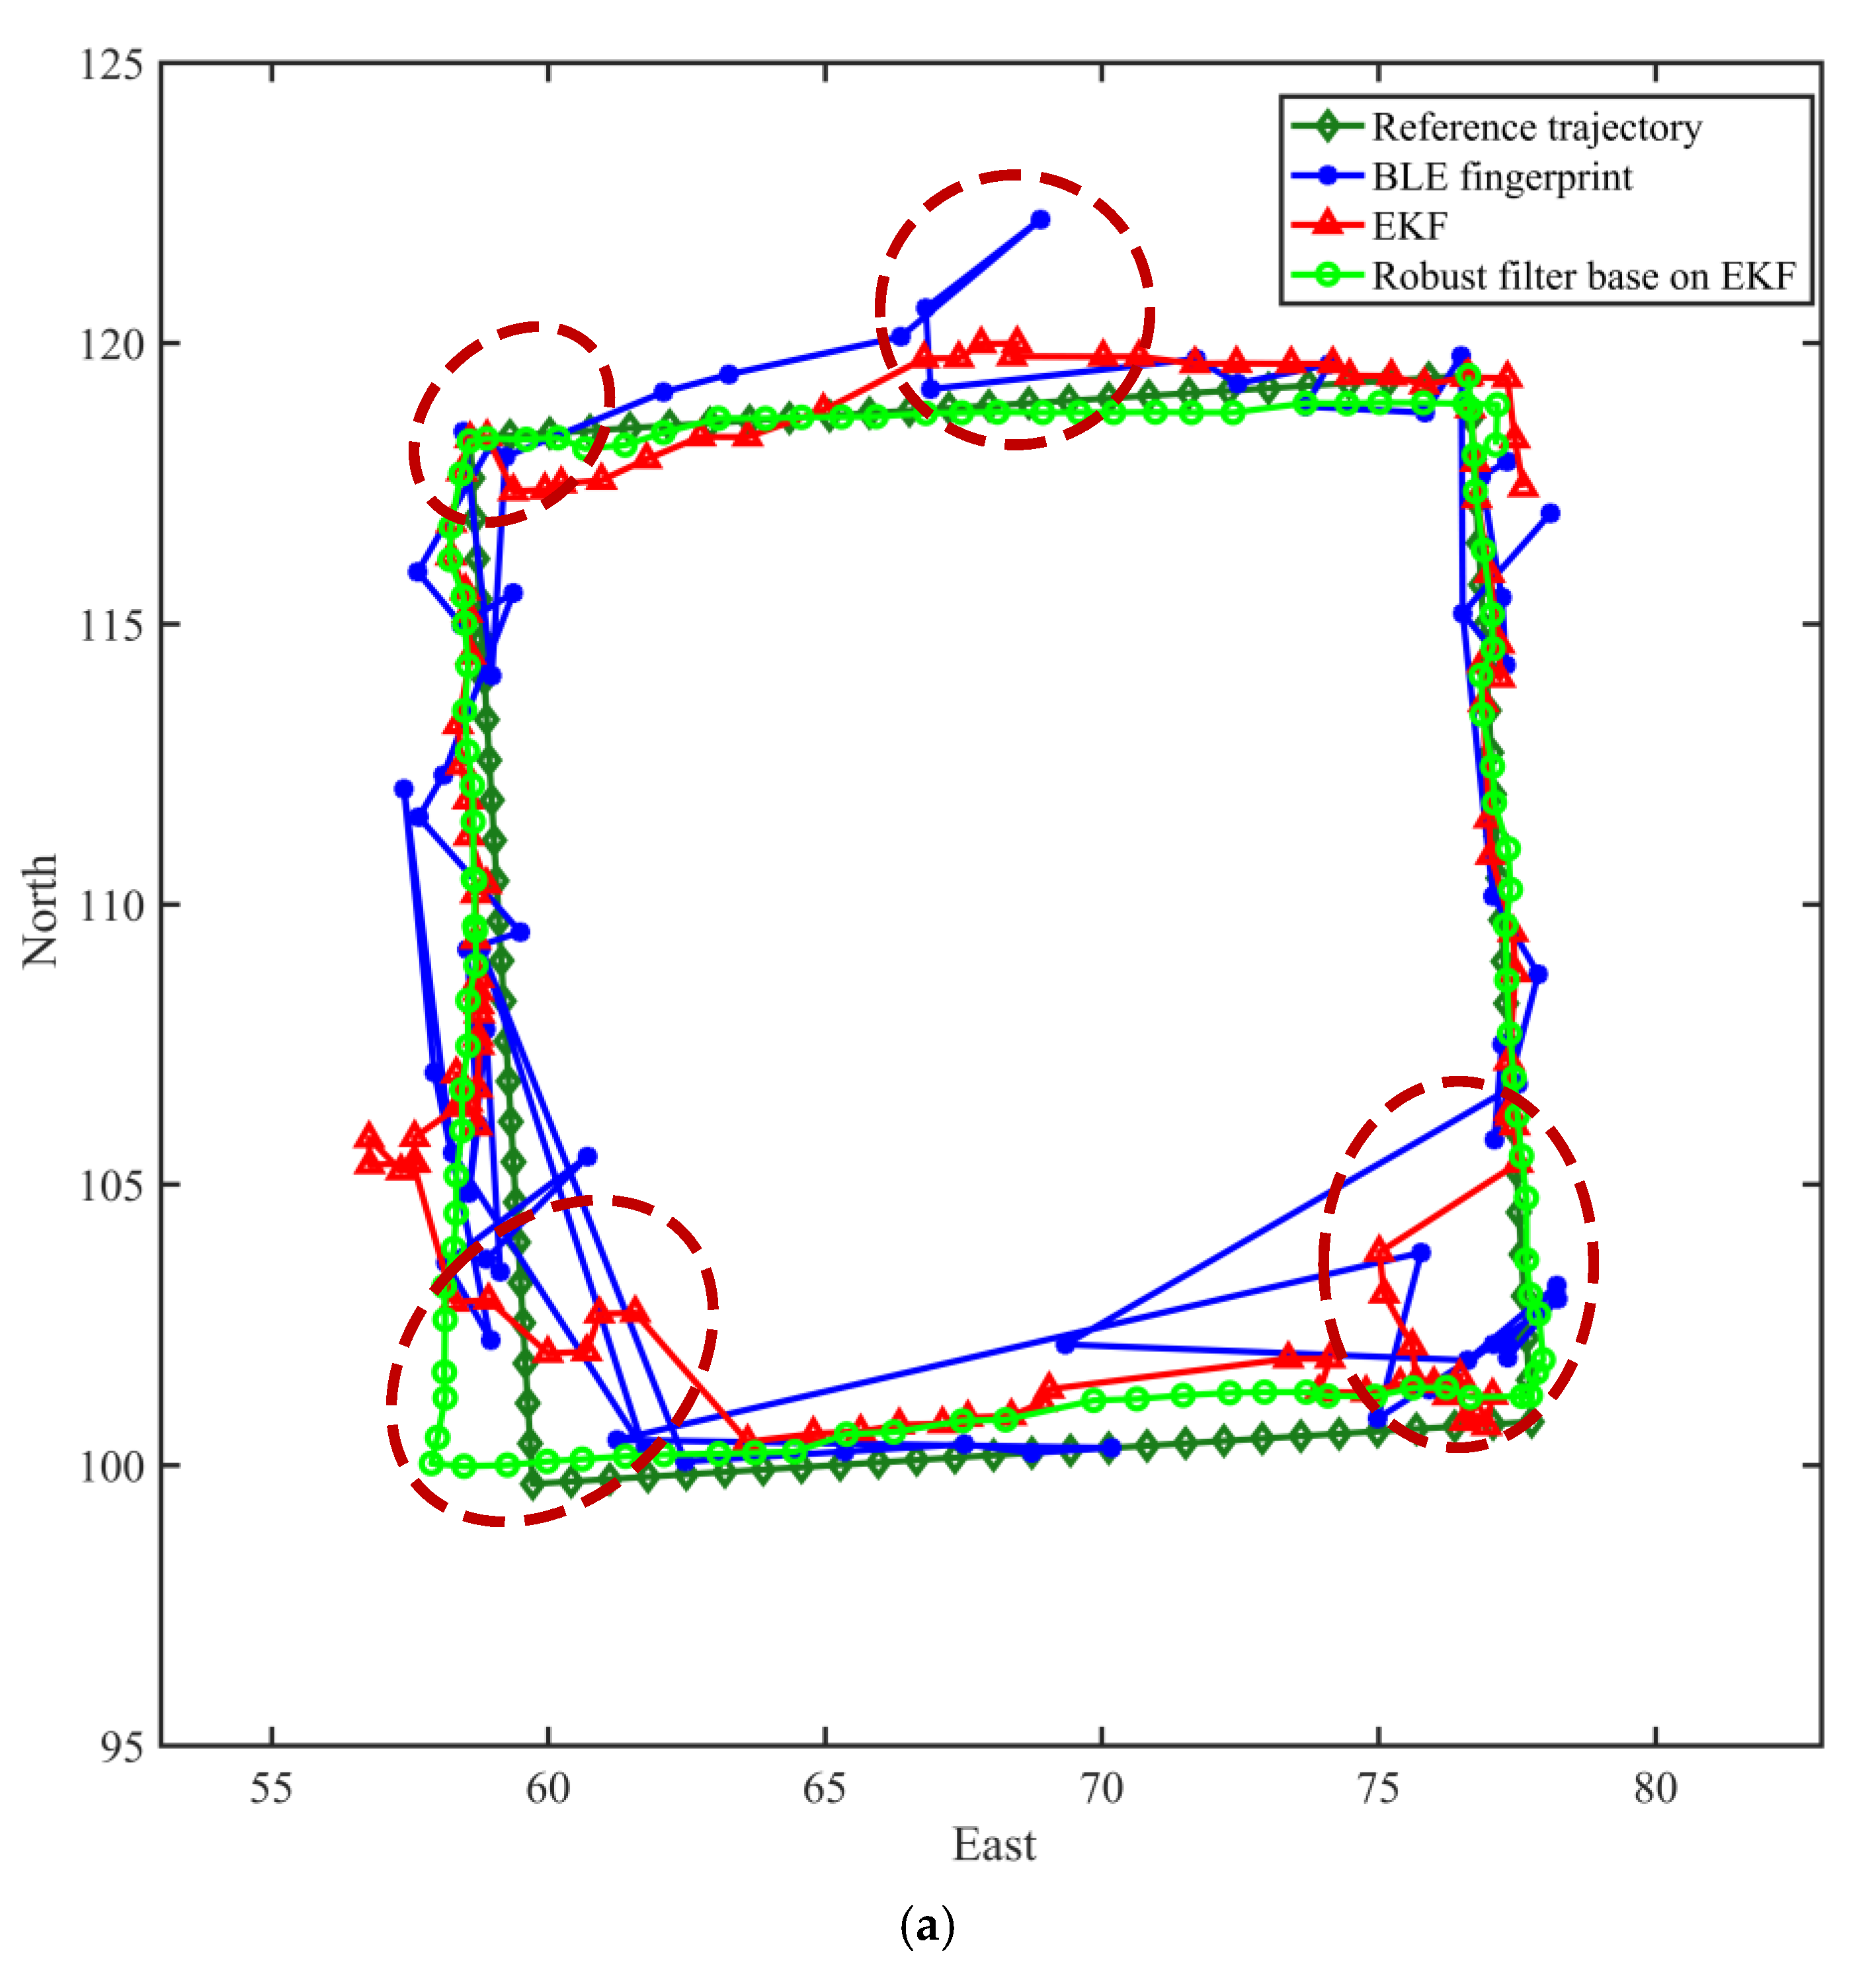
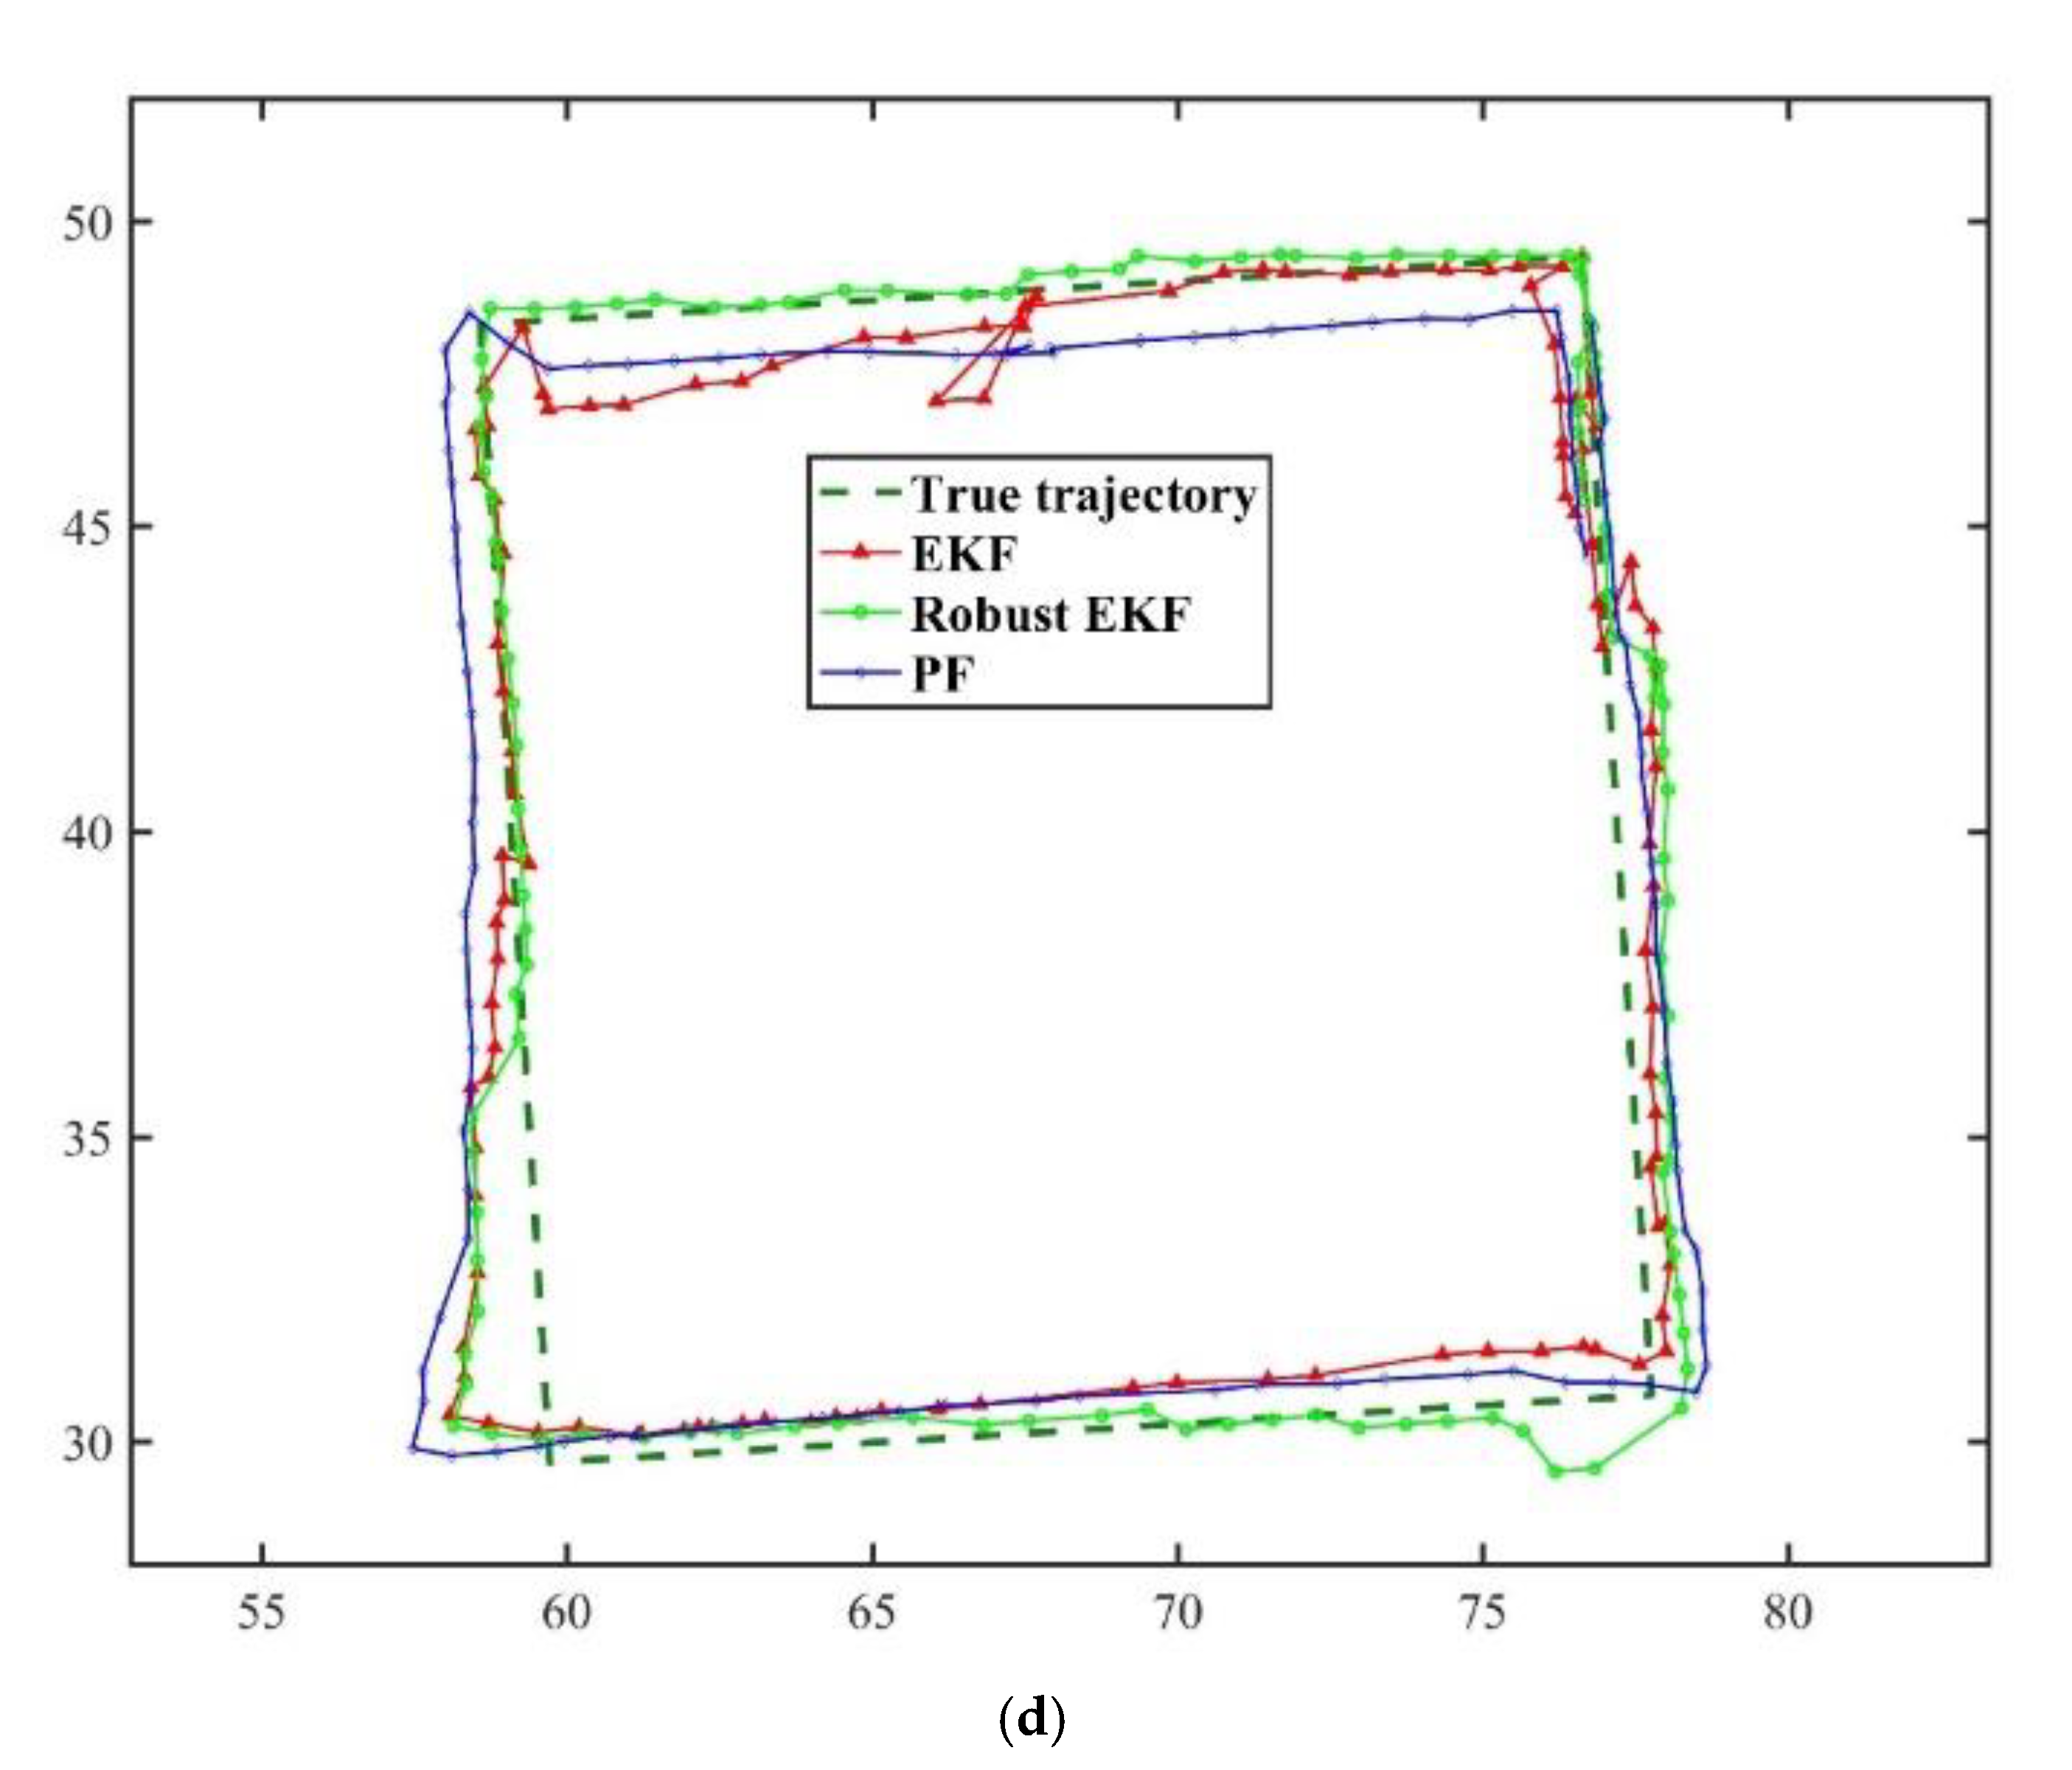
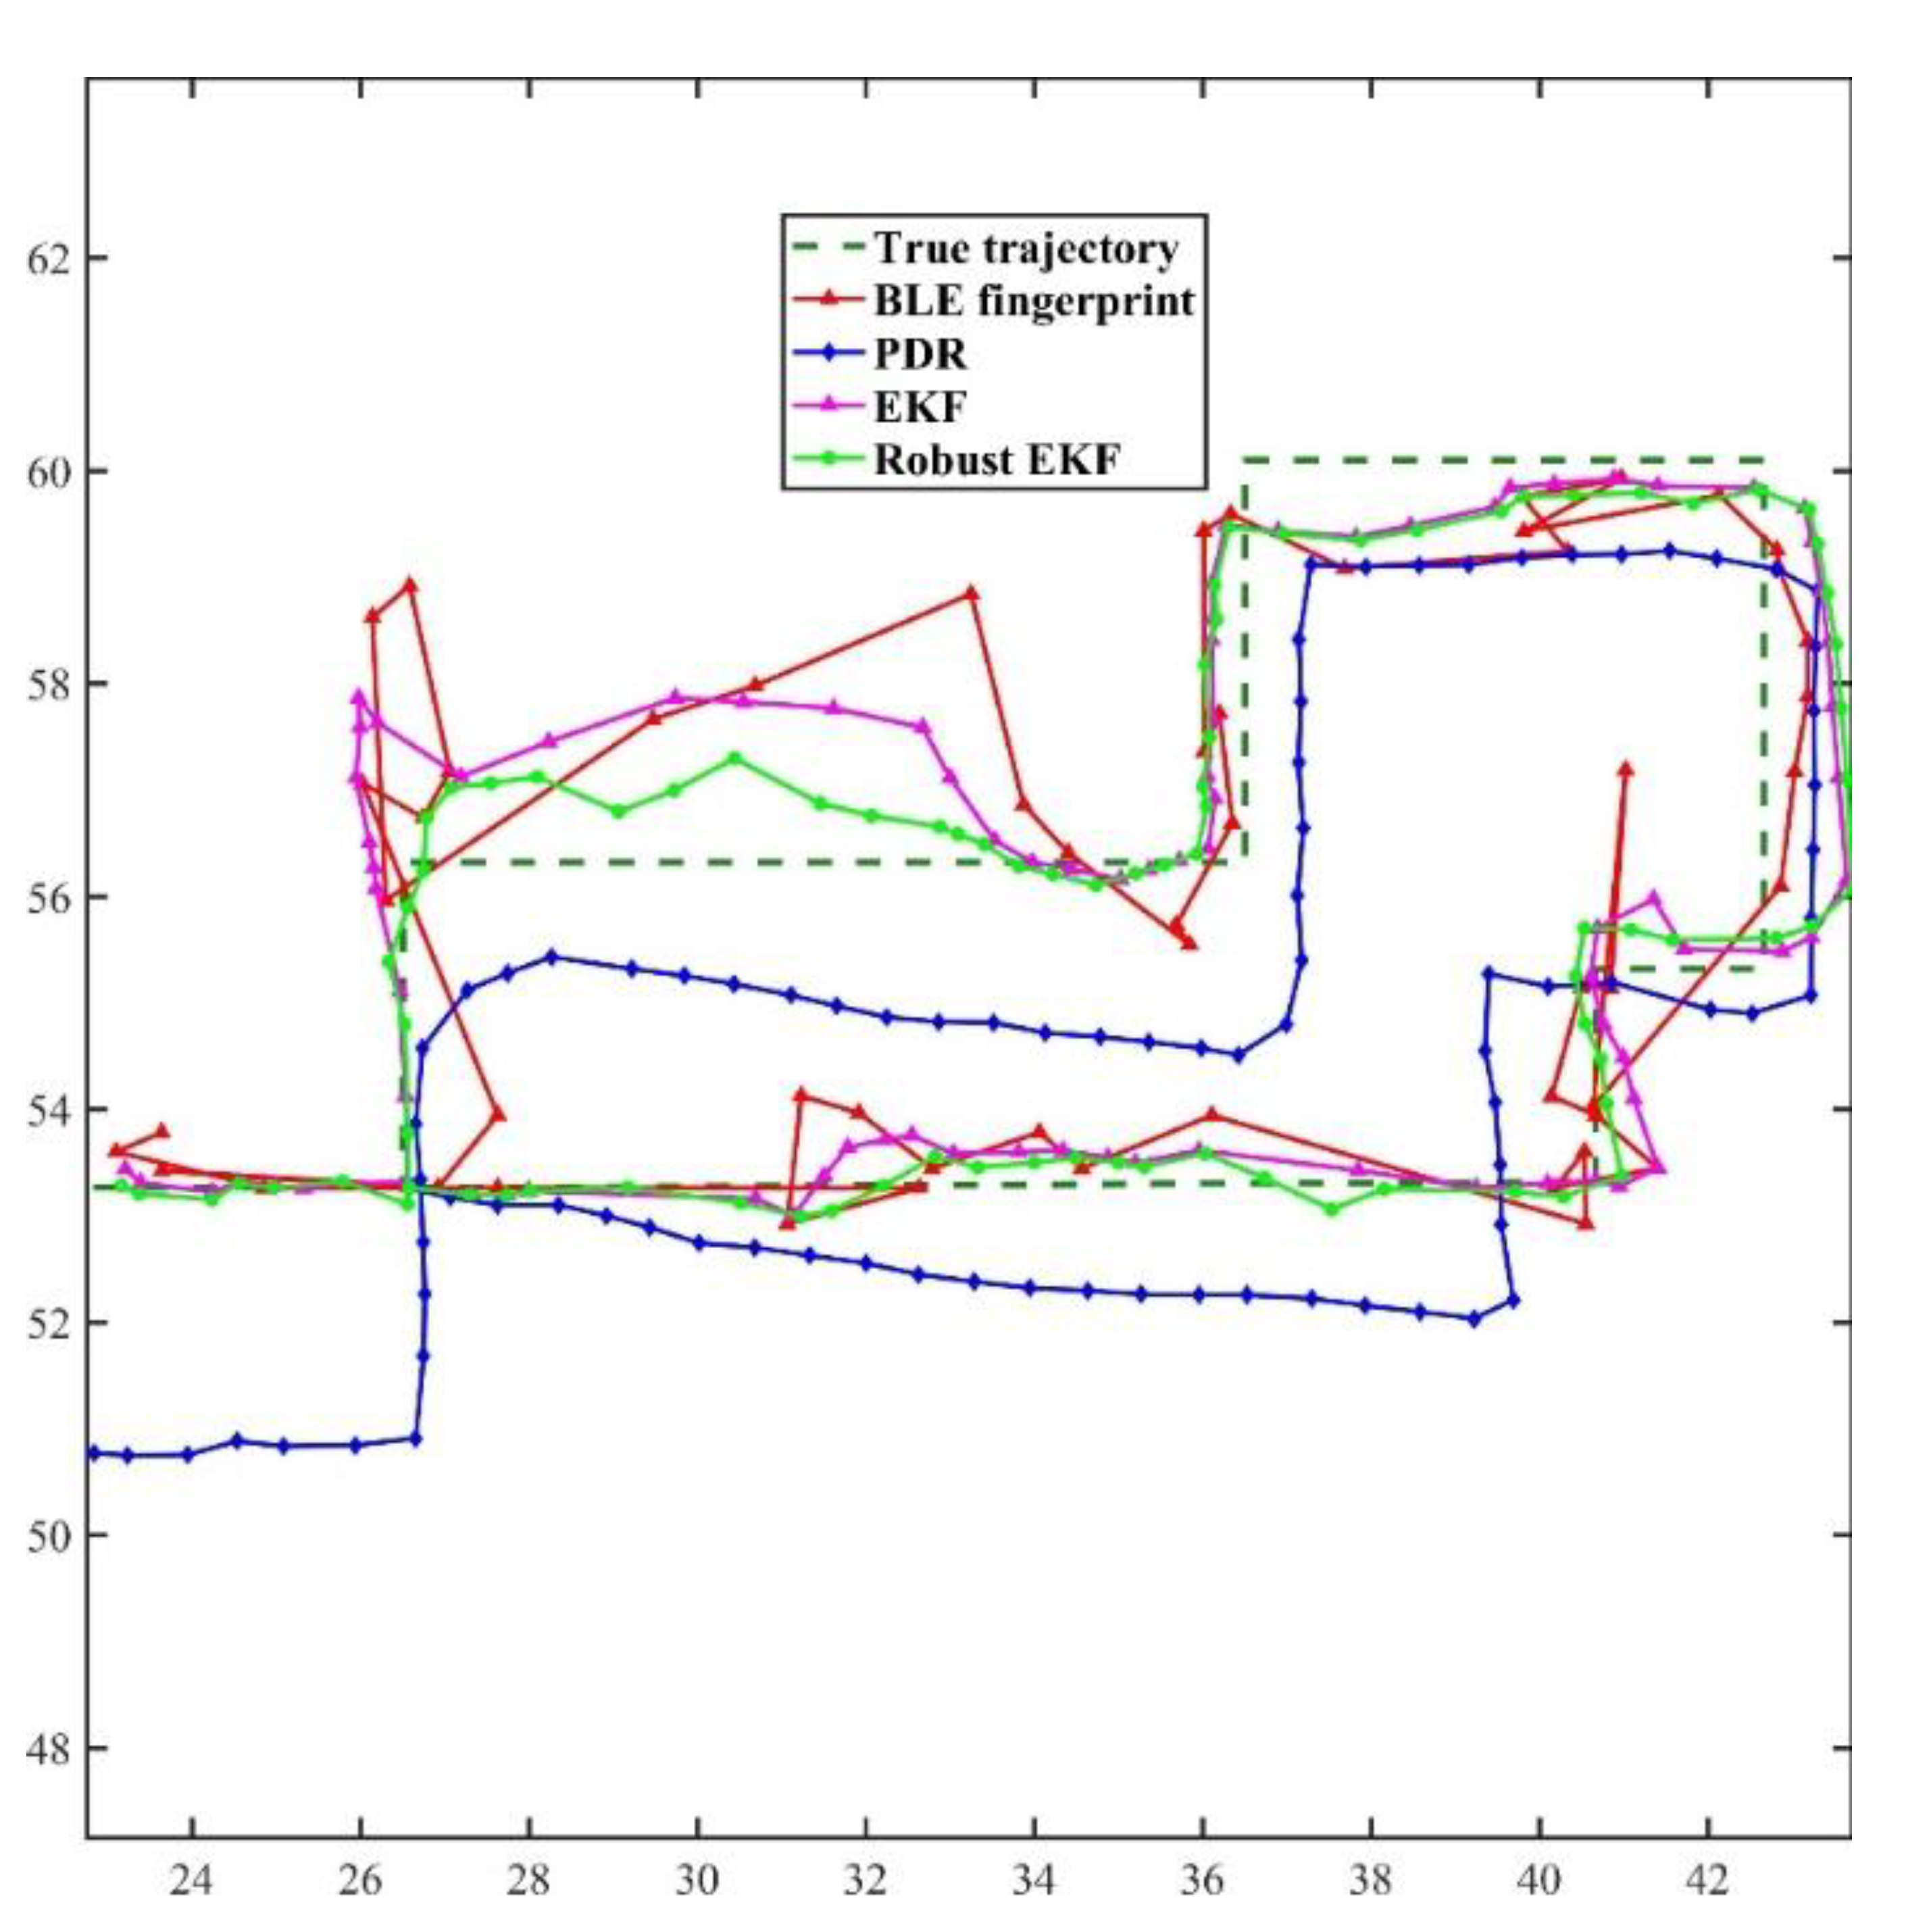
  • To meet the demand of real-time position and considering the computational load of the smartphone, we adopt the EKF method to solve the nonlinear fusion problem to combine PDR with the BLE fingerprint position method to provide the real-time position service. To cope with the gross error caused by the BLE fingerprint method in a harsh environment, a robust filter based on the EKF was proposed. The robust filter detected the gross error at different granularity by constructing a robust vector changing the observation covariance matrix of the extended Kalman filter (EKF) adaptively when the application is running. The experimental results demonstrate that the proposed method has better performance at position accuracy and stability.
The remainder of this paper is organized as follows: Section 2 is about the related works of the BLE-based position, self-contained position, and fusion position algorithms in detail. Section 3 introduces the BLE fingerprint method and analyzes the error of the position method. PDR method and the heading estimation based on the motion state are also introduced in this section. Next, the fusion method EKF and a robust filter are presented as well. Finally, a diagram about the BEL/PDR integrated system localization framework is demonstrated. Section 4 describes the experiments and analyzes the results. Then the discussion of the paper and the conclusions are presented in Section 5 and Section 6.

2. Related Works

The BLE-based position systems have been widely used by utilizing the received signal strength (RSS) measurements. Zuo et al. pointed out that the radio signals of BLE had two features. One is that the signal can change dramatically in a small spatial change. The other is that the signal can be reported multiple times or not reported at all during a single scan. Both features will cause huge noises in both RSS and BLE beacon availability [22]. In addition to the features of the signal, multipath effect, device heterogeneity, and deployment are the sources of errors in the BLE fingerprint position [19,23]. To analyze the effects of dense deployment, Ng et al. proposed a high-resolution proximity detection using an adaptive scanning mechanism fusion with spontaneous differential evolution [24]. Tian et al. defined a coverage degree criterion by leveraging the Cramer Rao Lower Bound (CRLB) and the differential evolution algorithm to optimize the placement of Wi-Fi and BLE access points (APS) to hybrid two types of signals to fuse position based on the position performance analysis [23]. Andrew et al. applied three Bayesian filtering techniques to fit the BLE signal distance equation based on considering various errors and conduct comparison experiments to verify the significant modification in two environments [25]. Subhan et al. presented an in-depth experimental analysis of RSS and its effect on distance and position [26]. The position methods based on BLE and WiFi are the same, which can be divided into two categories: proximity detection, multilateration, and fingerprinting approaches. The research by Zhao et al. showed that under the same environment and conditions, the BLE-based position is more accurate than Wi-Fi because of its lower transmission power and unique channel hopping mechanism [27]. The key point of much research on proximity detection and multilateralism is a distance-based estimation [25,28]. Moreover, it is difficult to obtain an accurate distance model under complex environmental circumstances. The fingerprint method has become the popular approach in real-time positioning with many advantages of being infrastructure-free and easily realizable. RADAR was the first RSS-based fingerprint system that used a K-nearest neighbor (KNN) algorithm to estimate the location indoors [29]. Zuo et al. introduced an efficient and graph optimization-based way for estimating the beacon positions and the reference fingerprint map to combine range-based and fingerprint-based methods of BLE [21]. A self-adaptive weighted KNN algorithm PhaseFi proposed a deep network instead of the fingerprint database and estimated the position by a radial basis function probabilistic method [30].
The self-contained position method mainly contains two types: the data-driven inertial navigation method and the PDR method. The data-driven inertial navigation technology has been increasingly used in recent works which use the deep neural network with great potential in model-free generalization to regress pedestrian motion characteristics. It used inertial measurement units (IMU) in a short time and ground-truth motion trajectories to regress motion parameters (velocity and heading). Robust IMU double integration (RIDI) had made a breakthrough in coordinate frame normalization and used support vectors to regress a more accurate velocity vector [31]. IONet and RoNIN utilized trained neural networks to regress the magnitude of speed and the rate of heading angle change, showing the capability to obtain plain displacement [32,33]. ILIO demonstrated a network that regresses 3D displacement estimation and its uncertainty to tightly fuse the relative state measurement into a stochastic cloning EKF to solve for the pose, velocity, and sensor biases [34]. IDOL presented a two-stage, data-driven pipeline using a commodity smartphone that first estimates device orientations and then estimates device position to solve the problem of inaccurate orientation estimates [35]. Although the data-driven inertial navigation has a good performance in long-time tracking based on the sophisticated deep learning technology, it needs a large amount of data to train and extra equipment to get the ground-truth trajectory in advance, and for real-time positioning, the device will be under greater computational load. PDR position is a self-positioning method that consists of three key components of step detection, step length, and heading estimation that is a good choice for the real-time position. Lachapelle et al. proposed three-step length error models: Gaussian model, constant random model, and Gauss Markov model. He modeled the error of the gyroscope as a random constant deviation when establishing the PDR error model, so the heading error was considered to be linear with time [36]. Jahn et al. established the error models for four methods of measuring step length and discussed the systematic and random errors with the Taylor expansion [37]. You et al. proposed the multipoint positioning algorithm based on the received RSSI for calibration to eliminate the cumulative error existing in the traditional PDR system by analyzing the characteristics of walking postures [38].
For fusion methods, Li et al. [39] proposed an adaptive system noise EKF algorithm to develop an integrated Wi-Fi/PDR system. The proposed filter could determine the dynamic noise of the transition matrix according to the movement (straight or turning) of the pedestrian and reduce the computational complexity of the matching fingerprint database by using an affinity clustering algorithm. The positioning error could be reduced to 2.32 m by the experiment. Deng et al. [40] also presented a novel data fusion framework by using an EKF to integrate Wi-Fi localization with PDR. They developed a measurement model based on kernel density estimation to enable accurate Wi-Fi localization and adaptive measurement noise statistics estimation. The experiments show that the proposed method obtains comparable accuracy and greatly reduces computation cost compared with a particle filter. Atia et al. [41] utilized a grid-based nonlinear Bayesian filter algorithm to fuse the Wi-Fi, BLE, and inertial navigation system (INS) sensor information to develop a calibration-free hybrid indoor positioning methodology. The experiments demonstrated that the performance of the fusion method is much better than the BLE fingerprint position method. However, the harsh indoor environment will lead to coarse errors in the wireless localization method while different motion states of pedestrians affect the performance of PDR, which both affect the accuracy of the dynamic and observation models. Adaptive and robust filters can be employed to mitigate the effects of large errors in the dynamic and observation models, respectively. Yang et al. [42] proposed an adaptively robust filter based on a robust maximum-likelihood estimation to kinematic geodetic positioning and measurement. The method could not only balance the contribution between the updated parameters and measurement but also mitigated the influence of measurement outliers. Yang et al. [43] also presented an adaptively robust filter with multi adaptive factors based on the principles of the adaptive KF and bifactor robust estimations for correlated observations. The proposed filter is more flexible in controlling the disturbing effects of the state components compared to the classified adaptive factors. Chang et al. [44] proposed a robust KF using the Chi-squared test to detect measurement outliers. Li et al. [45] presented an adaptive and robust filter to combine the Wi-Fi and PDR information to develop an integrated system. The adaptive filter is based on scenario and motion state recognition and the robust filter is based on the Mahalanobis distance. The experiment results indicate that the proposed filter is better than the common EKF.

3. Materials and Methods

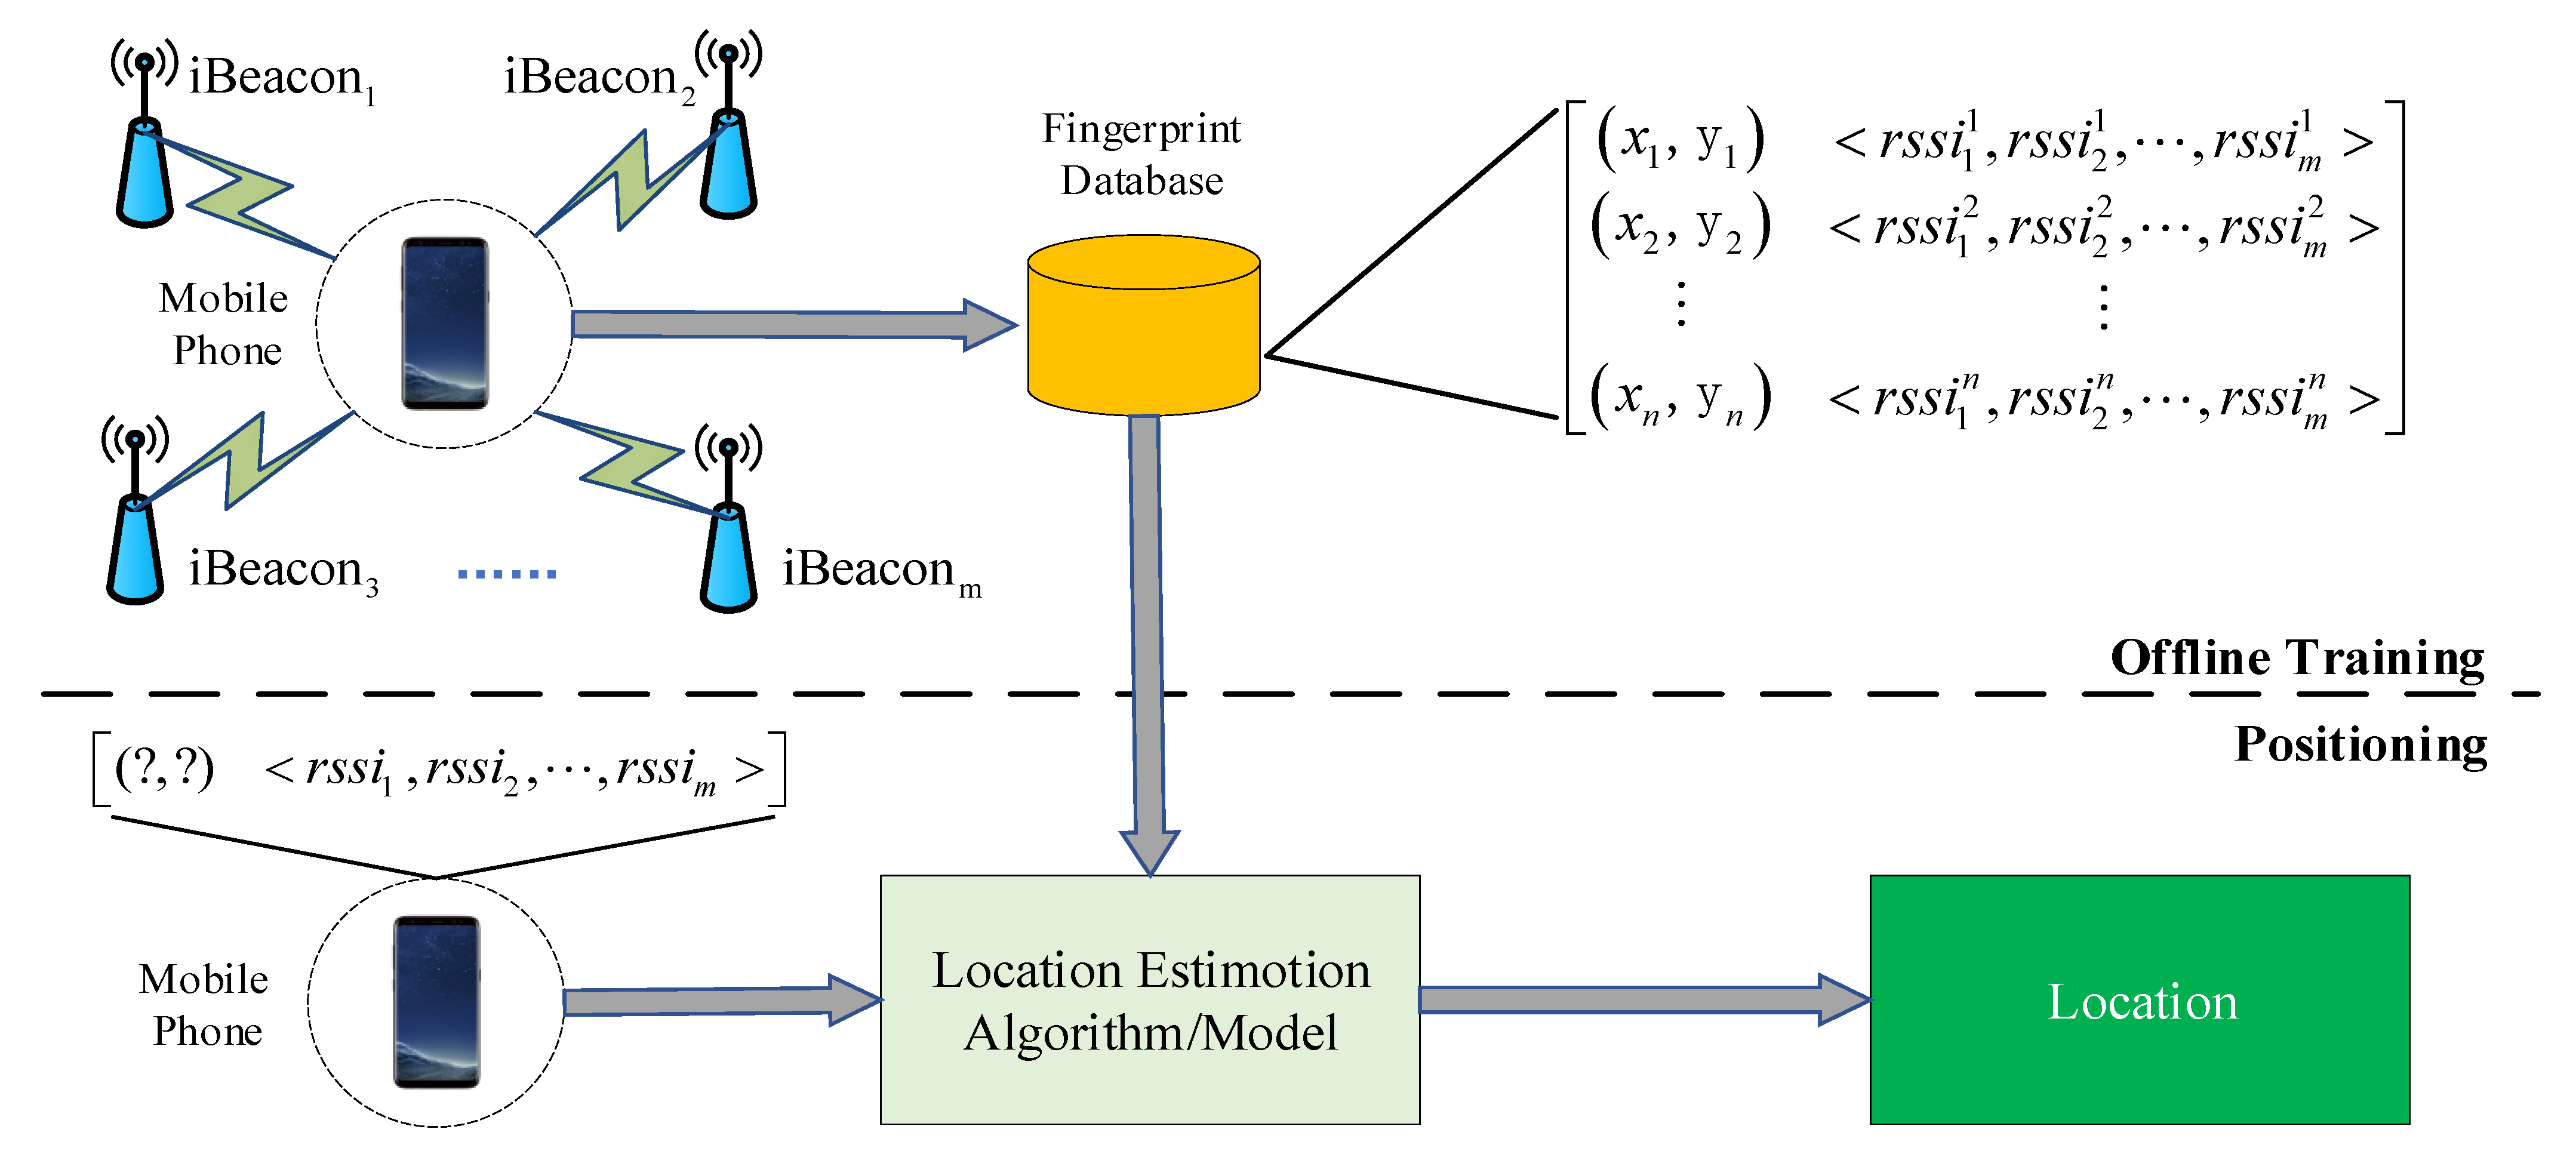
3.1. BLE Position Technology

The fingerprint position is mainly based on the similarity of the received signal strength (RSS) and the fingerprint database to obtain the position result. The RADAR system was the first RSS-based fingerprint system developed by Bahl et al. [29] for indoor localization by utilizing a KNN algorithm. Like any other fingerprint method, the BLE fingerprint position method consists of two stages: the offline data training stage and the online positioning stage. During the offline data training stage: people stand at the reference points (RPs) whose coordinates are known in advance to collect the RSS from the access points (APs) for some time. Then, the fingerprint database as shown in Equation (1) is constructed after computing the distribution of collected data. Suppose that there are n RPs and m APs in the position scenario.
Fingerprint   database = [ ( x 1 , y 1 ) r s s i 1 1 , r s s i 2 1 , r s s i 3 1 , , r s s i m 1 ( x 2 , y 2 ) r s s i 1 1 , r s s i 2 1 , r s s i 3 1 , , r s s i m 1 ( x n , y n ) r s s i 1 1 , r s s i 2 1 , r s s i 3 1 , , r s s i m 1 ]
During the online positioning stage, the position of the target is obtained by matching the real-time fingerprint to the database on certain algorithms. There are many matching algorithms. Considering the efficiency of real-time positioning and the simplicity of implementation, the classic matching method is K-nearest Neighbor (KNN). The basic idea of the KNN algorithm is to classify the target into the nearest sample class in the feature space. For the BLE fingerprint position method, the feature space is the fingerprint database. The process of BLE fingerprint KNN algorithms is shown as follows:
Step 1: When online positioning is carried out, a real-time fingerprint is collected by smartphone. The real-time fingerprint is expressed as Equation (2).
Real   time   fingerprint = [ r s s i 1 , r s s i 2 , , r s s i m ]
Step 2: Then the Euclidean distance between the real-time fingerprint and fingerprint database can be calculated by the following Equation (3).
d i = ( r s s i 1 r s s i 1 i ) 2 + ( r s s i 2 r s s i 2 i ) 2 + + ( r s s i m r s s i m i ) 2
Step 3: Then we sort the n distance d i in ascending order and choose the first K items to calculate the target position by averaging the K corresponding coordinates as shown in Equation (4).
( x , y ) = 1 K i K ( x i , y i )
The process of the fingerprint position method is shown in Figure 1.
In addition to the general fingerprint position process described above, BLE real-time fingerprint also has its features. When we carry out a real-time BLE fingerprint position, the BLE module broadcasts data at a certain frequency. The broadcast data include the identity number, module name, mac address, received signal strength indicator (RSSI), and other information. The broadcast frequency is usually from 10 nanoseconds to 10 s, and the default broadcast frequency is 500 milliseconds. The common android devices such as smartphones provide a function to scanning the BLE signal for real-time fingerprint position. Generally, the continuous positioning with a time interval of 1 s is regarded as the real-time position. Due to the influence of the scanning mechanism, the number of the scanning BLE RSSI is often different in 1 s. In addition to the impact of signal fluctuations, the number of the scanning BLE RSSI will also cause errors in fingerprint position.
Here are the real-time RSSIs from 54 BLE APs in one position scenario at certain RP collected by smartphone HUAWEI P20 in 60 s. The collected data per second correspond to a real-time fingerprint data, totaling 60 fingerprint data. Then we count the scanning RSSI number of each fingerprint and Figure 2 shows the scanning RSSI number of each fingerprint in detail with a bar chart.
As can be seen from Figure 2, there are differences in the scanning RSSI number per second. The scanning RSSI number per second is at least 1 and at most 37, with an average of 19.78 RSSI. The different number of the scanning RSSI directly affects the positioning accuracy of BLE fingerprint position. If the scanned number of APs is too small, it is easy to cause a coarse error in the BLE fingerprint position [46]. A robust filter is needed to restrain the coarse error.

3.2. PDR Technology

Pedestrian dead reckoning (PDR) is a self-positioning method for indoor navigation. The key technologies of PDR are step detection (or counting), step length estimation, and heading angle of pedestrian estimation. After a pedestrian step was detected, the position can be obtained using step length and heading angle based on the previous position [20]. The general process of PDR is illustrated as Equation (5):
{ N k + 1 = N k + s k · c o s ψ k E k + 1 = E k + s k · s i n ψ k
where N k and E k refer to the coordinate of the pedestrian at the north and east direction at time k , respectively. s k is the step length and ψ k is the heading angle at time k .
In the PDR method, step detection and step length are estimated according to the accelerometer readings. Many step detection algorithms have been proposed by researchers, including peak detection [47], threshold setting [29], zero velocity update [48], auto-correlation [49] and finite-state machine (FSM) [50]. Among them, the FSM method is easy to implement and more resistant to interference from errors. After detecting a step, step length is estimated by different models. Studies have shown that the step length is related to the acceleration, heights, and strides of different people. Linear models [51], constant models [52], and nonlinear models [53] are the most common methods which are used to estimate the step length. The step length estimated by different methods differs little. For simplicity, we choose the Weinberg model [54] to estimate the step length in our research and the expression for the model is as follows in Equation (6):
s k = K · a m a x a m i n 4
where   K is the scale factor of the step length, a m a x and a m i n are the maximum and minimum acceleration in one step cycle.
Apart from step detection and step length estimation, heading estimate is another important component of PDR. The compass [55] or the gyroscope [56] are usually used to estimate the heading angle. Because of the inherent sensor noise in the smartphone, the accuracy of the heading obtained by the compass is not high but it will not drift for a long time. In contrast, using the gyroscope to estimate the heading, the accuracy in a short time will be high, but it will suffer a drift problem. We also found that different motion states of pedestrians would affect the accuracy of heading estimation. To avoid the shortcomings of compass and gyroscope and take into account the different motion states of people, an improved Mahony complementary filter (AMMCF) based on the motion states had been proposed in our research. The parameter K p in the filter can adaptively change based on the motion states which are judged according to the acceleration readings. The principle of PDR is illustrated in Figure 3.

3.3. An Improved Mahony Complementary Filter Based on the Motion States

The attitude of the device can be described by Euler angle, rotation matrix, and quaternion methods. The Euler angle is the angle between the three axes of the carrier coordinate system (CCS) and geographic coordinate system (GCS) which include pitch, roll, and yaw. The pitch, roll, and yaw represent rotation around x, y, and z axes as shown in Figure 4 and are denoted by the symbol θ , γ and   ψ , respectively. The Euler angle method only needs three elements to store attitude information, which is simple, intuitive, and easy to understand, but it is easy to generate a universal joint deadlock phenomenon.
Different from the Euler angle, the Euler angle describes the attitude of the device at a certain moment, while the rotation matrix describes the motion process of the device rotation. In a GCS defined by the North-East-Up (NEU), the rotation matrix C n b between the two systems can be defined in Equation (7):
C n b = C n γ C n θ C n ψ = [ c o s γ 0 s i n γ 0 1 0 s i n γ 0 c o s γ ] [ 1 0 0 0 c o s θ s i n θ 0 s i n θ c o s θ ] [ c o s ψ s i n ψ 0 s i n ψ c o s ψ 0 0 0 1 ]
where C n b represents the rotation matrix from GCS to CCS, C n ψ ,   C n θ ,   C n γ represent the corresponding matrices for yaw, pitch, and roll in order. As we know, the matrix C n b is the orthogonal matrix, so the rotation matrix C b n is the inverse matrix of C n b , which represents the rotation matrix from CCS to GCS. The matrix C b n can be defined as following Equation (8):
C b n = ( C n b ) T = ( C n b ) 1 = [ c o s ψ c o s γ s i n ψ s i n θ s i n γ s i n ψ c o s θ c o s ψ s i n γ + s i n ψ s i n θ c o s γ s i n ψ c o s γ c o s ψ s i n θ s i n γ c o s ψ c o s θ s i n ψ s i n γ + c o s ψ s i n θ c o s γ c o s θ s i n γ s i n θ c o s θ c o s γ ]
Because the rotation matrix will suffer universal joint deadlock phenomenon and need 9 parameters to store attitude information, the quaternion is the most commonly used method to calculate the attitude. Assuming that the quaternion vector is Q = [ q 0 , q 1 , q 2 , q 3 ] T , the attitude angles expressed in quaternions are as follows in Equation (9):
{ ψ = a r c t a n 2 q 1 q 2 2 q 0 q 3 1 2 q 1 2 2 q 3 2 , ψ ( 0 , 2 π ) θ = arcsin ( 2 q 2 q 3 2 q 0 q 1 ) , θ ( π 2 , π 2 ) γ = a r c t a n 2 q 1 q 2 + 2 q 0 q 2 1 2 q 1 2 2 q 2 2 , γ ( π , π )
The Mahony complementary filter (MCF) [39] utilizes the gyroscope to calculate the attitude angle of the device and the accelerometer and magnetometer are used to complement the accumulated error. When a gyroscope raw data ω = ( ω x , ω y , ω z ) T was obtained, we can use the first-order Runger-Kutta method to obtain the quaternion update as shown in Equations (10) and (11):
Q [ t + t ] = Q [ t ] + t · Ω w [ t ] · Q [ t ]
( q 0 q 1 q 2 q 3 ) t + t = ( q 0 q 1 q 2 q 3 ) t + t 2 · ( 0 ω x ω x 0 ω x ω x ω z ω y ω y ω z ω z ω y 0 ω x ω x 0 ) · ( q 0 q 1 q 2 q 3 ) t
where the Equation (11) is an expansion of the Equation (10), Q [ t ] refers to the quaternion vector of time t , t represents tiny time and is often assigned of sampling cycles, Ω w [ t ] is the corresponding matrix as shown in Equation (11), which is made up of gyroscope raw data at time t . As a result, we can obtain the latest quaternion vector by utilizing the gyroscope data based on the Runger-Kutta method. However, as time goes on, it will suffer a drift problem, resulting in huge cumulative error for long-time orientation. To reduce the drift problem, the acceleration and magnetometer field are used to compensate for the cumulative error. Supposed that the gyroscope error correction is e = [ e x , e y , e z ] T , it can be defined as:
e = e a + e m
where e a ,   e m are the error correction items calculated by accelerometer and magnetometer readings, respectively. They are expressed as e a = [ e a x , e a y , e a z ] T and e m = [ e m x , e m y , e m z ] T , and can be obtained by Equation (13):
{ e a = a n b × a e m = m n b × m
where a , m are the normalized accelerometer and magnetometer readings. a n b , m n b are the normalized vectors of gravity acceleration and magnetic field after matrix C n b conversion. The symbol “ × ” represents the vector cross product. After getting the error correction, the compensated gyroscope value ω = ( ω x , ω y , ω z ) can be calculated based on the proportional-integral (PI) method as follows in Equation (14):
ω = ω + K p · e + K i · e
where K p , K i are the proportional and integral control parameters, respectively. The compensated gyroscope value ω is plugged into the quaternion differential Equation (11) and the quaternion is updated. Then the attitude is obtained by Equation (9) based on the updated quaternion.
In general, K p , K i are fixed empirical values without considering the impact of pedestrian motion status. In our research, we proposed an improved MCF to change the control parameter K p and K i adaptively based on the pedestrian motion status. For simplicity, the pedestrian motion status can be divided into three types including static, walking, and running which can be judged by the standard deviation of triaxial acceleration modulus. The triaxial acceleration modulus can be calculated by Equation (15):
a c c m o d = a c c = a c c x 2 + a c c y 2 + a c c z 2
where a c c and a c c refer to the acceleration vector and the corresponding modulus, respectively. Figure 5 shows the performance of the acceleration modulus on different motion statuses. The dotted green line is an artificial boundary between different motion states. The acceleration modulus is collected for 1 min at the frequency of 50 Hz. People in the first 20 s are in a static state, people in the middle 20 s are in a walking state, and people in the last 20 s are in a running state.
We set up a sliding window to store the acceleration modulus and calculate the standard deviation in the window as shown in Equations (16) and (17).
μ a c c = 1 n · i = 1 n a c c m o d i
σ a c c = 1 n · i = 1 n ( a c c m o d i μ a c c ) 2
where μ a c c is the average acceleration modulus of the sliding window in size n , σ a c c refers to the standard deviation of the sliding window. Then, a moving average filter (MAF) is applied to process the σ a c c value to classify the motion state. Figure 6 demonstrates that the standard deviation of the acceleration modulus is smoother and easier to distinguish after MAF. Therefore, σ a c c can be used to judge different motion states of pedestrians.
In our research, we proposed an improved MCF to change the control parameters K p and K i adaptively based on the pedestrian motion status. The parameters and K i can be calculated by Equations (18) and (19):
K p = { K p · ( σ a c c + 1 ) σ a c c < 0.05   g K p ( σ a c c + 1 ) 0.05   g < σ a c c < 0.2   g 0 0.2 g < σ a c c
K i = { K i · ( σ a c c + 1 ) σ a c c < 0.05   g K i ( σ a c c + 1 ) 0.05 g < σ a c c < 0.2   g 0 0.2   g < σ a c c
The gyroscope is sensitive to changes in motion status which are often accompanied by changes in acceleration. The value of 0.2   g is approximately the average value of running which is almost the boundary from static, walking to fast motion. When the device is in a strenuous state, in which the acceleration mode is bigger than the value g , the attitude is mainly calculated by the gyroscope. The experiments show that the improved Mahony complementary filter based on the motion states has a better performance.

3.4. BLE/PDR Integrated System Based on EKF

PDR is a self-contained algorithm that can provide accurate position information at a short distance but it suffers accumulated errors. BLE fingerprint position accuracy is poor without cumulative error. The positioning result obtained by the BLE fingerprint method at present will not be affected by the previous result. To improve the positioning accuracy, continuity, and stability of the system, two positioning methods are often combined as an integrated system based on the Kalman filter (KF). Since the PDR position method is a non-linear algorithm, the Extended Kalman filter (EKF) is often utilized to replace the KF method to fuse two positioning methods. The hybrid position model mainly includes two models, one is the state transition model and the other is the observation model.
The state transition model is mainly to estimate the state vector which is composited of position coordinates, step length, and heading angle. The state vector is expressed by Equation (20):
X = [ N , E , s , ψ ]
The state transition model is expressed by Equation (21) at time k :
{   N k = N k 1 + s k 1 · c o s ψ k 1 + ω N E k = E k 1 + s k 1 · s i n ψ k 1 + ω E s k = s k 1 + ω s   ψ k = ψ k 1 + ω ψ
where N k and E k are the position coordinates of the PDR position method in the north and east, respectively. s k and ψ are the step length and the heading angle calculated by the PDR method at time k . Further, ω N ,   ω E ,   ω s ,   ω ψ are the corresponding process noise of the state vector. They conform to Gaussian distribution, and their variances are denoted by δ N 2 ,   δ E 2 ,   δ s 2 ,   δ ψ 2 , respectively. The state transition matrix A k is expressed as Equation (22):
A k = [ 1 0 0 1 c o s ψ k 1 0 s i n ψ k 1 0 0 0 0 0 1 0 0 1 ]
The Jacobi matrix A k of A k is expressed as Equation (23):
A k = [ 1 0 0 1 c o s ψ k 1 s k 1 · s i n ψ k 1 s i n ψ k 1 s k 1 · c o s ψ k 1 0 0 0 0 1                                                       0 0                                                       1 ]
The observation model is mainly to estimate the observation vector which is composited of position coordinates of BLE fingerprint position. The observation vector is expressed by Equation (24):
Z = [ N , E ]
The observation model is expressed as follow (25):
    { N k = N k 1 + ω N E k = E k 1 + ω E
where N k and E k are the position coordinates of the BLE fingerprint method in the north and east, respectively, ω N and ω E are the corresponding observation noise that conforms to Gaussian distribution and their variances are δ N 2 , δ E 2 . The observation matrix H k is expressed as Equation (26):
H k = [ 1 0 0 1 0 0 0 0 ]
When the state vector and observation vector are obtained by BLE fingerprint and PDR methods, respectively, the EKF estimation is employed to update the state parameters through time as well as the observation parameters. In the EKF, the process of prior estimation is expressed as follows:
X k = A k · X ^ k 1
P k = A k · P k 1 · A k T + Q k
The Gain matrix is expressed as (29):
G k = P k · H k T · ( H k · P k · H k T + R k )
Then, the state vector and the covariance matrix are updated according to the observations. The update process is written as follows:
X ^ k = X k + G k · ( Z k H k · X k )
P k = P k G k · H k · P k
where X k and X ^ k are the prior and posterior state estimate vector, G k is the gain matrix of EKF, P k and P k are the prior and posterior system covariance matrix, Q k is the covariance matrix of the process noise, R k is the covariance matrix of the observational noise vector. When the integrated system runs, the prior position, step length, and heading angle are obtained by the PDR method. The state vector composed of previous elements and the other observation vector obtained by the BLE position method is input into the fusion method. When the fusion method is cyclically executed, the corrected position results will be obtained.

3.5. A Robust Filter Model

The EKF model described above can effectively suppress the drift error of the PDR method and improve the overall positioning accuracy and stability, but the effect of suppressing the gross error of the BLE fingerprint position is poor. This paper proposes a robust filter model. In the EKF model, the innovation vector r k is expressed as Equation (32):
r k = Z k H k · X k = [ N k N k , E k E k ] = [ N , E ]
where N   and E represent the position coordinate difference in the north and east, respectively. From Equation (32), the r k represents the position coordinate difference between the BLE and PDR methods.
When there are gross errors in the positioning method, there are the following situations:
  • The difference N exceeds the limit;
  • The difference E exceeds the limit;
  • The innovation vector r k exceeds the limit, N and E are within the acceptable range;
  • The difference N ,   E , and the innovation vector r k exceed the limit.
Therefore, to judge whether there is a gross error in the process of position, it is necessary to determine the distribution of the N ,   E and r k .
In the EKF method, Z k should conform to Gaussian distribution with mean H k X k and covariance P k r as shown in Equation (33). The innovation vector r k conforms to Gaussian distribution with mean 0, covariance P k r .
P k r = H k · P k · H k T + R k
while the difference N conforms to the Gaussian distribution with mean 0, covariance δ N 2 and the difference E conforms to the Gaussian distribution with mean 0, covariance δ N 2 .
δ N 2 = [ 1 0 ] · P k r · [ 1 0 ]
δ E 2 = [ 0 1 ] · P k r · [ 0 1 ]
λ N = N     N ( 0 , δ N 2 )
λ E = E     N ( 0 , δ E 2 )
The squared Mahalanobis distance M k of r k conforms to the chi-square distribution χ m , α 2 with the freedom m which is the dimension of the observation Z k .
λ r = M k 2 = r k T ( P k r ) 1 r k     χ m , α 2
The chi-square distribution χ m , α 2 is constructed to determine whether the actual vector r k calculated in the EKF exceeds the limit under the Gaussian assumption. Significance level α is the probability threshold and 5% is adopted in our research.
P r [ λ r > χ m , α 2 ] < α
where P r represents the probability of a random event that the probability of λ r being larger than χ m , α 2 is very small. Hence, if the actual r k is larger than the α -quantile, the null hypotheses are rejected and it can be concluded that r k exceeds the limit and Z k has a gross error in the positioning. For N and E , when the actual measurements are larger than twice the corresponding standard deviation, the significance level is less than 5%, and it can be concluded that N or E or both exceed the limit and Z k has a gross error.
When the vector Z k has a gross error, the observational covariance matrix R k should multiply a robust vector:
R ¯ k = β k T · R k · β k
where R k represents vector. R ¯ k is the modified observation covariance matrix. When the vector Z k has a gross error in the first situation, the robust vector β k is constructed as follows:
β k = [ λ N δ N 1 ] T
When the vector Z k has a gross error in the second situation, the robust vector β k is constructed as follows:
β k = [ 1 λ E δ E ] T
When the vector Z k has a gross error in the third situation, the robust vector β k is constructed as follows:
β k = [ λ r χ m , α 2 λ r χ m , α 2 ] T
When the vector Z k has a gross error in the fourth situation, the robust vector β k is constructed as follows:
β k = [ λ N δ N + λ r χ m , α 2 λ E δ E + λ r χ m , α 2 ] T s s
According to the above method, the robust filter can effectively restrain the gross error in the observation vector Z k . In practice, it is possible for the matrix R k to be modified even there is no gross error in the observation Z k .
At last, we proposed the BLE/PDR integrated System localization framework in the following diagram of Figure 7. In the PDR position method, the gyroscope readings are used to compute the heading angle and the accelerations and magnetometer are utilized to compensate for accumulated error as well. To improve the accuracy of the heading angle, people’s motion status is considered in correcting the control parameters of MCF. The accelerations are also used to detect the steps and estimate the step length. With the step length and heading angle, a position is computed by the PDR method. The other position is obtained by the BLE fingerprint method at the same time. Then, two positioning estimations are input into the Extend Kalman filter to resolve the fusion position. To improve the integrated system robustness and scalability, a robust filter is used to restrain the gross error of BLE observational position results.

4. Experiments and Analysis

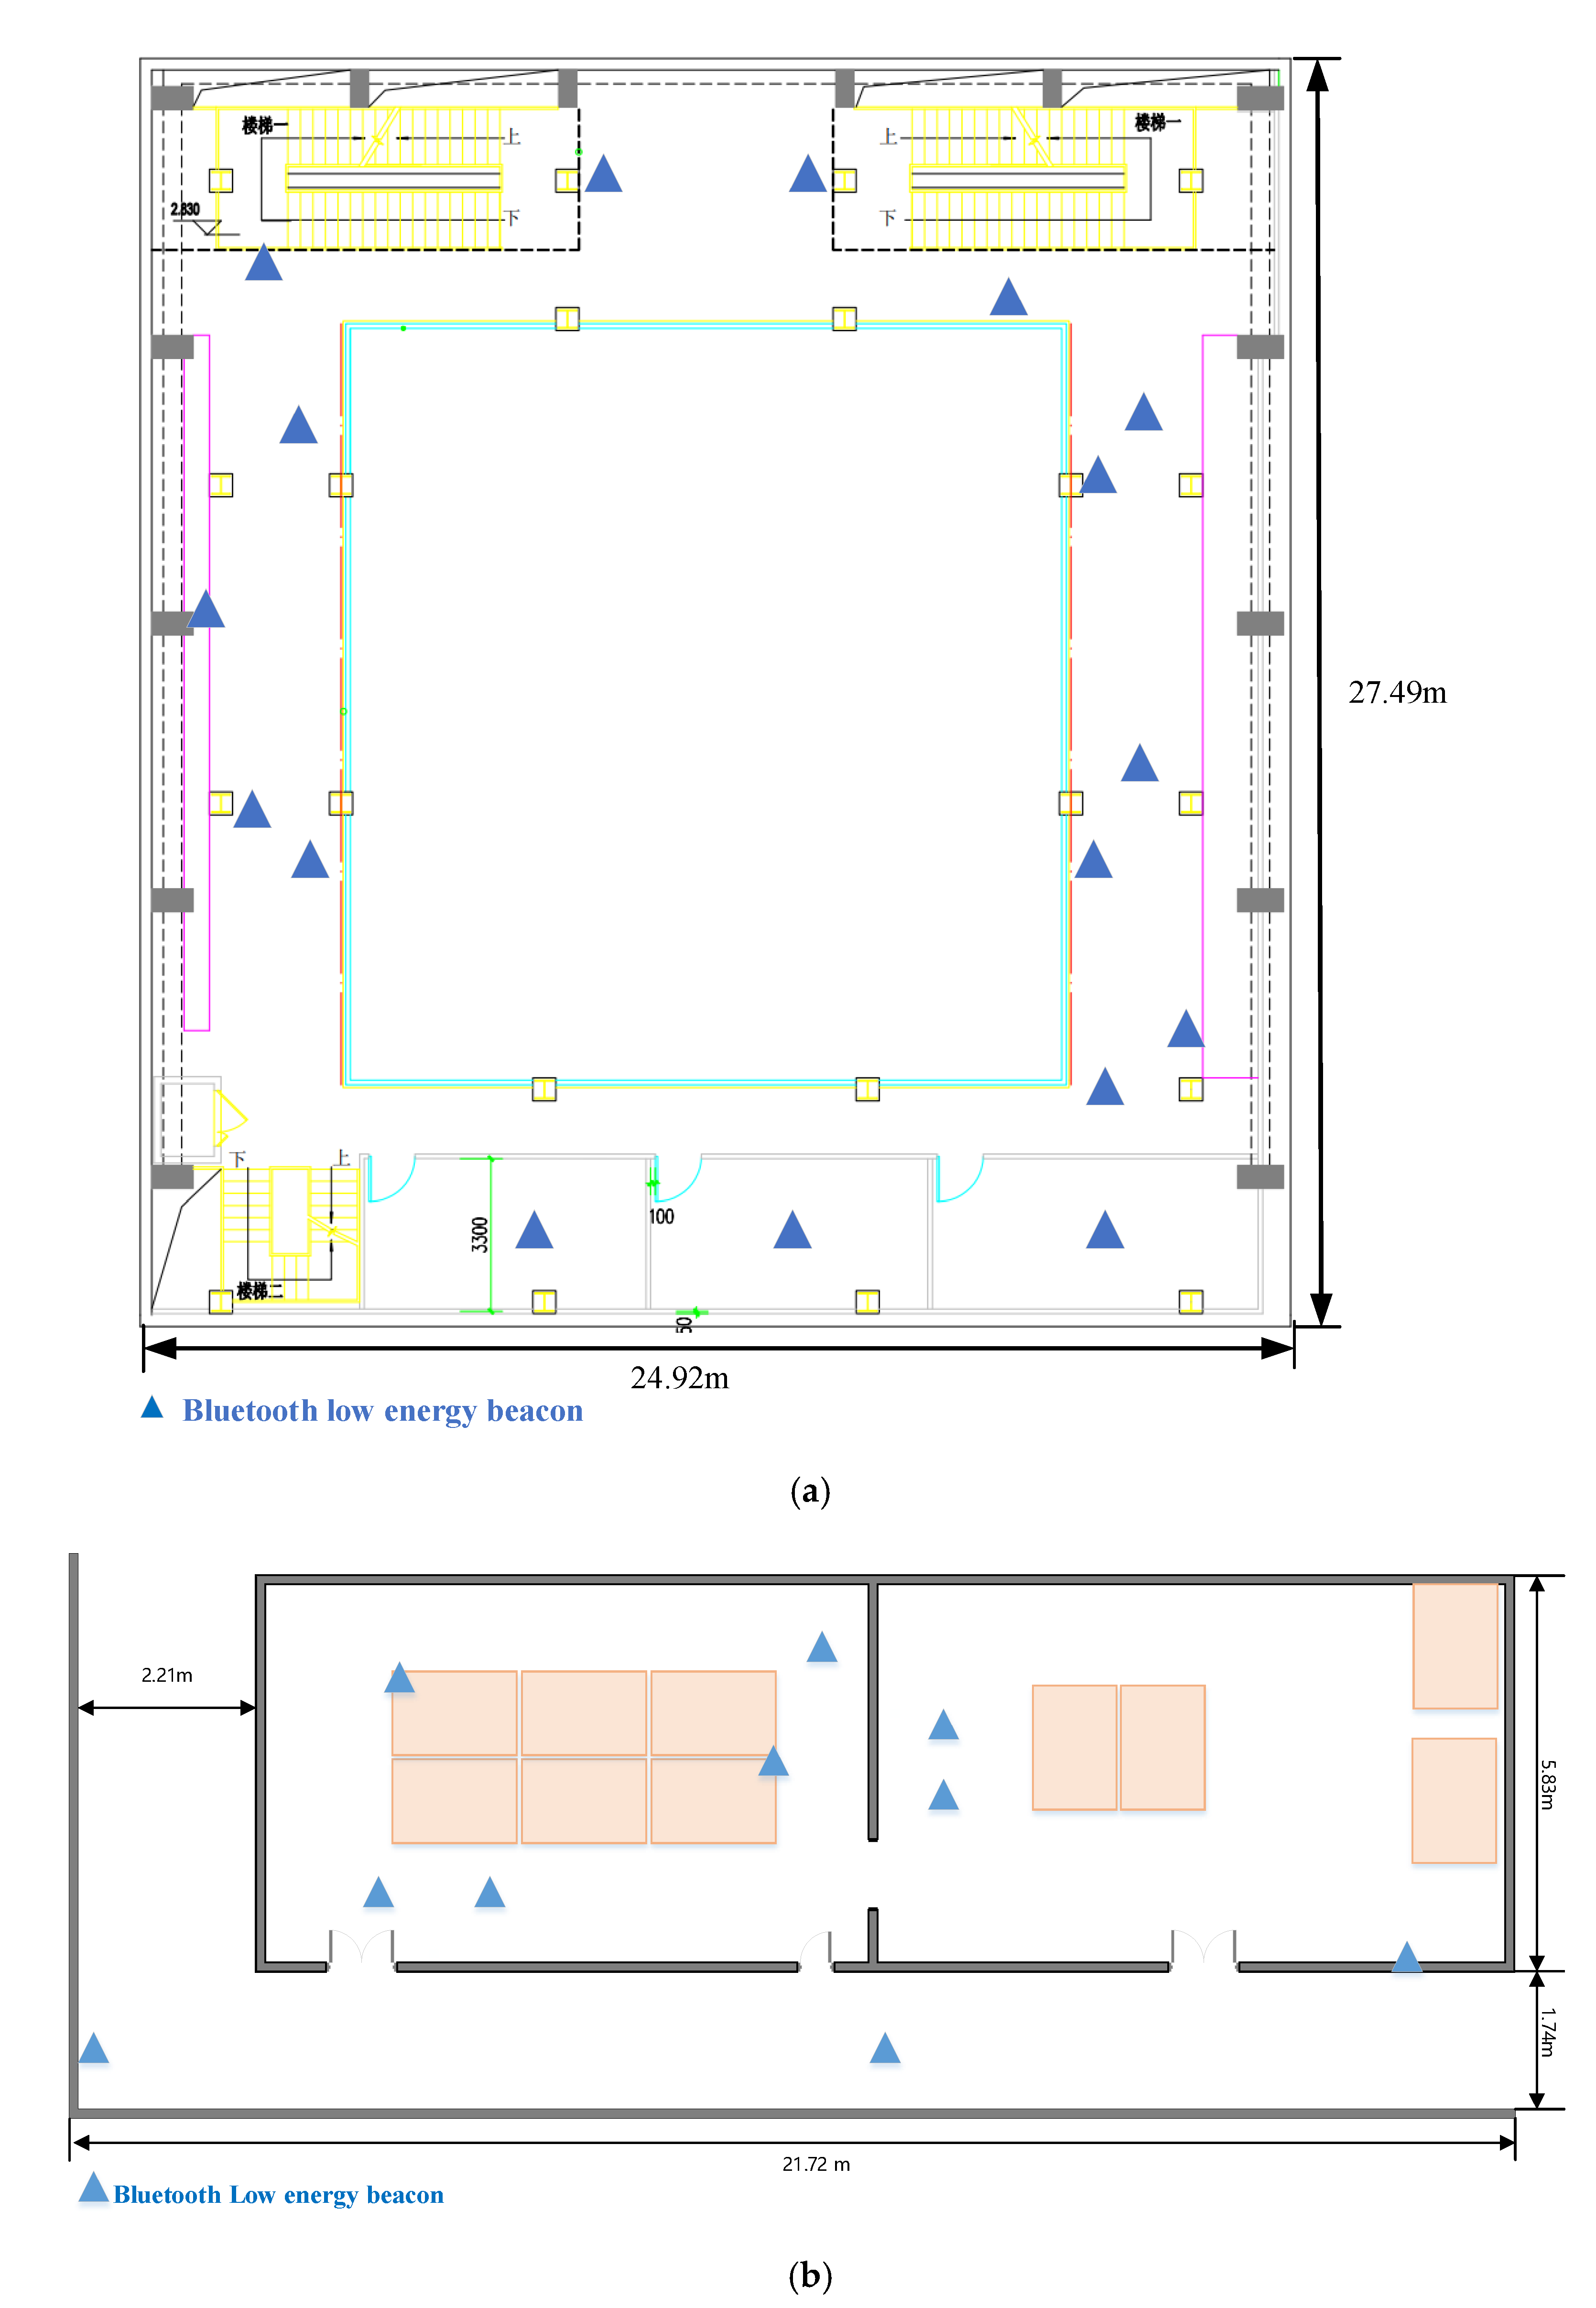
4.1. BLE Fingerprint Position Experiments and Error Analysis

The experiments were set up on the second floor of the C7 test site which has three floors in the 54th Research Institute of China Electronics Technology Group Corporation as shown in Figure 8. The second-floor test site is 24.92 m long and 27.49 m wide which consists of a rectangular corridor and several rooms. The center part of Figure 8 is a hollow space enclosed with glass. When the radio signal of BLE propagates, there is a severe multipath effect. There are 54 Bluetooth beacons installed on the whole C7 test site and 18 on each floor. The deployment of the Bluetooth beacon in Figure 8 is based on the principle of optimizing beacon placement by maximizing localization accuracy and satisfying a predefined coverage degree [23]. The HUAWEI P20 smartphone was chosen as the test device. In Figure 8, the blue triangle refers to the Bluetooth low energy beacon and there are 18 BLE beacons were installed on the second-floor test site. For the BLE fingerprint position method, all of the BLE beacons installed on the C7 test site were utilized to collect signals for the experiment. Another scenario called 331 test site had been chosen to conduct a comparison experiment. The test site is 21.72 m long and 7.75 m wide. The deployment of the Bluetooth beacon in the 331 test site is upon the same optimization solution as C7.
Then we carried out a BLE fingerprint positioning experiment in this position scenario. The BLE fingerprint database was constructed in advance. People stranded with the HUAWEI P20 at each known RP to collect data for 7 s, the time is set randomly. Then the data was processed per second into real-time fingerprint data. In the actual acquisition process, only 6 s of data were collected at some RPs. There were real-time 332 BLE fingerprint data collected at 48 RPs for fingerprint position. We calculated the positioning results through the KNN matching method and compared them with the true coordinates of RPs to obtain the position error. We analyzed the gross error of the BLE fingerprint method, whose error is larger than twice the standard deviation under the Gaussian distribution. Then we picked out the gross error caused by the few numbers of scanning RSSI which is less than 5 and we eliminate the corresponding fingerprint. Finally, we recalculate the position error, and both position errors were obtained and they were illustrated in Table 1 and Figure 9.
As shown in Table 1, after eliminating the few numbers of scanning RSSI real-time fingerprints, the mean position accuracy and the root-mean-square error (RMSE) were 2.312 m and 2.043 m, respectively. Compared with all data on the BLE fingerprint method, the position accuracy was reduced by 0.5220 m and RMSE decreased by 1.064 m. In Figure 8, the blue line refers to the result of all real-time fingerprint data and the green line refers to eliminating the few numbers of scanning RSSI real-time fingerprints. The red dashed line represents twice the standard deviation which means the position error that exceeds the red dashed line is a gross error. From Figure 9a, the gross error number shown in the green line is greatly reduced compared with the blue line. Figure 9b indicates that the method of eliminating the few numbers of scanning RSSI has a higher confidence level than the BLE fingerprint method. From the statistics of gross errors, the total number of gross errors is 31. Among them, the number of gross errors caused by the few numbers of scanning RSSI is 17, accounting for about 54.8%. Therefore, we can conclude that the causes of gross errors in the BLE fingerprint method are not only caused by signal fluctuations but also affected by the few numbers of scanning RSSI. It is necessary to find a robust filter to restrain the gross error of the BLE fingerprint method.

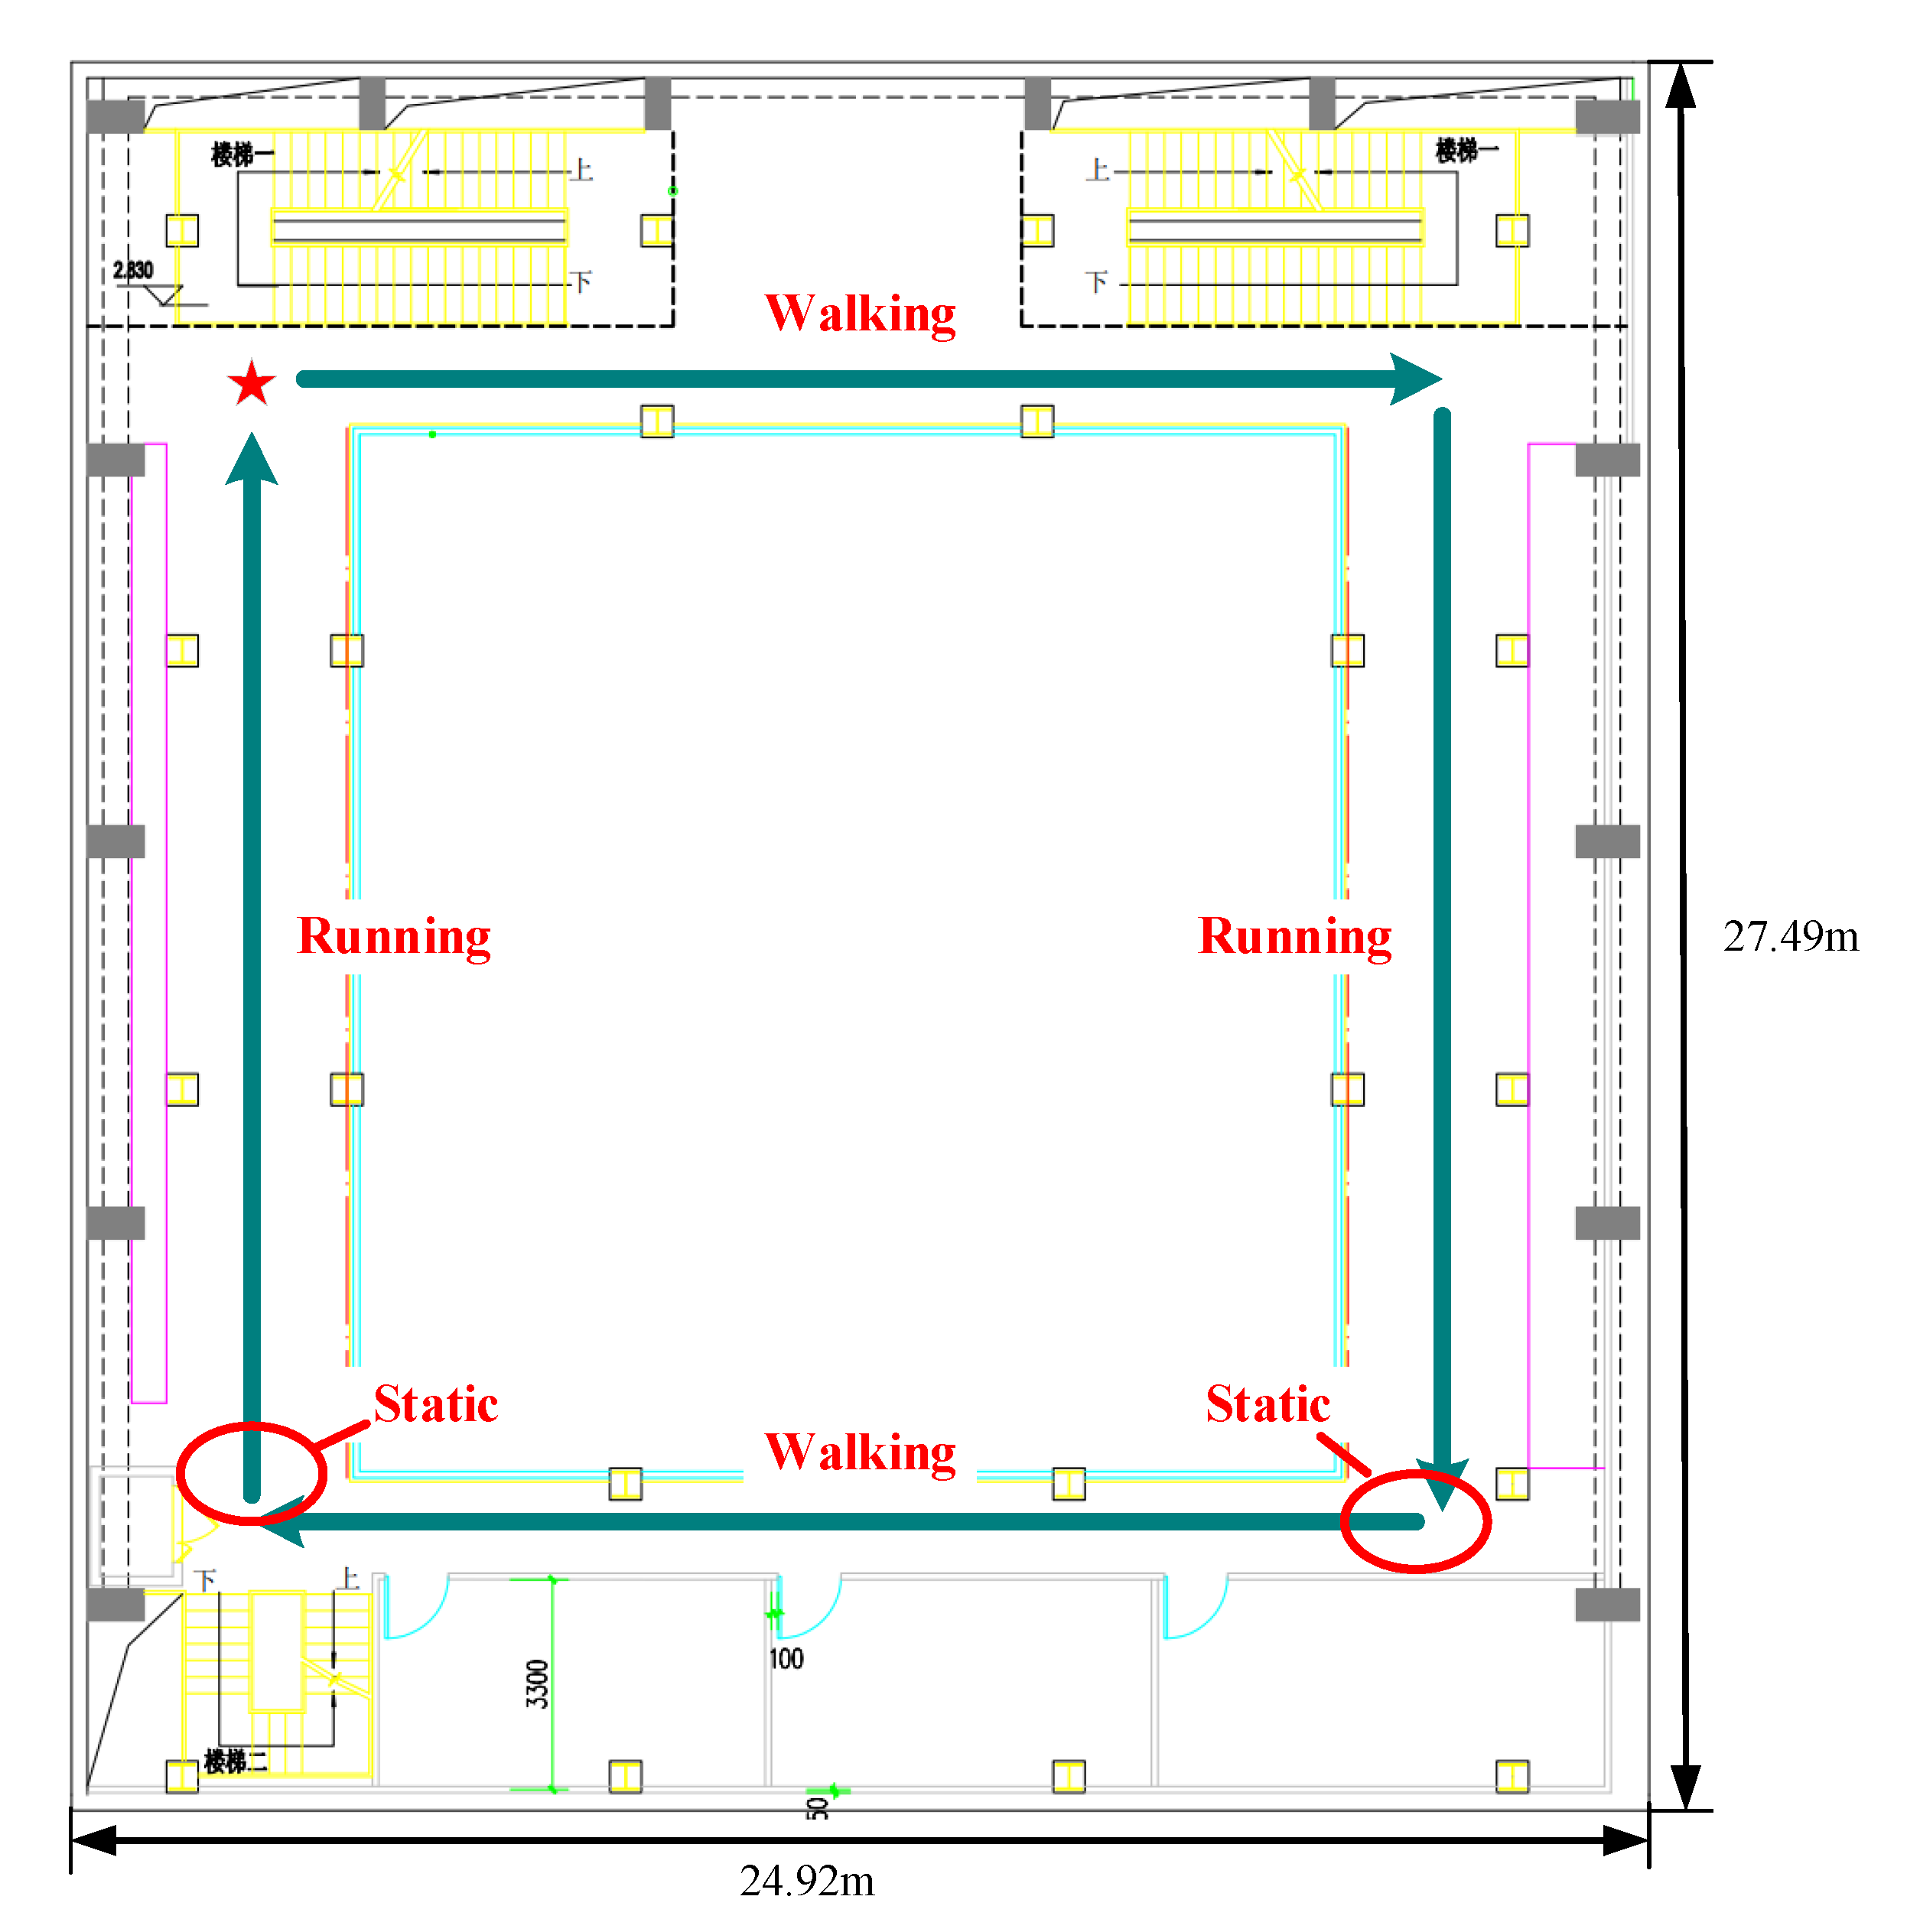
4.2. Heading Estimation Based on Motion States

The experiment about heading estimation was carried out in the same position scenario as shown in Figure 9.
In Figure 10, the red star refers to the start point and endpoint of the trajectory. The dark green line represents the trajectory and the arrow represents the direction. The current motion state is indicated on each trajectory which includes walking and running. The static state of the pedestrian is contained inside the red ellipse. The pedestrian walked along the dark green trajectory with different motion states.
Then the heading is estimated by different methods as shown in the following Figure 11.
Four methods were utilized to estimate the heading angle. In Figure 11, the blue line refers to the heading angle estimated by the electronic compass while the magenta line, red line, and green line were represented as gyroscope-based, Mahony, and improved Mahony based on motion state methods, respectively. The black line denoted the true heading. From Figure 10, the accuracy of the heading angle estimated by the electronic compass was poor and suffered severe fluctuation, but it would be no drift for a long time. In contrast, the heading estimated by gyroscope did not have severe fluctuation but would suffer huge drift problems that would distort the heading.
For the MCF method, the control parameters K p and K i were given two values of 0.001 and 0.000001, respectively. The MCF performed well in the early state but would suffer little drift for a long time without the adaptive parameter adjustment based on the motion state. From the partially enlarged view of the last trajectory, the heading estimated by the improved Mahony based on the motion state was the most accurate, which fluctuated around the true angle and had no cumulative error. Finally, a diagram of different motion states of experiment trajectory is shown in Figure 12 which contained a semi-transparent layer of heading estimation for comparison. It could be concluded that the heading estimation is closely related to the motion state. When stationary, the heading estimation was relatively stable when walking or moving, and the heading would fluctuate.

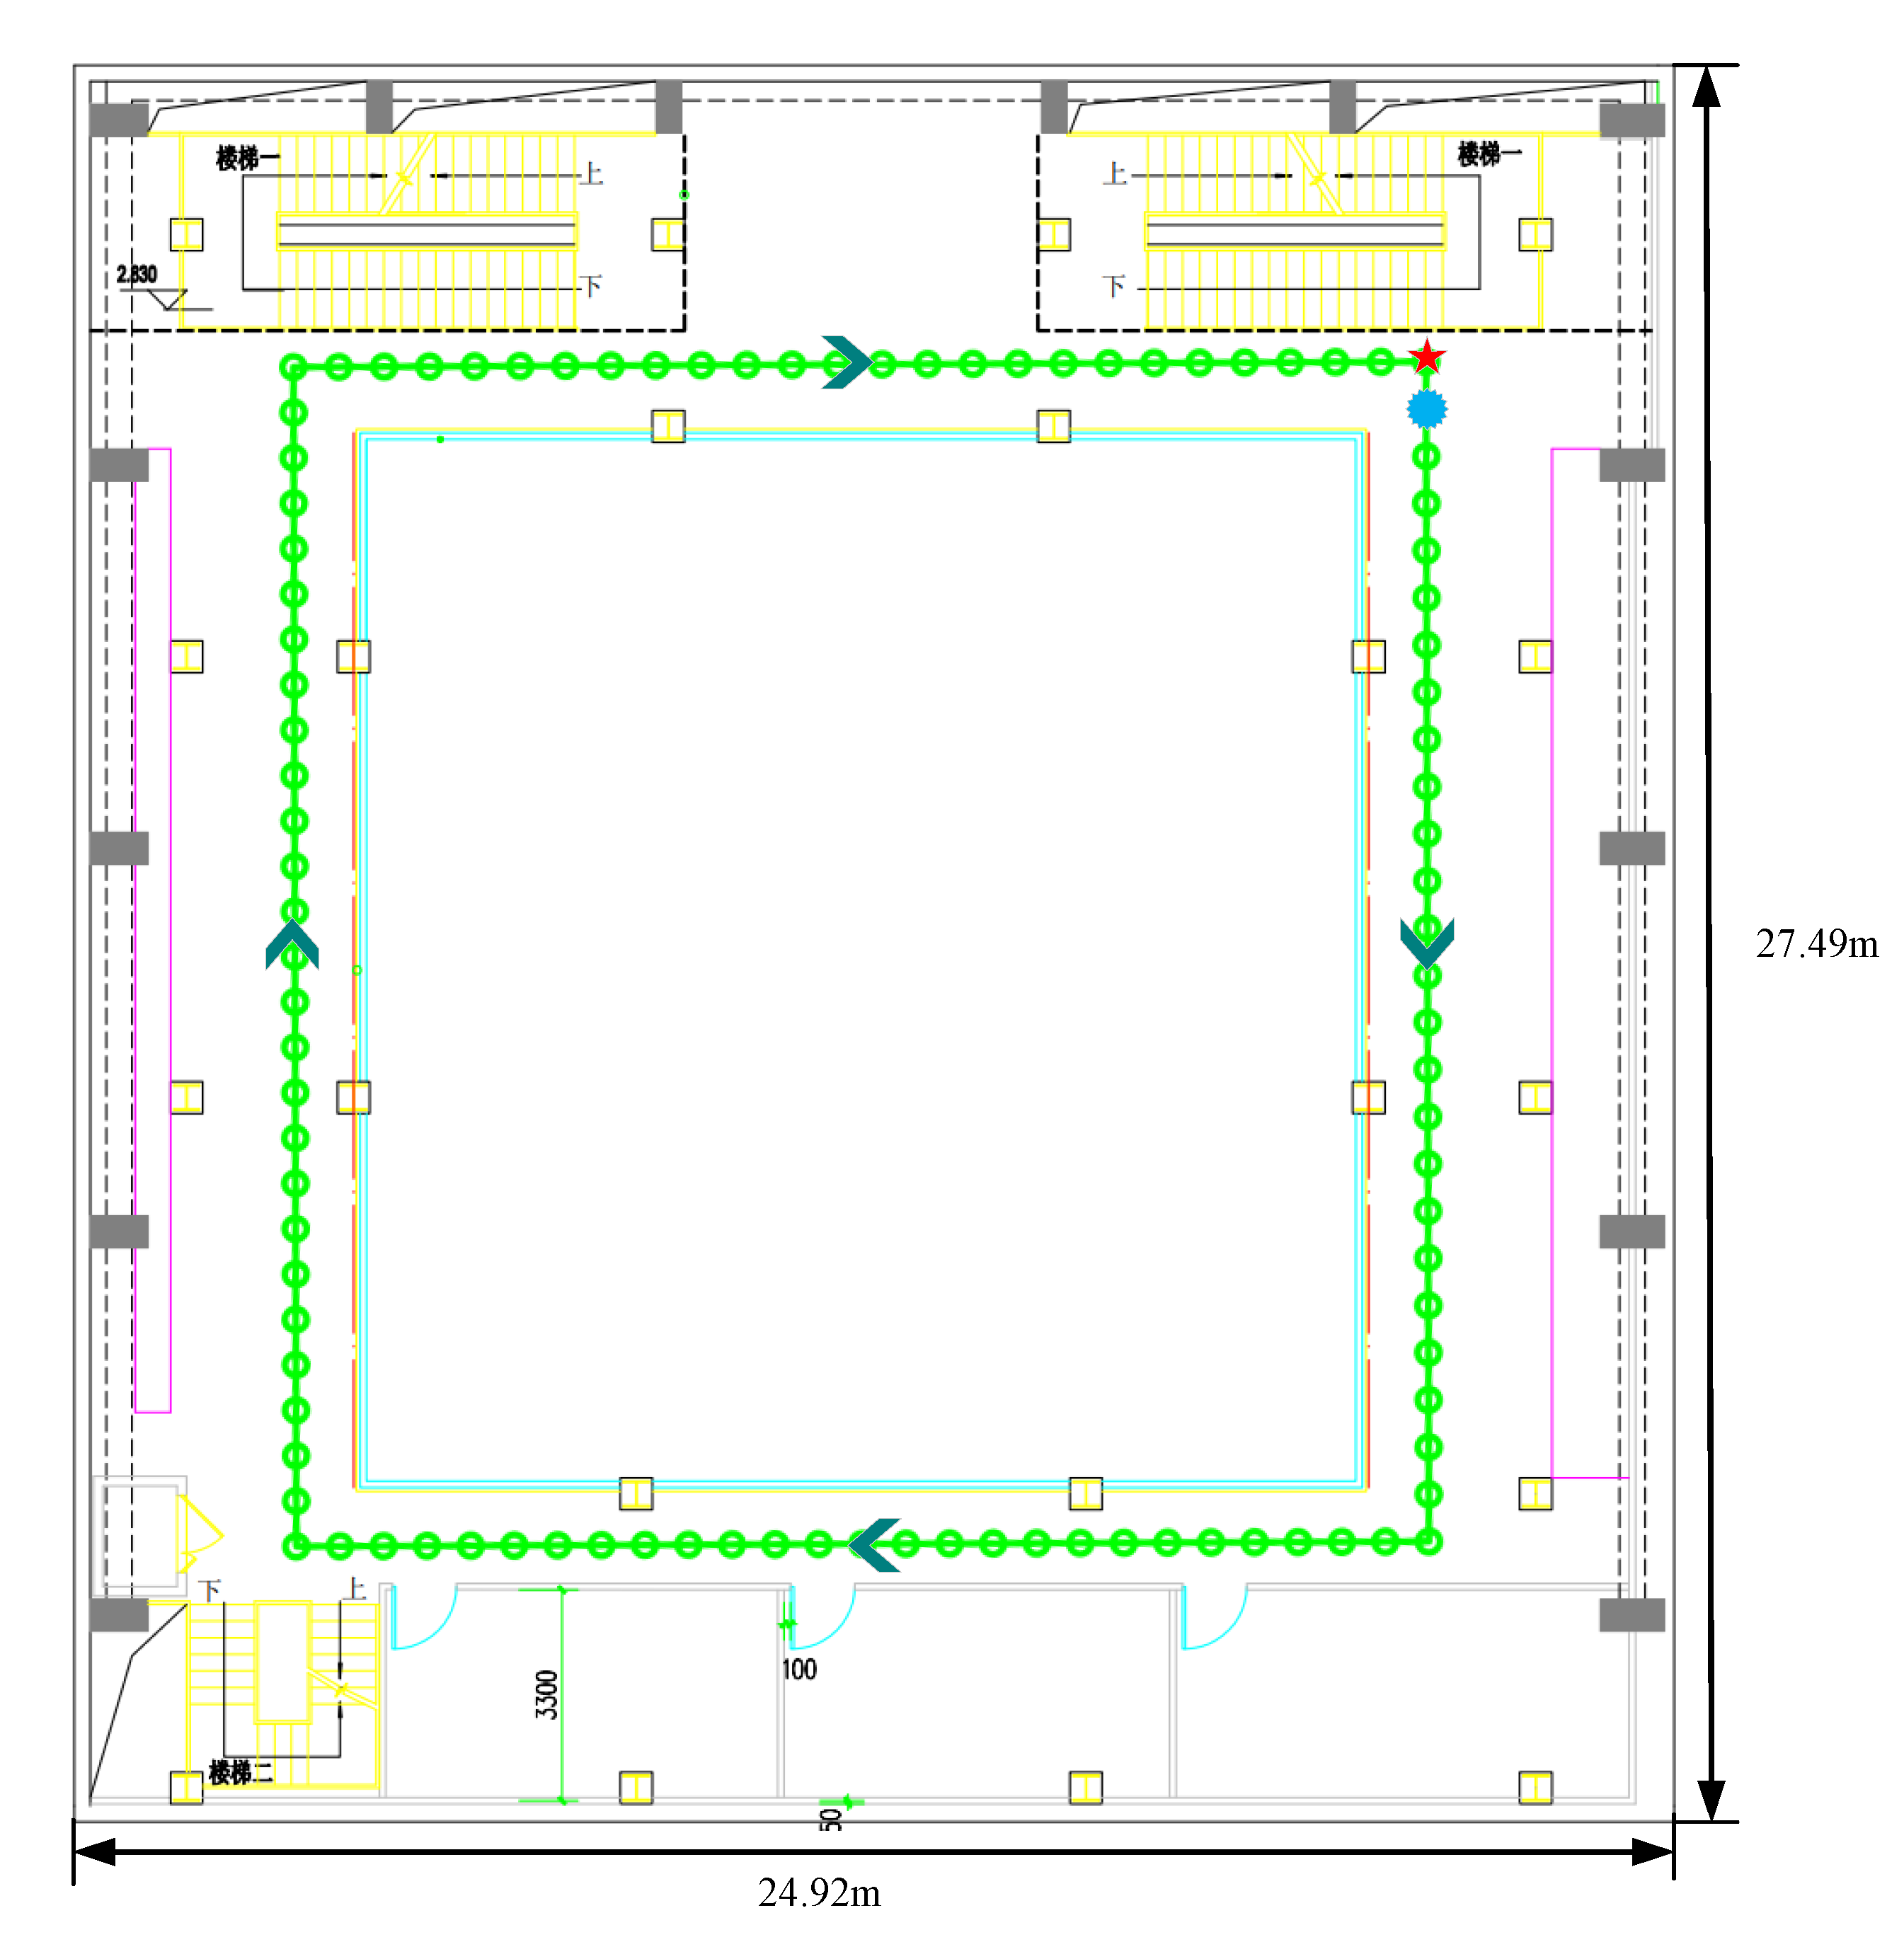
4.3. BLE/PDR Integrated System Position Experiment

The BLE/PDR integrated system position experiment was carried out in the C7 test site. The BLE AP routers and the smartphone used in the experiment are the same as in the experiment of Section 3.1. The new trajectory was planned and was shown in Figure 13.
In Figure 13, the red star and blue cycle refer to the start point endpoint of the trajectory, respectively. The green dotted line represents the reference trajectory and the arrow represents the direction. During the experiment, the data sampling frequency of PDR was set as 50 Hz and the smartphone scanned the BLE APs per second. The pedestrian started from the start point and reached the endpoint at a constant speed. The pedestrian held the smartphone level and walked 107 steps in total during the experiment. Another integrated system position experiment was conducted at the 331 test site. The comparison results of the different methods were shown in Figure 16.
To validate the efficiency of the robust filter method, another two methods, the BLE fingerprint method and the EKF method, were also utilized for the experiment. Position errors of the three methods were computed concerning the reference points for evaluation. Figure 14a showed the time series of the position errors and (b) showed the corresponding cumulative distribution errors.
In the above figure, the blue line refers to the BLE fingerprint method. The red line and green line represent the EKF and robust filter methods, respectively. From the value and distribution of the position error, the robust filter method denoted by the green line performs best. The cumulative distribution of the robust filter indicates that it has a higher confidence level than the other two methods. About 74% of the position error of points are lower than 1 m and about 86% of the position error of points are lower than 2 m. Compared with the common EKF, these two indicators are increased by 38% and 18%, respectively. Then, Table 2 shows the detail of the mean error and RMSE of the three methods.
As shown in Table 2. The mean position accuracy and the RMSE of the robust filter method are 0.844 m and 0.745 m respectively. Comparing with the EKF and BLE fingerprint methods, the position accuracies were reduced by 1.116 m and 1.803 m, and the RMSEs were decreased by 1.982 m and 0.982 m. From the perspective of max value, the max value of the robust filter is 2.641 m which is also significantly reduced. The figure and table mentioned above show that the proposed robust filter can not only reduce the position error but also improve the stability.
Figure 15 shows the trajectory of three methods in the true position scenario at the C7 test site. Another fusion method particle filter is also utilized to solve the result as a comparison experiment.
The blue line, red line, green line, and dark green line represent the trajectory of BLE fingerprint, EKF, robust filter methods, and reference trajectory, respectively. In Figure 15a, some jump points, which mean the gross error surrounded by the red circle, appear in the BLE fingerprint method or the EKF method. The robust filter can improve the observation matrix based on detecting the gross errors and get a smooth trajectory without jump points. We can see that the proposed robust filter performs better than the other two methods in (b). (c) and (d) are the results of different hybrid positioning methods under two trajectories. From the comparison of the curves with the real trajectory in (c) and (d), the proposed method is superior to the classical EKF. The particle filter also performs well in some positions compared to the proposed method. However, the particle filter requires the construction of a large number of particles requiring a heavy computational load. The proposed method is more suitable for real-time localization than the particle filter method. Another comparison of the experimental results of the integrated system was conducted in the 331 test site and the results were shown in Figure 16. From Figure 16, the green line that represents the proposed method is closer to the real track and smoother in some corners compared to other methods. Although the test paths are relatively short because of the extent of the experimental scenarios, the two methods of fusion position have different principles, in which PDR has high instantaneous accuracy but suffers cumulative errors, and the real-time Bluetooth fingerprint method can compensate for this shortcoming based on the robust filter. Therefore, even with the test paths becoming longer, there will be no cumulative error to make the path diverge. We can conclude that the proposed method makes it possible to have similar improvement under different circumstances.

5. Discussion

In the process of real-time positioning, poor position results may be obtained by the BLE fingerprint method. The heading of the device is affected by different motion states of people. Then we get rid of the bad results of the BLE fingerprint method when the scanning number of RSSI is smaller than 5. We correct the heading based on different motion states. Even if the BLE fingerprint method and PDR are integrated, the gross error is difficult to be suppressed. Compared with the adaptive and robust filter proposed in the research of Li et al. [27], the robust filter proposed in this paper considering the error distribution in more conditions and provides a robust vector instead of a numerical correction. The experimental results conducted on the true position scenario show that the proposed method can detect, suppress the gross errors and make the results smoother. The mean position accuracy of the proposed robust filter was 0.844 m and RMSE was 0.745. The experiments are in line with expectations. From Figure 14, we can find that the green points obtained by the robust filter are far away from the true position. The reason for this is the bad position results caused by the BLE fingerprint method at the previous few steps. The jump points in blue color have occurred continuously. The robust filter can only suppress gross errors but not eliminate them. If gross errors occur continuously, then the results will deviate from the true trajectory and it would take some time to converge. We will improve the method by considering the situation of continuous gross errors to get better results in future research work.

6. Conclusions

In this paper, we concentrated on the real-time BLE/PDR integrated System and fusion method. For BLE real-time fingerprint, we found that the position error of BLE is not only with the signal fluctuation but also with the scanned number of BLE APs. If the scanned number is too few, there will easily be gross errors. Next, we introduced the method of commonly used attitude methods and an improved Mahony complementary filter is proposed to estimate the heading angle under different motion states. Finally, a robust filter model was proposed to fusion the BLE/PDR methods because of the gross error in the BLE method. We conducted an experiment to validate the efficiency of the proposed method in the true position scenario. The mean position accuracy obtained by the robust filter was 0.844 m and RMSE was 0.745. The experiment showed that the proposed method has better performance in positioning accuracy and stability. The experimental scenario in this paper is surrounded by glass in the center, which has serious multi-path effects for the fingerprint positioning method and can easily cause coarse errors. The classic Kalman filter or Extended Kalman filter is not effective for coarse difference suppression. The proposed method can detect gross errors at different granularities and suppress them. The fusion methods based on the KNN and EKF are suitable for the high-real-time requirements of the positioning applications, keeping a balance between computational efficiency and position accuracy. The estimation of the heading angle is more stable based on the people’s motion states. However, the effect of different pedestrian motion states on hybrid positioning was not analyzed in detail. In addition to the detection and suppression of coarse differences in the observation noise matrix, some modifications of the state transition matrix will be made based on the people’s motion states. How the variance matrix of process noise adaptively changes according to the people’s motion states will be investigated in-depth in future work. Combined with other positioning methods such as map matching, landmarks matching for multi-mode fusion positioning will be considered too.

Author Contributions

Conceptualization, S.X.; Formal analysis, S.X. and M.S. (Meng Sun); Funding acquisition, Y.W.; Methodology, S.X.; Project administration, Y.W.; Data curation, H.C. and M.S. (Minghao Si); Writing-original draft preparation, S.X. All authors have read and agreed to the published version of the manuscript.

Funding

This research was funded by the National Key Research and Development Program of China under grant number 2016YFB0502102.

Institutional Review Board Statement

Not application.

Informed Consent Statement

Not applicable.

Data Availability Statement

The experiment uses an internal data set and the data presented in this study are available on request from the corresponding author.

Conflicts of Interest

The authors declare no conflict of interest. The funding sponsors had no role in the design of the study; in the writing of the manuscript; and in the decision to publish the results.

Abbreviations

r s s i Received signal strength indicator
E k The east coordinate in the pedestrian dead reckoning at time   k
N k The north coordinate in the pedestrian dead reckoning at time   k
s k The step length at time
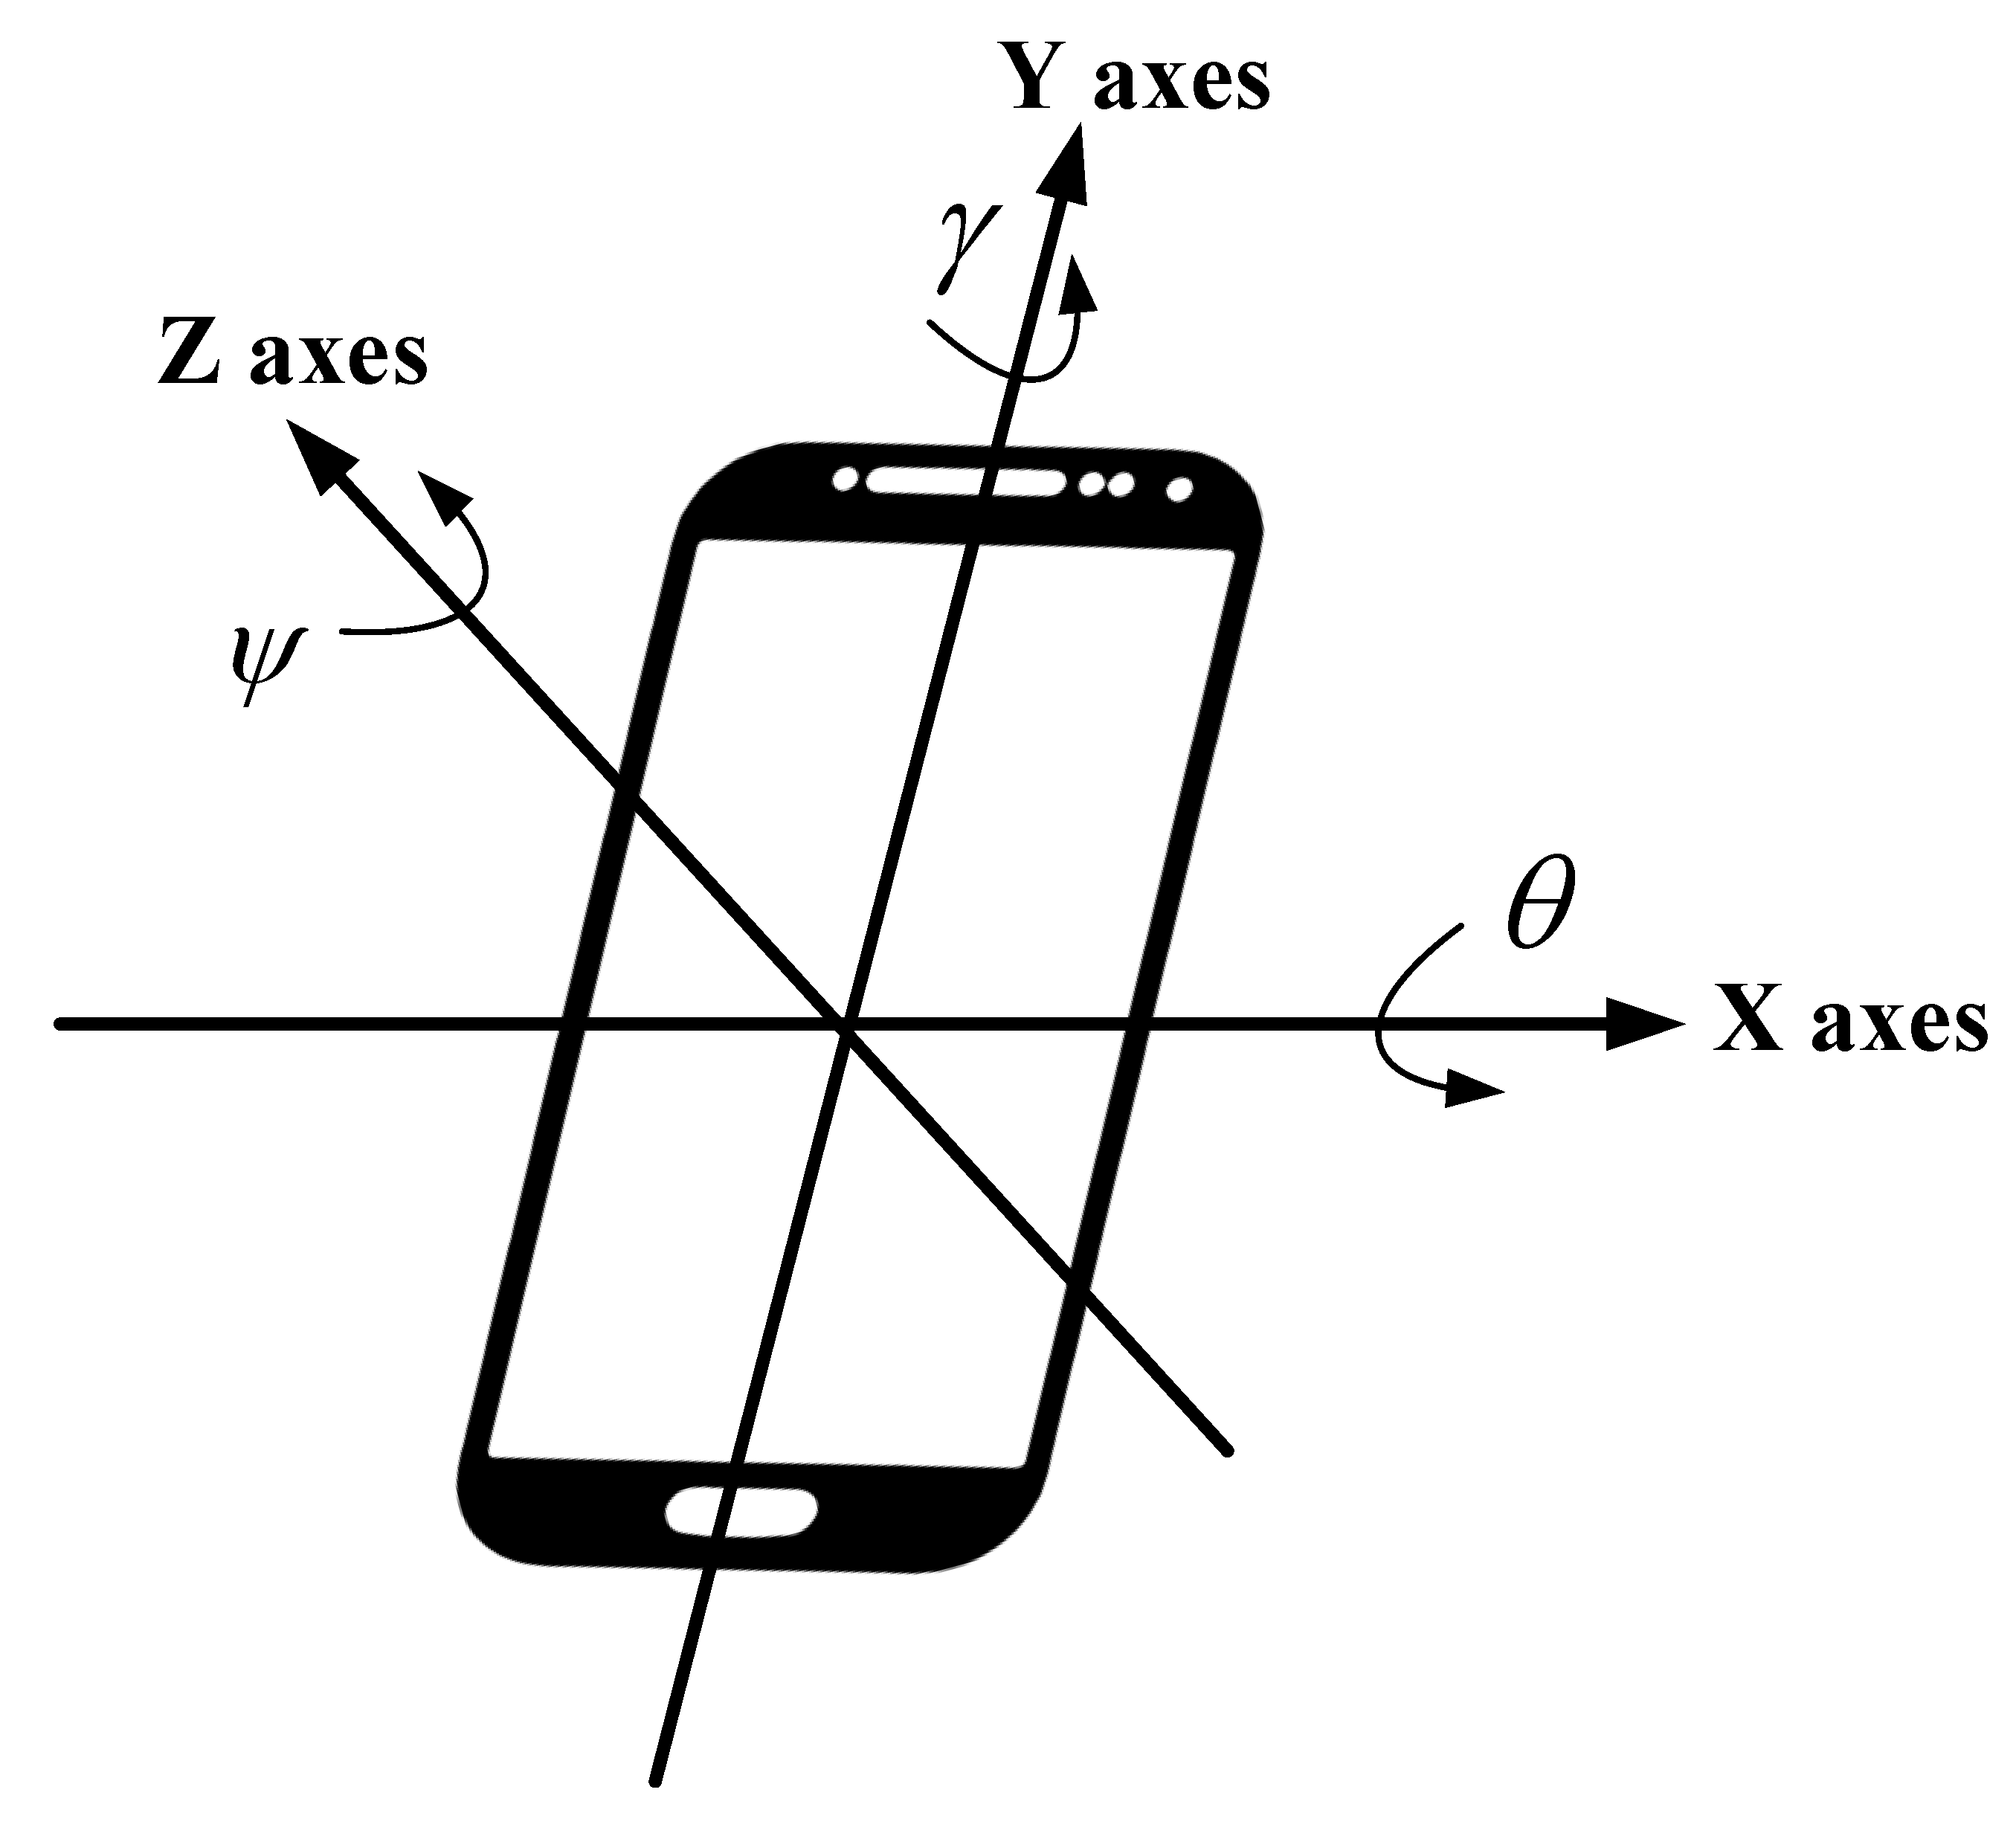
   k
ψ The heading angle
θ The pitch angle
γ The roll angle
C n b Refer to the rotation matrix from the geographic coordinate system to the carrier coordinate system
C b n Refer to the rotation matrix from the carrier system to the carrier coordinate system
Q The quaternion vector
q i The ith item of the quaternion vector
e Refer to the error correction in the Runger-Kutta method
K p The proportional control parameters in the proportional-integral method
K i The integral control parameters in the proportional-integral method
ω Refer to the gyroscope data in Section 3.3
m Refer to the magnetometer data in Section 3.3
a Refer to the accelerometer data in Section 3.3
g Refer to the acceleration of gravity in Section 3.3
μ a c c The average acceleration modulus
σ a c c The standard deviation of acceleration modulus
X Refer to the state vector in the EKF
ω N The process noise of the north coordinate in Section 3.4
ω E The process noise of the east coordinate in Section 3.4
ω s The process noise of the step length in Section 3.4
ω ψ The process noise of the heading angle in Section 3.4
δ N 2 The variances of the north coordinate process noise
δ E 2 The variances of the east coordinate process noise
δ s 2 The variances of the step length process noise
δ ψ 2 The variances of the heading angle process noise
A k The state transition matrix in the EKF
A k The Jacobi matrix of A k
Z Refer to the observation vector in the EKF
N k The north coordinate of observation at time   k
E k The east coordinate of observation at time   k
ω N The observation noise of the north coordinate
ω E The observation noise of the east coordinate
δ N 2 The variances of the north coordinate observation noise
δ E 2 The variances of the east coordinate observation noise
H k The observation matrix at time   k
P k Refer to the prior system covariance matrix in the EKF
P k Refer to the posterior system covariance matrix in the EKF
G k Refer to the gain matrix of the EKF
Q k Refer to the covariance matrix of the process noise in the EKF
R k Refer to the covariance matrix of the observational noise vector in the EKF
N Refer to the position coordinate difference in the north
E Refer to the position coordinate difference in the east
r k The innovation vector consisting of N and E , which represents the position coordinate difference between two methods in the EKF
P k r Refer to the covariance of the innovation vector in the EKF
λ N Refer to the distribution of the position coordinate in the north
λ E Refer to the distribution of the position coordinate in the east
λ r The distribution of the squared mahalanobis distance of the innovation vector
χ m , α 2 The symbol of chi-square distribution with eh freedom   m
α The significance level of the distribution
β k The robust vector defined in the paper which is utilized to modify the observation noise covariance matrix
R ¯ k Refer to the modified observation noise covariance matrix

References

  1. Zhang, W.; Hua, X.; Yu, K.; Qiu, W.; Zhang, S.; He, X. A novel WiFi indoor positioning strategy based on weighted squared Euclidean distance and local principal gradient direction. Sens. Rev. 2019, 39, 99–106. [Google Scholar] [CrossRef]
  2. Wei, S.; Min, X.; Hongshan, Y.; Hongwei, T.; Anping, L. Augmentation of Fingerprints for Indoor WiFi Localization Based on Gaussian Process Regression. IEEE Trans. Veh. Technol. 2018, 67, 10896–10905. [Google Scholar]
  3. Song, X.; Fan, X.; Xiang, C.; Ye, Q.; Liu, L.; Wang, Z.; He, X.; Yang, N.; Fang, G. A Novel Convolutional Neural Network Based Indoor Localization Framework With WiFi Fingerprinting. IEEE Access 2019, 7, 110698–110709. [Google Scholar] [CrossRef]
  4. Topak, F.; Pekeriçli, M.K.; Tanyer, A.M. Technological Viability Assessment of Bluetooth Low Energy Technology for Indoor Localization. J. Comput. Civ. Eng. 2018, 32, 04018034. [Google Scholar] [CrossRef]
  5. Chen, L.; Pei, L.; Kuusniemi, H.; Chen, Y.; Kröger, T.; Chen, R. Bayesian Fusion for Indoor Positioning Using Bluetooth Fingerprints. Wirel. Pers. Commun. 2013, 70, 1735–1745. [Google Scholar] [CrossRef]
  6. He, X.; Ye, D.; Peng, L.; Ruchuan, W.; Yizhu, L. An RFID Indoor Positioning Algorithm Based on Bayesian Probability and K-Nearest Neighbor. Sensors 2017, 17, 1806. [Google Scholar]
  7. Zhang, D.; Yang, L.T.; Chen, M.; Zhao, S.; Guo, M.; Zhang, Y. Real-Time Locating Systems Using Active RFID for Internet of Things. IEEE Syst. J. 2016, 10, 1226–1235. [Google Scholar] [CrossRef]
  8. Khyam, M.O.; Rahim, N.-A.; Li, X.; Ritz, C.; Guan, Y.L.; Ge, S.S. Design of Chirp Waveforms for Multiple-Access Ultrasonic Indoor Positioning. IEEE Sens. J. 2018, 18, 6375–6390. [Google Scholar] [CrossRef]
  9. Lee, C.; Chang, Y.; Park, G.; Ryu, J.; Jeong, S.-G.; Park, S.; Park, J.W.; Lee, H.C.; Hong, K.-S.; Lee, M.H. Indoor positioning system based on incident angles of infrared emitters. In Proceedings of the 30th Annual Conference of IEEE Industrial Electronics Society, IECON 2004, Busan, Korea, 2–6 November 2004. [Google Scholar]
  10. Musa, A.; Nugraha, G.D.; Han, H.; Choi, D.; Seo, S.; Kim, J. A decision tree-based NLOS detection method for the UWB indoor location tracking accuracy improvement. Int. J. Commun. Syst. 2019, 32, e3997. [Google Scholar] [CrossRef]
  11. Yu, K.; Wen, K.; Li, Y.; Zhang, S.; Zhang, K. A Novel NLOS Mitigation Algorithm for UWB Localization in Harsh Indoor Environments. IEEE Trans. Veh. Technol. 2019, 68, 686–699. [Google Scholar] [CrossRef]
  12. Kee, C.; Yun, D.; Jun, H. Precise calibration method of pseudolite positions in indoor navigation systems. Comput. Math. Appl. 2003, 46, 1711–1724. [Google Scholar] [CrossRef] [Green Version]
  13. Li, X.; Zhang, P.; Huang, G.; Zhang, Q.; Guo, J.; Zhao, Y.; Zhao, Q. Performance analysis of indoor pseudolite positioning based on the unscented Kalman filter. GPS Solut. 2019, 23, 79. [Google Scholar] [CrossRef]
  14. Aoran, X.; Ruizhi, C.; Deren, L.; Yujin, C.; Dewen, W. An Indoor Positioning System Based on Static Objects in Large Indoor Scenes by Using Smartphone Cameras. Sensors 2018, 18, 2229. [Google Scholar]
  15. Mulloni, A.; Wagner, D.; Barakonyi, I.; Schmalstieg, D. Indoor Positioning and Navigation with Camera Phones. IEEE Pervasive Comput. 2009, 8, 22–31. [Google Scholar] [CrossRef]
  16. Google. Wi-Fi Scanning Overview. Available online: https://developer.android.google.cn/guide/topics/connectivity/wifi-scan (accessed on 18 June 2021).
  17. Zhou, C.; Yuan, J.-Z.; Liu, H.; Qiu, J. Bluetooth Indoor Positioning Based on RSSI and Kalman Filter. Wirel. Pers. Commun. 2017, 96, 4115–4130. [Google Scholar] [CrossRef]
  18. Cao, H.; Wang, Y.; Bi, J.; Qi, H. An Adaptive Bluetooth/Wi-Fi Fingerprint Positioning Method based on Gaussian Process Regression and Relative Distance. Sensors 2019, 19, 2784. [Google Scholar] [CrossRef] [Green Version]
  19. Wu, C.; Xu, J.; Yang, Z.; Lane, N.D.; Yin, Z. Gain without Pain: Accurate WiFi-based Localization using Fingerprint Spatial Gradient. Proc. ACM Interact. Mob. Wearable Ubiquitous Technol. 2017, 1, 1–19. [Google Scholar] [CrossRef]
  20. Gu, F.; Hu, X.; Ramezani, M.; Acharya, D.; Khoshelham, K.; Valaee, S.; Shang, J. Indoor Localization Improved by Spatial Context—A Survey. ACM Comput. Surv. 2019, 52, 1–35. [Google Scholar] [CrossRef] [Green Version]
  21. Kenn, H.; Behrens, N.; Kleiner, A. Optimizing indoor PDR performance with self-deployed position markers. In Proceedings of the 4th International Forum on Applied Wearable Computing 2007, Tel Aviv, Israel, 12–13 March 2007. [Google Scholar]
  22. Zuo, Z.; Liu, L.; Zhang, L.; Fang, Y. Indoor Positioning Based on Bluetooth Low-Energy Beacons Adopting Graph Optimization. Sensors 2018, 18, 3736. [Google Scholar] [CrossRef] [PubMed] [Green Version]
  23. Tian, Y.; Huang, B.; Jia, B.; Zhao, L. Optimizing AP and Beacon Placement in WiFi and BLE hybrid localization. J. Netw. Comput. Appl. 2020, 164, 102673. [Google Scholar] [CrossRef]
  24. Ng, P.C.; She, J.; Park, S. High Resolution Beacon-Based Proximity Detection for Dense Deployment. IEEE Trans. Mob. Comput. 2017, 17, 1369–1382. [Google Scholar] [CrossRef]
  25. Mackey, A.; Spachos, P.; Song, L.; Plataniotis, K.N. Improving BLE Beacon Proximity Estimation Accuracy Through Bayesian Filtering. IEEE Internet Things J. 2020, 7, 3160–3169. [Google Scholar] [CrossRef] [Green Version]
  26. Subhan, F.; Khan, A.; Saleem, S.; Ahmed, S.; Imran, M.; Asghar, Z.; Bangash, J.I. Experimental analysis of received signals strength in Bluetooth Low Energy (BLE) and its effect on distance and position estimation. Trans. Emerg. Telecommun. Technol. 2019. [Google Scholar] [CrossRef]
  27. Zhao, X.; Xiao, Z.; Markham, A.; Trigoni, N.; Ren, Y. Does BTLE measure up against wifi? A comparison of indoor location performance. In Proceedings of the 20th European Wireless Conference, EW 2014, Barcelona, Spain, 14–16 May 2014; pp. 263–268. [Google Scholar]
  28. Pakanon, N.; Chamchoy, M.; Supanakoon, P. Study on Accuracy of Trilateration Method for Indoor Positioning with BLE Beacons. In Proceedings of the 2020 6th International Conference on Engineering, Applied Sciences and Technology (ICEAST), Chiang Mai, Thailand, 1–4 July 2020; pp. 1–4. [Google Scholar]
  29. Bahl, P.; Padmanabhan, V.N. RADAR: An in-Building RF-Based User Location and Tracking System. In Proceedings of the IEEE INFOCOM 2000 Conference on Computer Communications, Nineteenth Annual Joint Conference of the IEEE Computer and Communications Societies (Cat. No.00CH37064), Tel Aviv, Israel, 26–30 March 2000; Volume 2, pp. 775–784. [Google Scholar]
  30. Wang, X.; Gao, L.; Mao, S.; Pandey, S. DeepFi: Deep learning for indoor fingerprinting using channel state information. In Proceedings of the 2015 IEEE Wireless Communications and Networking Conference (WCNC), New Orleans, LA, USA, 9–12 March 2015; Institute of Electrical and Electronics Engineers (IEEE): New York, NY, USA, 2015; pp. 1666–1671. [Google Scholar]
  31. Yan, H.; Shan, Q.; Furukawa, Y. RIDI: Robust IMU Double Integration. In Proceedings of the European Conference on Computer Vision (ECCV), Munich, Germany, 8–14 September 2018. [Google Scholar]
  32. Chen, C.; Lu, X.; Markham, A.; Trigoni, N. IONet: Learning to Cure the Curse of Drift in Inertial Odometry. In Proceedings of the AAAI Conference on Artificial Intelligence, New Orleans, LA, USA, 2–7 February 2018. [Google Scholar]
  33. Herath, S.; Yan, H.; Furukawa, Y. RoNIN: Robust Neural Inertial Navigation in the Wild: Benchmark, Evaluations, & New Methods. In Proceedings of the 2020 IEEE International Conference on Robotics and Automation (ICRA), Paris, France, 31 May–1 August 2020; pp. 3146–3152. [Google Scholar]
  34. Liu, W.; Caruso, D.; Ilg, E.; Dong, J.; Mourikis, A.I.; Daniilidis, K.; Kumar, V.; Engel, J. TLIO: Tight Learned Inertial Odometry. IEEE Robot. Autom. Lett. 2020, 5, 5653–5660. [Google Scholar] [CrossRef]
  35. Sun, S.; Melamed, D.; Kitani, K. IDOL: Inertial Deep Orientation-Estimation and Localization. arXiv 2021, arXiv:2102.04024. [Google Scholar]
  36. Mezentsev, O.; Lachapelle, G.; Collin, J. Pedestrian dead reckoning—A solution to navigation in GPS signal degraded areas? Geomatica 2005, 59, 175–182. [Google Scholar]
  37. Jahn, J.; Batzer, U.; Seitz, J.; Patino-Studencka, L.; Boronat, J.G. Comparison and evaluation of acceleration based step length estimators for handheld devices. In Proceedings of the 2010 International Conference on Indoor Positioning and Indoor Navigation, Zurich, Switzerland, 15–17 September 2010; pp. 1–6. [Google Scholar] [CrossRef]
  38. You, Y.; Wu, C. Hybrid Indoor Positioning System for Pedestrians with Swinging Arms Based on Smartphone IMU and RSSI of BLE. IEEE Trans. Instrum. Meas. 2021, 70, 1–15. [Google Scholar] [CrossRef]
  39. Li, X.; Wang, J.; Liu, C.; Zhang, L.; Li, Z. Integrated WiFi/PDR/Smartphone Using an Adaptive System Noise Extended Kalman Filter Algorithm for Indoor Localization. ISPRS Int. J. Geo-Inf. 2016, 5, 8. [Google Scholar] [CrossRef] [Green Version]
  40. Deng, Z.A.; Hu, Y.; Yu, J.; Na, Z. Extended Kalman Filter for Real Time Indoor Localization by Fusing WiFi and Smartphone Inertial Sensors. Micromachines 2015, 6, 523–543. [Google Scholar] [CrossRef] [Green Version]
  41. Atia, M.; Iqbal, U.; Givigi, S.; Noureldin, A.; Korenberg, M. Adaptive Integrated Indoor Pedestrian Tracking System Using MEMS sensors and Hybrid WiFi/Bluetooth-Beacons with Optimized Grid-based Bayesian Filtering Algorithm. In Proceedings of the 2015 International Technical Meeting of the Institute of Navigation, Dana Point, CA, USA, 26–28 January 2015. [Google Scholar]
  42. Yang, Y.; He, H.; Xu, G. Adaptively robust filtering for kinematic geodetic positioning. J. Geod. 2001, 75, 109–116. [Google Scholar] [CrossRef]
  43. Yang, Y.; Song, L.; Xu, T. Robust estimator for correlated observations based on bifactor equivalent weights. J. Geod. 2002, 76, 353–358. [Google Scholar] [CrossRef]
  44. Chang, G. Robust Kalman filtering based on Mahalanobis distance as outlier judging criterion. J. Geod. 2014, 88, 391–401. [Google Scholar] [CrossRef]
  45. Li, Z.; Liu, C.; Gao, J.; Li, X. An Improved WiFi/PDR Integrated System Using an Adaptive and Robust Filter for Indoor Localization. Int. J. Geo-Inf. 2016, 5, 224. [Google Scholar] [CrossRef] [Green Version]
  46. Shaowei, L.; Xianghong, H.; Weining, Q.; Ying, S.; Kang, W.; Xuesheng, P. The effects of AP number on WiFi fingerprint positioning. Eng. Surv. Mapp. 2017, 26, 33–36. [Google Scholar]
  47. Gu, F.; Khoshelham, K.; Shang, J.; Yu, F.; Wei, Z. Robust and Accurate Smartphone-Based Step Counting for Indoor Localization. IEEE Sens. J. 2017, 17, 3453–3460. [Google Scholar] [CrossRef]
  48. Yuan, Z.; Haiyu, L.; You, L.; Naser, E.S. PDR/INS/WiFi Integration Based on Handheld Devices for Indoor Pedestrian Navigation. Micromachines 2015, 6, 793–812. [Google Scholar]
  49. Rai, A.; Chintalapudi, K.; Padmanabhan, V.; Sen, R. Zee: Zero-effort crowdsourcing for indoor localization. In Proceedings of the 18th Annual International Conference on Mobile Computing and Networking, Istanbul, Turkey, 22–26 August 2012. [Google Scholar] [CrossRef]
  50. Sun, M.; Wang, Y.; Xu, S.; Cao, H.; Si, M. Indoor Positioning Integrating PDR/Geomagnetic Positioning Based on the Genetic-Particle Filter. Appl. Sci. 2020, 10, 668. [Google Scholar] [CrossRef] [Green Version]
  51. Ladetto, Q. On foot navigation: Continuous step calibration using both complementary recursive prediction and adaptive Kalman filtering. In Proceedings of the 13th International Technical Meeting of the Satellite Division of The Institute of Navigation (ION GPS 2000), Salt Lake City, UT, USA, 19–22 September 2000. [Google Scholar]
  52. Vildjiounaite, E.; Malm, E.-J.; Kaartinen, J.; Alahuhta, P. Location Estimation Indoors by Means of Small Computing Power Devices, Accelerometers, Magnetic Sensors, and Map Knowledge. Comput. Vis. 2002, 2414, 211–224. [Google Scholar] [CrossRef]
  53. Weinberg, H. Using the ADXL202 in pedometer and personal navigation applications. Analog Devices AN-602 Appl. Note 2002, 2, 1–6. [Google Scholar]
  54. Liu, J.; Chen, R.; Pei, L.; Guinness, R.; Kuusniemi, H. A Hybrid Smartphone Indoor Positioning Solution for Mobile LBS. Sensors 2012, 12, 17208–17233. [Google Scholar] [CrossRef]
  55. Wang, H.; Sen, S.; Elgohary, A.; Farid, M.; Youssef, M.; Choudhury, R.R. No need to war-drive: Unsupervised indoor localization. In Proceedings of the 10th International Conference on Mobile Systems, Applications, and Services, Low Wood Bay, UK, 26–28 June 2012. [Google Scholar] [CrossRef]
  56. Mahony, R.; Hamel, T.; Pflimlin, J.-M. Nonlinear Complementary Filters on the Special Orthogonal Group. IEEE Trans. Autom. Control 2008, 53, 1203–1218. [Google Scholar] [CrossRef] [Green Version]
Figure 1. The process of the BLE fingerprint position method.
Applsci 11 08170 g001
Figure 2. The scanning RSSI number of the per real-time fingerprint in 60 s.
Applsci 11 08170 g002
Figure 3. The principle of PDR.
Applsci 11 08170 g003
Figure 4. The attitude angle of the smartphone.
Applsci 11 08170 g004
Figure 5. The acceleration modulus on different motion statuses.
Applsci 11 08170 g005
Figure 6. The curve of different motion states between the raw standard deviation of acceleration modulus and the standard deviation of acceleration modulus after MAF.
Applsci 11 08170 g006
Figure 7. The BLE/PDR integrated system localization framework.
Applsci 11 08170 g007
Figure 8. The two location scenarios. (a) The location scenario of the second floor of the C7 test site. (b) The location scenario of the 331 test site.
Applsci 11 08170 g008
Figure 9. BLE fingerprint method and BLE fingerprint method after eliminating the few scanning numbers of RSSI. (a) Position error curves of two methods (b) Cumulative distribution of position error of two methods.
Applsci 11 08170 g009aApplsci 11 08170 g009b
Figure 10. Trajectory and motion state of heading estimation.
Applsci 11 08170 g010
Figure 11. Heading angle estimated based on the four methods and partially enlarged view.
Applsci 11 08170 g011
Figure 12. Comparison of Motion state and heading estimation.
Applsci 11 08170 g012
Figure 13. The trajectory of BLE/PDR integrated system position experiments in the C7 test site.
Applsci 11 08170 g013
Figure 14. Comparison of Position errors and cumulative errors of three methods. (a) Time series of position errors, (b) cumulative errors of three methods.
Applsci 11 08170 g014
Figure 15. The trajectory of three methods in the true position scenario. (a) The trajectory and jump points, (b) the trajectory in the position scenario, (c) the comparison of different fusion methods with trajectory one, (d) the comparison of different fusion methods with trajectory two.
Applsci 11 08170 g015aApplsci 11 08170 g015bApplsci 11 08170 g015c
Figure 16. The trajectory of four methods in 331 test site.
Applsci 11 08170 g016
Table 1. Position error comparison/(m).
MethodMinMaxMeanRMSE
BLE fingerprint method0.00518.2892.8343.106
Eliminating the less scanned BLE number0.00518.2892.3122.042
Table 2. Position error comparison/(m).
MethodMinMaxMeanRMSE
BLE fingerprint method0.16513.0332.6472.727
Extend Kalman filter method07.1221.9601.727
Robust filter base on EKF02.6410.8440.745
Publisher’s Note: MDPI stays neutral with regard to jurisdictional claims in published maps and institutional affiliations.

