1. Introduction
The three elements of computer-aided design and computer-aided manufacturing (CAD/CAM) are data acquisition, software, and manufacture; this concept was first introduced by Dr. Francois Duret in 1973 [
1]. Digital data acquisition could be obtained via an intraoral scanner (IOS) or desktop scanner, while the pioneering IOS device used in clinical dentistry was the CEREC system in 1987 [
1]. Many IOS devices have been launched in dentistry and have become increasingly popular in dental clinics in the past decade [
2]. Three imaging principles [
3] commonly used in IOS development are triangulation, confocal, and active wavefront sampling. Among them, TRIOS 3 uses the ultrafast optical sectioning technique based on the confocal laser principle; so, it is one of the most popular oral scanners clinically. Clinicians should go through a proper learning curve [
4] and focus on one or two IOS devices in dental practice.
Studies on the accuracy of most IOS were compared and proven to reach clinical needs. In contrast, the accuracy of some IOS was even better than that of traditional silicone impression materials [
5,
6]. On the other hand, the accuracy of IOS has been demonstrated to have significant differences in the deviations, which depend on the scanner used, the scan field, the scan strategy, environmental interference, etc. Kim et al. [
7,
8] tested many IOS scanners and showed that different significant deviations ranged from 17.80 μm to 200.24 μm among the scanners. At the same time, Medina-Sotomayor [
9] stated the risk of scan deviation in a single crown was low, but full-arch scanning still had its limitations and discrepancies. Recording full-arch digital data appears complicated but is useful for full-mouth rehabilitation. Richert et al. [
3] reviewed articles and stated that different scan strategies would affect the accuracy of the full-arch scan. Saliva, blood, cheek and tongue movements, rebound after gingivae, patient’s mouth-opening durability, etc., will affect the performance of oral scan quality. Arakida et al. [
10] demonstrated that 3900 K and 500 lux of ambient light would be the most appropriate lighting conditions for optical impression, while Revilla-León et al. [
11] revealed that room light would result in better accuracy for TRIOS 3.
According to the International Organization for Standard (ISO-5725-1) [
12], accuracy comprises trueness and precision. Trueness refers to the degree of deviation of the measured value from the actual dimension, while precision refers to the closeness of the repeated measurement value. The scan strategies that include scan path, gesture, sequential range, or combination might influence accurate modeling. Muller et al. [
13] demonstrated the trueness of three scan paths via the TRIOS 3 Pod scanner, and the results revealed the scan path from occlusal-palatal, returning via buccal surface, showed the highest trueness in full-arch scans. Passos et al. [
14] showed the accuracy of 13 strategies that included scan path and sequential range via the CEREC series system, and the results revealed the lowest deviation in one design, while Latham et al. [
15] showed the accuracy of four scan strategies that included scan path, sequential range, and gestures via four IOS, revealing TRIOS 3 was not affected by different strategies. Additionally, Medina-Sotomayor et al. [
9] demonstrated the accuracy of four strategies that included scan path and sequential range via four IOS, revealing that accuracy was not affected by different scanning strategies. Accordingly, the accuracy of varying scan strategies remains controversial, the factors deserve further clarification, and the deviation of occlusal and buccal-lingual of TRIOS3 is still unknown.
This in vitro study aimed to compare maxilla and mandible full-arch IOS scan trueness and precision via one scan path with six different head movements. The IOS scanner was a TRIOS 3 Pod wired using a standard speed technique based on the confocal laser principle. The null hypothesis was that the accuracy via six movements would show no significant difference.
2. Materials and Methods
2.1. Model Preparation
A set of upper and lower jaw dental models (Nissin Dental Products Inc., Kyoto, Japan) was scanned by a desktop scanner (E4 Dental Scanner; 3 shape, Copenhagen, Denmark) to obtain the initial STL file. Then, the models put in Nissin Simple Manikin II (Nissin Dental Products Inc., Kyoto, Japan) were set on a dental chair to simulate the clinical condition. The TRIOS 3 Pod scanner (3 shape, Copenhagen, Denmark) is an intraoral scanner (IOS) system used in this study, calibrated using the manufacturer’s guidelines. Chiu et al. [
16] pointed out that the scan time (less 121 s) is positively correlated with the number of captured images (less than 1692), where the scan time or the number of images captured does not affect the discrepancy; therefore, for the consistency and rigor of the experiment, one experienced right-handed dentist performed all scans, and one arch scan was controlled for less than 1000 sheet images, while the scan time of one arch was controlled for less than 60 s. AI scan was performed and the same dentist performed all test scans in the same room under similar temperatures (22 °C), relative humidity (60%), and the same room light.
2.2. Scan Strategies
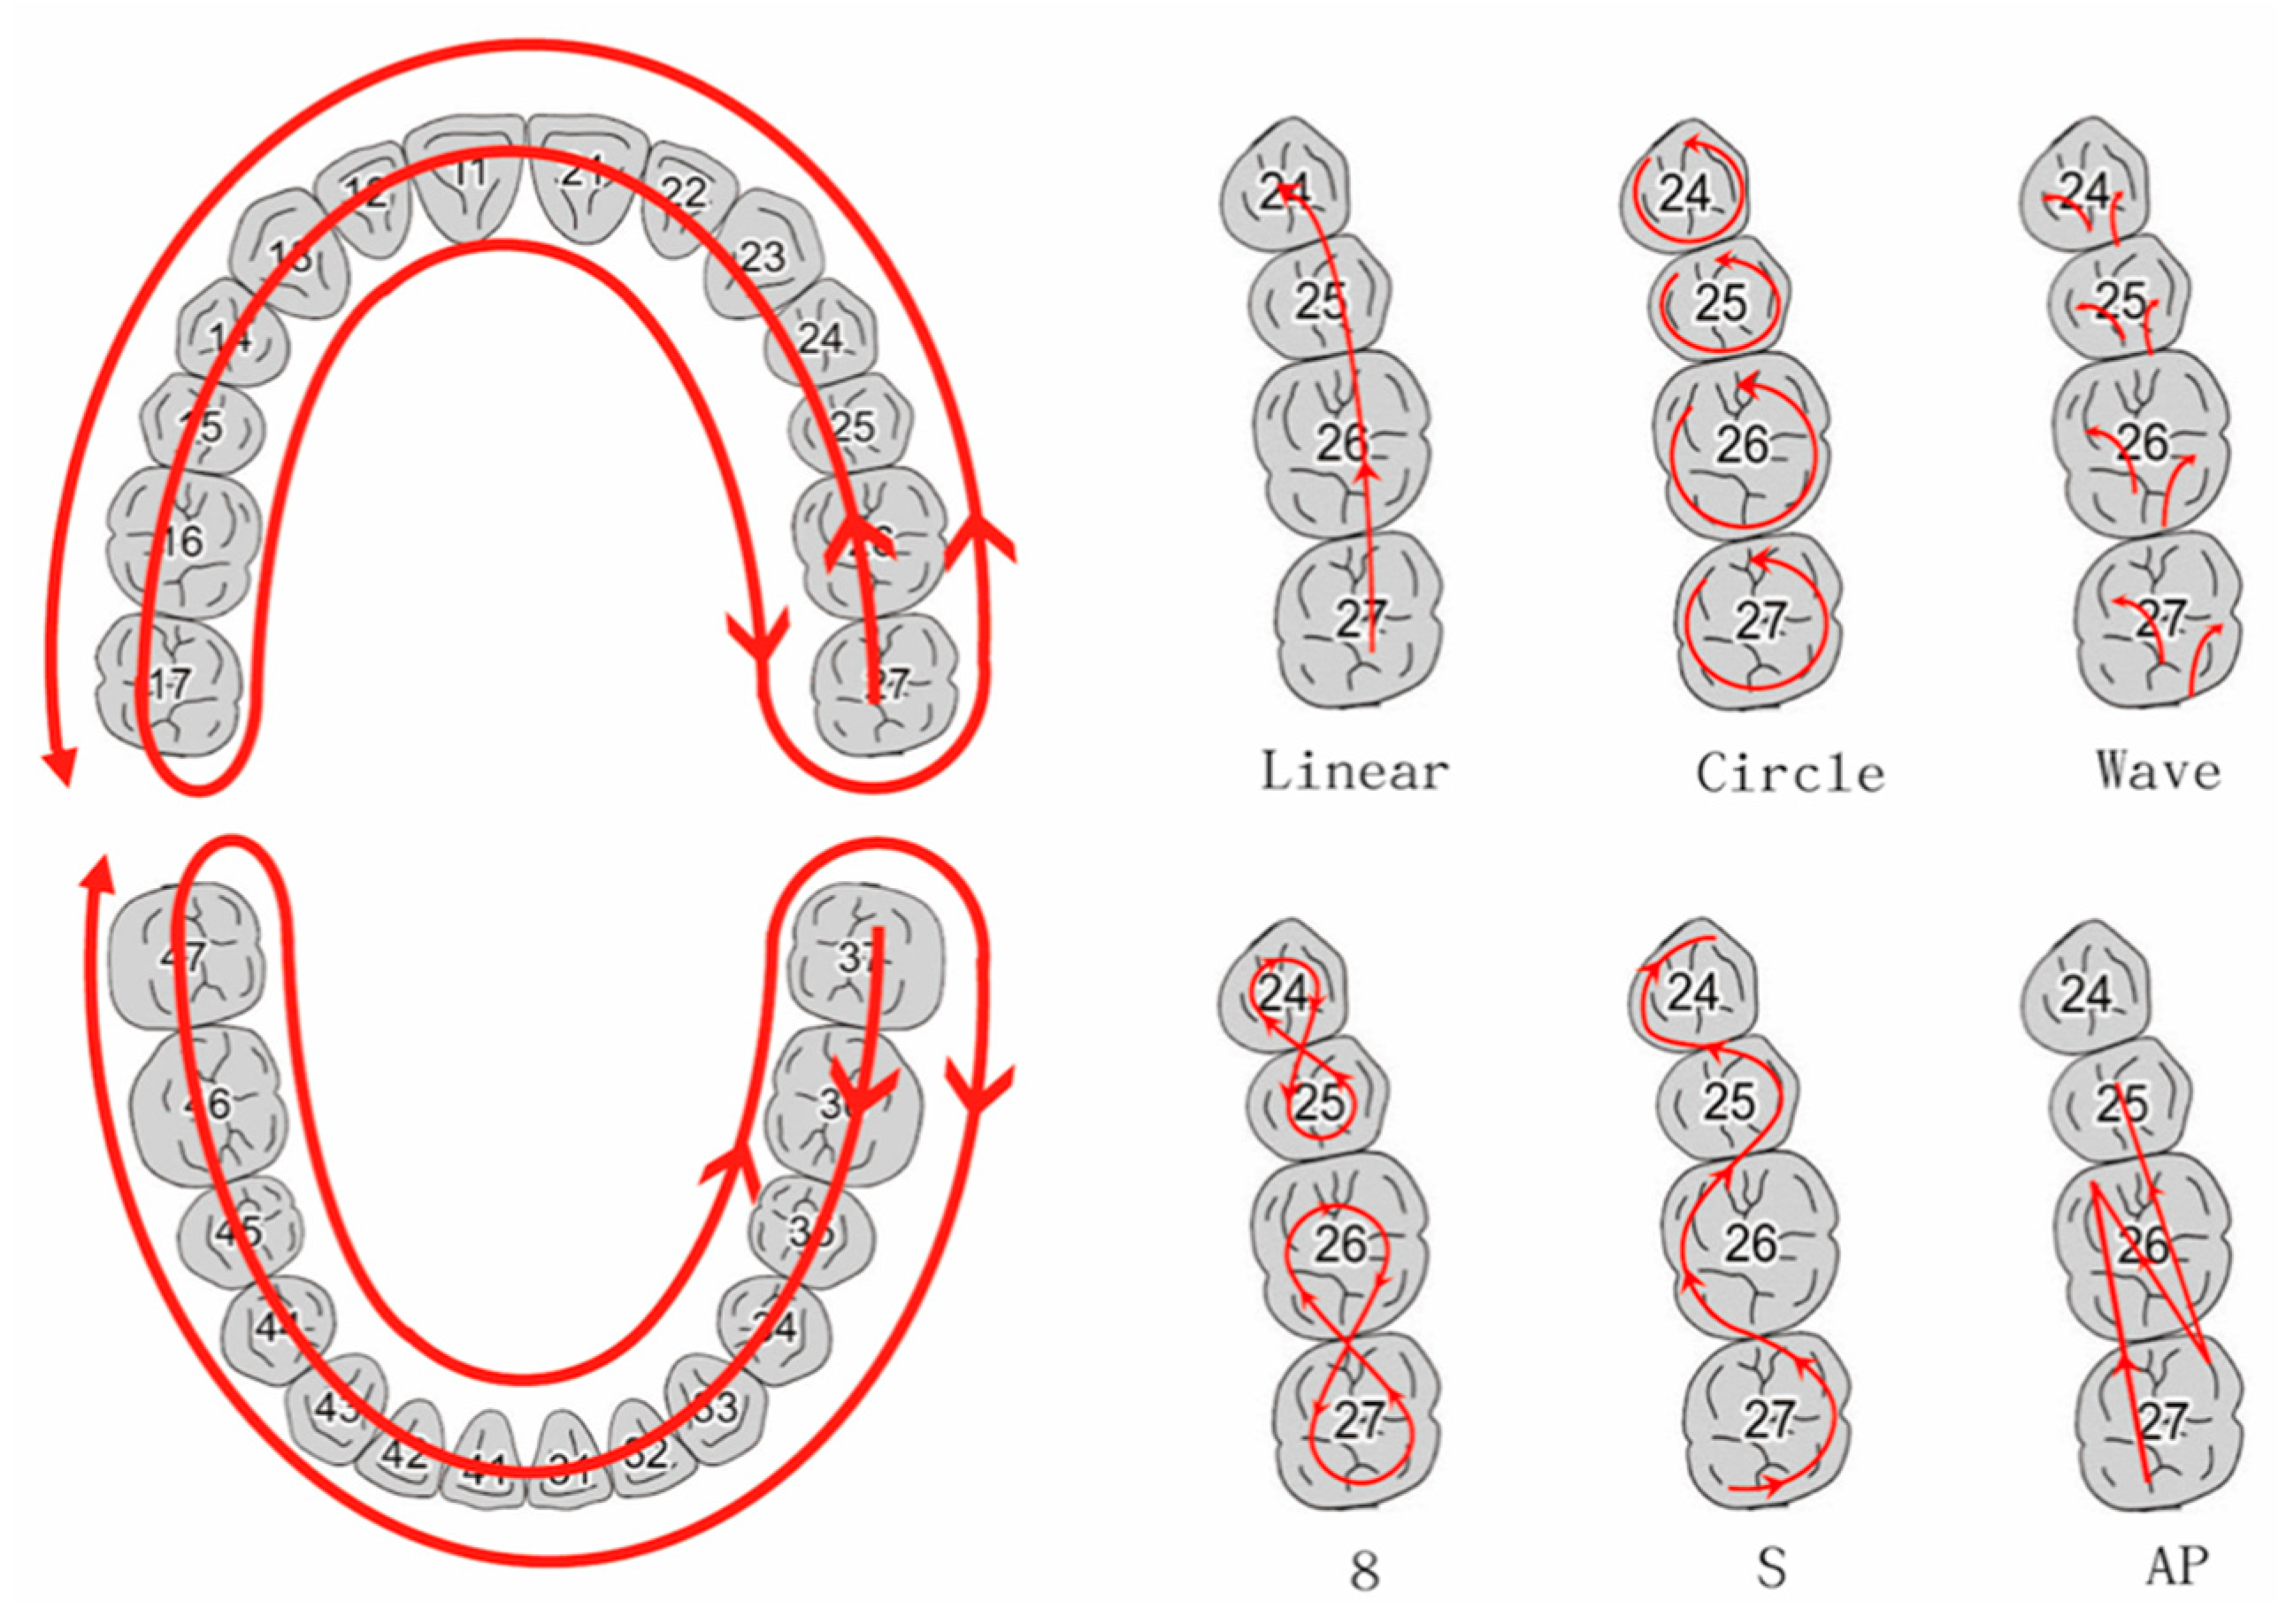
The scan strategies that included one scan path with six different scan movements were performed in this study. The maxilla line scanning path was as follows: initially, for the occlusal surface, starting with the left second molar and continuing until the right second molar, returning via palatal surface, and finally sweeping once over the buccal surfaces. The mandibular line path started from the second molar occlusal side of III quarter, proceeding longitudinally along the arch and ending at the right second molar, and then continuing on the lingual side and, finally, the buccal surface. The path all but followed the manufacturer’s protocol. However, for the consistency and rigor of the experiment, the maxilla path was slightly modified, and a pilot study was done to prove that there was no statistical difference between the two paths. Then, six scan head movements were used in this study, following the same scan path.
The G power analysis was used to estimate the required sample size, assuming six test groups, an effect size of 0.6, the probability of Type I (α) error of 0.05, type II error (β) of 0.08, and the power of 0.92. The sample size was 60 and, thus, determined to be 10 per group. The dentist performed each movement 10 times, and a total of 120 scans were recorded. Although the sample size of scans was only 120, the study’s estimation of statistical power was 92% (> optimal values of 80%); therefore, our results had a 92% valid probability of being significant. This highly statistical power shows that the tests were most likely valid and strengthens the evidence coming from the study.
According to the research of Li et al. [
17], except for the common U-shaped movement, they also mixed zigzag motion during the scanning process, which means that the scanning movement was no longer limited to linear and wave. Therefore, six scanning movements were designed accordingly in this study (see
supplement Video S1), which followed the same scanning path and are as follow (
Figure 1).
Linear movement refers to moving along the outline of the dental arch.
Circle movement refers to making a counterclockwise circle movement for each tooth along the dental arch.
Wave movement means that when each tooth is scanned, the wrist swings left and right on the occlusal side, and then the wrist swings up and down on the buccal or lingual side.
The 8-figure movement refers to movement like writing the numeral “8”. Initially, the scan head would move from the upper left second molar counterclockwise, then move through the upper left first molar to finish the numeral “8”. Each movement would cover two teeth.
The S-figure movement refers to a “letter s-shaped” movement. The process would move from upper left second molar counterclockwise, then move through the upper left first molar to finish the S-figure movement. Each movement would cover two teeth.
The A-P movement refers to a forward and backward movement. Each movement would cover two teeth.
Trueness is defined as comparing a reference data set and a test data set and determining the absolute accuracy of a scanner. Generally speaking, trueness only finds the maximum value of deviation in the tooth. However, we separately discussed the maximum deviation of the occlusal and buccal-lingual (B-L) surface in this study. The occlusal deviation would help to determine the occlusion of each tooth, and the B-L deviation would help to find the deformation of the full arch. Using the “best fit matching “and “cut view” tool in the CAD software program (Exocad DentalCAD; Exocad GmbH, Align Technology Inc., Santa Clara, CA, USA), we could calculate differences between each measuring point of a model and the farthest corresponding point of the superimposed model in occlusal and B-L direction deviation (
Figure 2 and
Figure 3). One model including 14 teeth with occlusal deviation and B-L deviation was recorded, and a total of 1680 data points in one jaw were recorded. On the other hand, a box plot was used to show the precision of different head movements, marking the values in the 95% confidence interval extending from the boxes and indicating variability outside the upper and lower quartiles, while points with larger deviations were scattered in the chart values.
2.3. Statistical Analysis
One thousand, six hundred-and-eighty data per jaw were recorded for the trueness comparisons with descriptive statistics being used to present the data of each group. Comparisons between the groups were statistically analyzed by using one-way analysis of variance (ANOVA) and post hoc comparisons with Tukey test via IBM SPSS (SPSS Statistics for Windows, v20; IBM Corp., Armonk, NY, USA). A statistical significance value of p < 0.05 was used in all tests. Cronbach’s alpha was used to evaluate intra-examiner reliability. For the reliability analysis, the intraclass correlation coefficient (ICC) was calculated. The Cronbach’s alpha value for the measurements was 0.831, and the ICC was 0.819 (95% CI 0.702–0.904).
3. Results
Table 1 presents the mean absolute deviation of six head movements for trueness of the occlusal side. Both in the maxilla and mandible, the values demonstrated the significant difference among six head movements (
p < 0.05), where the 8-figure movement revealed the maximum deviation (0.132 ± 0.099 mm) and the S-figure movement was the minimum value (0.080 ± 0.065 mm). Detailed mutual comparisons are listed in
Table 1. Deviations of the maxilla and mandible were statistically significant (
p < 0.05).
Figure 4 clearly shows the occlusal deviation of different tooth positions among six head movements in the maxilla. The scan path was from the left second molar occlusal side, proceeding to the right second molar, then palatal side and buccal surface. Except for the 8-figure movement, the other head movements showed a similar trend, where deviations increased at the left central incisor, left first premolar, and left second molar. The statistical results showed a significant difference at the tooth positions 11, 12, and 16.
Figure 5 reveals the occlusal deviations of different tooth positions among six head movements in the mandible. Except for the 8-figure and A-P movements, the others showed a similar trend: Deviation slightly increased at left, right second molar and right canine, and first premolar areas. Moreover, the tooth positions 45, 46, and 47 had significant difference; however, the deviation of tooth positions 42 and 43 slightly increased, although their statistical results were not different (
p = 0.082 and 0.0376, respectively).
The mean absolute deviations of buccal-lingual side in the maxilla and mandible are presented in
Table 2. The six head movements showed a significant difference (
p < 0.05). In the maxilla, the deviation value of the S-figure movement (0.166 ± 0.221 mm) was the maximum among the six, and the linear movement showed the minimum values (0.098 ± 0.073 mm). In the mandible, the 8-figure movement revealed the maximum deviation (0.095 ± 0.057 mm), and circle head movement showed the minimum values (0.070 ± 0.044 mm).
Figure 6 clearly shows the B-L deviation of different tooth positions among six head movements in the maxilla. Head movements Linear, Circle, and A-P showed similar trends with lower ups and downs, while the 8-, S-figure, and Wave movements undulated obviously at the upper left canine area. The statistical result showed only that tooth position 23 showed a significant difference.
Figure 7 presents the B-L deviations of different tooth positions among six head movements in the mandible. All head movements showed similar trends with slight ups at the lower right first premolar. The statistical result revealed only that tooth position 44 had a significant difference.
Table 3 includes all maxilla and mandible deviations, showing the significant differences among six head movements (
p < 0.05). In the maxilla, the 8-figure movement showed the maximum deviation values (0.128 ± 0.086 mm), and Linear movement showed the minimum values (0.096 ± 0.07 mm). In the mandible, the maximum values were revealed by the 8-figure movement, while the minimum values were presented by the Circle movement.
Figure 8 shows the precision of different head movements in the maxilla. The 8-figure movement showed poor reproducibility in 10 scans. Linear movement, ‘Circle’, S-figure, and A-P showed similar reproducibility in 1-scans.
Figure 9 shows the similar precision of different head movements in the mandible.
4. Discussion
The results rejected the null hypothesis. This one-way scan path in the present study showed the significant occlusal deviations of the maxilla at left central incisor, left first premolar, left second molar, and right second molar among most head movements except the 8-figure movement. The mandibular occlusal deviation was higher at the bilateral posterior segment among most head movements, except for the 8-figure movement and A-P. B-L deviations of the maxilla showed both low deviation (Linear, Circle, and A-P) and high deviation (8-figure, S-figure, and Wave). The mandibular B-L deviation was similar with slight ups at the right first premolar and second molar.
The scan strategies in this study included one scan path and six head movements via TRIOS 3 IOS. Al-Rimawi et al. [
18] showed an ex vivo study to evaluate trueness via TRIOS 3 and CBCT; the mean and standard deviation of 120 ± 34 μm were similar to this present study. Medina-Sotomayor et al. [
19] showed the trueness of the full dental arch vis IOS TRIOS was 55.3 ± 8.7 μm. Although the trueness values were lower than our maxilla results, the authors in this present study did demonstrate consistent scanning conditions and specifications. Moreover, the ICC was 0.819 with 95% confident interval = 0.702–0.904, indicating the reliability in this study was moderate to good [
20].
These deviations could be attributed to the inevitable shaking and movement when holding the IOS. The 3D model reconstruction would cause larger deviations in the curved areas of the dental arch, like premolars, canines, and the distal surface of the molars, which require more angles to be flipped during shooting. Kapoor et al. [
21] demonstrated for a left-handed dental student’s response that the maxilla is more difficult than the mandible, and the quarter I was the most complicated quarter to work. In this present study, the right-handed dentist could easily operate patient quadrants II and III, while the lower jaw was visible directly and more easily located and scanned than the upper jaw. On the other hand, the parallel confocal design of the TRIOS series helped to reconstruct the digital dental model via focused and defocused images from the different angles around the object. The sharpness area is directly related to the dexterity of the operator who can generate static images and motion blur [
22].
The Linear, Circle, S-figure, A-P, and 8-figure movements could all be classified as moving in a linear movement, while the Wave movement was flipping. Firstly, the A-P and 8-figure movements moved on a partially repeated path, and these movements might increase the image sheets and deviations from superimpositions. The occlusal deviations of the maxilla and mandible demonstrated the findings (
Figure 4 and
Figure 5); however, the trueness of B-L was influenced more by the S- and 8-figure movements. These findings might be attributed to the conflict of path and movement and demonstrated that the deviation will be more minor when the path and movement are in the same direction. However, when the path and movement conflict, the deviation will be more significant. Oh K.C. et al. [
23] showed similar findings, where the deviations of a continued scan with horizontal direction (87.60 ± 5.76 μm) were lower than that for a vertical direction (102.38 ± 7.48 μm).
Secondly, the results of the wave movement showed similar occlusal deviations as linear and circular; still, a slightly higher deviation in the B-L side could indicate that the flip was not violent and did not affect the focus in this confocal design scanner. This wave movement would help to catch the morphology of the teeth; however, on the other hand, it showed a high deviation of the B-L side in the maxilla that could be attributed to the difficult operation in the buccal and lingual sides that might increase the scan sheets and superimposition.
Clinically, long-span, fixed, partial denture, [
24] full-mouth rehabilitation, [
25] removable partial denture [
26,
27], and implant-prosthetic rehabilitations [
28] would need full-arch models to reconstruct the occlusal plane, space determination, and esthetics. Using IOS to obtain a digital model could increase work efficiency and reduce the distortion error of the materials, while reducing both costs and environmental pollution (in the future).
This study demonstrated the position and values of the occlusal and B-L deviations from IOS, which would be helpful in the clinical validation via CAD software and dental materials, like PMMA or composite resin [
25]. Manufacturers have commonly recommended linear movement, but further combining two head movements would be helpful in digital model accuracy. Oh K.C. et al. [
23] and Latham et al. [
15] had similar findings; therefore, using the S-figure movement on the occlusal surface and Linear or Circle movements on the B-L surface might be a good choice to obtain better accuracy of TRIOS 3 Pod.
Despite using a dental model via Nissin holder set on a dental chair to simulate the posture, environmental influences such as saliva, blood, and soft tissue changes were limitations in this study. Furthermore, comparing different IOS and hybrid head movements would be advantageous in future research.
5. Conclusions
Within the limitations of the present study, the accuracy of optical impression for full arch via one path with six head movements differed from maxilla and mandible and depended on the different head movements (p < 0.05). In the maxilla, for optical impression via TRIOS 3 Pod, the S- and 8-figure movements were not recommended, while the Linear and Circle movements showed high trueness. In the mandible, the 8-figure movement was not recommended, while the other five movements showed similar trueness. In the maxilla, a 3D model reconstruction deviation was prone to appear at the turning points as left incisor, left first premolar, left second molar, and right second molar at the occlusal surface. The deviations showed at left second molar, right first premolar, and right second molar in the mandible.


