Article

Inhibition of Breast Tumour Growth with Intravenously Administered PRKCA siRNA- and PTEN Tumour Suppressor Gene-Loaded Carbonate Apatite Nanoparticles

by
Nabilah Ibnat
1,2,
Rowshan Ara Islam
1 and
Ezharul Hoque Chowdhury
1,*
1
Jeffrey Cheah School of Medicine and Health Sciences, Monash University Malaysia, Jalan Lagoon Selatan, Bandar Sunway, Subang Jaya 47500, Malaysia
2
Health System and Population Studies Division, ICDDRB, Mohakhali, Dhaka 1212, Bangladesh
*
Author to whom correspondence should be addressed.
Appl. Sci. 2021, 11(17), 8133; https://doi.org/10.3390/app11178133
Submission received: 20 July 2021 / Revised: 21 August 2021 / Accepted: 27 August 2021 / Published: 2 September 2021
(This article belongs to the Special Issue Nanomaterials, Targeting and Treating Diseases)

Abstract

:
Gene therapy aims to silence an oncogene through RNA interference, or replace an abnormal tumour suppressor via gene augmentation. In this study, we intended RNA interference for PRKCA oncogene and gene augmentation for PTEN tumour suppressor with a view to reduce tumour growth in a mouse model of breast cancer. Inorganic carbonate apatite nanoparticles (CA NPs) were utilized to deliver the synthetic siRNA and the purified gene-carrying plasmid DNA both in vitro and in vivo. Effects of PRKCA siRNA- and PTEN plasmid-loaded NPs on viability of MCF-7, MDA-MB-231 and 4T1 breast cancer cells were assessed by MTT assay. The cell viability data in MCF-7 cell line demonstrated that combined delivery of PRKCA specific siRNA and PTEN plasmid with CA NPs had an additive effect to significantly decrease cellular growth compared to individual treatments. In addition, we observed a similar pattern of cumulative influence for combined treatment in triple negative MDA-MB-231 breast cancer cell line. Upon treatment with PRKCA siRNA+PTEN plasmid-loaded NPs, a remarkable decrease in the phosphorylated form of AKT protein of PI3K/AKT pathway was observed in Western blot, indicative of diminished proliferative signal. Moreover, in vivo study in MCF-7 xenograft breast cancer mouse model demonstrated that the rate of growth and final tumour volume were reduced significantly in the mouse group that received intravenous treatment of PRKCA siRNA+NPs, and PTEN plasmid+NPs. Our findings demonstrated that PRKCA siRNA and PTEN plasmid loaded into CA NPs attenuated breast tumour growth, suggesting their therapeutic potential in the treatment of breast cancer.

1. Introduction

Breast cancer is the second highest cancer-related illness worldwide, causing over 0.6 million deaths with around three-fold new cases annually [1]. It is caused through numerous genetic changes including gain of function mutations in proto-oncogenes and loss of function mutations in tumour suppressor genes. Among several intracellular signaling proteins, protein kinase C (PRKC) oncoprotein and PTEN tumour suppressor are examples of potential therapeutic targets for blocking the malignancy of breast cancer cells [2].
PRKC is a family of serine/threonine protein kinases involved in a number of signal transduction pathways which regulate several cellular functions including differentiation, proliferation, and apoptosis. Consequently, its inevitable implication in tumorigenesis and metastasis has led to extensive research to date [3]. Human PRKC isoforms encompass 15 members which are classified into three groups [4]. The protein kinase C alpha (PRKCα) isoform, encoded by PRKCA gene, belongs to the ‘classical’ group which can be activated by phospholipids, Ca2+, and diacylglycerol (DAG), a lipid second messenger formed upon stimulation of membrane receptors, such as receptor tyrosine-kinases and G-protein coupled receptors [5,6,7]. Due to multifaceted and highly tissue-specific functions, PRKCα was shown to be downregulated in colorectal and kidney cancer. The anti-tumorigenic role was inferred from spontaneous formation of intestinal tumour in PRKCα-deficient mouse [8]. However, importantly, PRKCα acts as a tumour promoter and is reported to be upregulated in breast, bladder, endometrial and brain cancers. For the tumorigenic role, it not only supports proliferation, but also resists apoptosis due to radiation and chemotherapy [7]. Because there are numerous studies linked PRKCα to increased proliferation and anti-apoptotic signals [9,10,11], there is a growing interest in this kinase as a potential target for breast cancer therapy. This isozyme of PRKC is upregulated in breast cancer accompanied with endocrine resistance [12,13]. Tonetti, D.A. et al. showed that expression of PRKCα in primary breast tumours is predictive of tumour reappearance following tamoxifen treatment [13]. Likewise, expression of PRKCα was elevated in Triple Negative Breast Cancer (TNBC) patients and shown to be responsible for chemotherapy resistance and metastasis [11]. In this study, we deployed RNA interference therapy using short interfering RNA (siRNA) against PRKCA gene to silence its expression with a view to reduce the proliferative signal resulting in diminished breast cancer cell growth.
Another therapeutic target in this study was PTEN (phosphatase and tensin homolog), encoded by the PTEN gene on chromosome 10q23.31 [14]. PTEN, the first identified phosphatase tumour suppressor, has dual phosphatase activity on both lipid and protein and plays important roles in regulation of cell growth, migration and genomic stability [15,16,17]. Its lipid phosphatase activity dephosphorylates PIP3 to PIP2 and thus negatively regulates the phosphatidylinositol-3-kinase (PI3K)/protein kinase B (Akt) pathway [18]. PTEN, as a protein phosphatase, directly dephosphorylates and thus downregulates AKT, which leads to an upsurge of p27 levels and causes apoptosis [19]. However, its protein phosphatase activity is widely noticed in the nucleus where it works on centromere protein C1 (CENP-C1), DNA repair protein RAD51, anaphase-promoting complex (APC) and E-cadherin (encoded by CDH1) and thus contributes to DNA repair and cell-cycle arrest [18].
PTEN loss can be sporadic or hereditary. Loss of heterozygosity is common for PTEN. However, the gene can be silenced by missense or epigenetic mutations as well [14]. Knudson’s second hit theory that tumour suppressor genes need two mutations to manifest symptoms does not fit for PTEN. In fact, just a 20% reduction in the protein level was sufficient to induce tumourigenesis in a hypermorphic mouse model with the highest penetrance for breast cancer [20,21]. A mutant protein without its lower level of expression due to the loss of an allele was proved to be more tumourigenic. In a heterozygous mutant case, the catalytically inactive mutant protein dimerizes with the wild-type protein, and predictably, the resultant dimer is catalytically less active. Interestingly, the mutant protein slowly replaces the normal protein to make a homodimer, ultimately removing the brake on proto-oncogenic PI3K/AKT pathway [22,23]. Loss of PTEN is associated with tumourigenesis. Germline loss was reported in a group of diseases collectively described as PTEN hamartoma tumour syndromes (PHTS), of which Cowden syndrome is the most studied one. Of Cowden syndrome patients, 80% possess PTEN germ-line mutations, and females develop a 25–50% lifetime risk of having breast cancer. In sporadic breast carcinomas, the occurrence of PTEN loss is 30–40% [24]. PTEN loss is associated with poor outcome in hormone-positive, HER2-positive or -negative breast cancer [17]. In breast cancer, PTEN loss contributes to drug resistance and helps evade immune regulation by inducing overexpression of programmed cell death ligand 1 (PD-L1) [17,25]. In view of the importance of PTEN function as a tumour suppressor, the wild type PTEN gene containing a functional version of the lost gene was planned here to be delivered into the breast cancer cells, using carbonate apatite nanoparticles (CA NPs). Moreover, PTEN acts as a major antagonist of PI3K activity. Therefore, we tried to combine the treatment of siRNA against PRKCA gene with tumour suppressor PTEN plasmid in order to enhance PTEN protein expression, with a view of obtaining a synergistic or additive effect of the formulation in decreasing breast cancer cell growth both in vitro and in vivo.
In order to protect the siRNA/DNA from nuclease-mediated degradation in intracellular and extracellular environment, smart pH-sensitive inorganic CA NPs have been employed for effective nucleic acid transfer onto the cancer cells with positive therapeutic impact. Chowdhury et al. had established development of proficient, biodegradable inorganic NPs of CA with ability of effective intracellular delivery and release of associated siRNA, and plasmid DNA from endosomes to cytosol, leading to specific cleavage of a particular mRNA transcript, or expression of a desirable protein, respectively [26]. At low pH 7.4, in bicarbonate buffered medium, addition of Ca2+ salt and plasmid DNA or siRNA generates nano-sized carbonate apatite/siRNA/DNA complexes, following incubation at 37 °C for 30 min. Next, FBS is added to stop further nanoparticle complex formation [27]. In Field Emission Scanning Electron Microscope (FE-SEM) images, CA NPs displayed spherical shape, rough texture, and an average diameter of 50–300 nm [28,29,30]. With molecular formula Ca10 (PO4)6−x (CO3)x (OH)2, the small sized nanoparticles have durable binding affinity towards the siRNA/DNA; the positively charged Ca2+ present in the CA NPs can electrostatically combine with the negatively charged siRNA/DNA molecules and come close to the cell membrane through ionic interaction, ultimately transporting the siRNA/DNA into cytoplasmic acidic compartments (endosomes) by endocytosis [27]. Upon cellular internalization by endocytosis, particles are quickly dissolved into component ions such as Ca2+, PO43− and HCO3 in endosomal acidic pH, resulting in particle dissolution, swelling and breakage of the endosomes following development of osmotic pressure across the endosomal membrane, and release of the siRNA/DN A in cytosol [27,28]. In the cytoplasm, the released siRNA is merged into a RISC (RNA-induced silencing complex) and relaxed into single-stranded RNAs by Argonaute-2. This single-stranded RNA-associated RISC finally guides and particularly degrades the complementary target mRNA with the help of Argonaute-2 [31,32]. In case of plasmids, negatively charged plasmid DNA immediately interacts with several microtubule proteins in the cytosol, like kinesin and dynein for plasmid translocation to the nucleus through the nuclear pore or during cell division, promoting a high level of transgene expression in cancer cell lines [33]. With low immunogenicity and toxicity effects, these NPs ensure prolonged plasma half-life and enhanced tumour accumulation of the nucleic acids, eventually enabling their efficient cellular uptake via endocytosis and fast intracellular release [27]. This study sheds light on the very first use of biodegradable CA NPs to deliver PRKCA siRNAs and PTEN plasmid into breast cancer cells and investigate the effect of selective gene silencing and gene augmentation on tumour regression.

2. Materials and Methods

2.1. Materials

Dulbecco’s Modified Eagle Medium (DMEM) powder with high glucose (containing L-glutamine, pyridoxin hydrochloride, sodium pyruvate, and without sodium bicarbonate) and DMEM liquid were purchased from Sigma (St. Louis, MO, USA). Fetal Bovine Serum (FBS), Trypsin-Ethylene Diamine Tetra Acetate (Trypsin-EDTA) and penicillin-streptomycin were obtained from Gibco BRL (California, United States); calcium chloride dihydrate (CaCl2·2H2O), sodium bicarbonate, sodium sulphite, dimethyl sulphoxide (DMSO) and thiazolyl blue tetrazolium bromide (MTT) reagent were purchased from Sigma-Aldrich (St. Louis, MO, USA). The Hs-PRKCA_5 Flexitube siRNA was purchased from Qiagen (NM_002737, Geneglobe ID-SI00301308) and plasmid encoding PTEN tumour suppressor gene was from ‘Addgene’ (Watertown, MA, USA). The antibiotic, ampicillin from Fisher Scientific (Loughborough, Leicestershire, UK), Luria Bertani (LB) agar from Merck (St. Louis, MO, USA) and LB broth were procured from Laboratorios CONDA (Madrid, Spain). Two human breast cancer cell lines, MDA-MB-231, MCF-7, and one mouse breast cancer cell line, 4T1, were obtained from ATCC (American Type Culture Collection). For Western blotting, Tween-20 and Pierce ECL Western blot detection reagents were purchased from Bio-Rad Laboratories, Inc. (Hercules, CA, USA). DTT (Bio-Rad), bovine serum albumin, BSA protease inhibitor and phosphatase inhibitor cocktail were obtained from Sigma (St. Louis, MO, USA). Monoclonal IgG primary antibodies raised in rabbit for phospho-AKT, total AKT, GAPDH, and the horseradish peroxidase (HRP)-conjugated secondary goat anti-rabbit IgG antibody were from Cell Signaling Technology, Inc. (Beverly, MA, USA).

2.2. Formulation of CA NPs

Commercially available DMEM powder (with high glucose and without sodium bicarbonate) was mixed with 44 mM of sodium bicarbonate and pH was adjusted to 7.4. Formation of CA nanoparticle was attained by adding required volume of 1 M exogenous CaCl2·2H2O (4 μL for in vitro and 8 μL for in vivo usage) and/or potential therapeutics (siRNA/plasmid) into 1 mL final volume of the fresh media, and incubating at 37 °C for 30 min, followed by addition of 10% FBS to the vial to prevent further generation and consequential aggregation of the particles. FBS was skipped in case of CA NPs for intravenous delivery of siRNA and plasmid.

2.3. Isolation of Plasmid DNA for Gene Transfection

The pCMV-PTEN plasmid contained PTEN gene insert (1209 bp) and a tag/fusion protein named Flag (N-terminal on insert). It is a high copy number plasmid grown in E. coli DH5α cells containing ampicillin resistant genes. For plasmid isolation, E. coli DH5α bacteria harbouring PTEN plasmid gene were grown in LB agar plates (ampicillin 100 μg/mL) overnight at 37 °C. After 16–18 h, individual colonies were inoculated in 100 mL of LB broth in presence of ampicillin antibiotic and grown in an incubator (Labtech Company) with shaking at 220 rpm for 16–18 h at 37 °C. The plasmids were isolated and purified from bacteria using plasmid Mega kit (Qiagen, Germany). The concentration of extracted DNA was measured in ‘Implen’ nanodrop machine. A ratio of absorbance at 260 and 280 with 1.8 reading or more was indicative of highly pure extracted DNA. Furthermore, purified DNA was run on 0.8% agarose gel and the DNA bands were visualized under ultraviolet transilluminator using ‘Quantity One’ Bio-Rad software.

2.4. Reconstitution of PRKCA siRNA

The lyphilized PRKCA siRNA was reconstituted with RNase-free water to obtain a stock solution of 10 μM and stored at −20 °C as recommended by Qiagen.

2.5. Size and Zeta Potential Measurement

The size and zeta potential of PRKCA siRNA and PTEN plasmid complexed with CA NPs were measured using Malvern Zeta Sizer Nano (United Kindom). The NPs, PRKCA siRNA+NPs, PTEN+NPs and PRKCA siRNA+PTEN+NP complexes were formed by adding 4 μL of 1 M CaCl2, 1 nM siRNA against PRKCA and 1 μg of PTEN plasmid into 1 mL of DMEM (pH 7.4), followed by incubation at 37 °C for 30 min. After that, 10% FBS was added in order to stop further formation of NPs complexes which were subsequently maintained on ice till measurement was done with Zetasizer. The data was analyzed using Zetasizer software 6.20 and all samples were measured in duplicates, with the values presented as mean ± SD.

2.6. Cell Culture and Seeding

The three breast cancer cell lines- MCF-7, MDA-MB-231 and 4T1 were grown in culture flask in DMEM supplemented with 10% FBS and 1% penicillin and streptomycin antibiotic in a 37 °C incubator humidified with 5% CO2. One day before treatment, exponentially growing cells were trypsinised, centrifuged and resuspended using DMEM. Cells were counted under optical microscope using a hemocytometer and seeded in a 24-well plate with cell density of 50,000 cells per well. Cells were allowed to attach overnight at 37 °C with 5% CO2 before transfection.

2.7. Cell Viability Assessment with MTT Assay

Following incubation of the breast cancer cells in presence of NPs, PRKCA siRNA+NPs, PTEN+NPs and PRKCA siRNA+PTEN+NPs for 48 h, 50 µL of MTT solution (5 mg/mL in PBS) was added to each well and the cells were incubated for 4 h at 37 °C. The medium was removed and 300 µL of DMSO was added to each well to dissolve the purple formazan crystals and absorbance was measured in a micro plate reader at 595 nm with a reference wavelength of 630 nm. Cell viabilities were normalized to the absorbance of untreated cells (control). Each treatment experiment was performed in triplicate and cell viability was expressed as mean ± SD.
The cell viability in the treated wells was expressed as a percentage and was calculated using the absorbance values obtained from MTT assay. The following formulae were used to calculate the cell viability data:
Cell   viability   ( % ) = Abs ( sample ) Abs   ( negative   control ) Abs   ( positive   control ) Abs   ( negative   control ) × 100

2.8. Western Blotting

MCF-7 cells were incubated with respective siRNA- and or plasmid-loaded NPs for a consecutive period of 48 h and washed with a pre-chilled phosphate buffered saline prior to lysis. The cell lysates were then centrifuged at 13,000 rpm for 10 min at 4 °C using a refrigerated centrifuge (Sartorius Stedim Biotech, Göttingen, Germany) and protein concentration of the cell lysate was estimated using the Bradford assay. The protein extracts were subjected to sodium dodecyl sulphate polyacrylamide gel electrophoresis (precast gel) at 60 V for 90 min, and the resolved proteins were electro-transferred for 7 min at 25 V to PVDF membranes (Thermo Scientific, Waltham, MA, USA) using Turbo transfer unit (Bio-Rad, Hercules, CA, USA). The membranes were blocked for 1 h at room temperature with Tris buffered saline with Tween 20 (TBST) containing 5% skimmed milk (Merck, St. Louis, MO, USA). The membranes were then incubated with 1:1000 primary antibody (Cell Signaling Technology, Beverly, MA, USA) in TBS-T with 5% bovine serum albumin for overnight, at 4 °C with slow rocking. The membranes were washed 5 times with TBST and incubated with 1:3000 secondary antibody (anti-rabbit IgG-HRP linked) for 60 min at RT with slow rocking. Next, Clarity Western ECL substrate (Bio-Rad, Hercules, CA, USA) was added following incubation for 5 min. Bands were visualized using Bio-Rad Gel Doc system with Quantity One chemiluminescent software.

2.9. Study of Tumor Regression Pattern in Breast Tumor-Induced Mouse Model (In Vivo)

For in vivo tumour regression study, MCF-7 xenograft mouse model was developed using standard procedure and subsequently treated with NPs carrying siRNA against PRKCA and/or PTEN plasmid, and the tumour growth was monitored in a longitudinal way. The Monash University Animal Ethics Committee approved all the procedures involved in this experiment (MUM/2018/12). Female Balb/c mice (6–8 weeks old) of 15–20 gm of body weights were purchased from School of Medicine and Health Science animal facility, Monash University and maintained in 12:12 light:dark condition by providing them ad libitum chow and water. Using standard methodology, approximately 1 × 10⁶ MCF-7 cells (in 100 µL PBS) were injected subcutaneously on the mammary pad of mice unilaterally, and the mice were checked between three to five days for the development of tumour by touching the area of injection with index finger. As the tumour volume reached around 25–30 mm3, the mice were randomly distributed into four different groups (5 mice per group) for treatments. On day 8, mice were treated intravenously through tail-vein injection with 100 μL of NP (8 M Ca2+), PRKCA siRNA+NP (100 nM siRNA), PTEN+NP (40 µg of plasmid) and PRKCA siRNA+PTEN+NP (100 nM siRNA and 40 µg of plasmid). FBS was skipped in case of NPs for intravenous delivery of siRNA and plasmid; rather, the formulation was kept on ice to prevent aggregation of nanoparticles. The second dose was administered at day 10, i.e., after 2 days from the 1st dose. During the treatment period, the size of the tumour was measured at regular intervals (4 times/week). The gross body weights of mice were monitored and the lengths and widths of the tumours were measured using the vernier caliper in mm scale for 22 days. Moreover, the gross body weights of mice and their activities were monitored for study purpose. The volume of the tumour was calculated using the following formula:
Tumour   volume   ( mm 2 ) = 1 2 ( Length   ×   Width 2 )
The data are presented here as the mean ± SD of tumour volumes from each group. At the end of the study, at day 22, mice were humanly sacrificed by cervical dislocation following 100% CO2 exposure for few seconds and tumours were excised for further study.

2.10. Statistical Analysis

For cell viability study, data were expressed as means ± standard deviation (SD) for (n = 3) biological replicates. Student’s t-test was used throughout. For in vivo tumour regression study, LSD post-hoc test for one way ANOVA was used to analyze and compare the significant difference between treatment groups. The differences among groups were considered significant at p < 0.05.

3. Results

3.1. Size and Zeta Potential of PRKCA Specific siRNA- and PTEN Plasmid-Loaded NPs

Prior to cellular transfection, we assessed the size and zeta potential of the siRNA and/or plasmid NPs complexes, and the results were plotted in Figure 1. CA NPs were prepared with 4 mM exogenous CaCl2 in 1 mL of bicarbonate buffered-DMEM medium with 1 nM PRKCA specific siRNA and/ or 1 µg of PTEN plasmid DNA, followed by incubation for 30 min at 37 °C. Next, 10% FBS was added to stop further siRNA/plasmid-NPs complex formation. Figure 1a,b demonstrated the average sizes and zeta potential of PRKCA+NPs, PTEN+NPs and PRKCA+PTEN+NPs formulations. The sizes of the NPs with loaded PRKCA siRNA, PTEN plasmid and PRKCA siRNA+PTEN plasmid were ~112 nm, ~196 nm and ~168 nm in diameter, respectively (Figure 1a). These nanoscale-sized complexes are advantageous for cellular transfection compared to large sized vector carriers.
As shown in Figure 1b, the zeta potential of NPs control was observed to be −11 mV. Incorporation of negatively charged siRNA and or plasmid DNA molecules increased the negative surface charge of the siRNA/plasmid +NPs complexes. The zeta potential for PRKCA+NPs, PTEN+NPs and PRKCA+PTEN+NPs complexes was recorded as −12 mV, −13 mV and −11.5 mV, respectively. As our NPs contain both positive and negative ions, such as Ca2+, PO43−, OH, the negative charge may come from the protein corona formed around the NPs in serum-containing media. In fact, a recent study revealed that at physiological pH, CA NPs attach to both positive and negative proteins; however, the negative proteins outnumbered the positive ones, which could contribute to the negative zeta potential [28]. Negative zeta potential is advantageous in terms of longer retention in blood stream [34]. Comparison of particle diameter and zeta potential of siRNA, plasmid and NP complex showed that large particles (PTEN+NPs, ~196 nm) possess slightly more negative zeta-potential (−13 mV) compared to small particles (PRKCA+NPs are ~112 nm and PRKCA+PTEN+NPs are ~168 nm).

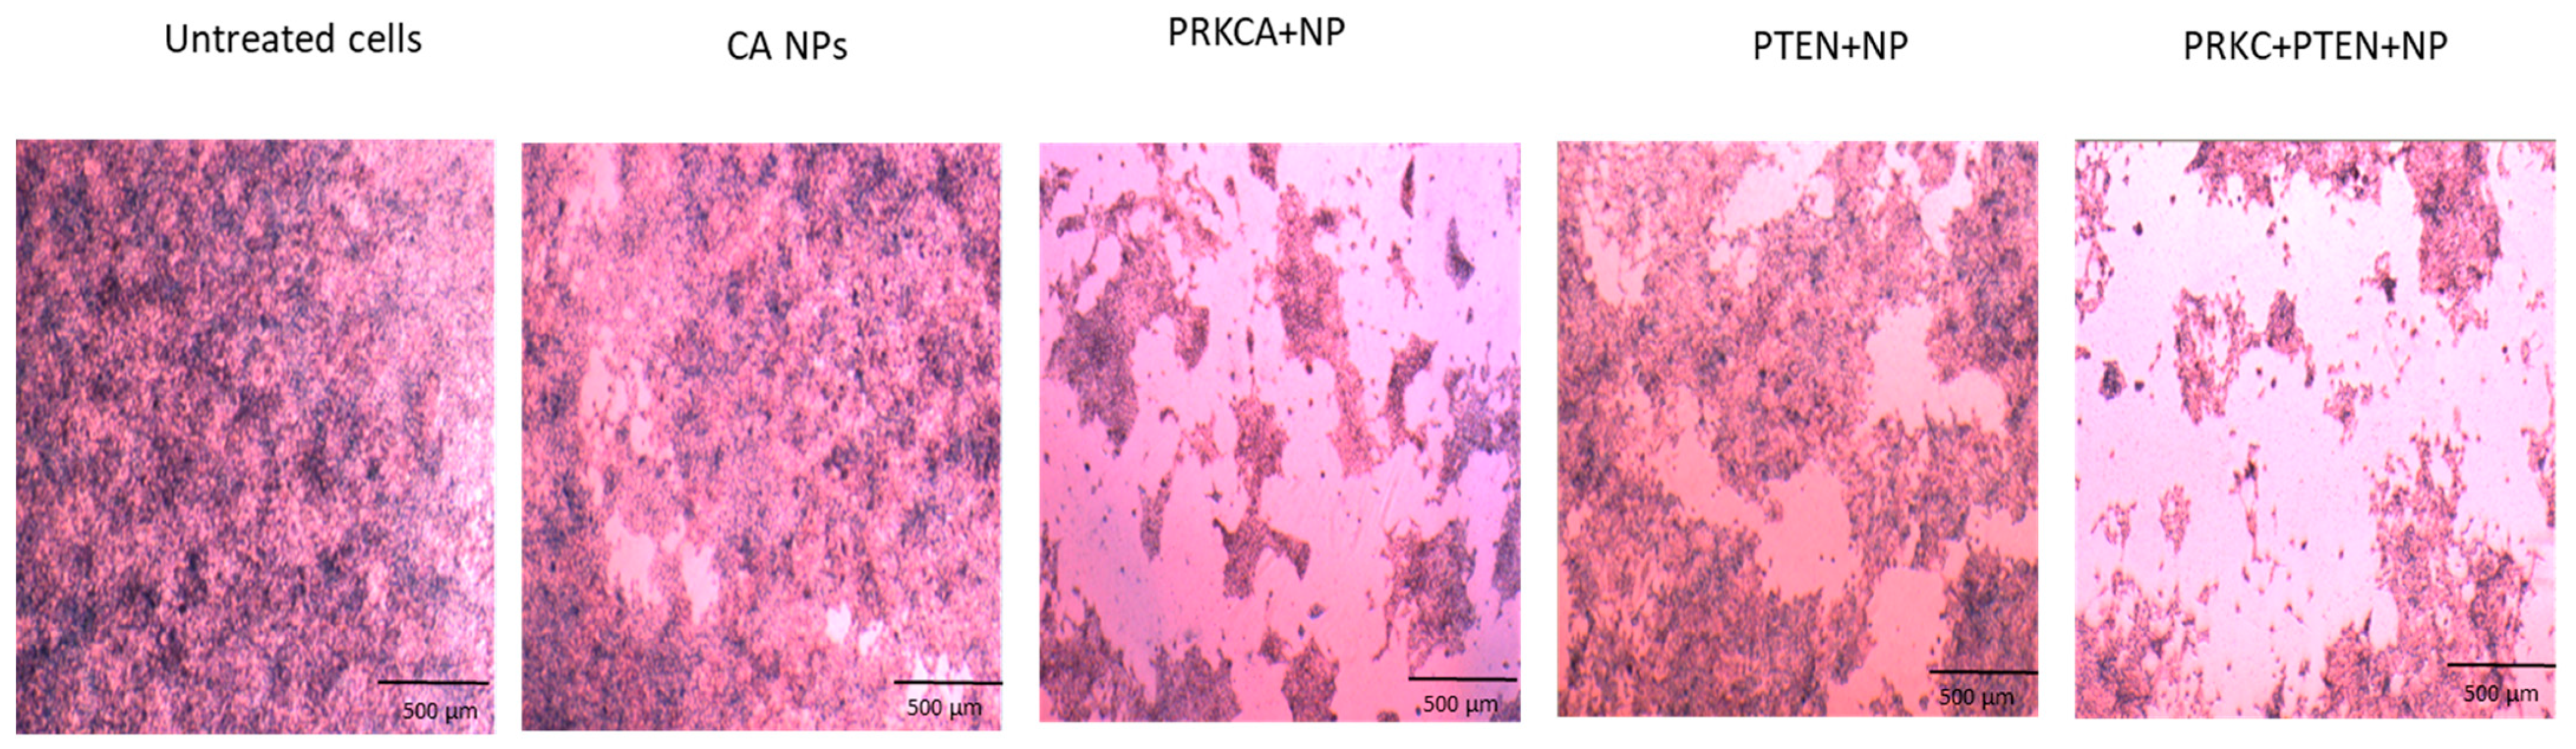
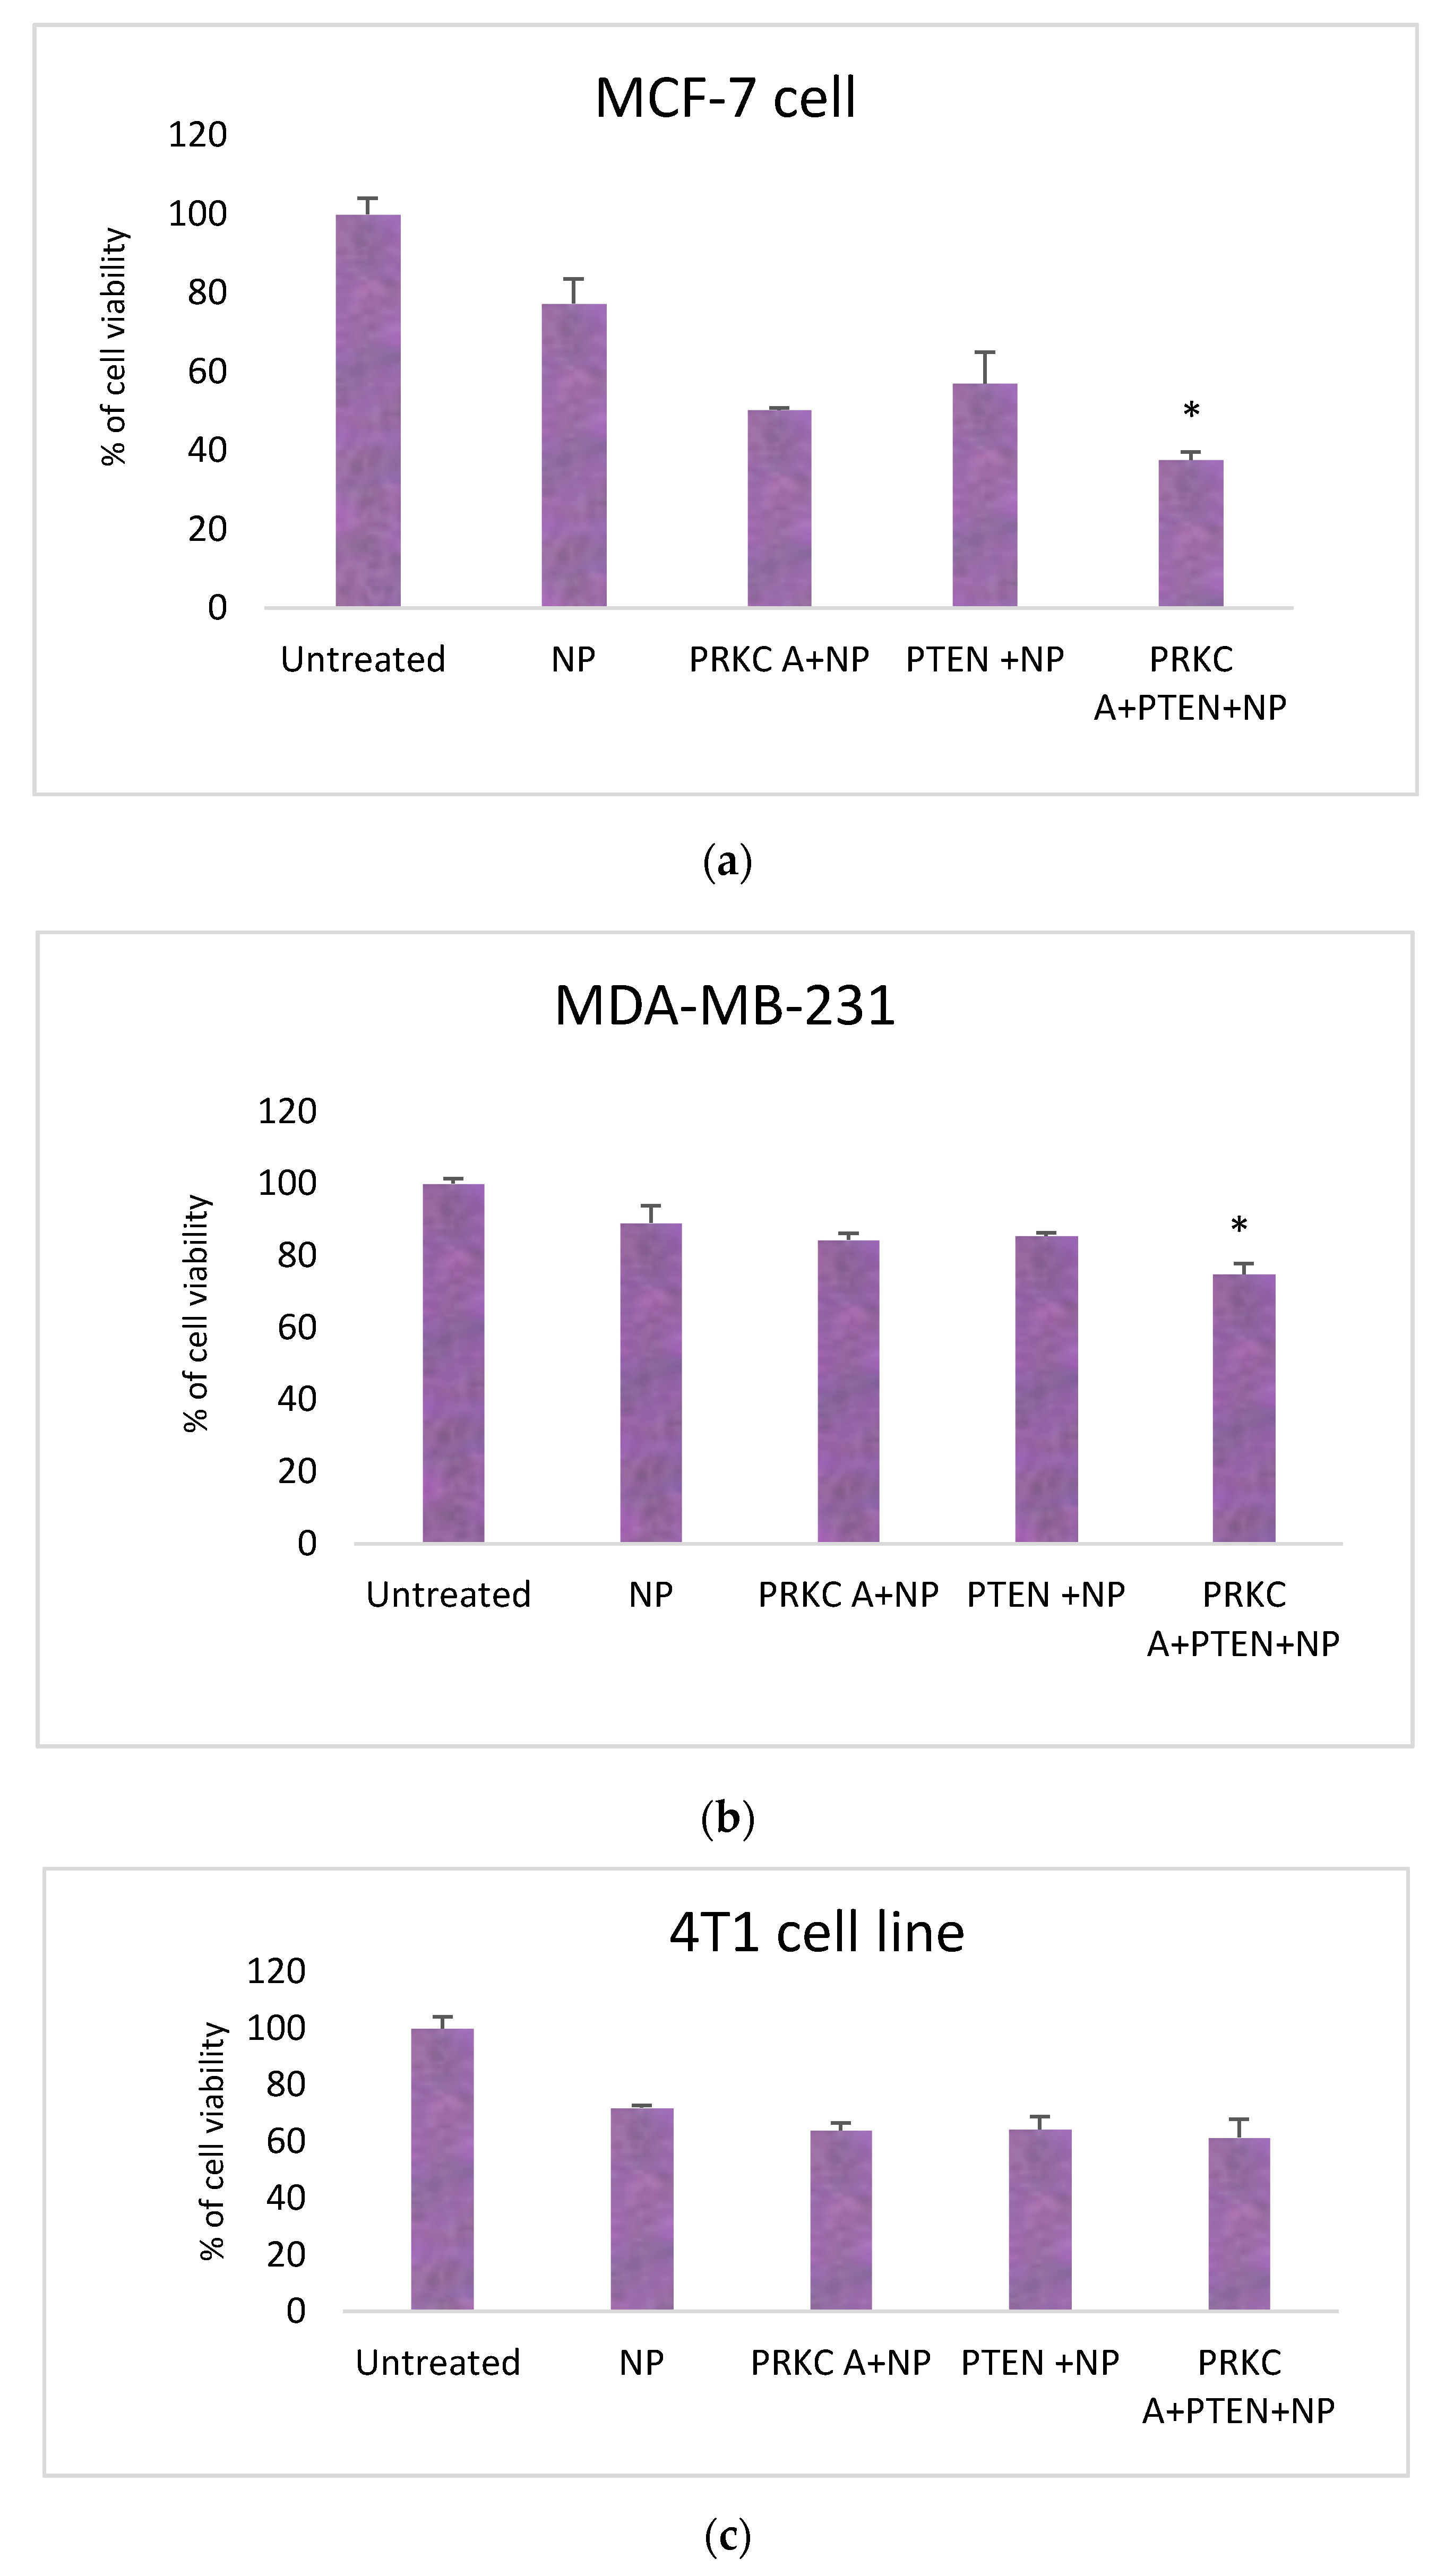
3.2. Co-Delivery of siRNA against PRKCA and PTEN Plasmid Reduced Growth of Breast Cancer Cell Lines

Treatment of breast cancer cells with CA NPs, PRKCA-specific siRNA+NPs, PTEN plasmid+NPs and PRKCA siRNA+PTEN plasmid+NPs for 48 h induced morphological changes in cell size and shape as observed under a light microscope. The images in Figure 2 demonstrated that untreated control cells are packed within 48 h of incubation, while in presence of 4 mM Ca2+, the cells appear to be surrounded by the CA NPs. In addition, microscopic observation of the cells treated with siRNA and plasmid revealed decrease in cellular density in MCF-7 cell line, compared to the untreated control cells. This simple visualization of treated cells with less cell number indicated cell shrinkage and reduced cellular proliferation which was also reflected in the cell viability results.
The cell viability data plotted in Figure 3a–c demonstrated that CA NPs were complexed with PRKCA-specific siRNA and PTEN plasmid for delivery into (a) MCF-7, (b) MDA-MB-231 and (c) 4T1 cell lines.
In MCF-7 cells (Figure 3a), treatment with 1 nM PRKCA siRNA+NPs reduced cell viability to ~50% after 48 h of incubation. Again, 1 µg PTEN+NPs treated cells exhibited ~57% of cell viability. Interestingly, combined treatment with PRKCA siRNA+PTEN+NPs complex curtailed the cell viability to ~37%. In other words, compared to single siRNA and plasmid treated cells, co-delivery of PRKCA siRNA and PTEN gene in this cell line revealed statistically significant decrease (p < 0.05) in cell growth, indicating additive effect of the treatment.
In MDA-MB-231 cell line (Figure 3b), the PRKCA siRNA+NPs treatment declined cell viability to approximately 84%, and intracellular delivery of PTEN+NPs could lower the cell viability to ~85%. Moreover, PRKCA siRNA+PTEN+NPs complex reduced the cell viability to ~75%. Altogether, delivery of both PRKCA siRNA and PTEN genes could induce additive effect compared to the individual siRNA or plasmid treatment in this cell line.
Our observation in 4T1 cells (Figure 3c) showed that treatment with PRKCA siRNA+NPs and PTEN+NPs complexes for a consecutive period of two days led to cell viability of ~64% for both treatments. However, when co-delivered (PRKCA+PTEN+NPs), it reduced the cell viability to ~61% only, indicating no net decline in cell viability was observed compared to the individual siRNA or plasmid gene transfection in 4T1 cell line.
In all of the three cell lines, NPs-only administration reduced cell viability, when compared to untreated cells. The cytotoxicity caused by NPs can be explained by the notion that particles associated with cell membrane could damage cell membrane, while the particles internalized into the cells release Ca2+ upon dissolution into the endosomes, enhancing cytosolic Ca2+ level which is associated with necrosis and apoptosis of the cells [35].

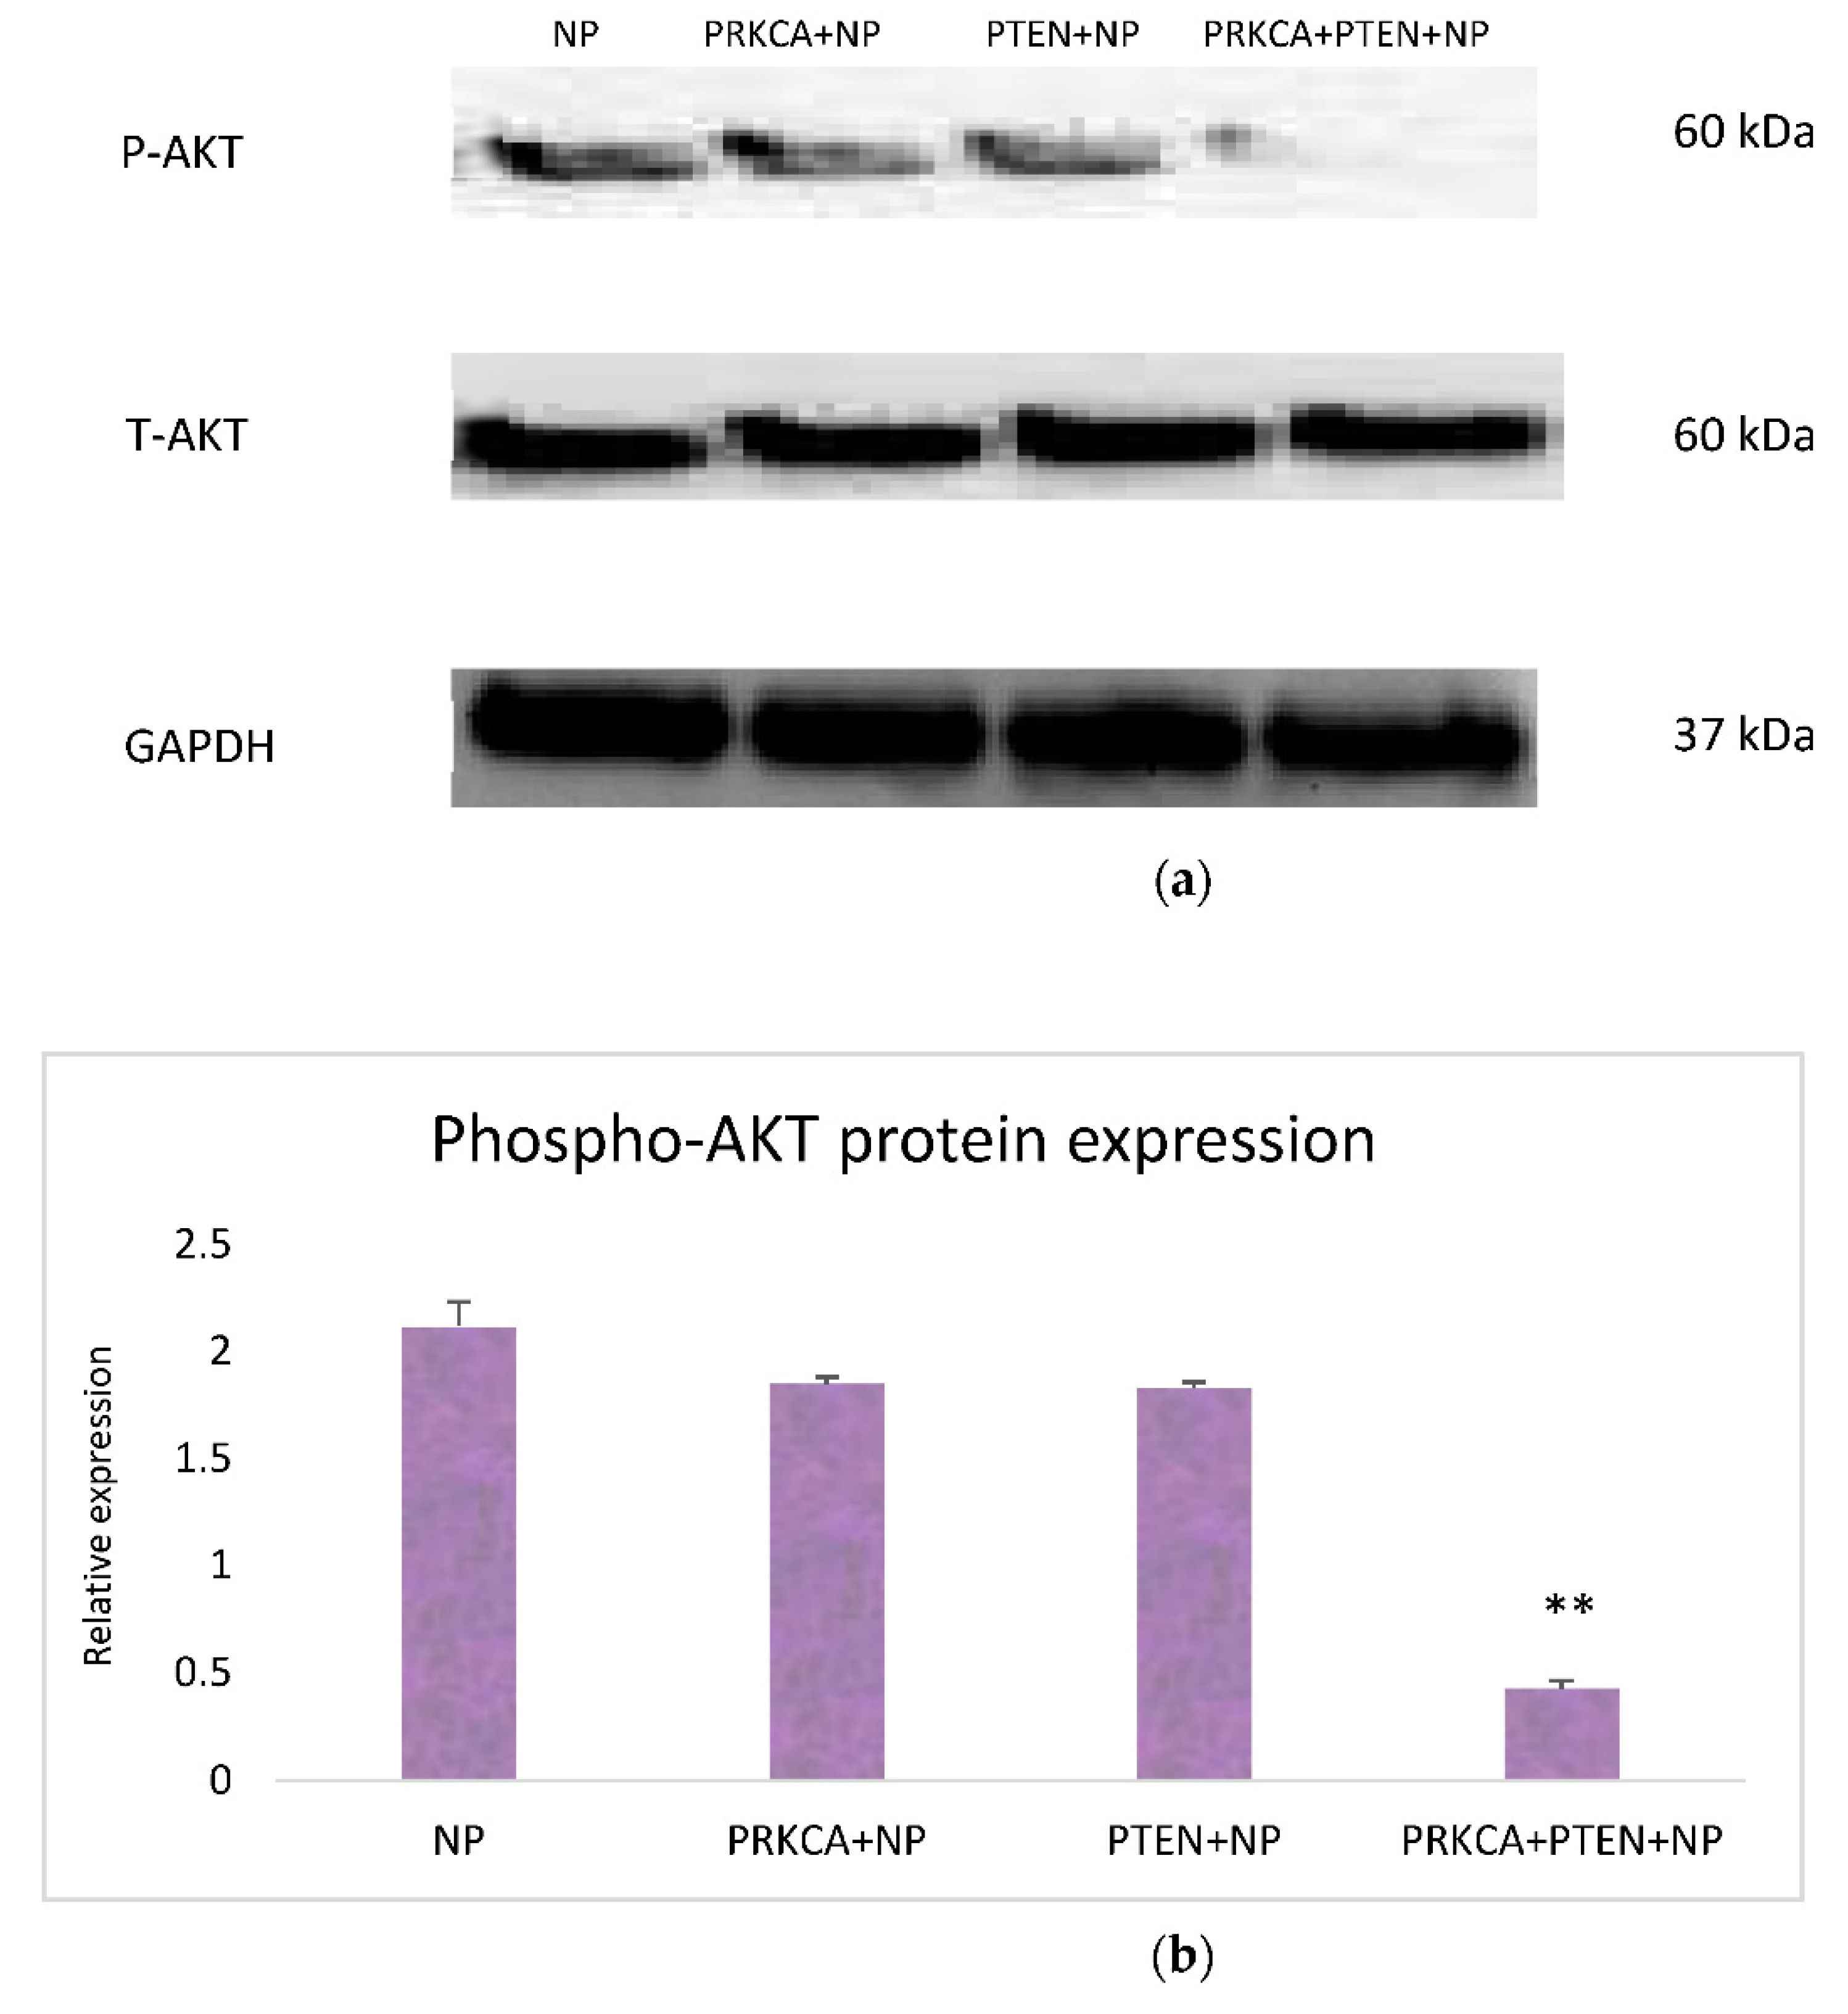
3.3. Effect of Co-Delivery of PRKCA siRNA and PTEN Gene on AKT Signaling Pathway: Western Blot Analysis

In order to further verify our cell viability results in MCF-7 cells and to interpret the effect of the co-treatment on cellular proliferation pathway, after treatment of the cancer cells with NPs (control), PRKCA siRNA+NPs, PTEN+NPs and PRKCA siRNA+PTEN+NPs, cell lysates were prepared using a cell lysis buffer. The protein content of the lysates was measured by Bradford protein assay, and 10 µg of proteins for each treatment was loaded onto a precast gel for their separation. Afterwards, the proteins were transferred onto a PVDF membrane using the Trans-Blot Turbo Transfer System (Bio-Rad) and the PVDF membrane was incubated overnight with monoclonal antibodies directed against phospho-AKT (P-AKT), total AKT and GAPDH as housekeeping loading control.
After incubating the PVDF membrane with P-AKT antibody, the same membrane was stripped with a stripping buffer and incubated with another antibody for detection of total AKT in the lysates. As evident from the Western blot image and densitometry analysis (Figure 4a,b), the expression levels of P-AKT protein in the cells treated with PRKCA siRNA+NPs and PTEN+NPs were lower than the NPs control. Notably, the band was almost faded or invisible in the lysate of the cells treated with PRKCA siRNA+PTEN+NPs formulation.
The significantly reduced amount of P-AKT protein was a direct indication of the successful co-delivery effect of the siRNA and the plasmid. Reduced AKT activation refers to subsided survival signal via AKT/mTOR pathway and thus retarded cellular growth [36].

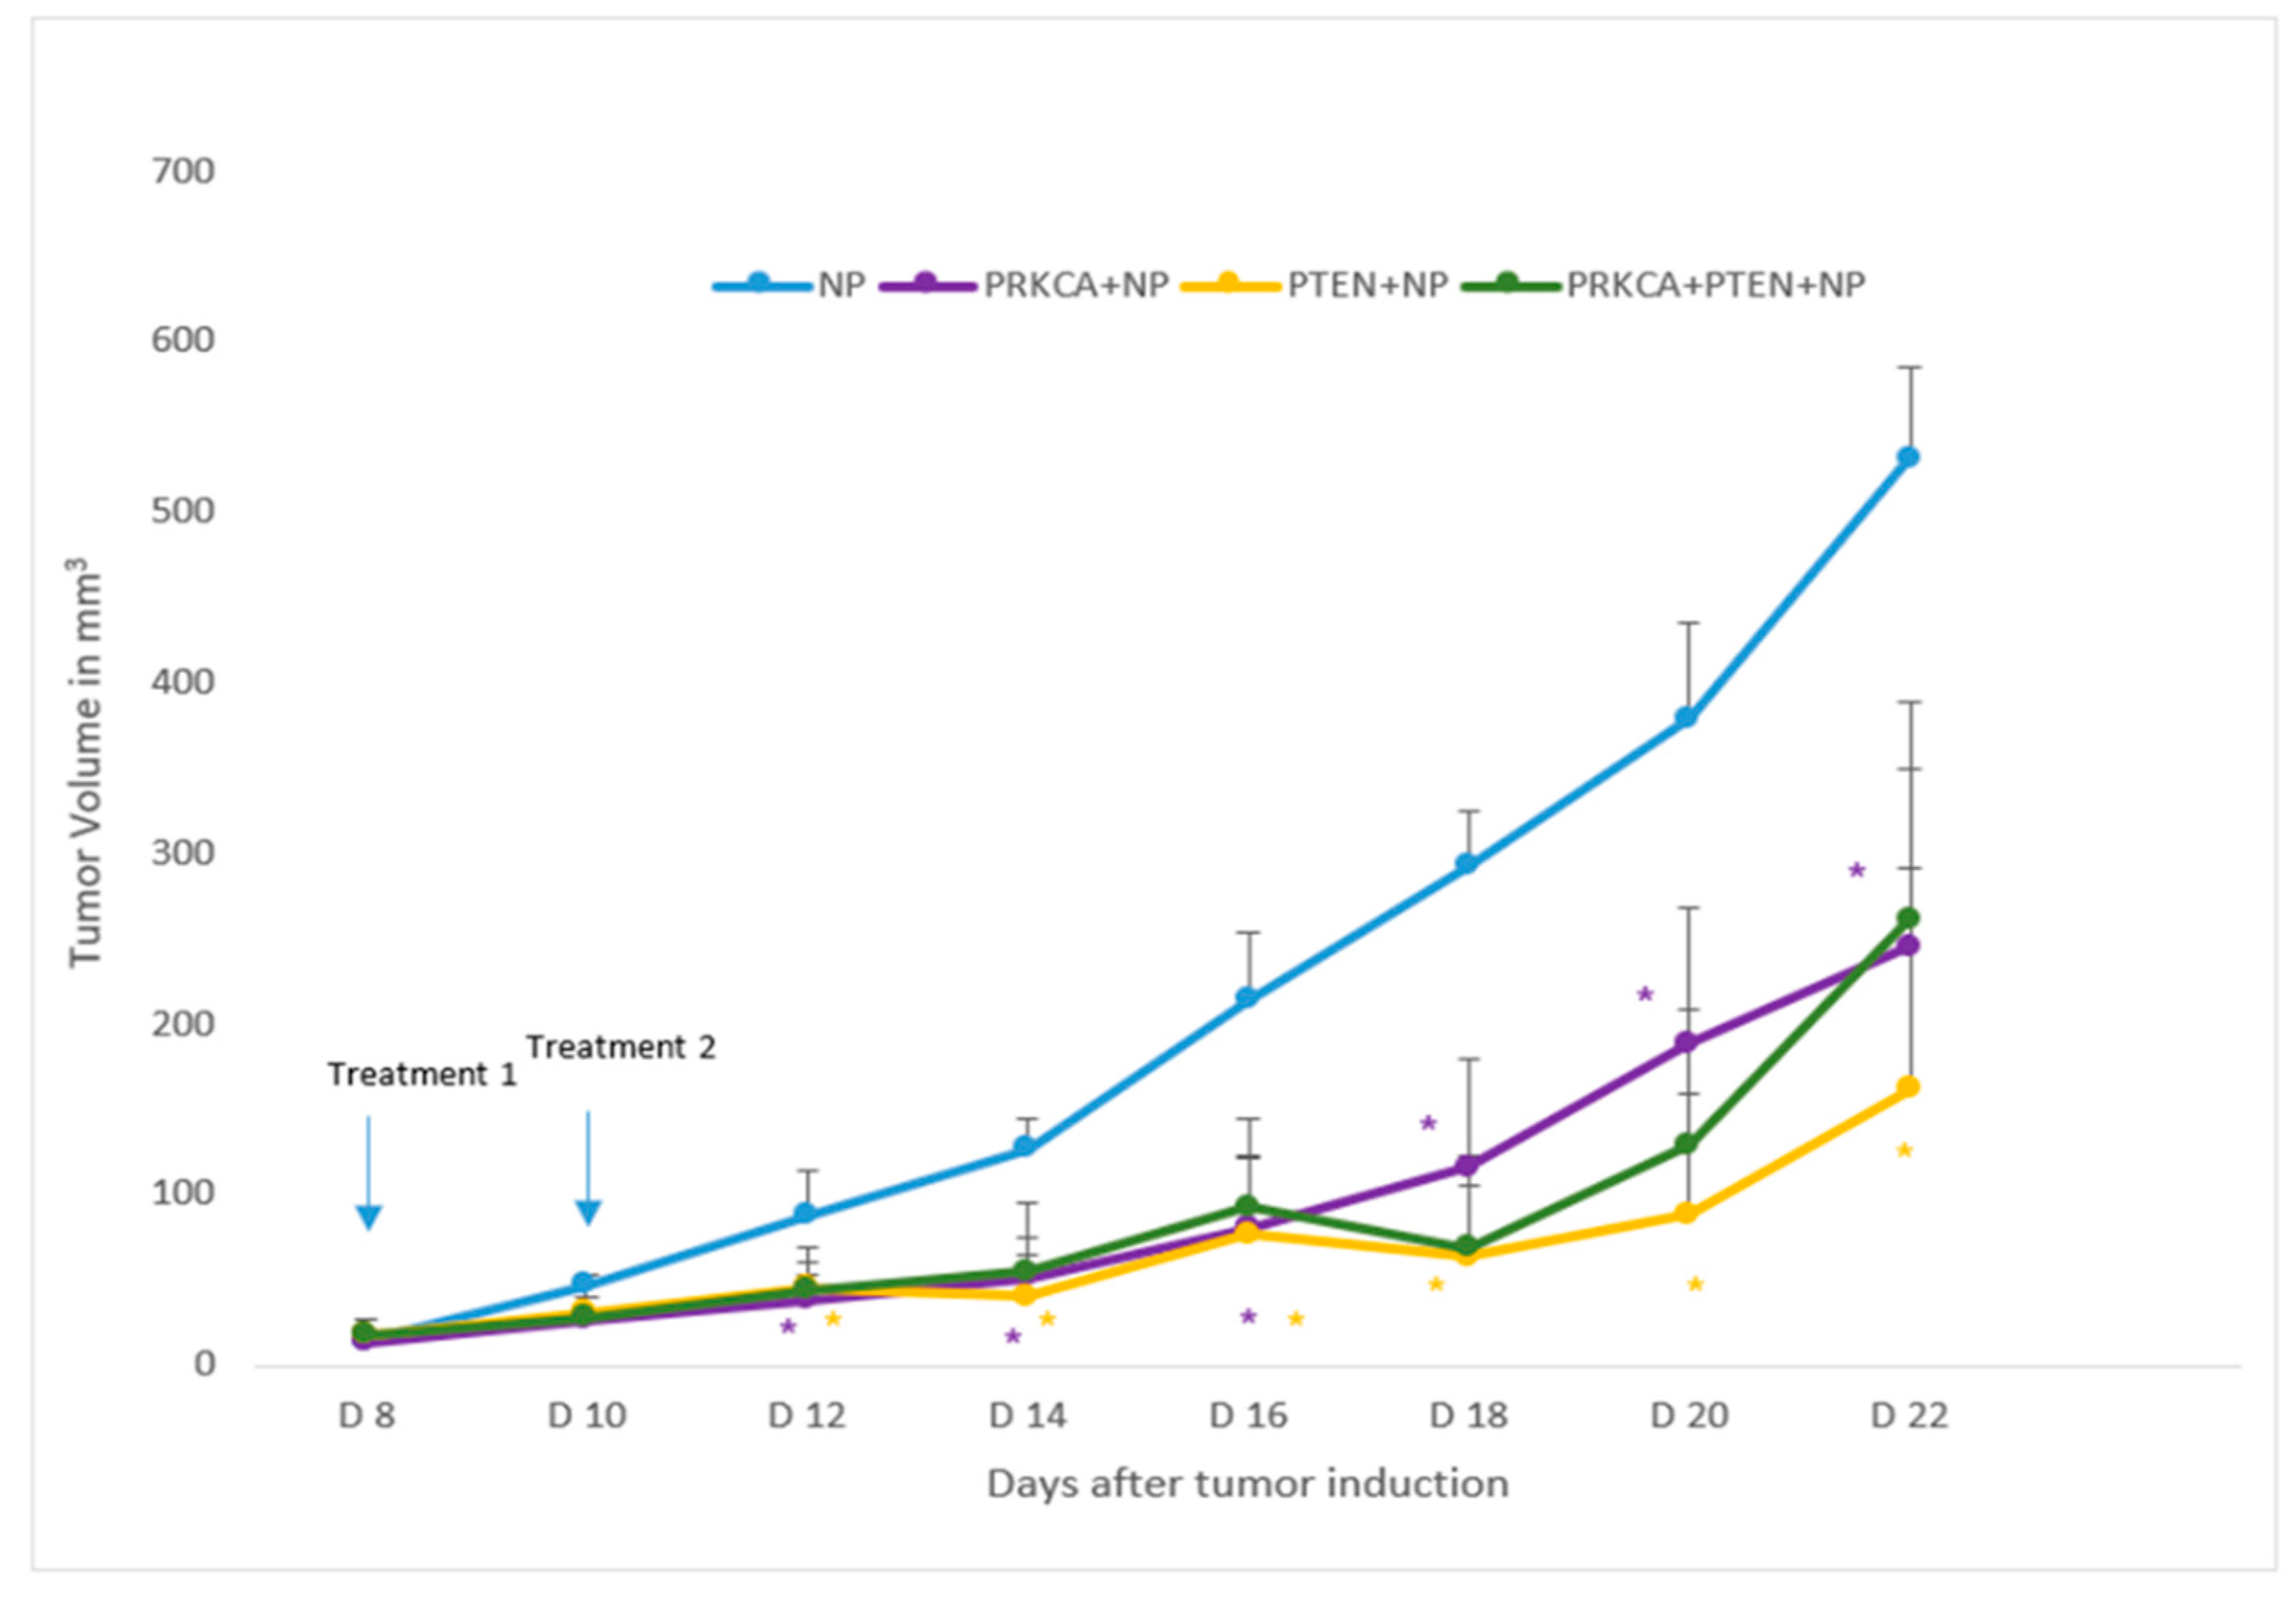
3.4. Influence of NPs-Facilitated PRKCA siRNA and PTEN Tumor Suppressor Gene Delivery on Tumor Regression

Based on cell viability and Western blot results, PRKCA has been revealed as a potential target for siRNA-mediated knockdown in reducing proliferation and/or survival of breast cancer cells. In addition, gene augmentation therapy by delivering PTEN tumour suppressor plasmid with the aid of NPs also showed promising cell viability profile. Moreover, co-treatment of the siRNA and plasmid remarkably exhibited significant decrease in breast cancer cell viability as well as diminished level of proliferation signal by downregulating P-AKT. Considering all the results, we further examined the feasibility of the nano-formulations in an in vivo setting. Because our in vitro cell viability results in MCF-7 cell line were very prominent compared to other two cell lines, we established MCF-7 xenograft mouse model to test our nucleic acid-based nanotherapeutics, PRKCA siRNA+NPs, PTEN+NPs and PRKCA siRNA+PTEN+NPs in comparison with the control (NPs) on the tumour-bearing mice randomly assigned to different groups. Within eight days of cell injection, tumour volume reached approximately 25–30 mm3 (Figure 5a), and mice were treated intravenously through tail-vein injection. As plotted in Figure 6, following intravenous delivery of the formulations, the trend for development of tumour in the mice treated with PRKCA siRNA complexed with CA NPs was drastically reduced compared to the NPs only and the difference was significant at day 12, day 14, day 16, day 18, day 20 and day 22; (* p < 0.05 for PRKCA+NPs vs. NPs).
Moreover, compared to NPs control group, noticeable slow tumour growth was similarly observed in the mouse group treated with PTEN+NPs formulation with a p-value significant at day 12, day 14, day 16, day 18, day 20 and day 22 (* p < 0.05 for PTEN+NPs vs. NPs). This tumour regression profile observed following delivery of wild type PTEN tumour suppressor plasmid in mouse breast tumours using NPs cargo might support the role of PTEN in reducing tumour growth. However, unlike the additive effects both in cell viability and Western blot study, combined delivery of the two components could not significantly reduce the tumour volume in the mouse group treated with PRKCA siRNA+PTEN+NPs formulation. However, the trend for tumour reduction pattern in this group of mice was almost same as the regression pattern followed by the PTEN+NPs treatment group.
Additionally, no mice from any of the treatment groups showed any alteration in the behaviour after the injections while body weight remained almost the same for each group of the mice tested (data not shown).

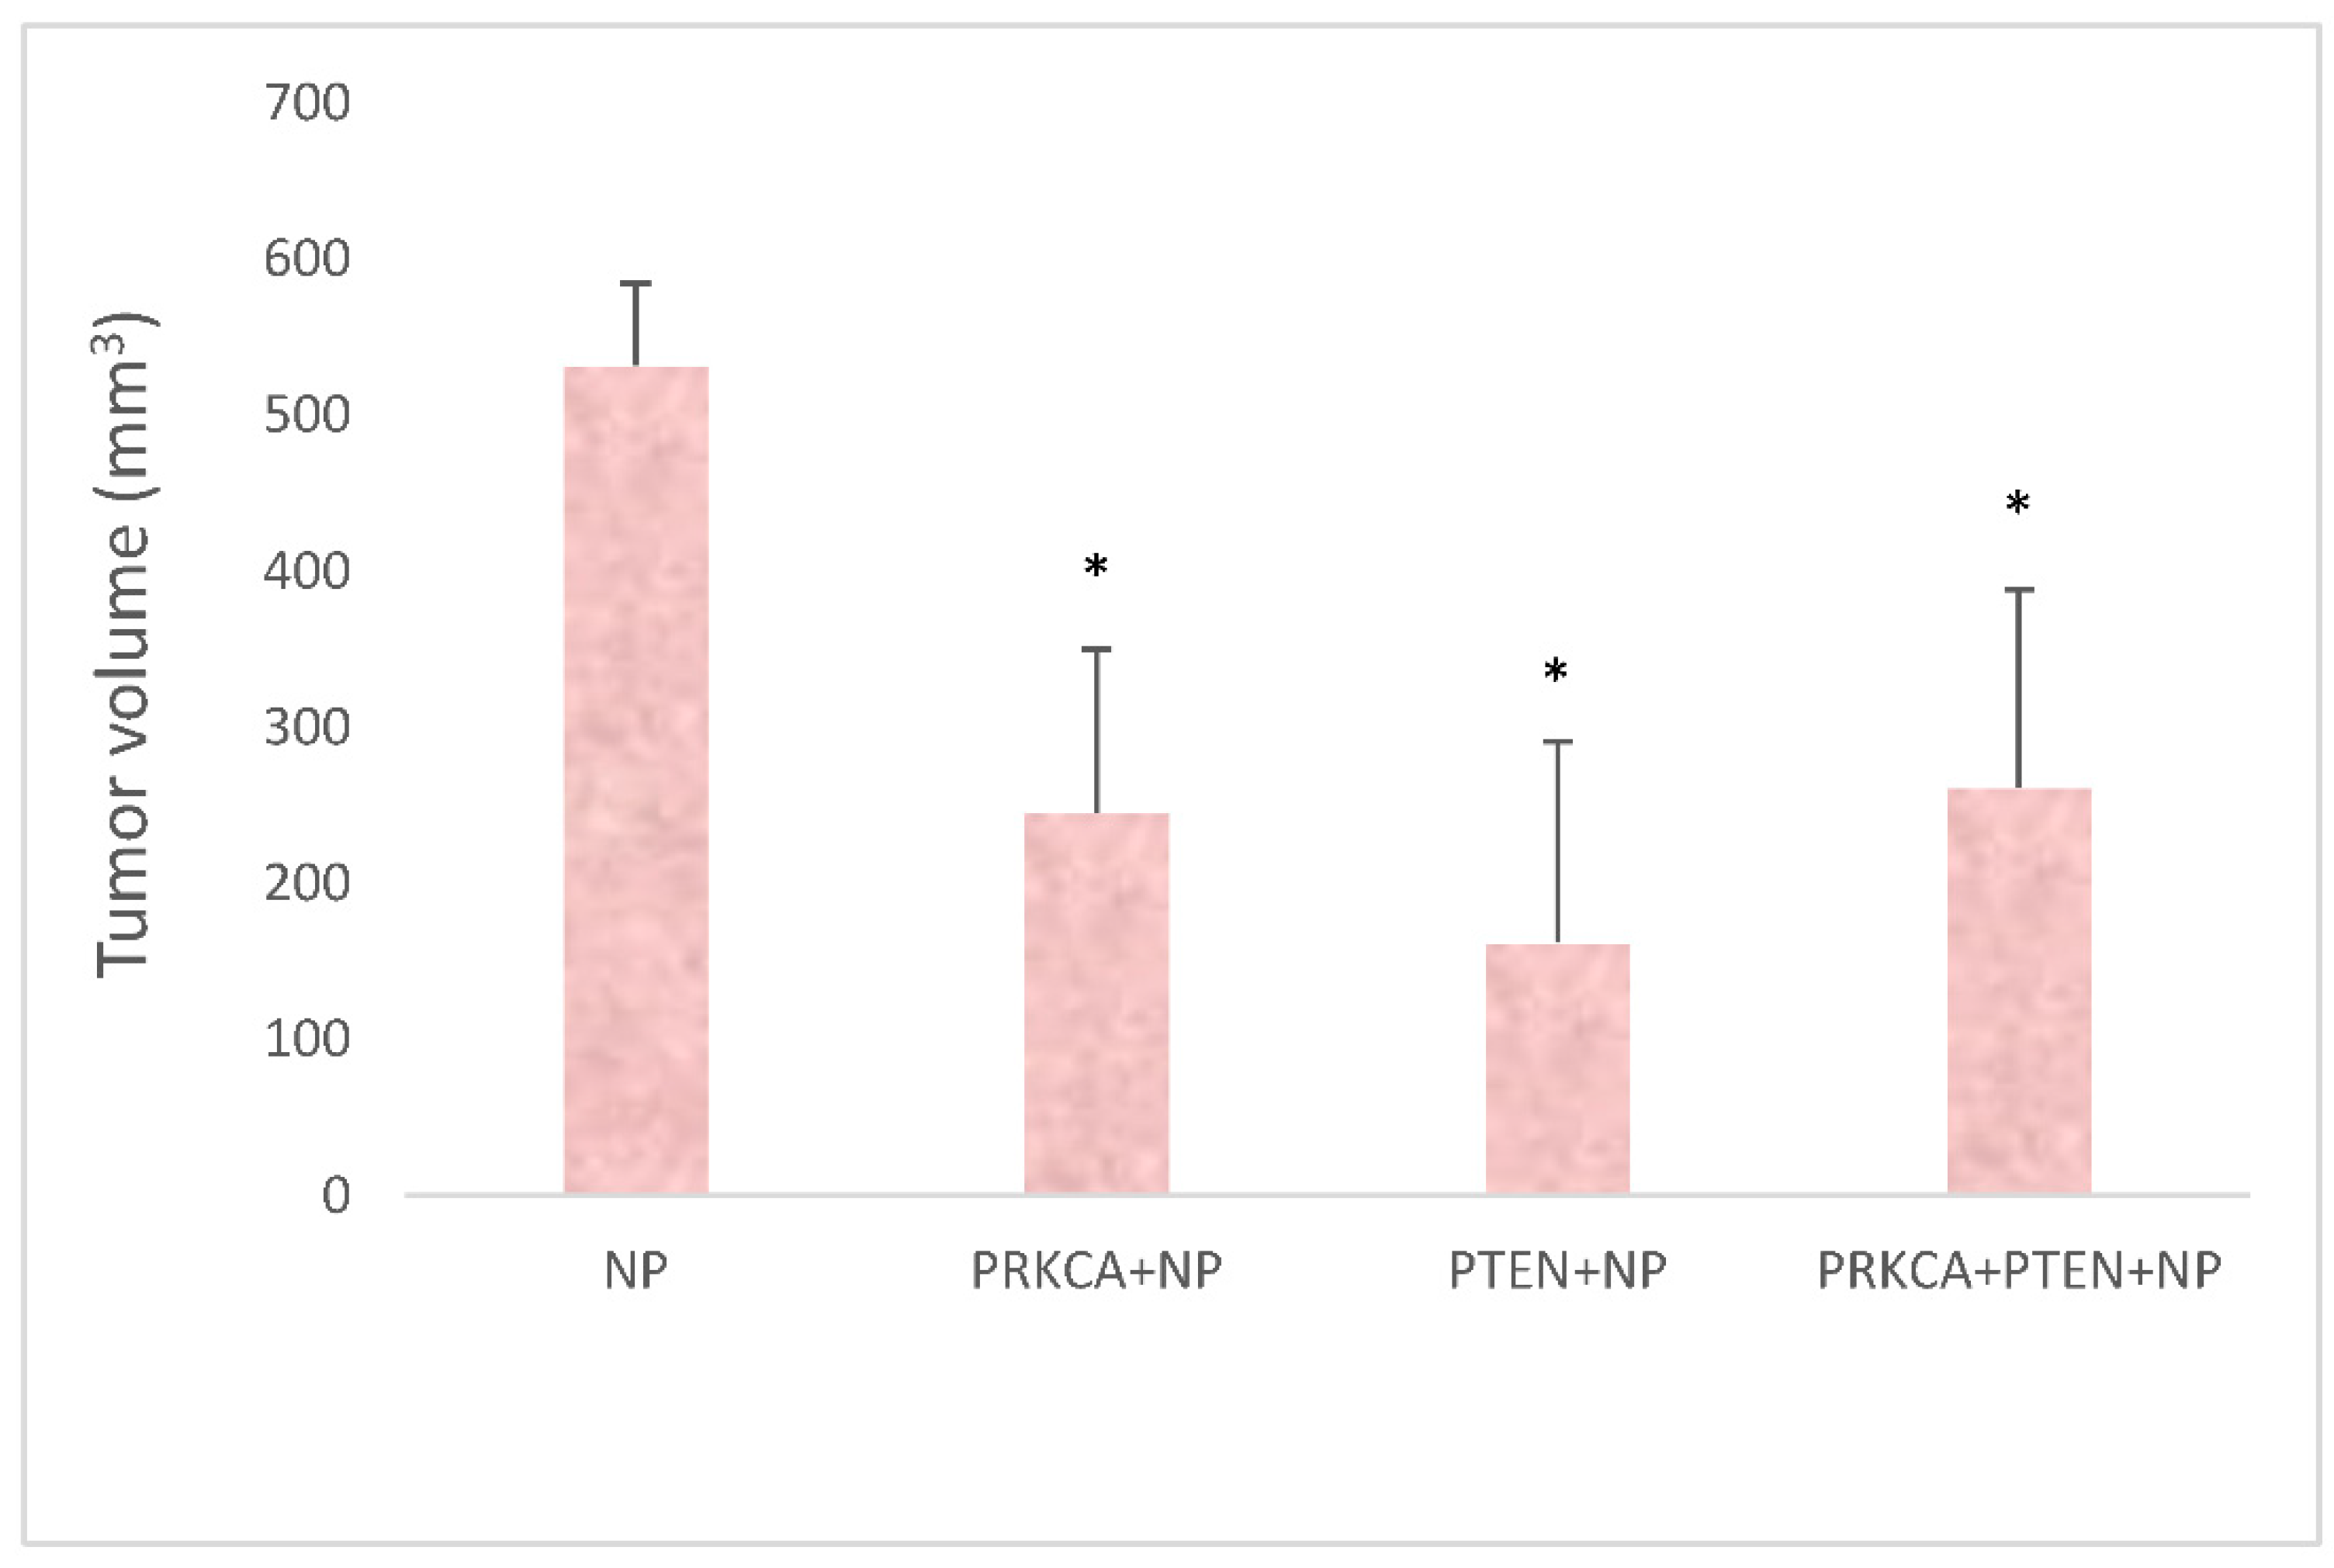
3.5. Quantitation of Tumor Volumes upon Treatments

As shown in Figure 7, at day 22, upon sacrifice of mice, PRKCA siRNA+NPs-treated mose group showed significant reduction in tumour volume compared to the NPs control group (~245 mm3 vs. 532 mm3, p < 0.05). In addition, PTEN+NPs and PRKCA siRNA+PTEN+NPs treated mice had smaller tumour volumes compared to the control (~162 mm3 vs. 532 mm3, p < 0.05) and (~261 mm3 vs. 532 mm3, p < 0.05), respectively. With regards to the control, all three treatment groups had reduced tumour volumes, implying the crucial roles of PRKCA suppression and restoration of PTEN tumour suppressor’s function in tumour volume reduction.

4. Discussion

As a promising cancer therapeutic strategy, siRNA has numerous advantages over chemotherapeutic drugs including high degree of safety and specificity. siRNA inhibits the post-transcriptional stage of gene expression by complementary base pairing with a target mRNA through RNA interference system, without adverse side effects [37]. Another crucial advantage of siRNA is its high efficacy, restraining the expression of a target gene markedly in a single cancer cell with just several copies [38].
However, ‘free’ or ‘naked’ siRNA can hardly penetrate the cell or tissue because of its negatively charged phosphate backbone that could be repelled by anionic extracellular matrix molecules. In addition, its half-life is very short due to the risk of degradation by serum nucleases, demanding for a robust delivery vector to protect it from cleavage and deliver to the target site with high efficacy [39]. In a recent study, Kamaruzzman et al. investigated the application of siRNA nanotherapeutics in breast cancer targeting several oncogenes such as EGFR, ERBB2 and BCL-2 using CA NPs of size ranging 100–300 nm. This siRNA mediated simultaneous silencing of cell-surface growth factor receptors and anti-apoptotic genes synergistically killed breast cancer cells through inhibition of MAPK and PI-3 kinase pathways [40]. In addition, Chua et al. reported that CA NP-mediated intracellular delivery of c-ROS1 siRNA sensitized MCF-7 breast cancer cells to chemotherapy drugs cisplatin and paclitaxel [41]. In order to further investigate other oncogene signaling pathways, in this study, CA NPs were employed to deliver the PRKCA siRNA, which showed great implication in minimizing breast cancer cell growth both in vitro and in vivo.
Evidence has emerged from several studies describing importance of PRKCA knockdown using siRNA targeted to PRKCA gene in different types of cancer. Specific and efficient silencing of PRKCA gene was achieved using chemically synthesized siRNAs, resulting in prolonged obstruction of neuroblastoma cell division [42]. Wu et al. demonstrated that PKC-alpha siRNA transfection nearly abrogated PKC-alpha expression and significantly reduced melanoma cell migration compared to siRNA controls [43].
PTEN, another potential target in our study, is considered as a candidate tumour suppressor gene based on the finding that mutation or loss of this gene has been linked to a variety of common human cancers, including breast, prostate, glioblastoma, melanoma and lymphoid cancer [44]. A group of researchers affirmed that using lipofectamine 2000 transfection method, over-expression of PTEN induced cell growth arrest and apoptosis in PTEN-null human breast cancer cells [45]. Similarly, a study by Chen et al. concluded that exogenous PTEN suppressed the growth of human breast cancer cell and prompted apoptosis by phosphatase activity. They also used lipofectamine 2000 for delivery of PTEN gene in breast cancer cells [46]. Unlike lipofectamine 2000, we utilized inorganic pH sensitive CA NPs which are small in size, convenient, cost-effective, biodegradable and biocompatible nano-vectors for transfection of the PTEN plasmid in breast cancer cell line with very noticeable outcomes. Our cell viability and protein expression results showed that over-expression of PTEN in MCF-7 cells caused growth suppression by downregulating P-AKT expression, in agreement with the study by Chen et al. as mentioned above [46].
Delivering double elements to maximize the treatment outcome is an attractive concept in clinical medicine. The additive response of the combined formulation in our study can be explained by their opposite regulatory roles in PI3K-AKT-mTOR pathway. Upon activation, PKCα catalytically phosphorylates a variety of protein substrates (e.g., AKT to P-AKT) [47,48], thus activating the protein of interest towards cellular proliferation, whereas PTEN catalyses the opposite reaction, dephosphorylation (e.g., P-AKT to AKT), and implies deactivation of the proliferative signal [49]. To the best of our knowledge, the correlation between PRKCA and PTEN proteins has been examined towards breast cancer gene therapy for the first time through our study. The novelty of our study reflected the additive effect upon co-delivery of siRNA against PRKCA and PTEN plasmid gene in reducing breast cancer cell proliferation, as reflected in cell viability assessment and Western blot experiments.
However, for the in vitro study, we observed differences in cell viability results in three different breast cancer cell lines. Because breast cancer is a complex and heterogenous disease, gene expression profiling of the different representative cell lines also revealed heterogeneity at molecular level—explaining differential behavior of the treatments in cell lines [50]. A study by Sandra et al. established that different types of proteins interact with NPs, and the composition of protein corona could control uptake into specific cell types [51].
The in vivo testing of the potential nucleic acid-based nanotherapeutics composed of PRKCA siRNA+NPs and PTEN plasmid+NPs in the mice bearing MCF-7-induced xenograft breast tumours revealed quite similar results, as observed in cell viability assessment and Western blot tests. Mouse groups treated with PRKCA siRNA+NPs and PTEN plasmid+NPs formulations exhibited significant reduction in tumour size compared to the control group of mice. As observed from the size and zeta potential results of the siRNA, plasmid and NsP complex, PTEN+NPs possessed slightly more negative zeta-potential compared to other complexes, and the mean tumour volume was smallest (162 mm3) in PTEN+NPs group of mice, implying that more negative zeta potential was advantageous in terms of longer retention of the formulation in blood stream [29]. However, the additive effect of the combined delivery could not be verified with the in vivo tumour regression results which rather followed the tumour reduction pattern similar as the mouse groups treated with individual elements of PRKCA siRNA+NPs and PTEN plasmid+NPs. Principally, the in vivo system is a relatively more complicated biological environment controlled by multiple factors and signaling pathways. A study by Islam et al. demonstrated that upon systemic delivery, NPs come into interaction with serum proteins, forming a protein corona (PC). The composition of PC depends on size, charge and other physicochemical features of NPs, and in in vivo mouse studies, the PC can be remodeled with the change of proteome in different treatment formulations [28,52,53]. Another possibility of epigenetic changes in in vivo environment may affect gene expression and protein interaction in different treatment groups; hence, future study might focus on the in vivo mechanism of the combined therapy.

5. Conclusions

Inhibiting PRKCA oncogene and restoration of PTEN tumour suppressor activities through intracellular delivery of PRKCA siRNA and PTEN gene, with the help of CA NPs, significantly inhibited breast tumour growth both in vitro and in vivo, supporting the notion that PRKCA as well as PTEN might be the potential targets for gene therapy of breast cancer while shedding light on the potential applications of the pH-responsive NPs as a powerful tool for nucleic acid delivery in clinical setting.

Author Contributions

Conception and Design: N.I., E.H.C.; Acquisition of data: N.I., R.A.I.; Analysis and interpretation of data: N.I.; Manuscript drafting: N.I., R.A.I.; Manuscript revising: all authors; Final approval of this version: all authors. All authors have read and agreed to the published version of the manuscript.

Funding

This project was financially supported by a grant from Ministry of Higher Education, Malaysia (MoHE) (FRGS/1/2018/STG05/MUSM/02/3).

Institutional Review Board Statement

The animal study was approved by the Monash University Animal Ethics Committee, with animal ethics approval No. MUM/2018/12.

Informed Consent Statement

Not applicable.

Data Availability Statement

Not applicable.

Acknowledgments

We also thank Andrew Leong and Zulkhaili Zainal Abidin from Monash Animal Facility department for their technical assistance during the PhD thesis work.

Conflicts of Interest

The authors declare no conflict of interest. The funders had no role in the design of the study; in the collection, analyses, or interpretation of data; in the writing of the manuscript, or in the decision to publish the results.

References

  1. Bray, F.B.; Ferlay, J.M.E.; Soerjomataram, I.; Siegel, R.L.; Torre, L.A.; Jemal, A. Global Cancer Statistics 2018: GLOBOCAN Estimates of Incidence and Mortality Worldwide for 36 Cancers in 185 Countries. Cancer J. Clin. 2018, 68, 31. [Google Scholar] [CrossRef] [Green Version]
  2. Lønne, G.K.; Cornmark, L.; Omanovic Zahirovic, I.; Landberg, G.; Jirström, K.; Larsson, C. PKCalpha expression is a marker for breast cancer aggressiveness. Mol. Cancer 2010, 9, 76. [Google Scholar] [CrossRef] [Green Version]
  3. Cooke, M.; Magimaidas, A.; Casado-Medrano, V.; Kazanietz, M.G. Protein kinase C in cancer: The top five unanswered questions. Mol. Carcinog. 2017, 56, 1531–1542. [Google Scholar] [CrossRef] [PubMed]
  4. Mellor, H.; Parker, P. The extended protein kinase C superfamily. Biochem. J. 1998, 332, 281–292. [Google Scholar] [CrossRef]
  5. Griner, E.M.; Kazanietz, M.G. Protein kinase C and other diacylglycerol effectors in cancer. Nat. Rev. Cancer 2007, 7, 281–294. [Google Scholar] [CrossRef]
  6. Webb, B.; Hirst, S.J.; Giembycz, M.A. Protein kinase C isoenzymes: A review of their structure, regulation and role in regulating airways smooth muscle tone and mitogenesis. Br. J. Pharmacol. 2000, 130, 1433–1452. [Google Scholar] [CrossRef] [Green Version]
  7. Garg, R.; Benedetti, L.G.; Abera, M.B.; Wang, H.; Abba, M.; Kazanietz, M.G. Protein kinase C and cancer: What we know and what we do not. Oncogene 2013, 33, 5225–5237. [Google Scholar] [CrossRef] [PubMed] [Green Version]
  8. Oster, H.; Leitges, M. Protein kinase C alpha but not PKCzeta suppresses intestinal tumor formation in ApcMin/+ mice. Cancer Res. 2006, 66, 6955–6963. [Google Scholar] [CrossRef] [PubMed] [Green Version]
  9. Haughian, J.M.; Reno, E.M.; Thorne, A.M.; Bradford, A.P. Protein kinase C alpha-dependent signaling mediates endometrial cancer cell growth and tumorigenesis. Int. J. Cancer 2009, 125, 2556–2564. [Google Scholar] [CrossRef] [PubMed]
  10. Nakagawa, S.; Fujii, T.; Yokoyama, G.; Kazanietz, M.G.; Yamana, H.; Shirouzu, K. Cell growth inhibition by all-trans retinoic acid in SKBR-3 breast cancer cells: Involvement of protein kinase C? And extracellular signal-regulated kinase mitogen-activated protein kinase. Mol. Carcinog. 2003, 38, 106–116. [Google Scholar] [CrossRef]
  11. Tonetti, D.A.; Szafran, A.; Gao, W.; Escarzaga, D.; Walters, K.; Coon, J.S. PKCα and ERβ Are Associated with Triple-Negative Breast Cancers in African American and Caucasian Patients. Int. J. Breast Cancer 2012, 2012, 740353. [Google Scholar] [CrossRef] [PubMed] [Green Version]
  12. Nishizuka, Y. The molecular heterogeneity of protein kinase C and its implications for cellular regulation. Nature 1988, 334, 661–665. [Google Scholar] [CrossRef] [PubMed]
  13. Tonetti, D.A.; Morrow, M.; Kidwai, N.; Gupta, A.; Badve, S. Elevated protein kinase C alpha expression may be predictive of tamoxifen treatment failure. Br. J. Cancer 2003, 88, 1400–1402. [Google Scholar] [CrossRef] [PubMed] [Green Version]
  14. Chang, S.H.; Moon, B.I.; Suh, H.S.; Sung, S.H.; Han, W.S.; Cho, M.S.; Lee, N.S.; Choi, H.Y.; Koo, H.S. Loss of PTEN Expression in Breast Cancers. J. Pathol. Transl. Med. 2005, 39, 236–241. [Google Scholar]
  15. Li, J.; Yen, C.; Liaw, D.; Podsypanina, K.; Bose, S.; Wang, S.I.; Puc, J.; Miliaresis, C.; Rodgers, L.; McCombie, W.R.; et al. PTEN, a Putative Protein Tyrosine Phosphatase Gene Mutated in Human Brain, Breast, and Prostate Cancer. Science 1997, 275, 1943–1947. [Google Scholar] [CrossRef]
  16. Tamura, M.; Gu, J.; Matsumoto, K.; Aota, S.-I.; Parsons, R.; Yamada, K.M. Inhibition of Cell Migration, Spreading, and Focal Adhesions by Tumor Suppressor PTEN. Science 1998, 280, 1614–1617. [Google Scholar] [CrossRef]
  17. Carbognin, L.; Miglietta, F.; Paris, I.; Dieci, M.V. Prognostic and Predictive Implications of PTEN in Breast Cancer: Unfulfilled Promises but Intriguing Perspectives. Cancers 2019, 11, 1401. [Google Scholar] [CrossRef] [Green Version]
  18. Hollander, M.C.; Blumenthal, G.; Dennis, P.A. PTEN loss in the continuum of common cancers, rare syndromes and mouse models. Nat. Rev. Cancer 2011, 11, 289–301. [Google Scholar] [CrossRef]
  19. Planchon, S.M.; Waite, K.A.; Eng, C. The nuclear affairs of PTEN. J. Cell Sci. 2008, 121, 249–253. [Google Scholar] [CrossRef] [Green Version]
  20. Alimonti, A.; Carracedo, A.; Clohessy, J.; Trotman, L.C.; Nardella, C.; Egia, A.; Salmena, L.; Sampieri, K.; Haveman, W.J.; Brogi, E.; et al. Subtle variations in Pten dose determine cancer susceptibility. Nat. Genet. 2010, 42, 454–458. [Google Scholar] [CrossRef]
  21. Knudson, A.G., Jr. Mutation and cancer: Statistical study of retinoblastoma. Proc. Natl. Acad. Sci. USA 1971, 68, 820–823. [Google Scholar] [CrossRef] [Green Version]
  22. Papa, A.; Wan, L.; Bonora, M.; Salmena, L.; Song, M.S.; Hobbs, R.; Lunardi, A.; Webster, K.; Ng, C.; Newton, R.H.; et al. Cancer-Associated PTEN Mutants Act in a Dominant-Negative Manner to Suppress PTEN Protein Function. Cell 2014, 157, 595–610. [Google Scholar] [CrossRef] [Green Version]
  23. Kingston, B.; Bailleux, C.; Delaloge, S.; Schiavon, G.; Scott, V.; Lacroix-Triki, M.; Carr, T.H.; Kozarewa, I.; Gevensleben, H.; Kemp, Z.; et al. Exceptional Response to AKT Inhibition in Patients with Breast Cancer and Germline PTEN Mutations. JCO Precis. Oncol. 2019, 3, 1–7. [Google Scholar] [CrossRef]
  24. Waite, K.A.; Eng, C. Protean PTEN: Form and Function. Am. J. Hum. Genet. 2002, 70, 829–844. [Google Scholar] [CrossRef] [PubMed] [Green Version]
  25. Mittendorf, E.A.; Philips, A.V.; Meric-Bernstam, F.; Qiao, N.; Wu, Y.; Harrington, S.; Su, X.; Wang, Y.; Gonzalez-Angulo, A.M.; Akcakanat, A.; et al. PD-L1 Expression in Triple-Negative Breast Cancer. Cancer Immunol. Res. 2014, 2, 361–370. [Google Scholar] [CrossRef] [Green Version]
  26. Chowdhury, E.H.; Maruyama, A.; Nagaoka, K.M.; Kotaka, M.; Hirose, S.; Kunou, M.; Akaike, T. pH-sensing nano-crystals of carbonate apatite: Effects on intracellular delivery and release of DNA for efficient expression into mammalian cells. Gene 2006, 367, 87–94. [Google Scholar] [CrossRef] [PubMed]
  27. Chowdhury, E.H. pH-responsive magnesium-and carbonate-substituted apatite nano-crystals for efficient and cell-targeted delivery of transgenes. Open J. Gen. 2013, 3, 1–7. [Google Scholar] [CrossRef] [Green Version]
  28. Islam, R.A.; Al-Busaidi, H.; Zaman, R.; Abidin, S.A.Z.; Othman, I.; Chowdhury, E.H. Carbonate Apatite and Hydroxyapatite Formulated with Minimal Ingredients to Deliver SiRNA into Breast Cancer Cells In Vitro and In Vivo. J. Funct. Biomater. 2020, 11, 63. [Google Scholar] [CrossRef]
  29. Chowdhury, E.H.; Akaike, T. High performance DNA nano-carriers of carbonate apatite: Multiple factors in regulation of particle synthesis and transfection efficiency. Int. J. Nanomed. 2007, 2, 101–106. [Google Scholar] [CrossRef] [PubMed]
  30. Hossain, S.; Stanislaus, A.; Chua, M.J.; Tada, S.; Tagawa, Y.-I.; Chowdhury, E.H.; Akaike, T. Carbonate apatite-facilitated intracellularly delivered siRNA for efficient knockdown of functional genes. J. Control. Release 2010, 147, 101–108. [Google Scholar] [CrossRef]
  31. Martinez, J.; Patkaniowska, A.; Urlaub, H.; Lührmann, R.; Tuschl, T. Single-Stranded Antisense siRNAs Guide Target RNA Cleavage in RNAi. Cell 2002, 110, 563–574. [Google Scholar] [CrossRef] [Green Version]
  32. Tuschl, T.; Zamore, P.D.; Lehmann, R.; Bartel, D.P.; Sharp, P.A. Targeted mRNA degradation by double-stranded RNA in vitro. Genes Dev. 1999, 13, 3191–3197. [Google Scholar] [CrossRef] [PubMed] [Green Version]
  33. Vaughan, E.E.; Dean, D.A. Intracellular Trafficking of Plasmids during Transfection Is Mediated by Microtubules. Mol. Ther. J. Am. Soc. Gene Ther. 2006, 13, 422–428. [Google Scholar] [CrossRef] [PubMed]
  34. Honary, S.; Zahir, F. Effect of Zeta Potential on the Properties of Nano-Drug Delivery Systems—A Review (Part 2). Trop. J. Pharm. Res. 2013, 12, 9. [Google Scholar]
  35. Kass, G.E.; Orrenius, S. Calcium signaling and cytotoxicity. Environ. Health Perspect. 1999, 107, 25–35. [Google Scholar] [CrossRef] [PubMed] [Green Version]
  36. Nitulescu, G.M.; Van De Venter, M.; Nitulescu, G.; Ungurianu, A.; Juzenas, P.; Peng, Q.; Olaru, O.T.; Grădinaru, D.; Tsatsakis, A.; Tsoukalas, D.; et al. The Akt pathway in oncology therapy and beyond (Review). Int. J. Oncol. 2018, 53, 2319–2331. [Google Scholar]
  37. Xu, C.-F.; Wang, J. Delivery systems for siRNA drug development in cancer therapy. Asian J. Pharm. Sci. 2015, 10, 1–12. [Google Scholar] [CrossRef] [Green Version]
  38. Kamaruzman, N.I.; Aziz, N.A.; Poh, C.L.; Chowdhury, E.H. Oncogenic Signaling in Tumorigenesis and Applications of siRNA Nanotherapeutics in Breast Cancer. Cancers 2019, 11, 632. [Google Scholar] [CrossRef] [Green Version]
  39. Torchilin, V.P. Passive and Active Drug Targeting: Drug Delivery to Tumors as an Example. Drug Deliv. 2009, 3–53. [Google Scholar] [CrossRef]
  40. Kamaruzman, N.I.; Tiash, S.; Ashaie, M.; Chowdhury, E.H. siRNAs Targeting Growth Factor Receptor and Anti-Apoptotic Genes Synergistically Kill Breast Cancer Cells through Inhibition of MAPK and PI-3 Kinase Pathways. Biomedicines 2018, 6, 73. [Google Scholar] [CrossRef] [Green Version]
  41. Chua, M.; Tiash, S.; Fatemian, T.; Noordin, M.I.; Keng, C.; Chowdhury, E. Carbonate apatite-facilitated intracellular delivery of c-ROS1 small interfering RNA sensitises MCF-7 breast cancer cells to cisplatin and paclitaxel. Cancer 2013, 1, 7. [Google Scholar] [CrossRef]
  42. Akimov, I.; Chernolovskaya, E.L.; Spitsyna, Y.E.; Ryabchikova, E.I.; Zenkova, M.A. Silencing of Her2, CCNB1 and pKC Genes by siRNA Results in Prolonged Retardation of Neuroblastoma Cell Division. Acta Nat. 2011, 3, 29–39. [Google Scholar] [CrossRef]
  43. Wu, T.-T.; Hsieh, Y.-H.; Hsieh, Y.-S.; Liu, J.-Y. Reduction of PKCα decreases cell proliferation, migration, and invasion of human malignant hepatocellular carcinoma. J. Cell. Biochem. 2008, 103, 9–20. [Google Scholar] [CrossRef] [PubMed]
  44. Bonneau, D.; Longy, M. Mutations of the human PTEN gene. Hum. Mutat. 2000, 16, 109–122. [Google Scholar] [CrossRef]
  45. Li, X.; Lin, G.; Wu, B.; Zhou, X.; Zhou, K. Overexpression of PTEN Induces Cell Growth Arrest and Apoptosis in Human Breast Cancer ZR-75-1 Cells. Acta Biochim. Biophys. Sin. 2007, 39, 745–750. [Google Scholar] [CrossRef] [Green Version]
  46. Chen, Q.; Wang, C.; Jiang, C.; Chen, D. Exogenous PTEN gene induces apoptosis in breast carcinoma cell line MDA468. Acta Acad. Med. Wuhan 2007, 27, 61–64. [Google Scholar] [CrossRef]
  47. Shigeru, N. Protein Kinase Ca (PKCα): Regulation and Biological Function. J. Biochem. 2002, 132, 669–675. [Google Scholar]
  48. Li, W.; Zhang, J.; Flechner, L.; Hyun, T.; Yam, A.; Franke, T.F.; Pierce, J.H. Protein kinase C-α overexpression stimulates Akt activity and suppresses apoptosis induced by interleukin 3 withdrawal. Oncogene 1999, 18, 6564–6572. [Google Scholar] [CrossRef] [Green Version]
  49. Chalhoub, N.; Baker, S.J. PTEN and the PI3-Kinase Pathway in Cancer. Annu. Rev. Pathol. Mech. Dis. 2009, 4, 127–150. [Google Scholar] [CrossRef] [Green Version]
  50. Holliday, D.L.; Speirs, V. Choosing the right cell line for breast cancer research. Breast Cancer Res. 2011, 13, 1–7. [Google Scholar] [CrossRef] [Green Version]
  51. Sandra, R.; Susanne, S. Protein Corona of Nanoparticles: Distinct Proteins Regulate the Cellular Uptake. Biomacromolecules 2015, 16, 1311–1321. [Google Scholar]
  52. Chowdhury, E.H. Nanotherapeutics from Laboratory to Clinic; CRC Press: Boca Raton, FL, USA, 2016. [Google Scholar]
  53. Corbo, C.; Molinaro, R.; Tabatabaei, M.; Farokhzad, O.C.; Mahmoudi, M. Personalized protein corona on nano-particles and its clinical implications. Biomater. Sci. 2017, 5, 378–387. [Google Scholar] [CrossRef] [PubMed]
Figure 1. (a) Size and (b) zeta potential measurements of NPs alone, PRKCA+NPs, PTEN+NPs and PKCA+PTEN+NPs formed with addition of 4 mM of exogeneous Ca2+ in 1 mL DMEM medium and incubation at 37 °C for 30 min. Each of the measurements performed three times and mean and standard deviation were calculated.
Applsci 11 08133 g001
Figure 2. Light microscopic images of MCF-7 cell line following treatment with CA NPs, PRKCA siRNA+NPs, PTEN plasmid+NPs and PRKCA siRNA+PTEN plasmid+NPs. The scale bars set at 500 µm.
Applsci 11 08133 g002
Figure 3. Cell viability assessment of PRKCA siRNA and PTEN plasmid delivery in (a) MCF-7 (b) MDA-MB-231 and (c) 4T1 cells treated with PRKCA+NPs, PTEN+NPs and PRKCA+PTEN+NPs formulations for 48 h. The experiments were performed three times in each of the cell lines and values were presented as mean ± SD of triplicates in MTT assay. * p < 0.05 for PKCA+PTEN+NP compared to PRKCA+NPs and or PTEN+NPs treated cells.
Applsci 11 08133 g003
Figure 4. (a). Western blot images following intracellular delivery of PRKCA siRNA+NP, PTEN+NP and PRKCA siRNA+PTEN+NP in MCF-7 cell line. Cells were incubated with the treatment formulations for 48 h prior to cell lysis for protein extraction and Western blotting. Detection of Phospho-AKT (P-AKT), Total-AKT (T-AKT) and GAPDH was performed using respective polyclonal antibodies. (b). Densitometry analysis showing ratio of P-AKT/Total AKT expression. P-AKT expression was significantly lower in PRKCA siRNA+PTEN+NPs treatment group compared to PRKCA siRNA+NPs and PTEN+NPs treatment groups. Statistical analysis was very significant, ** when p < 0.01.
Applsci 11 08133 g004
Figure 5. (a) Following subcutaneous injection, tumour growth appeared on mouse mammary pad and reached an approximate volume of ~25 mm3 within day 8. (b) Tumor images captured following sacrifice of mice. At the end of the study, at day 22, mice were humanely sacrificed and tumours were excised.
Applsci 11 08133 g005
Figure 6. Tumor regression study following intravenous delivery of NPs, PRKCA siRNA+NPs, PTEN+NPs and PRKCA siRNA+PTEN+NPs in MCF-7-induced xenograft breast tumour model. MCF-7 cells were inoculated subcutaneously on the mammary pad of mice. On day 8, as the tumour reached an approximate volume of ~25 mm3, mice were treated intravenously through tail-vein injection with 100 μL of NP (8 M Ca2+), PRKCA siRNA+NP (100 nM siRNA), PTEN+NP (40 µg of plasmid) and PRKCA siRNA+PTEN+NP (100 nM siRNA and 40 µg of plasmid); followed by the 2nd dose at day 10. The tumour outgrowth was monitored until day 22. Four mice were used per group and data were represented as mean ± SD. Compared to NP control group, statistical analysis was significant, * when p < 0.05.
Applsci 11 08133 g006
Figure 7. Quantitation of tumour volumes in the mouse groups treated with NPs (control), PRKCA siRNA+NPs, PTEN+NPs and PRKCA siRNA+PTEN+NPs. Statistical analysis was found significant compared to NP control group, * when p < 0.05.
Applsci 11 08133 g007
Publisher’s Note: MDPI stays neutral with regard to jurisdictional claims in published maps and institutional affiliations.

