1. Introduction
Recently, massive volumes of data have been generated rapidly by IoT devices, e-commerce websites, mobile applications, et cetera. There are requirements to process these data instantly as the value of data declines rapidly over time. DSP has caused quite a buzz in the industry, as it has emerged as a new big data solution involving many critical scenarios, including economics, finance, health [
1], et cetera. It processes real-time data within a short period (e.g., milliseconds or seconds) and instantly delivers results. For low latency purposes, it handles stream data on the fly without costly storage [
2].
Modern DSP systems offer programmers a simplified view and high-level abstractions [
3] that hide the low-level primitives and distributed protocols. This developing pattern makes distributed stream programming available for a much more comprehensive range of users, as they are not required to have a deep understanding of the distributed runtime and extensive experience to handle the underlying architecture. Instead, they can build DSP programs (a.k.a, computing pipelines) by chaining different operators and implementing self-customized logic in UDFs. This pipeline (logical execution model) will be mapped into distributed instances (physical execution model) transparently by stream processing runtime [
4].
Nevertheless, this program-building pattern will potentially bring in some imperceptible defects [
5]. The lack of QA (quality assurance) for software pipelines has been a critical problem that impacts many areas, e.g., biomedical research [
6]. DSP programs will be buggy, especially when end users make some overly perfect assumptions. Data reordering [
7] is a notable feature that one programmer should consider when designing a DSP program. In practice, one DSP program will usually run in an adversarial environment where out-of-order stream data are predominant [
8], which means stream data may arrive in a nonchronological order concerning their physical time. Such orderlessness may happen due to network issues such as network congestion [
9] or time difference between quick processing nodes and slow processing nodes during failure recovery [
10]. In a real system, enforcing a strong ordering in the upfront source side is neither practical nor efficient. It is an intrinsic need for DSP programs to handle stream imperfections (delayed, missing, and out-of-order data) [
2] and produce correct results.
Test activities are essential for DSP programs’ quality assurance and to improve dependability. The importance is fully emphasized in a recent empirical study [
11]. Software testing is a significant cost during the software development life cycle, and there exists a strong demand to design an efficient test solution for the expense-reducing purpose. Long-running systems, e.g., cloud systems, usually favor availability (no downtimes) over correctness [
12] after being deployed, which, in turn, requires a strict test before releasing them into production.
As discussed in [
13], the common industry practice to test big data programs is running locally with randomly sampled data. An empirical study presented by Vianna et al. [
11] demonstrates that difficulties in generating test data are one of the most frequent problems when designing DSP programs. In practice, test data for DSP programs mainly comes from three sources [
11], i.e., replaying historical data, mirroring real-time production data, and generating synthetic data randomly. However, real data, including historical and real-time production data, may be privacy-sensitive and hinder developers from accessing conveniently. Taking the ultra-large-scale real data as the test data or randomly generating synthetic data is inefficient as the significant skewness exists for real-world data, leading to low coverage [
13]. In this paper, we present two goals that one DSP test approach should reach. One is to achieve high path coverage. The other one is to simulate streams in various reordering situations.
Symbolic execution [
14] is one of the most promising techniques used for generating test cases automatically with high coverage guarantees, working as the foundation of many popular testing tools: Java PathFinder [
15] (JPF for short), CUTE [
16], and jCUTE [
17], KLEE [
18], et cetera. However, these solutions and tools are not directly appliable to DSP programs because of the large scale of their frameworks [
13]. To tackle this, there are some symbolic execution-based test approaches specifically for big data programs [
13,
19,
20]. These methods mainly include three steps: (1) make a logical abstraction for dataflow operators, (2) conduct symbolic execution on the UDFs individually and get PCs (i.e., Path Condition), (3) join individual PCs to synthesize the holistic PCs. Test data are generated by solving these constraints with the assistance of SMT (i.e., satisfiability modulo theories) solvers [
21]. These generated data, however, are independent and without any temporal constraint among them. To test a stateful DSP program, a series of time-dependent data (a.k.a., stream) is always required to explore different system states.
On the contrary, property-based testing (PBT), as proposed by Claessen and Hughes [
22], is a solution that generates input data following some specific properties. The PBT approaches consist of two ingredients, i.e., generators and formulae. The generators usually produce data randomly, which to some extent will contain some reordering nonexplicitly. The formulae are the properties that define how the input and output of a program should satisfy. If some input–output pairs do not satisfy the desired properties, a counterexample revealing undesirable behavior is found [
23]. There are many PBT tools for general purposes, including QuickCheck [
22] (for Haskell), JUnit-Quickcheck [
24] (for Java), et cetera. Although PBT is one of the popular methods in testing traditional software, limited work involving DSP programs exists. As far as we can find out, DiffStream [
25] and FlinkCheck [
26] (which builds a bounded temporal logic based on [
27]) are the most relevant work. However, randomly generating input data is inefficient for DSP programs, especially when many operators contain complex UDFs. That will result in a vast combination of different paths. Since each set of input test data is generated randomly, the test may end up repeating many identical or similar test data, and different reordering situations are difficult to cover fully. It requires an approach to guide the generator to produce a more diverse test data set and guarantee a high coverage. These features are critical for many software engineering practices, such as continuous integration, requiring quick feedback in a rapid cycle [
28].
In this paper, we present SPOT (i.e., Stream Processing Program Test), a comprehensive test data generation solution for DSP programs to remedy the limitations. The objectives of SPOT can be summarized as (1) achieve high path coverage (i.e., JDU path coverage in our study) with minimum test suites and (2) synthesize sequences of test data in a various temporal order. To realize these two objectives, SPOT tackles three crucial challenges. First, SPOT mimics DSP operators (e.g., map) and other classes (e.g., StreamEnvironment) that constitute the framework of one DSP program. With these mocking replacements, one DSP program can be identified and analyzed by some third-party symbolic execution engines (e.g., SPF, which is short for Symbolic Pathfinder). Second, SPOT monitors the program execution at the instruction level and delegates the part that is symbolically analyzed to a third-party symbolic execution engine. Third, we model the stream and measure its ordering with entropy. Based on this, we present algorithms to generate all possible reordering streams, and then take one stream for each reordering situation as potential test data.
To evaluate SPOT, we take subject programs from previous work [
25,
26]. We also build some programs based on the snippets and descriptions from some public websites (e.g., GitHub, Flink official website, et cetera). We conduct four case studies to show: (1) its applicable range (i.e., to what extent does it support to analyze the common operators); (2) its efficiency when compared with the most recent two DSP testing techniques (i.e., DiffStream and FlinkCheck) in terms of JDU path coverage; and (3) efficiency in triggering failure. Our case study also illustrates that the entropy of randomly generated data (i.e., degree of reordering) is highly skewed, while SPOT can generate various reordering streams evenly.
In total, the main contributions of this work are:
We realize the symbolic execution idea for DSP applications by mimicking DSP APIs (i.e., application programming interfaces) and generate independent test data corresponding to each path.
We implement JPF-Flink, which coordinates the symbolic analysis specifically for Flink programs.
We present algorithms to compose time-series data covering different possible reordering situations.
SPOT is an alternative solution to current DSP testing approaches. It integrates symbolic execution and stream synthesizing. The former improves the random generator in PBT methods, leading to high coverage test suites. The latter covers different stream reordering situations that existing symbolic execution-based approaches have not provided.
We conduct four case studies to demonstrate SPOT’s efficiency and applicability.
The remainder of the paper is organized as follows.
Section 2 contains DSP examples to demonstrate motivations, a brief overview of DSP and Flink, metrics to measure reordering, and a framework for how SPOT works. Symbolic analysis and JPF-Flink implementation are introduced in
Section 3. In
Section 4, we describe how SPOT composes independent test data into streams with various ordering. Four case studies are conducted in
Section 5. Related works about testing big data programs are presented in
Section 6. We conclude with a summary and discussion of future work in
Section 7.
2. Overview
In this section, we start with several running DSP examples to motivate SPOT. Next, we introduce the background of programming in DSP systems, especially with the Flink framework. Then, we introduce symbolic execution and reordering metrics. At last, we briefly instroduce the architecture of SPOT.
2.1. Motivating Example
Suppose that Bob is a developer who will build several DSP programs to process millions of data 24/7 continuously from numerous sensors that have been deployed remotely. Alice works as a tester who designs test suites to find any data that may lead to unexpected behaviors.
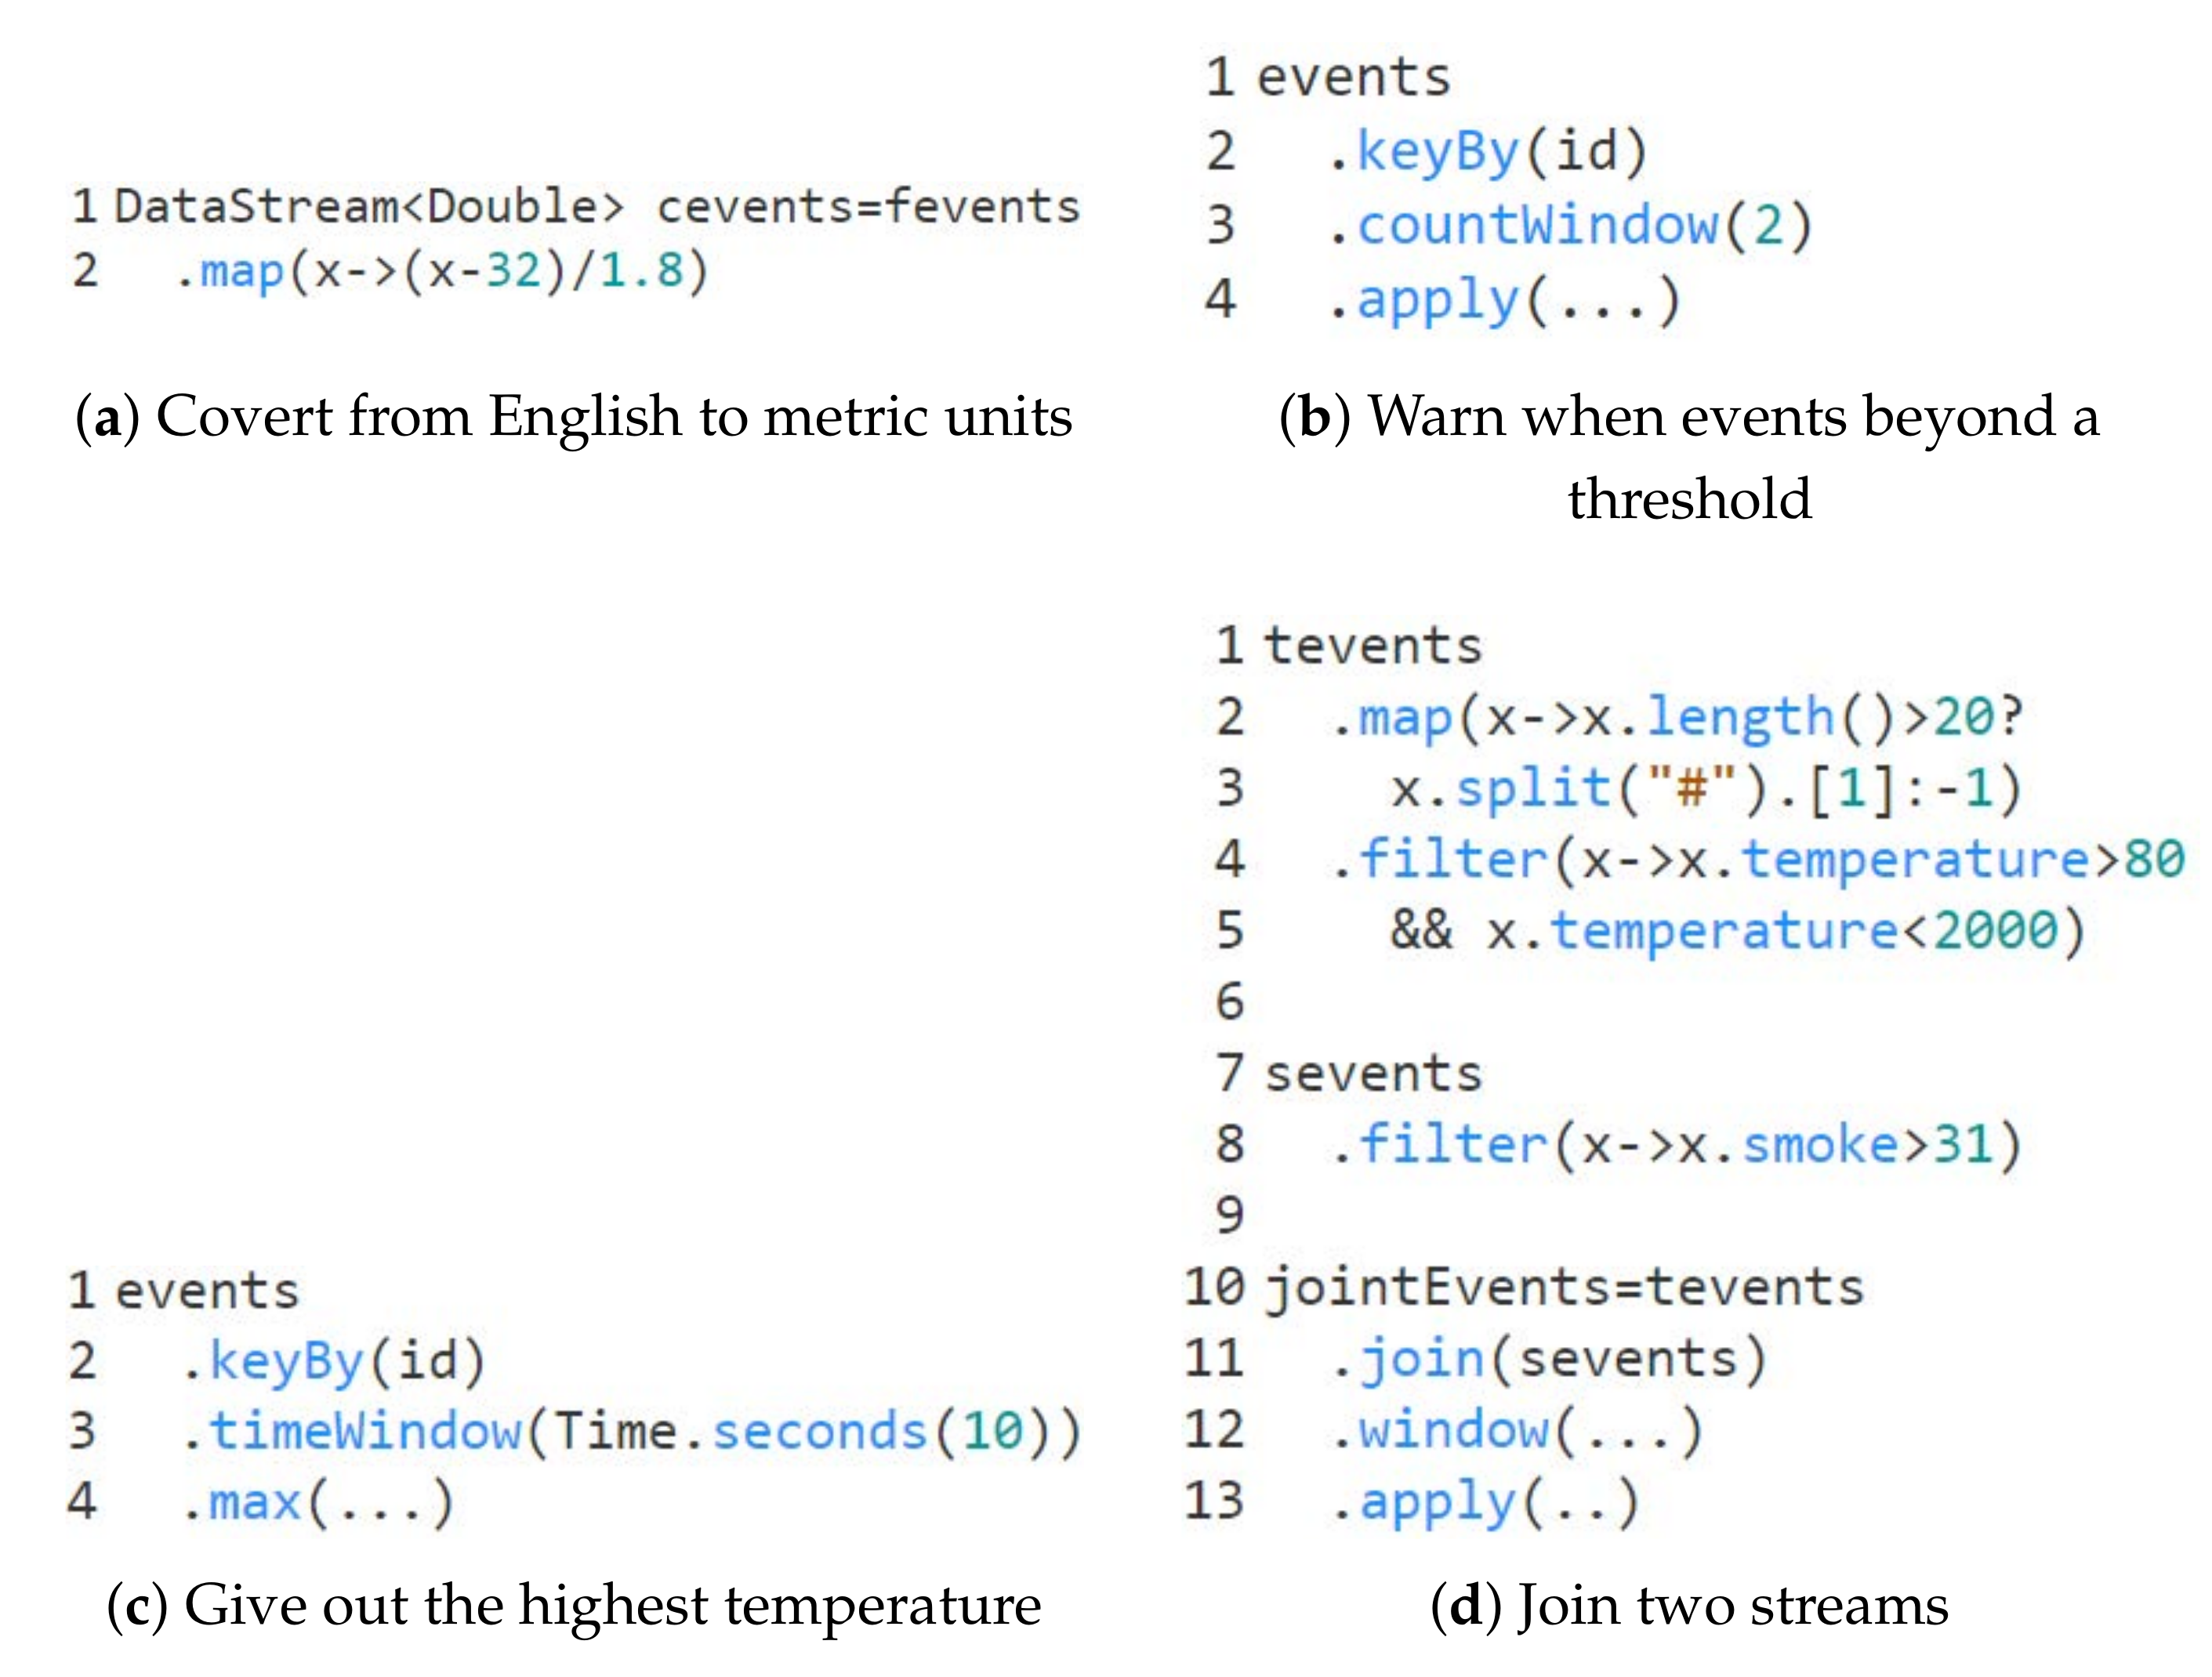
The first program is to convert temperature values from English to metric units. Bob implements the conversion process with one map operator, and the main part of this program is shown in
Figure 1a. The conversion is implemented in the map operator (line 2). In Flink, the
map operator is responsible for DataStream to DataStream transformation. Specifically, it takes one stream data as input and then produces another stream data as output. We can infer that this conversion is stateless and it will react to every stream data individually, regardless of whether it arrives early or late. Even though this program is reasonably plain, it represents a large class of DSP programs for which the order of input data will not impact the final results.
The second program gives out a warning whenever any two consecutive temperature events occur beyond some certain threshold in a given interval, which is similar to the request in [
29]. In
Figure 1b, Bob first uses
keyBy operator to partition data streams according to their keys (line 2). In this program, the keys are the IDs of each sensor. Then, he adopts the
countWindow (i.e., count-based window) operator so that the computing is triggered whenever every two stream data with the same ID are ingested (line 3). He implements the data processing algorithms with the
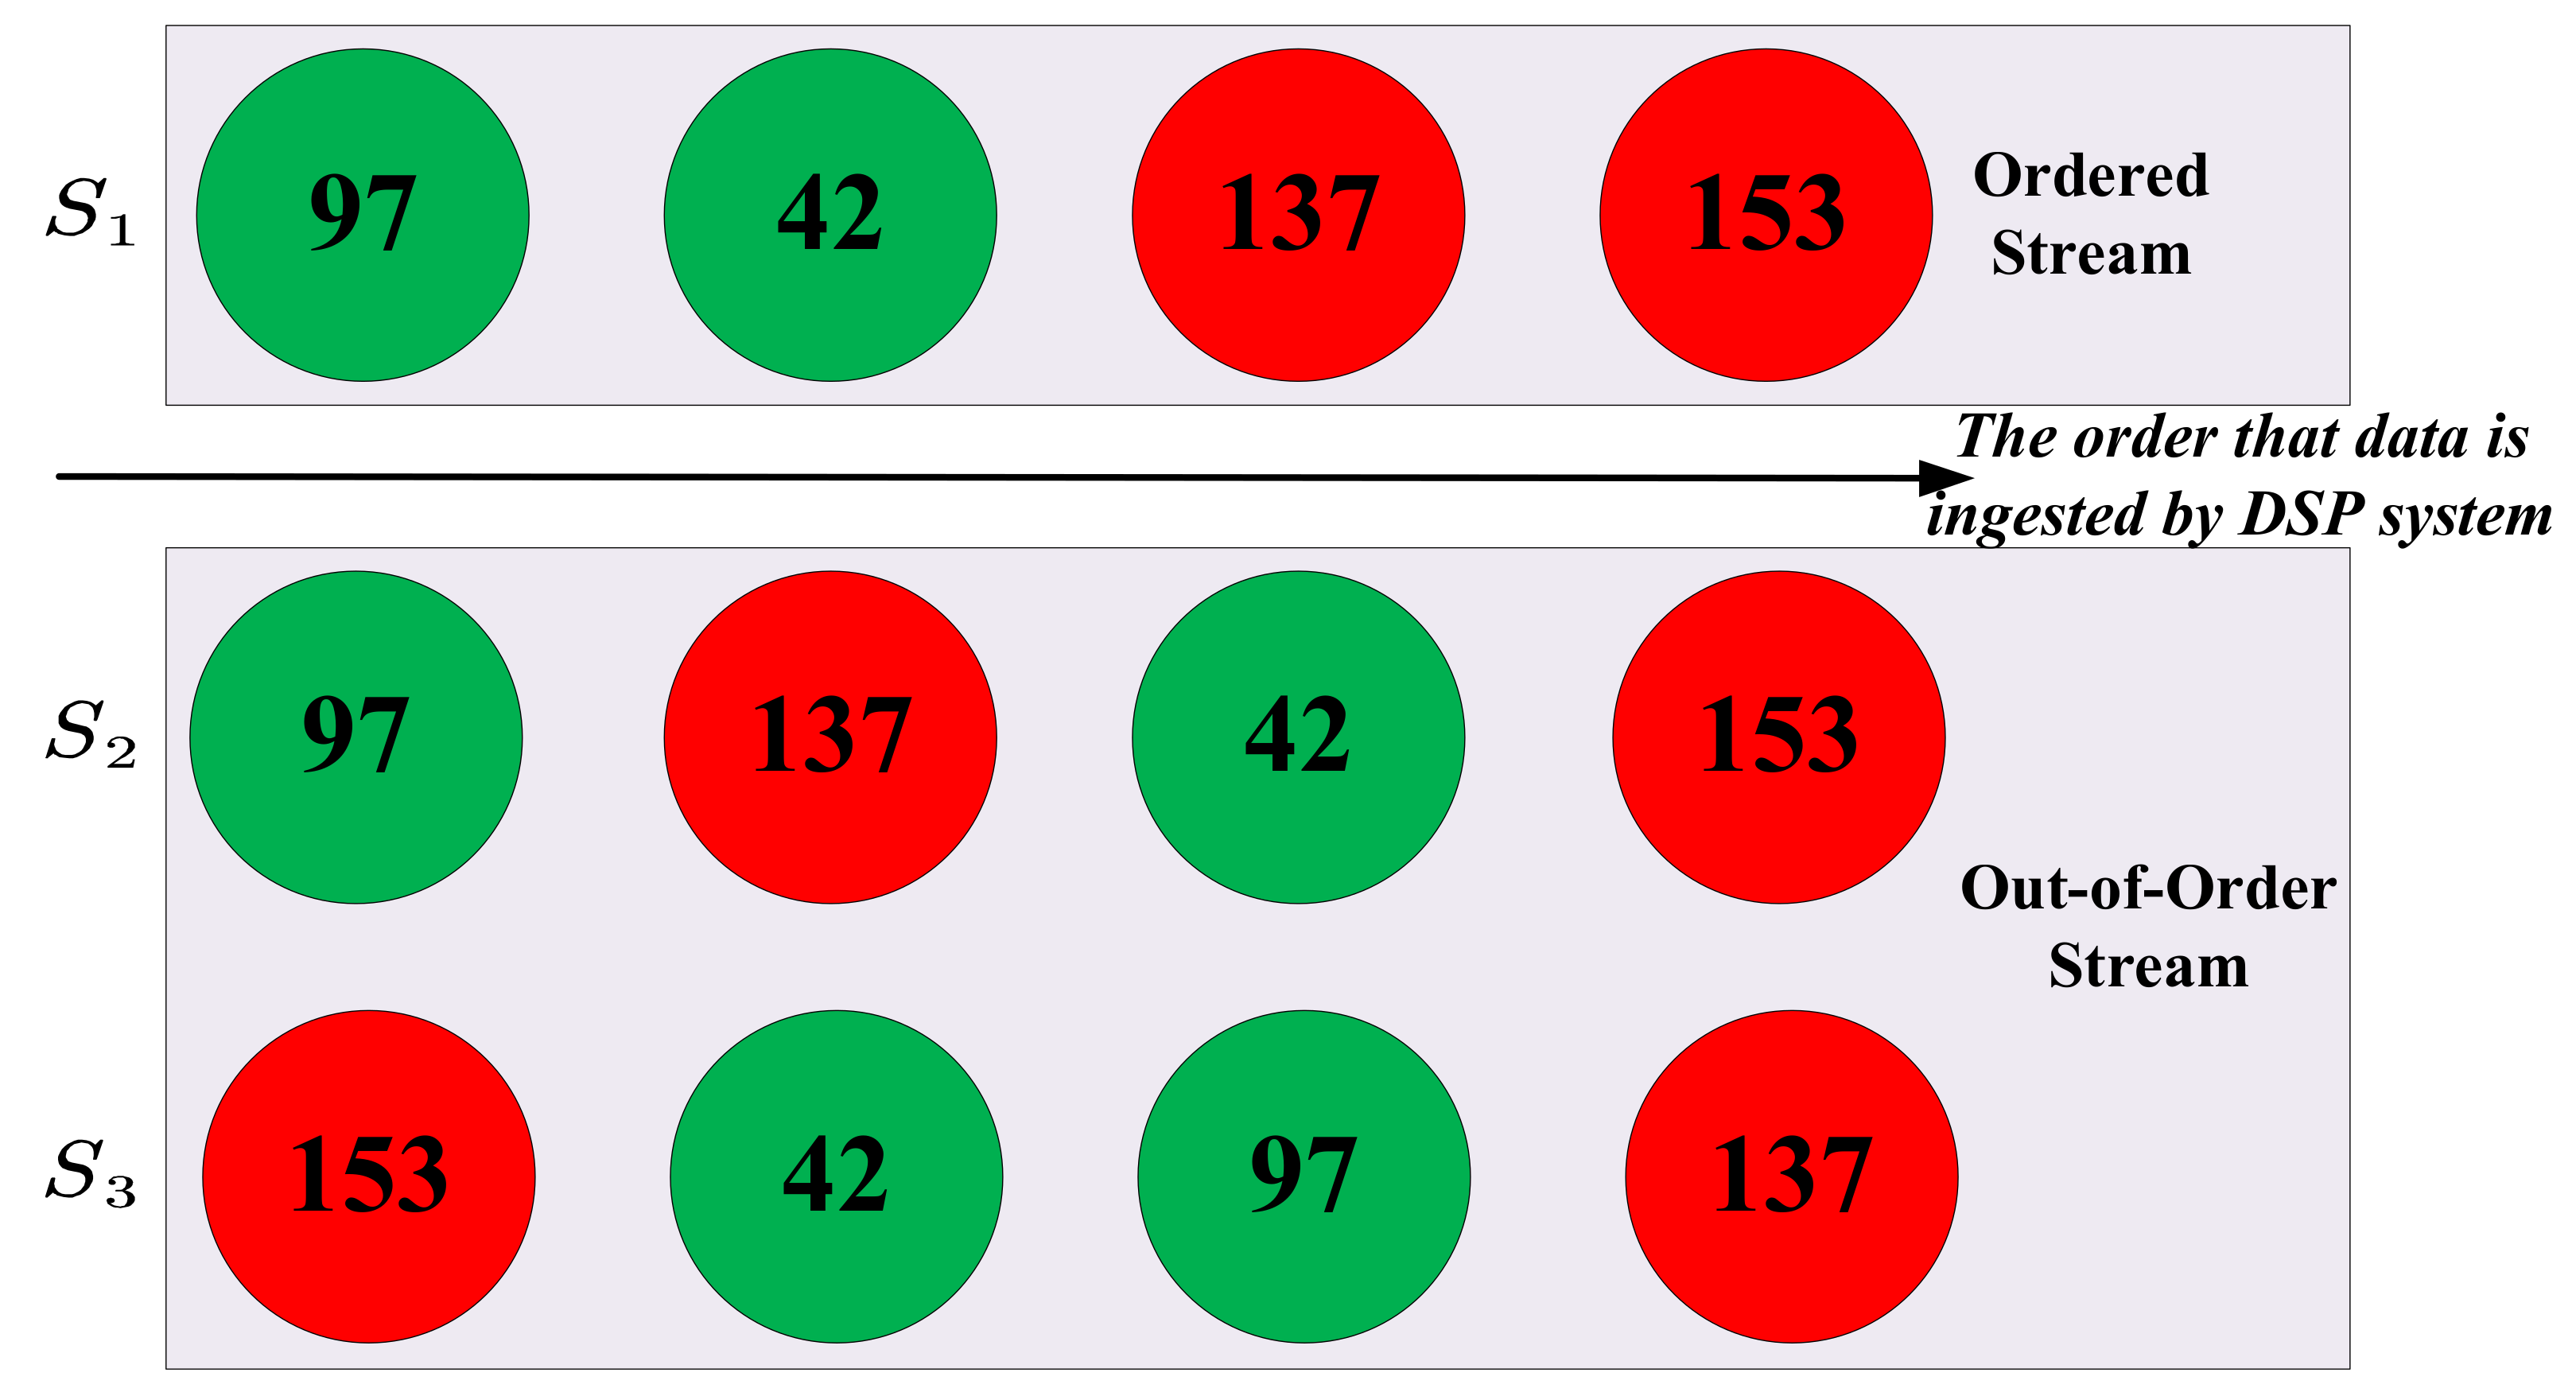
apply operator (line 4). As we can infer, the results of this program will be impacted by the order of input source data. For instance, we have three streams denoted as
,
, and
(which can be infinite, but we only show four data for each stream) as shown in
Figure 2, among which
is ingested by DSP systems in order, while the other two are not. We specify the threshold as 100 so that any stream data beyond 100 (which are represented as red circles) will potentially trigger the alarm. This program will emit an alarm after four data in
are processed, while there is no alarm for the other two. We also notice that the degree of out-of-order for
and
differs, but they share the same results (i.e., no alarms).
The third program is to give out the highest temperature detected in a short period. In
Figure 1c, Bob first uses the
keyBy operator to partition data streams according to their keys (line 2) similar to the program above. Then, he groups stream data into a time window (line 3). He calculates the highest temperature by applying
max to the stream data in each time window. The order of stream data will impact the results. For example, if the highest temperature value arrives late after the window it belongs to, then an incorrect result may occur. The results will not be influenced when the low-temperature values are out of order, or the highest temperature is late but still in the required time window.
We can draw several conclusions from the above three programs. (1) Reordering stream data may damage the correctness of DSP programs. (2) The degree of reordering may lead to different effects. In other words, some DSP programs may be tolerant of some kind of out-of-order, while some other programs will produce incorrect results as soon as a bit disorder happens.
Alice, the tester, can easily design the test data if path coverage is the only target. For programs (a) and (c), any non-null test data will achieve 100% path coverage. For program (b), she can reach the same path coverage goal when the apply operator does not contain any branches inside. However, when taking input data reordering into consideration, she has to build multiple test data first and then composes them into streams with some temporal orders to simulate different degrees of out-of-order.
The fourth program gives out a fire alarm when two streams representing the temperature and smoking meet some conditions simultaneously. Bob splits each data to get the temperature value for the temperature stream solely if the length of this individual data is over 20 (line 2, 3), and filters out the temperature out of the range between 80 and 2000 (line 4, 5). For the smoke stream, Bob filters out the smoke whose concentration is less than 31 g/m (line 8). Then, Bob joins these two streams (line 11), groups them with a window operator (line 12), and then applies some custom implementation (line 13).
For the program in
Figure 1d, an automatic testing solution requires nontrivial efforts to achieve high path coverage. Alice first manually creates test data for this program. However, it is time-consuming and heavy labor. The minimum number of required test data is the product of the number of all possible branches of every operator (e.g., for the program (d), the number of all possible branches for
map is two (one represents the length of data over 20, and another one represents less than 20)). Alternatively, Alice adopts the random test data generation as many PBT solutions do. The cons are that the data from a random generator will be skewed in reordering and challenging to hit some specific conditions. With a limited time budget, it may fail to generate test cases to execute some complicated paths.
2.2. DSP and Apache Flink
DSP program. Typically, one DSP program consists of the combination of operators (high order functions) and UDFs that are implemented under the constraints of operators. These operators, together with UDFs, implement the program logic and are chained in tandem. One typical DSP application is the composition of some DSP APIs and user-defined logic within them from the developers’ view. DSP APIs, through which we can interact with DSP operators, and user-defined logic are two blocks for one DSP application. Our study will mimic the DSP APIs and transform them into DSP-free code so that a third-party symbolic execution engine can analyze them as regular Java code.
Apache Flink. SPOT targets Apache Flink, called the 4G of Big Data. It is a real-time framework for processing stream data in a high-performance, scalable, and accurate fashion. The stream data is abstracted as DataStream in Flink, representing an infinite list of data in some specific type. New streams are derived from the upstream data during the data transformation with a transformation happening in the upstream operators, which are high-order functions, together with UDFs working within. We targeted Flink as our subject platform and developed a symbolic analysis tool called JPF-Flink, specifically for the programs implemented with the Flink framework.
JDU path coverage. JDU (Joint Dataflow and UDF) path coverage is introduced by Gulzar et al. [
13], which consider the paths thoroughly along with the operators and the internal paths in their UDFs. Their experimental results demonstrate that JDU path coverage is directly related to improvement in fault detection.
2.3. Reordering Metric
Reorder density (RD) [
30,
31] is a representative metric to measure the out-of-order, which is defined as the discrete density of the fractions of displaced packages. Let the set of reordering events with displacement equal to
k being denoted as
, and the actual order of the events is expressed as in Equation (
1):
where
m is the index in the ordered sequence and
is the discrepancy in reordered sequence.
The actual index to one package
m is given as
. The observation
represents that the package does not arrive at the position it should be, i.e., we can say that the package is out of order. The package arrives late when
, and early when
. Let
denote the cardinality of the set. Then, it is defined as normalized with respect to the total number of received packages
N, shown as in Equation (
2):
A threshold
can be set, where a too early or too late package beyond this value will be dropped; thus,
. Derived from the RD metric, entropy [
32] is defined as a scalar metric to measure the overall out-of-order characteristics of one sequence. Entropy of a discrete of probabilities is defined as the negative sum of the probability multiplying by the logarithm of the probability [
33]. On the top of RD metric, their corresponding entropy (
) is expressed as in Equation (
3):
By considering the threshold
, the entropy can be calculated as in Equation (
4):
2.4. Solution Architecture
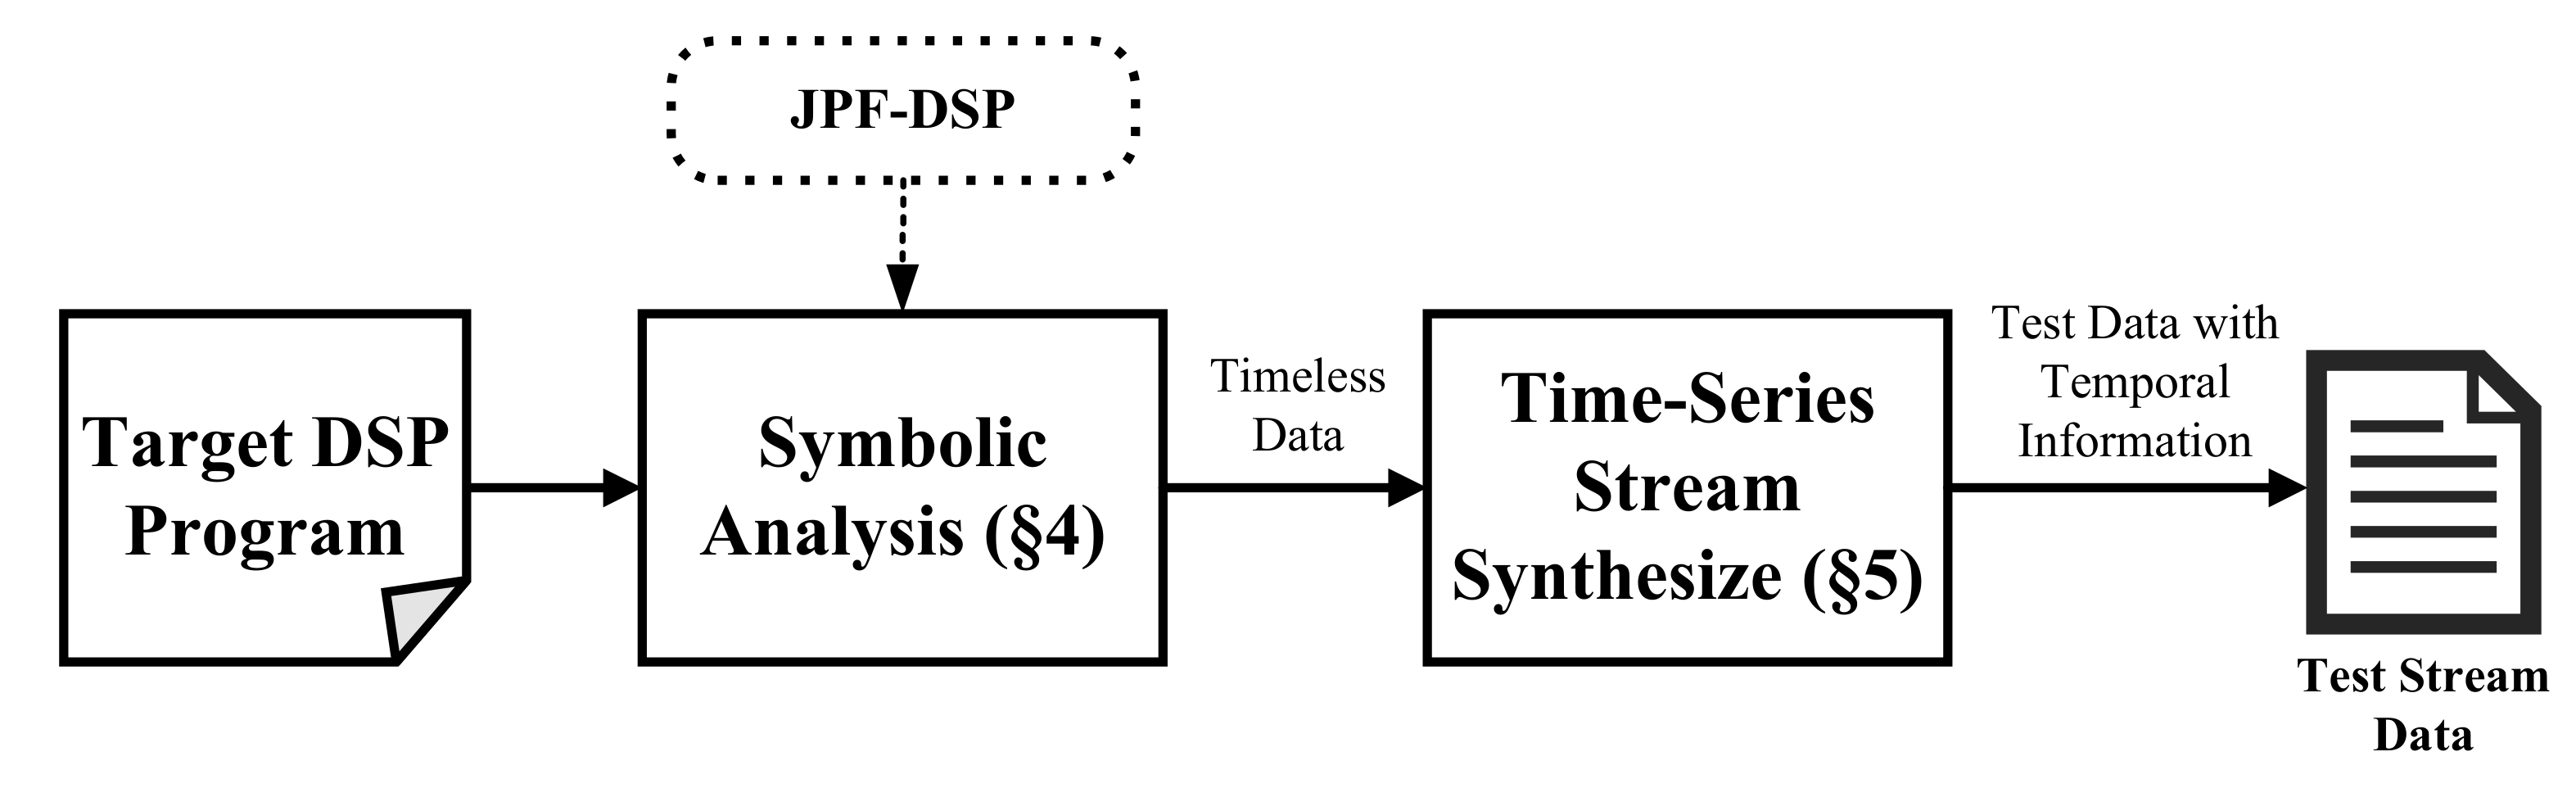
In this section, we give an overview of SPOT. The architecture is shown in
Figure 3. In summary, one DSP program is first symbolically analyzed and a set of timeless data are produced. Then, SPOT takes these symbolic execution results (which are mutually independent data) as seeds, extends them with temporal relations, and composes them into various streams in different reordering situations. Each data in one stream are interdependent with each other and follows some temporal order.
3. Symbolic Analysis Approach
In this section, we present how symbolic execution analyzes the DSP program, gets PCs, and generates test data for further analysis. We enhance the off-the-shelf tool, namely JPF [
34], and its extension SPF [
15,
35] for symbolic analysis, to tailor the symbolic execution analysis for DSP programs. Symbolic execution [
14] is a popular solution to generate test data by solving all PCs, where PC is a Boolean expression over the symbolic inputs and included in the execution state [
36].
We adopt SPF as the underlying symbolic analysis tool. However, it is hard to apply to DSP programs directly. Unlike plain programs, the DSP programs consist of operators and UDFs where the former are implemented in a large-scale framework, and the latter are built under the constraints of the semantics of their corresponding operators. Existing symbolic execution tools, including SPF, are unlikely to scale to the large-scale framework code (e.g., the notorious state space explosion problems [
37]). One solution is to create a framework model that can be executed symbolically [
38]. This paper presents an approach to mock up the general operators sharing among current popular DSP frameworks and instantiate them specifically for Apache Flink.
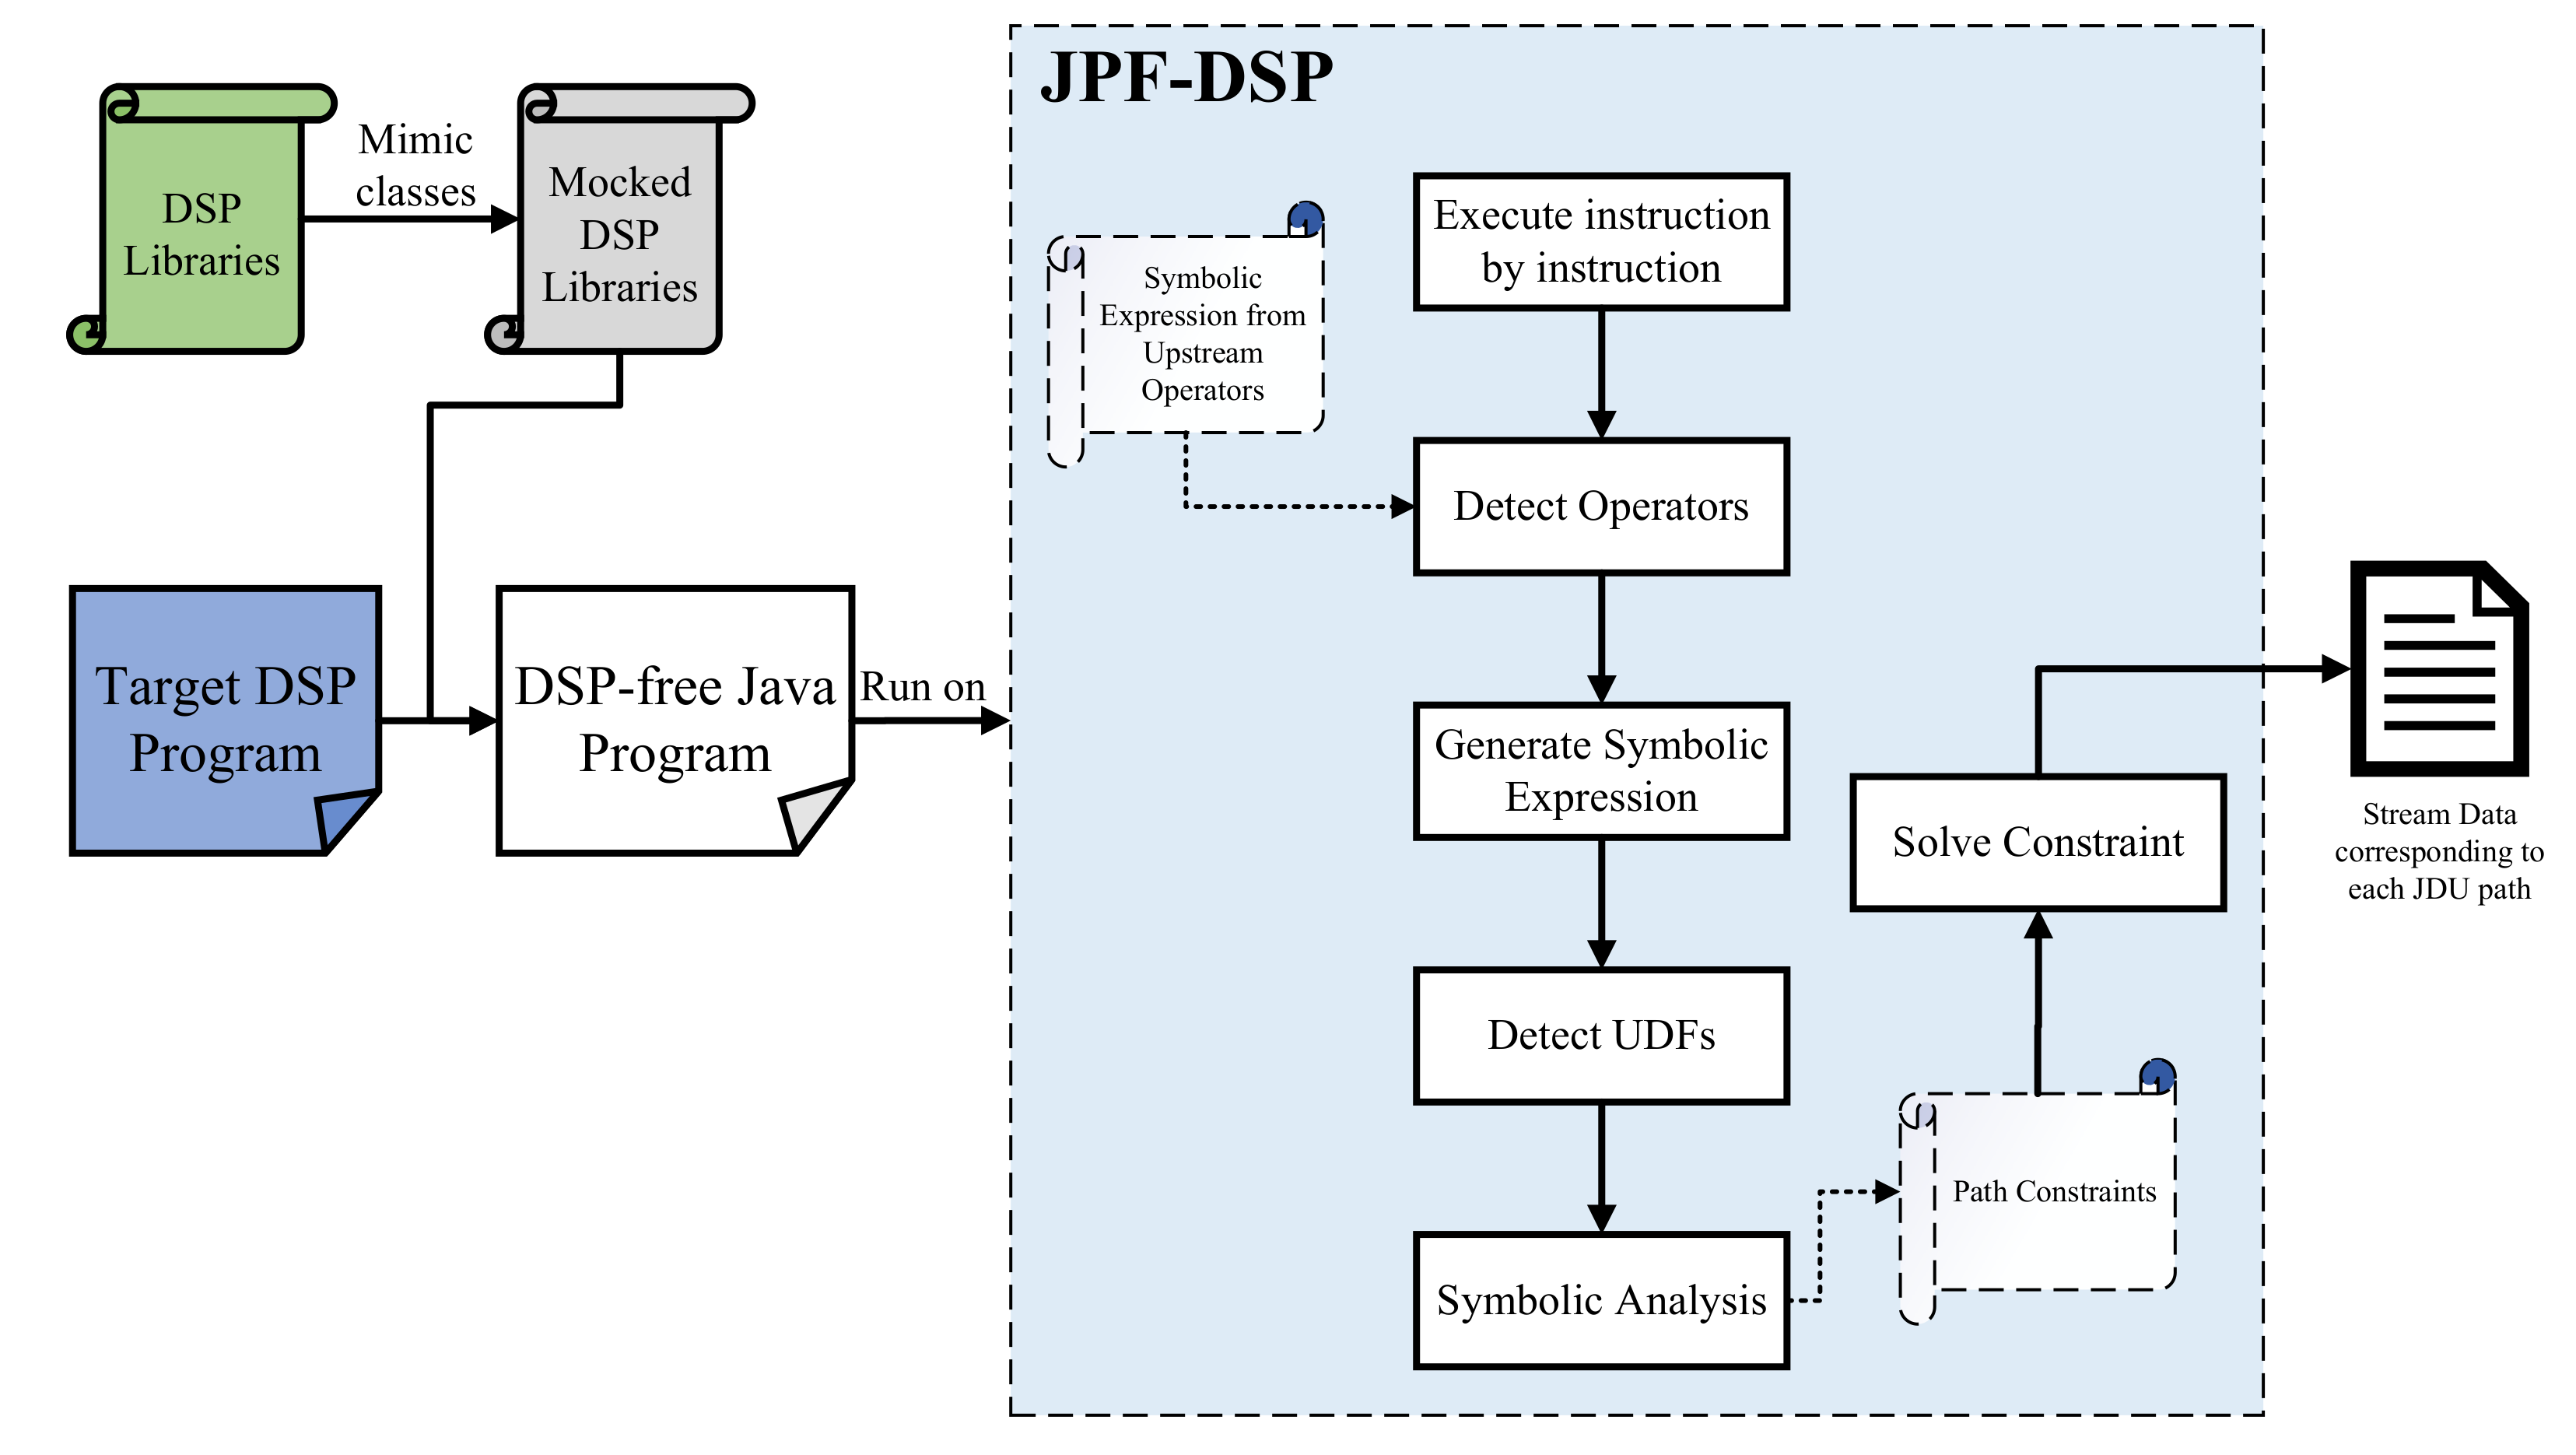
Apart from the large-scale framework, the relational dependency between upstream and downstream operators will also bring challenges, as we should take care of the symbolic expressions passing from upstream operators. In this paper, SPOT will maintain the symbolic expressions, passing them from upstream operators to downstream operators.
Our symbolic analysis approach is shown in
Figure 4.
3.1. DSP Model Classes Mocking Up
We manually create a DSP framework model that mimics classes in this framework to apply SPF in analyzing DSP programs. We mimic DSP libraries by mocking up some representative operators and other relevant classes. It eliminates the external dependencies by replacing various DSP methods predefined in its framework to prevent third-party symbolic tools from getting stuck reporting unrecognized methods. It shares the same interfaces and the classes to be used in one DSP program, but is implemented much simpler and more abstract so that there is no need to modify the DSP program and transparent to testers.
We use a list to simulate the stream data. Unlike the real stream data, which may be infinite, our simulated list is bounded in length k (the default is 1) that is enough in simulating most DSP behaviors.
Classes that are invoked in DSP programs but irrelevant to analysis are simplified to empty. Classes referring to stream process environment initialization and starting jobs are such instances.
We mimic the DataStream and its core data structure as a generic ArrayList, not specified as specific data types. We also mimic the KeyedStream, which extends DataStream but contains one additional generic property, i.e., key.
We have not considered time-related operators (e.g., Window, WindowReduce, et cetera) because they denote the process in the time domain, and the temporal relation will be handled afterward when we synthesize the data set into time-related series, as we will talk about in Section V.
3.2. Maintaining Symbolic Expression
Symbolic expressions are a symbolic store that associates program variables with expressions over concrete and/or symbolic values [
14].
A DSP program can be expressed as a DAG (i.e., directed acyclic graph) where the nodes are operators, and the edges represent the input–output relationships of operators. The symbolic analysis happens from the first operator to the end operator along the DAG. During the symbolic analysis process, the input parameters of each operator will be expressed as symbolic expressions, and the output results can also be expressed symbolically according to the semantic constraints of operators and UDFs.
On top of how the symbolic expressions pass from input to output within one operator, we will also consider the mechanism about symbolic expression passing from upstream operators to downstream operators. During the symbolic analysis, we will ensure that the output symbolic expressions of upstream operators are passed into the adjacent downstream operators.
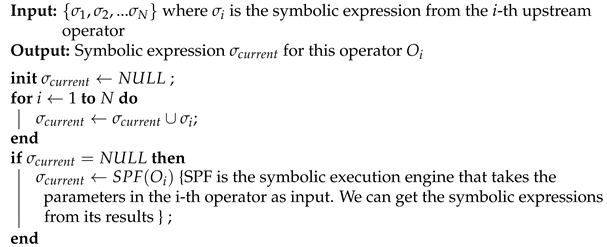
The symbolic expressions before analyzing one operator’s body are generated based on its upstream operators and its parameter, shown in Algorithm 1.
| Algorithm 1: Generating symbolic expression before analyzing one operator. |
![Applsci 11 08057 i001]() |
The symbolic analyzing engine (e.g., SPF in our study) will maintain these symbolic expressions during symbolic executing along the operator body, and generate PCs once branches are met. The PCs are also maintained automatically by the symbolic analyzing engines. After finishing executing all programs, we can get all PCs, from which we can infer how the input data looks like if we want to reach some program path. By solving all these PCs and generating representative samples, we can have test data to cover all JDU paths.
3.3. Implementing JPF-Flink
To be concrete, we choose Apache Flink as our subject DSP platform. Thus the JPF-DSP in
Figure 3 is named JPF-Flink more specifically. JPF-Flink is a JPF extension built on jpf-core, providing symbolic analysis for Flink programs by interacting with SPF. It interprets the byte codes of one Flink program in a customized way. Once the byte codes relating to one Flink operator or its internal UDFs are detected, they will be redirected out of the standard byte code execution flow, and JPF-Flink will make necessary preparations for symbolic analysis and then delegate the symbolic execution to SPF. To make JPF-Flink work, we implement the main components as follows.
FlinkSymbolicInstructionFactory. It extends the SymbolicInstructionFactory from SPF and is used to intercept the calls to invokevirtual byte code, which is one of the Java standard instructions and invokes instance method. We implement our Flink operator detection logic by overriding the invokevirtual method. This class is responsible for detecting whether the current instruction is relevant to Flink operators. Once instructions about Flink operators are detected, this class will emit a customized INVOKEVIRTUAL instruction.
INVOKEVIRTUAL. We customize the new instruction execution flow by overriding the execute method in INVOKEVIRTUAL class from SPF. Once the new INVOKEVIRTUAL executes, that is to say, the execute method is invoked, we will compound several symbolic configuration clauses as the form “symbolic.method=” to specify the methods and their parameters to be executed symbolically.
FlinkOPListener. It extends the PropertyListenerAdapter
https://github.com/javapathfinder/jpf-core/wiki/Listeners, accessed on 28 July 2021 from jpf-core. The FlinkOPListener monitors all VM- and Search-related events from JPF, and takes actions correspondingly. We override methods like instructionExecuted (every executing instruction will invoke this method), methodExited (the instruction that finishes running one operator will invoke it), et cetera. Once some interesting instructions are detected, this class will respond by calling the corresponding methods in OPSequenceCoordinator.
OPSequenceCoordinator. It is the real workhorse that takes solid actions after FlinkOPListener receives interested events after executing instructions. For instance, once one instruction (detected in FlinkOPListener) corresponds to some Flink operator is detected, we then set up processing strategies (e.g., symbolic expression generation, et cetera) corresponding to this operator.
FlinkValidator. It is used to determine whether one instruction corresponds to Flink operators or UDFs. The Flink operators that we will analyze are prespecified in one global ArrayList. Then, we can check by extracting the method’s name from instructions and searching this global ArrayList. UDFs are determined by analyzing their parent operators.
4. Time Series Stream Synthesis
Generating independent test data through symbolic execution is not enough to test DSP programs because they do not take temporal features into account, as the test data from symbolic execution represents only the “what” that we will compute in a dataflow model [
41]. Temporal features of stream data are equally critical because the behavior of SUT (i.e., Software Under Test ) is decided by the value of the input and the sequence of test data set in some specific order. In this paper, we will consider not only the values of test data (i.e., the “what” part of stream data) but also the temporal orders and time intervals between them (i.e., the “when” part of stream data).
Some anomalies may happen in real stream processing scenarios, but we do not consider them this time. Such anomaly includes data loss, tampering, and duplication. In this paper, we only consider the out-of-order and the lag of the stream. In other words, we will build the test stream basing on the data sequence without losses, duplication, or value variation.
4.1. Modeling Stream
To synthesize a time series of stream data, we need to generate timestamps and assign a timestamp to every timeless data that we have obtained in the symbolic execution phase. To describe the process in a formal way, we need to introduce some terminology.
Definition 1. Stream data. Stream datum e is of a nested data type that mainly consists of the data value v and a timestamp t, i.e., the stream datum is a tuple represented as .
In this definition, we regard one stream datum e as a compound datum composed of spatial and temporal data. Here, we refer to v as the spatial datum, as it represents how some specific JDU paths will be covered when running with this value. The temporal datum t is more straightforward, which is the physical time when the stream datum is generated (e.g., datum generated by remote sensors in IoT systems).
Definition 2. Stream. A stream s is a sequence of stream data in a logical order: , where the length of s can be finite or infinite.
Definition 3. Logical order in stream data. We use ⇐ to represent the logical order of two stream data, which decides the order of these two data to be ingested by DSP programs.
For instance, we write to denote that during the test process, stream data y should be fed into the SUTs after stream data x. This logical order is independent of the potential order basing on the timestamps in stream data. When conducting the test, we feed the SUT with the data from the time series stream one by one, following the logical order.
Definition 4. Out-of-order stream data. We define two stream data x and y out-of-order as , but where and represent timestamps of these two stream data individually.
The logical order of two data will not always be compliant with order based on timestamps. Many metrics have been presented to measure the reordering, including reordering buffer occupancy density, reordering extent, and
n-reordering, et cetera. Piratla et al. [
42] have conducted a comparative analysis about these metrics.
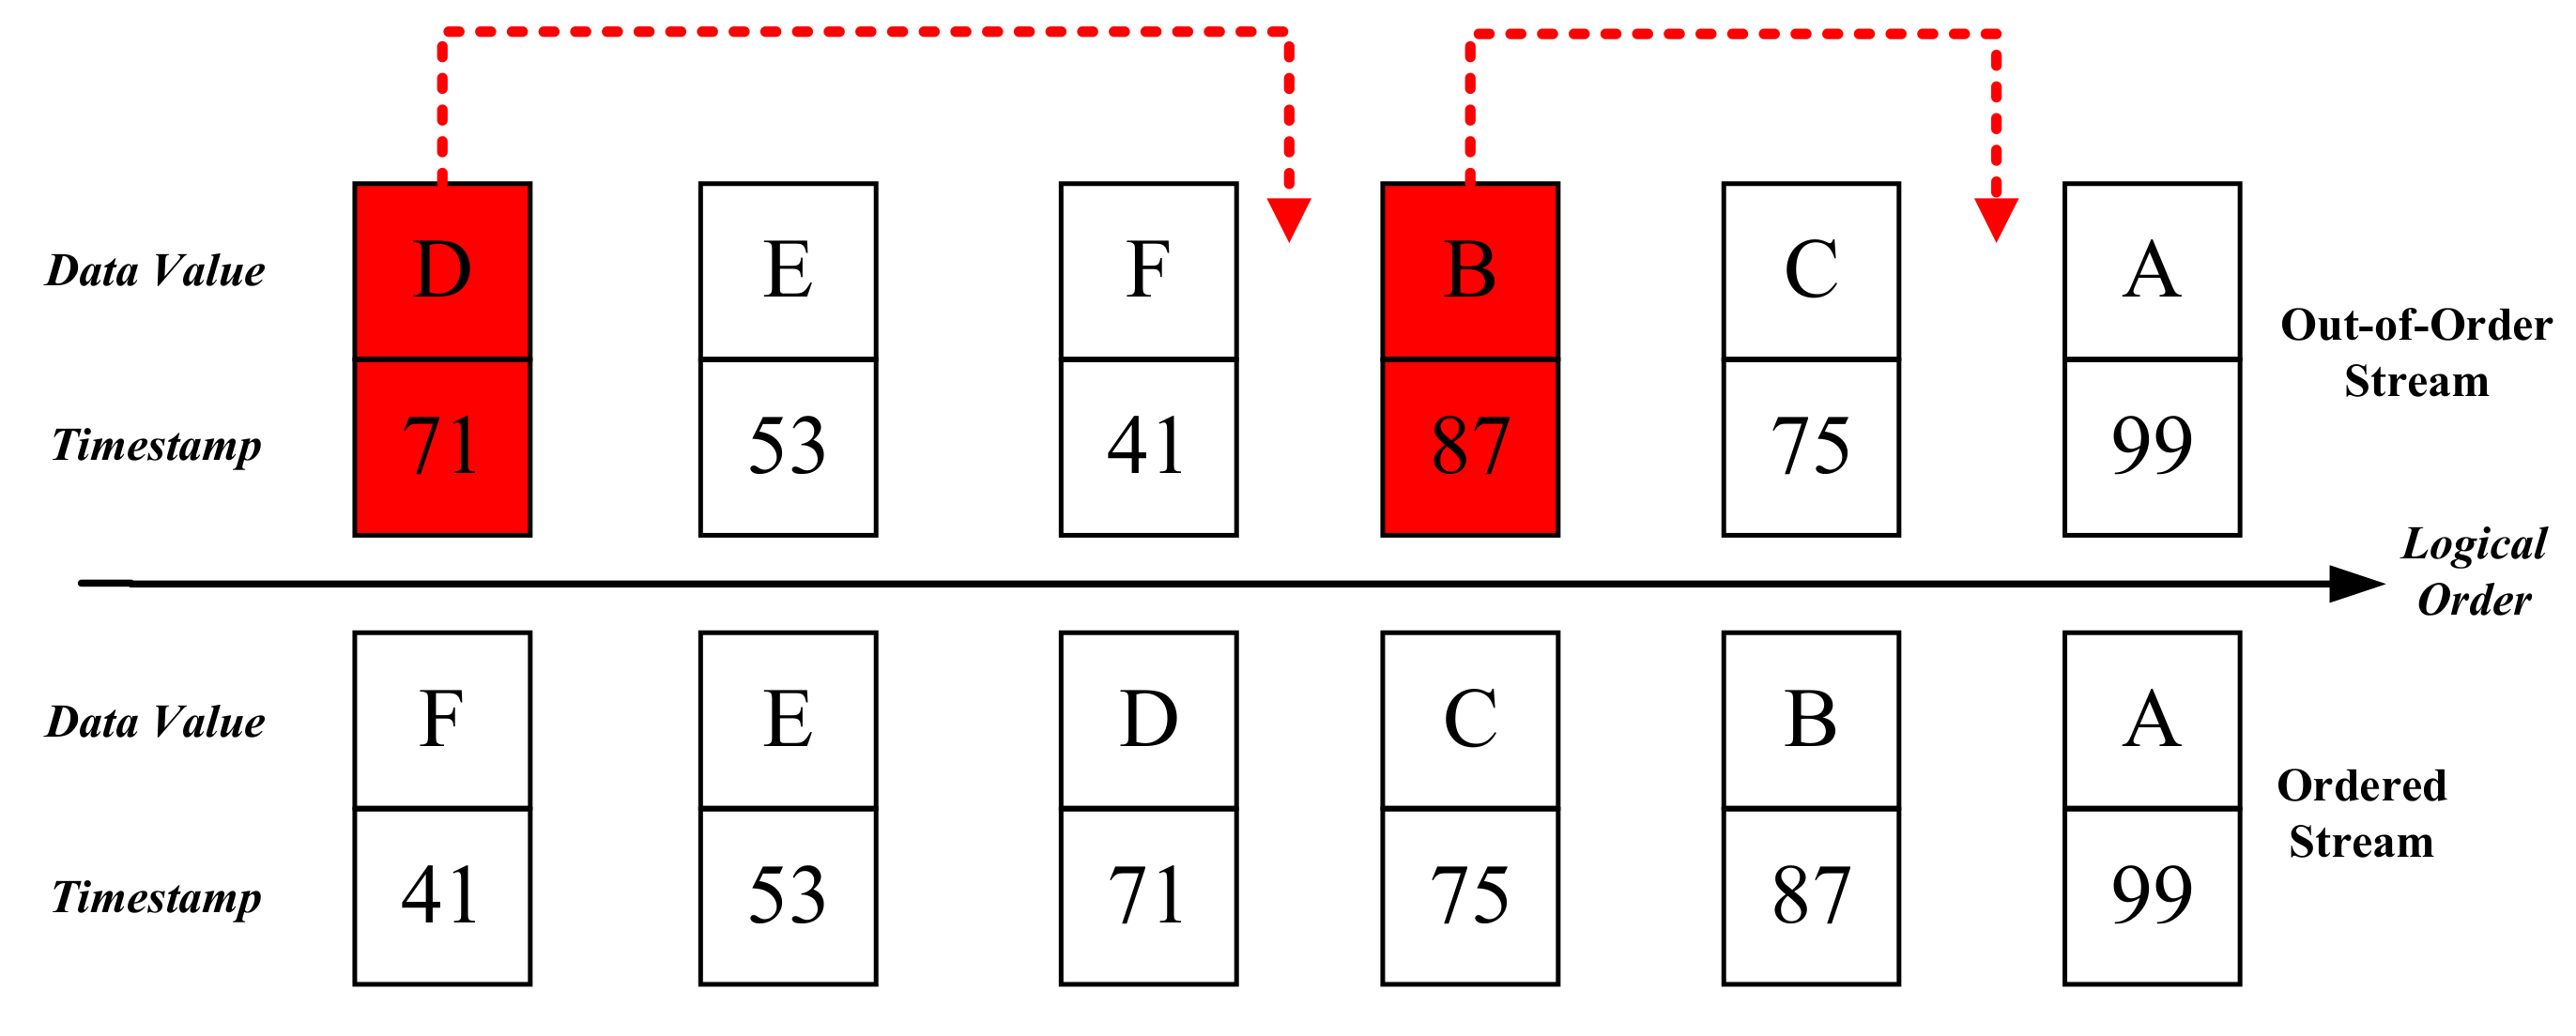
Definition 5. Orderness of a bounded stream. We define the orderness of a bounded stream following the similar notions of RD and entropy. We regard the stream in increasing order with regard to timestamp as the original order, and calculate entropy as the indicator to measure the degree of reordering for other out-of-order streams.
For the bounded stream , which follows a logical order , we can sort according to their timestamp from the earliest to the latest, getting the results where and . The sorted stream works as the baseline and indexed the data from 0 to n. In our study, we assume that no duplicate data exist. For any datum, we can get its displacement by comparing its indices between s and . After getting the displacement of all stream data, we can then calculate the RD and further the entropy. In our study, we adopt entropy to guide our test process.
For unbounded streams, we can split them based on a certain length of time (time window) or some number of data (count window) and measure the out-of-order degree for these stream fragments.
Figure 5 shows two streams, each of which is composed of six stream data. Stream data on the right side are ingested before the ones on the left, and the right data are processed prior to the left data in logical order. The top of
Figure 5 represents a reordering stream where the stream data B and D are late, and the bottom corresponds to its ordered version. We can calculate the entropy of the reordering stream to be 1.56.
4.2. Synthesizing Stream Data
This subsection proposes an approach to synthesize time series streams by assigning temporal relationships to each of the timeless data that we have collected after symbolic analysis.
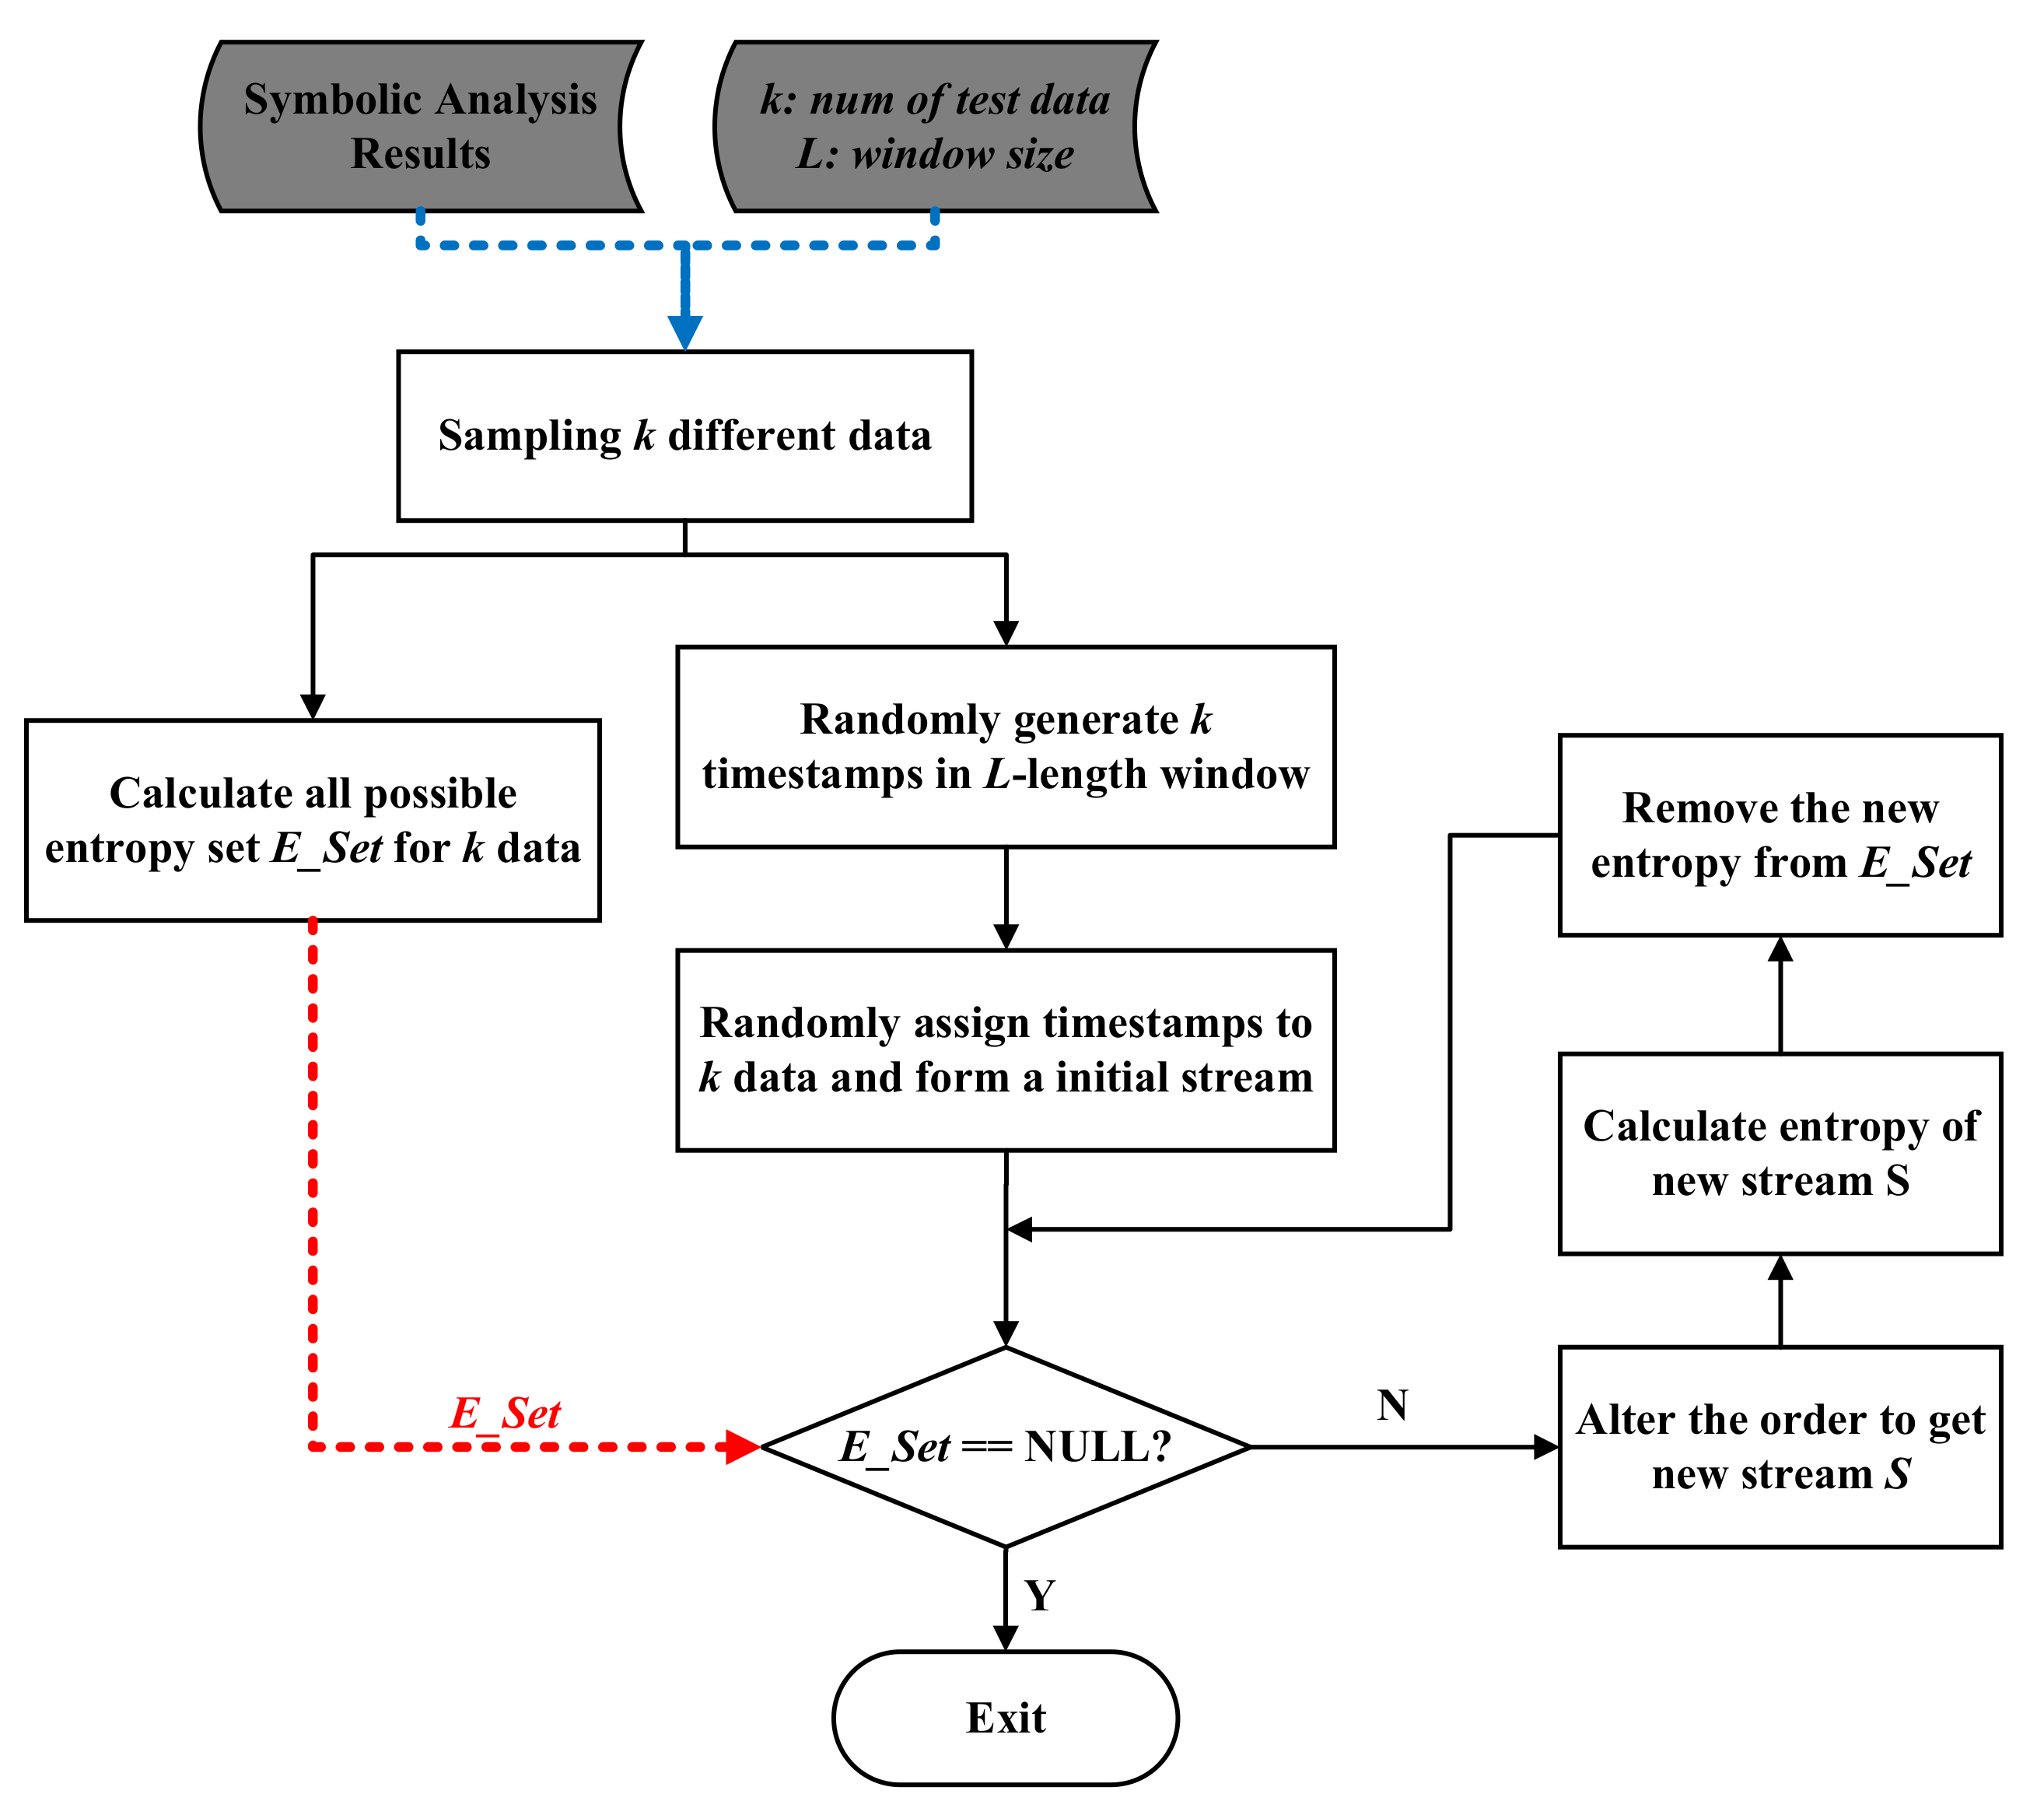
The synthesis approach works in an iterative process, shown in
Figure 6. It mainly consists of the following steps:
- (1)
By repeatedly solving the contrarians from the symbolic analysis phase, we continuously obtain various stream data. We select k different data by sampling, and we will set k larger than the number of paths so that all paths will be covered. The stream data set is expressed as . Initially, we arrange them in a randomly logical order where .
- (2)
We create a time window in L length and sample timestamps within this time window. The time window length can be set as the minimum length among all time windows in the DSP program under test. We randomly sample k timestamps between the beginning (inclusive) of the time window and the end (exclusive) of the time window with uniform distribution.
- (3)
The sampled timestamps are sorted in ascending order and assigned to each data in s individually according to their logical order. For this stream, the logical order is obedient to the order of timestamps such that it is regarded as the baseline stream that other out-of-order streams will compare with.
- (4)
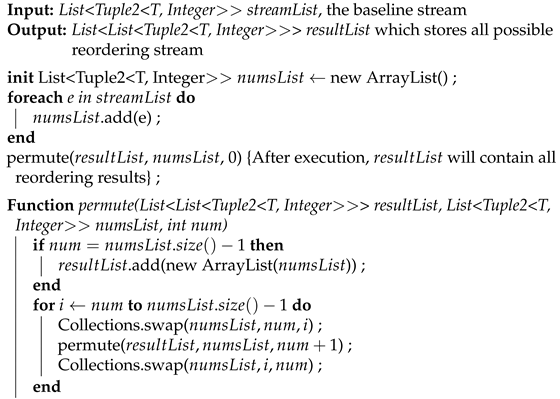
We begin to generate all possible new reordered streams by altering the order of the baseline stream s with Algorithm 2 (the algorithm works as an iterative process).
- (5)
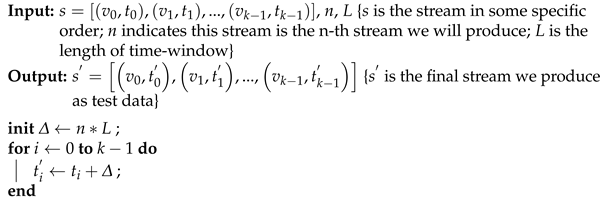
We choose one of the new streams, then calculate the RD and entropy for this new stream. If this entropy value is never achieved before, we then choose this stream as one of our potential test suits. Meanwhile, we need to update their timestamps basing on the number of test suites we have already got. Algorithm 3 describes how the timestamps update, and its purpose is to combine all selected streams into one large stream without overlap.
- (6)
We then pick another generated new reordered stream to achieve a new entropy objective.
The core of Algorithm 2 is the
permute function, which works in a recursive procedure. We have not provided theoretical proof. Instead, we verify its correctness by testing during our developing phase. We design different streams with various lengths from 1 to 5 and feed these streams as input to conduct unit tests. We manually check the results and have observed that the algorithm works as expected.
| Algorithm 2: Alter the order of stream and get all possible reordering situations. |
![Applsci 11 08057 i002]() |
| Algorithm 3: Update timestamps in one test stream. |
![Applsci 11 08057 i003]() |
5. Case Studies
Our experimental evaluation is a quantitative appraisal of the effectiveness and efficiency of SPOT. To be concrete, we choose Apache Flink [
4] as the target DSP platform because of its popularity [
43]. We evaluate the effectiveness and efficiency of SPOT through various sets of subject DSP programs, and compare SPOT against two most recent alternative testing methods, i.e., DiffStream [
25] and FlinkCheck [
26]. We compare them in terms of three aspects: (1) path coverage—JDU path coverage, which works as the metric to measure how good the testing is; (2) efficiency to triggering failure; (3) and stream reordering coverage. The goal of our evaluation is to answer these questions:
- (1)
To what extent is SPOT applicable to DSP programs?
- (2)
How efficient can SPOT achieve in terms of coverage?
- (3)
How efficiently does SPOT perform in triggering failure?
- (4)
How many reordering situations can be covered with existing methods?
Our first case study (Section A) is to illustrate how SPOT applies to DSP operators. The second case study (Section B) is used to qualitatively compare the JDU path coverage between SPOT and the recent two PBT-based testing approaches, i.e., DiffStream and FlinkCheck. In the third case study (Section C), we demonstrate that test data generated by SPOT is more efficient in triggering software failure compared with DiffStream and FlinkCheck. The fourth case study (Section D) describes how random data are skewed in reordering situations.
5.1. How SPOT Applicable to Operators
SPOT supports a variety of operators prevalently in DSP programs. This is especially critical in symbolic execution, as any unrecognized operator will obstruct the analysis by one symbolic engine. The first case study is to show that SPOT can support the symbolic analysis for some common operators.
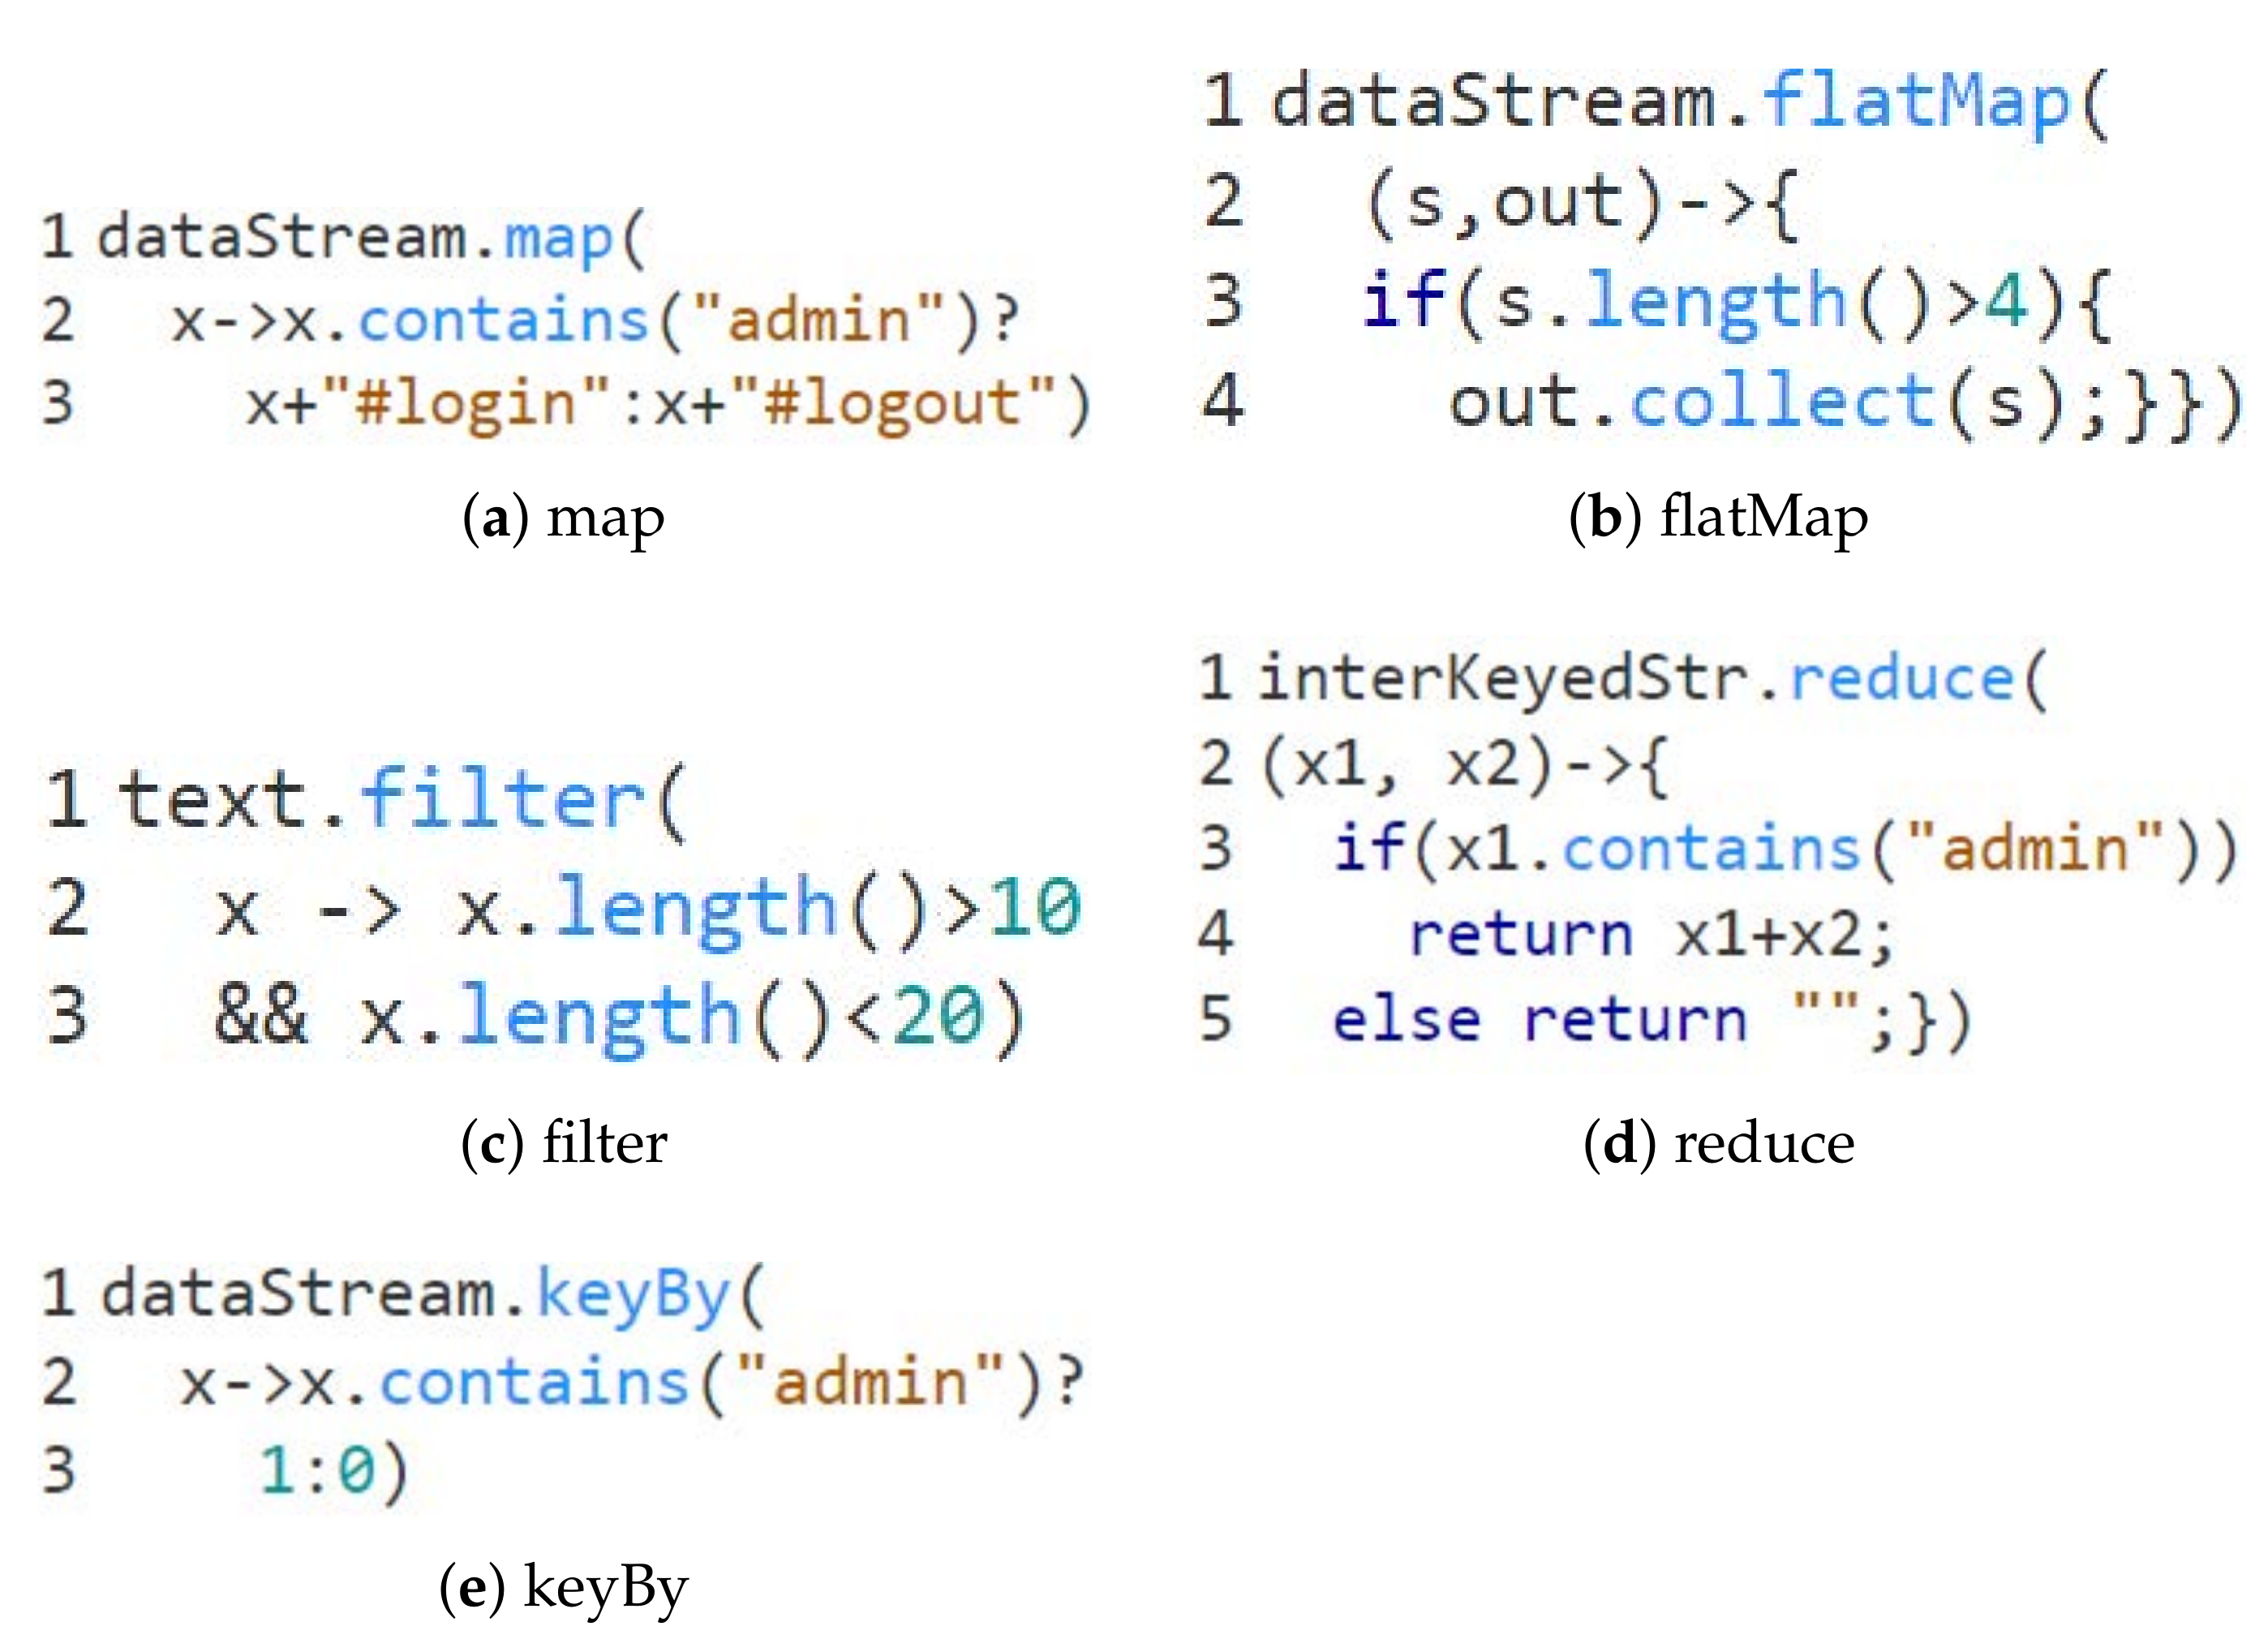
Subject Programs. We build subject programs based on the examples from the Flink website [
44], each corresponding to at least one specific operator. The main part of the source code (we have omitted other irrelevant code to save space) is shown in
Figure 7.
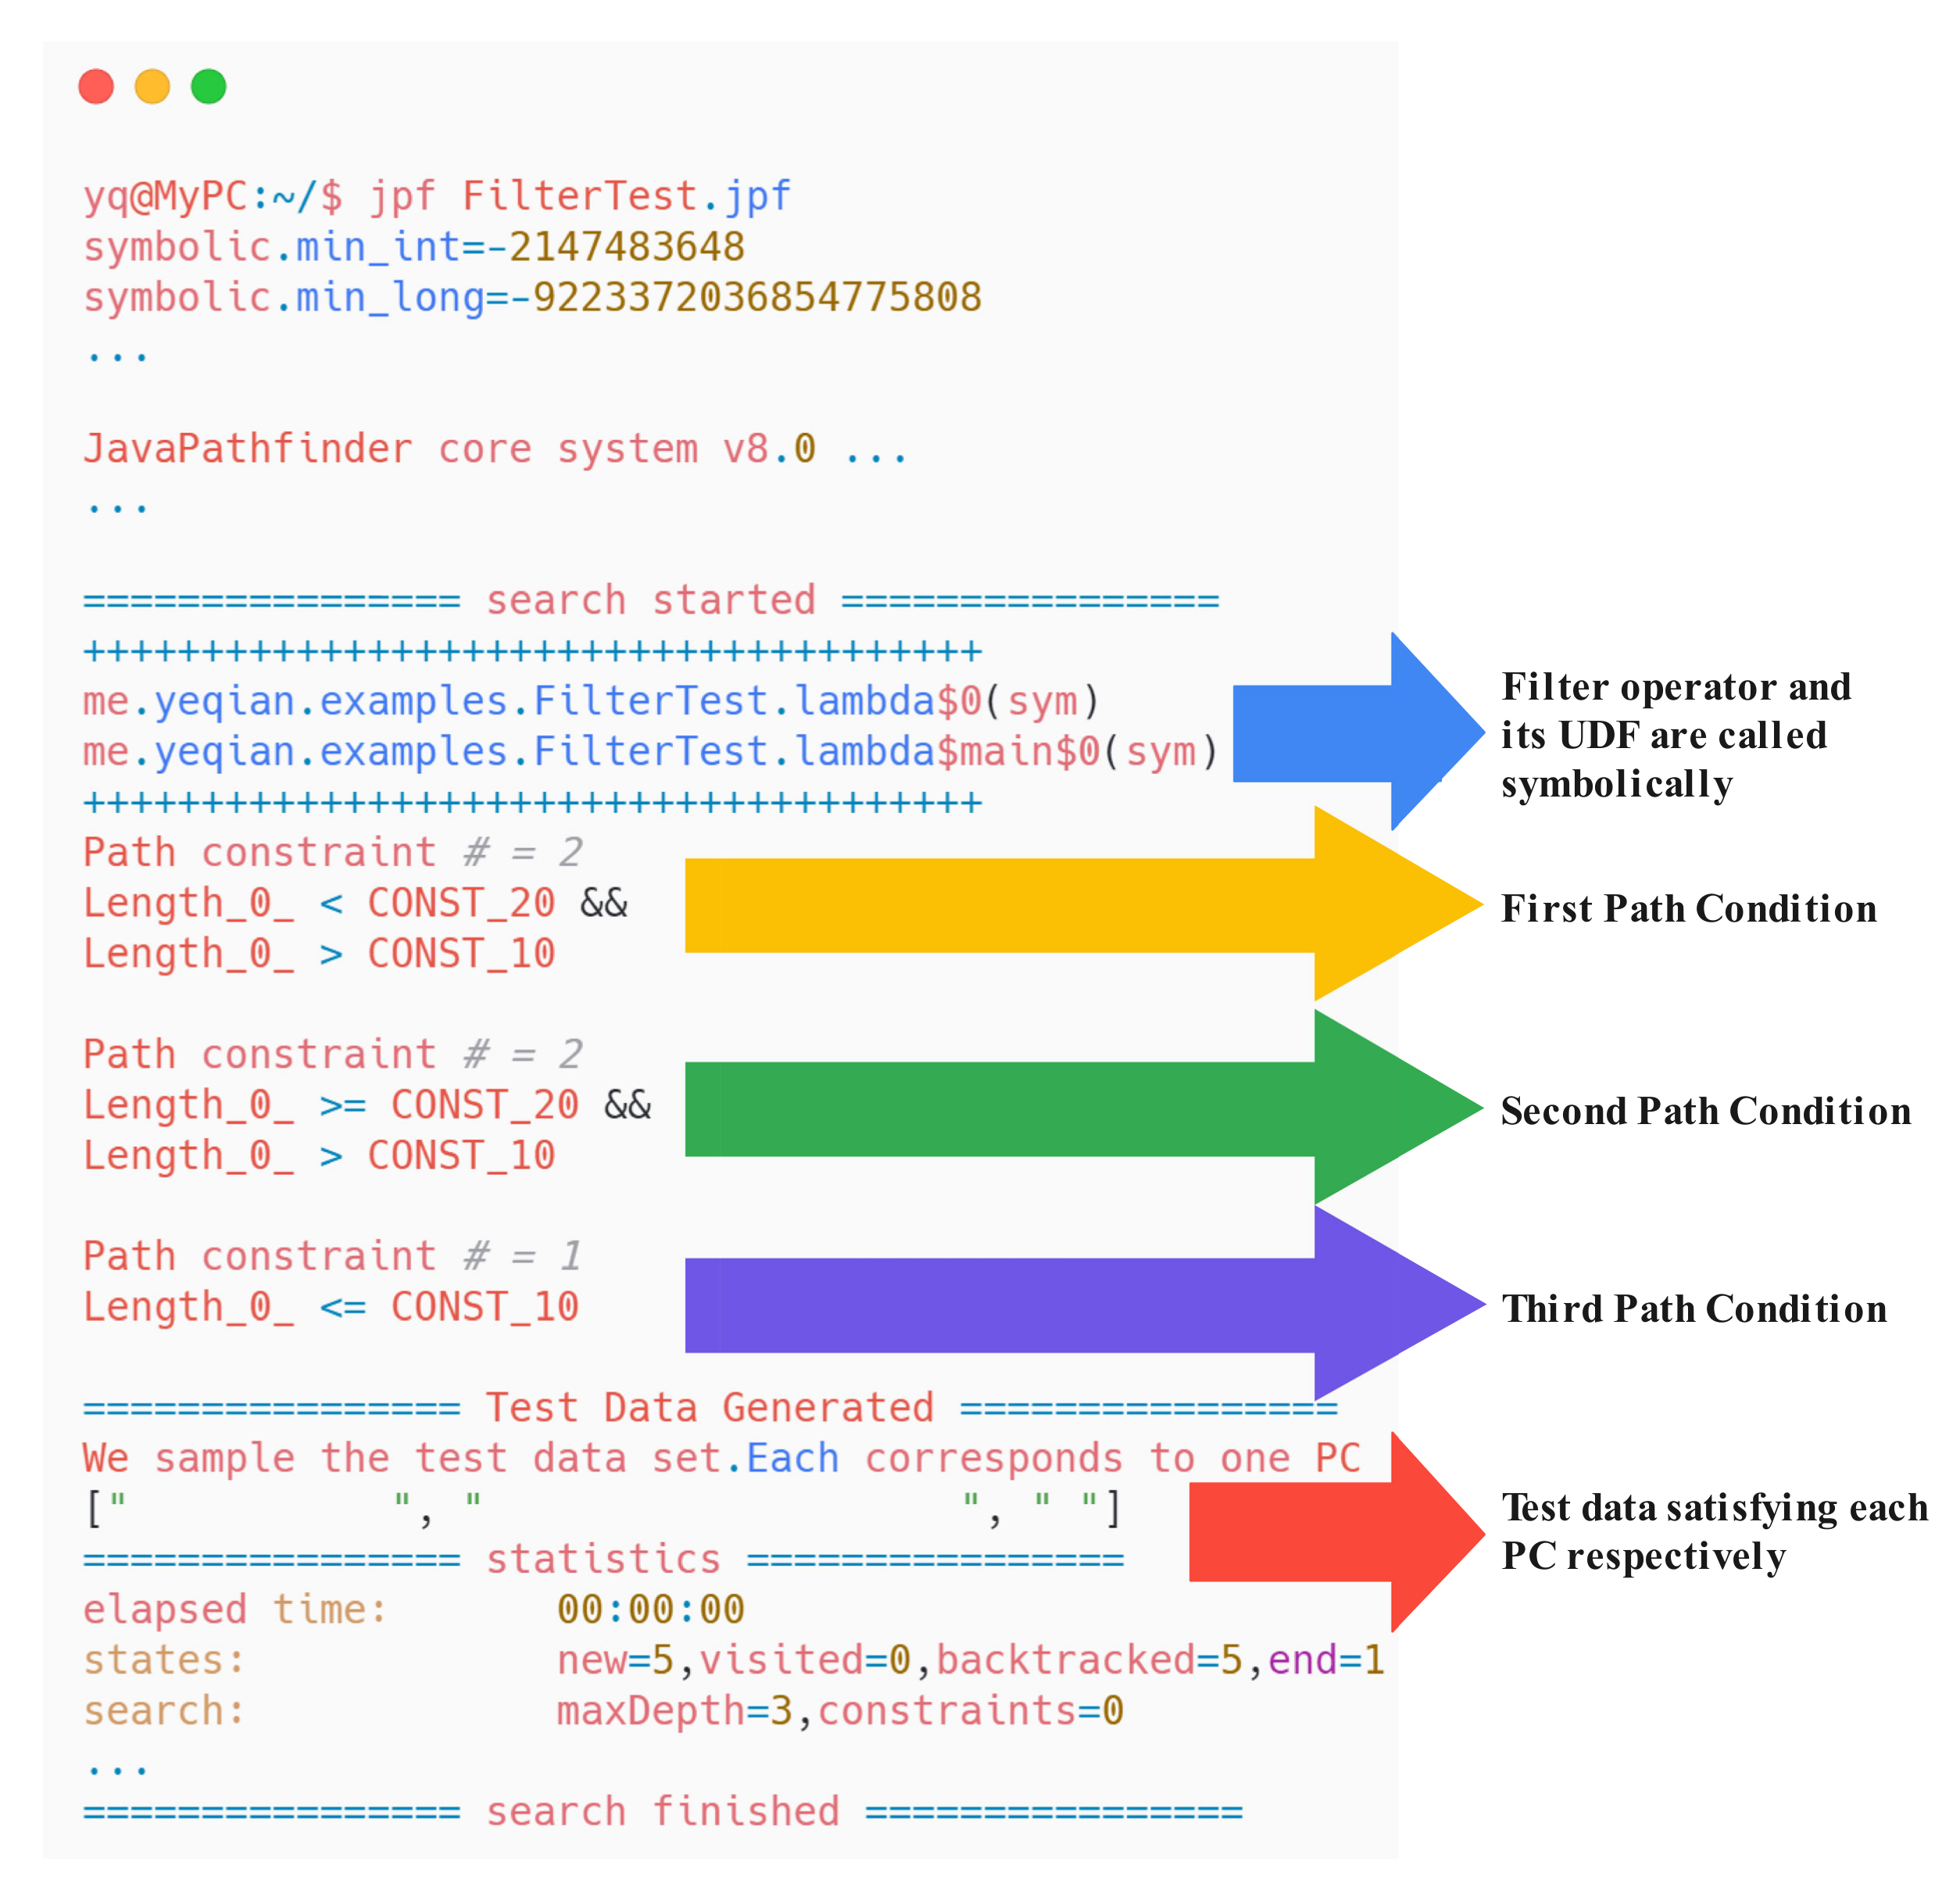
We analyze each of these subject programs with JPF-Flink individually, and obtain the analyzing results, including PCs, sampled test data corresponding to each PC, et cetera. One example is the result for the filter program, i.e., the program (c) in
Figure 7. It is shown in
Figure 8 (some unimportant information has been omitted and marked as the ellipsis). As the result shows, we can get three PCs representing each JDU path. We can also obtain three solid data after solving these PCs. If necessary, more data can be derived by solving PCs continuously. In addition to symbolic execution, we can also adjust SPOT to concolic analysis by setting the parameters in the method from
sym to
conc (e.g., we can build a new clause “…FilterTest.lambda
$0(
conc)” to notify the SPF to conduct concolic analysis).
After analyzing all the subject programs individually with JPF-Flink, we manually check the PCs obtained, and confirm that they have covered all possible JDU paths.
The symbolic analysis is the most source-code involved part among our SPOT solution. The series data synthesizing part, however, is much more general. In other words, it is not strictly relying on the semantics of the source code. For this reason, we will not conduct experiences about how to synthesize stream for each operator here. Instead, the synthesizing methods will be covered in the following case studies.
In summary, SPOT can support the symbolic analysis for the five common operators, and generate representative data as test data. Meanwhile, SPOT can also support concolic analysis for these operators after some tiny modifications.
5.2. How JDU Path Coverage Can Be Achieved
The second case study illustrates how SPOT behaviors in terms of coverage compared with PBT-based approaches, among which DiffStream and FlinkCheck are the most representative solutions for testing DSP programs. We take the HarassMap program as the first subject program that is introduced in [
26]. It involves verifying the incidents about sexual harassment incidents from witnesses or victims and giving out the danger level to further create a map showing harassment hot spots. The incidents are streamed incident object by incident object, with each containing a zone ID (integer value) and a danger value (double value). As for the second subject program, we extend the SpeedRadar from a GitHub project [
45], which detects overspeed incidents.
Intuitively, SPOT will perform better than PBT-based approaches in terms of path coverage, as SPOT integrates symbolic execution, which will go through as many program paths as possible even under resource constraints, and generate representative data corresponding to each path. In this study, we adopt the JDU path coverage as the metric to measure the coverage of DPS programs. For HarassMap and SpeedRadar, we will compare the minimum test data required to reach 100% JDU path coverage when the test data are generated by SPOT and existing PBT-based approaches individually.
DiffStream and FlinkCheck are the only two PBT solutions directly for DSP programs to the best of our knowledge. Generators in both of these two solutions are generating random values as input data. Therefore, we generate test data for HarassMap and SpeedRadar using the Junit-Quickcheck [
24], which works the same as the generation in DiffStream and FlinkCheck. To avoid divergence of generation data in PBT, we constrain the ranges of values specified in [
26,
45]. We execute the process of data generation and coverage analysis seven times, and computed the trimmed mean value by removing the maximum and the minimum number of test data required. The results are shown in
Table 2.
We have observed that SPOT can achieve 100% JDU path coverage with fewer test data than PBT methods ( 2X to 65X less). This gap can be further widened if no data ranges are constrained when randomly generating data, as this means to sample data in a larger data space.
In summary, we have shown that SPOT has a clear benefit in generating test data than the random strategy in PBT solutions.
5.3. How Efficient in Triggering Failure
The main goal of our third case study is to show that test data generated by SPOT is more efficient in triggering program failure compared with FlinkCheck and DiffStream. Program failure is one of the incorrect software behavior that necessarily means the existence of some defects. High-quality test data usually can trigger a failure faster than low-quality test data. This subsection adopts the minimum number of test data required to trigger failures as a metric to measure test data quality.
We reproduced the experimental results of DiffStream and FlinkCheck in our experiment environment. Those two approaches commonly consist of two main ingredients: generators producing random values as test data and properties defining how the correct behavior looks. We replaced the random strategy of generators with our generation approaches in SPOT and reused the same properties.
In particular, we adopted the safety property for the HarassMap program from the Flinkcheck paper, and “output data preserving some order” as the property for the TaxiDistance program from the DiffStream paper. The safety (i.e., something incorrect never happens) property states that given a stream of incidents with danger values greater than 1, then “Safe” results should never be returned. The “output data preserving some order” property defines the orderness of results from a parallel version and a sequential version should match equality for some deterministic DSP programs. In other words, the orderness of TaxiDistance’s results should match regardless of whether it is running sequentially or in parallel.
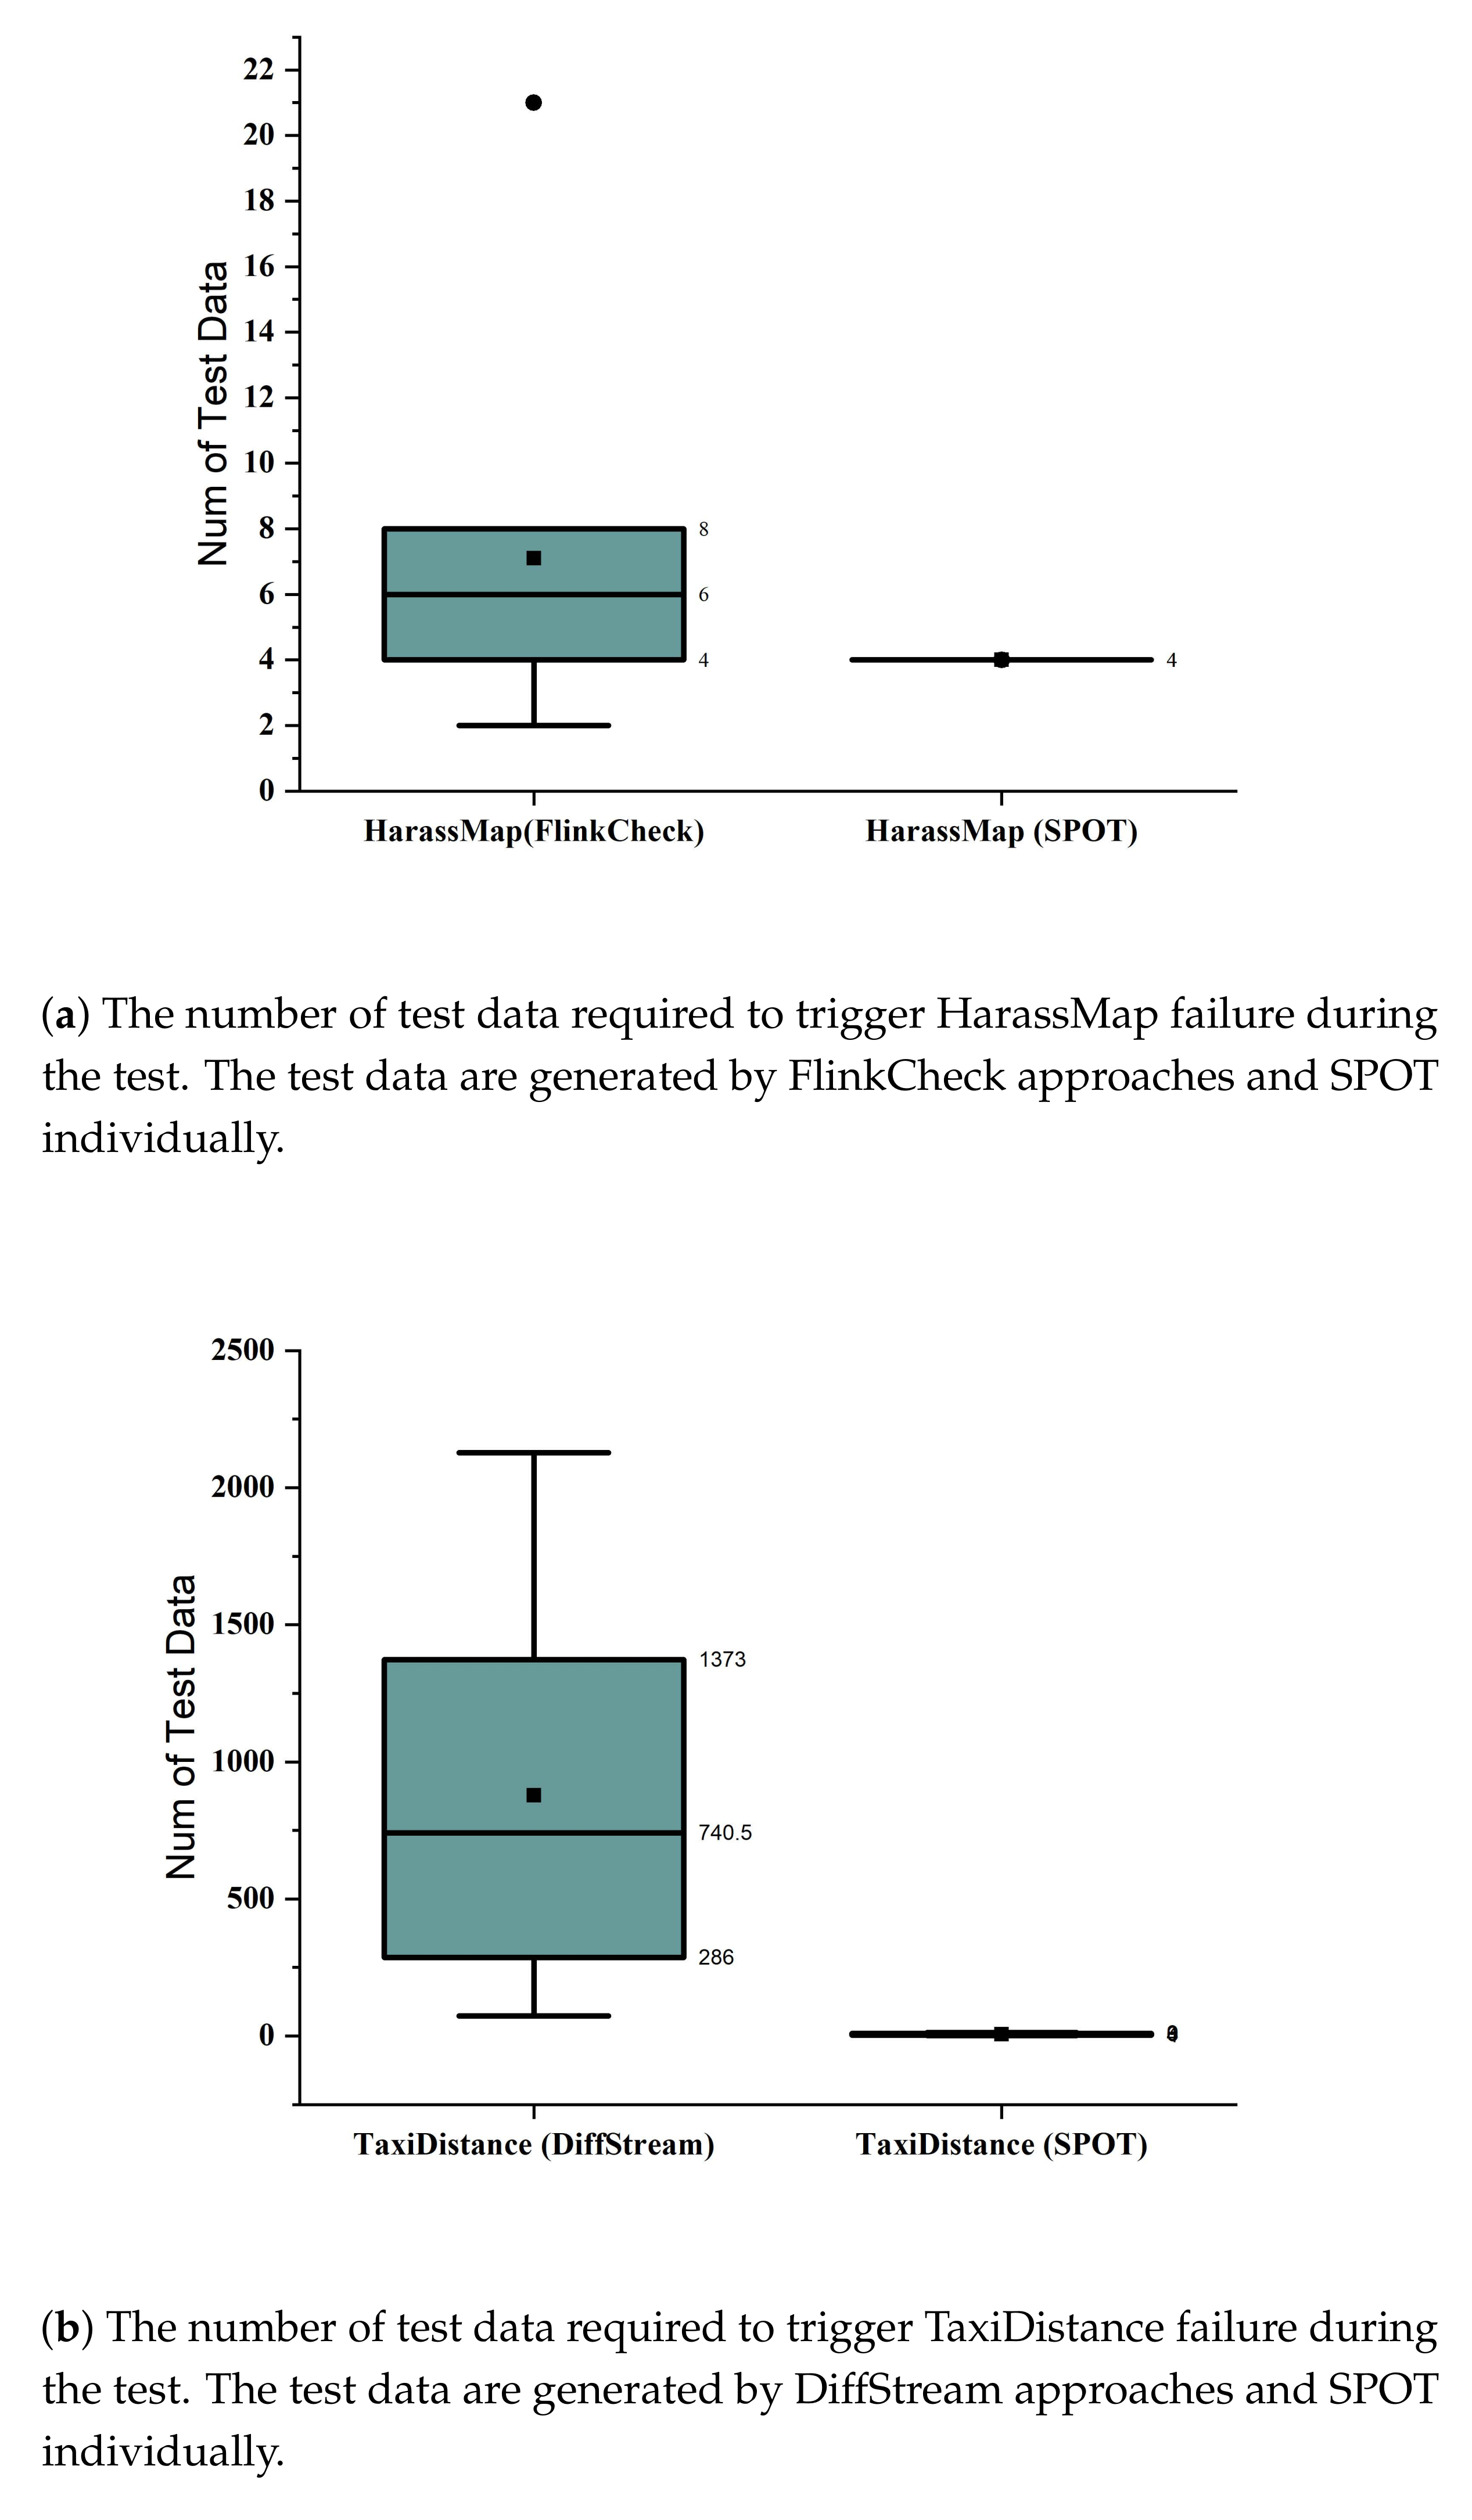
We conducted the experiment ten times and recorded the number of test cases executed before any failure was triggered. For HarassMap on FlinkCheck, we obtained the results shown in
Figure 9a. To avoid the effects of random window sizes, we set the window size to a fixed value (i.e., four in this experiment) during our experiment. We can see from the results that to trigger the first failure, the number of executed test data varies from 2 to 21, and the mean value is 7, which means test data from FlinkCheck can trigger the failure with 7 test data on average. As a comparison, SPOT will always trigger the failure in the first window, which contains four distinct values corresponding to different paths, and the four data are processed following the increasing order of timestamps.
We also conducted an experiment for the TaxiDistance program on DiffStream and ran it ten times as the experience for HarassMap above. Originally, the TaxiDistance program processes the taxi location information, which basically consists of a taxi identifier, the position data, and timestamps. The program can be divided into two operators, i.e.,
project (data transformation) and
keyBy (partition all data by their ID). This program is required to preserve the ordering of events for each ID. Exchanging these two operators makes no difference when this program executes in sequence mode, but it may disrupt the ordering when it runs in parallel. To demonstrate the temporal features, we extended this program by adding a
AssignerWithPunctuatedWatermarks, which assigns event time to each stream data according to the timestamp nested in them, and a 10-second
timeWindow, which splits the stream into groups. Similar to HarassMap, we set the window in a fixed length (i.e., ten in this experiment). Results are shown in
Figure 9b. The number of test data varies from 74 to 2127, and the mean value is 877, which means that test data from DiffStream can trigger a failure with 877 test data on average. As a comparison, the number of test data varies from 2 to 12, and the mean value is 7, which means that SPOT can trigger failure with 7 test data on average.
In summary, we have observed that test data from SPOT can trigger program failure more efficiently, which indicates that SPOT has an advantage in generating high-quality test data.
5.4. How Reordering Situations Can Be Covered
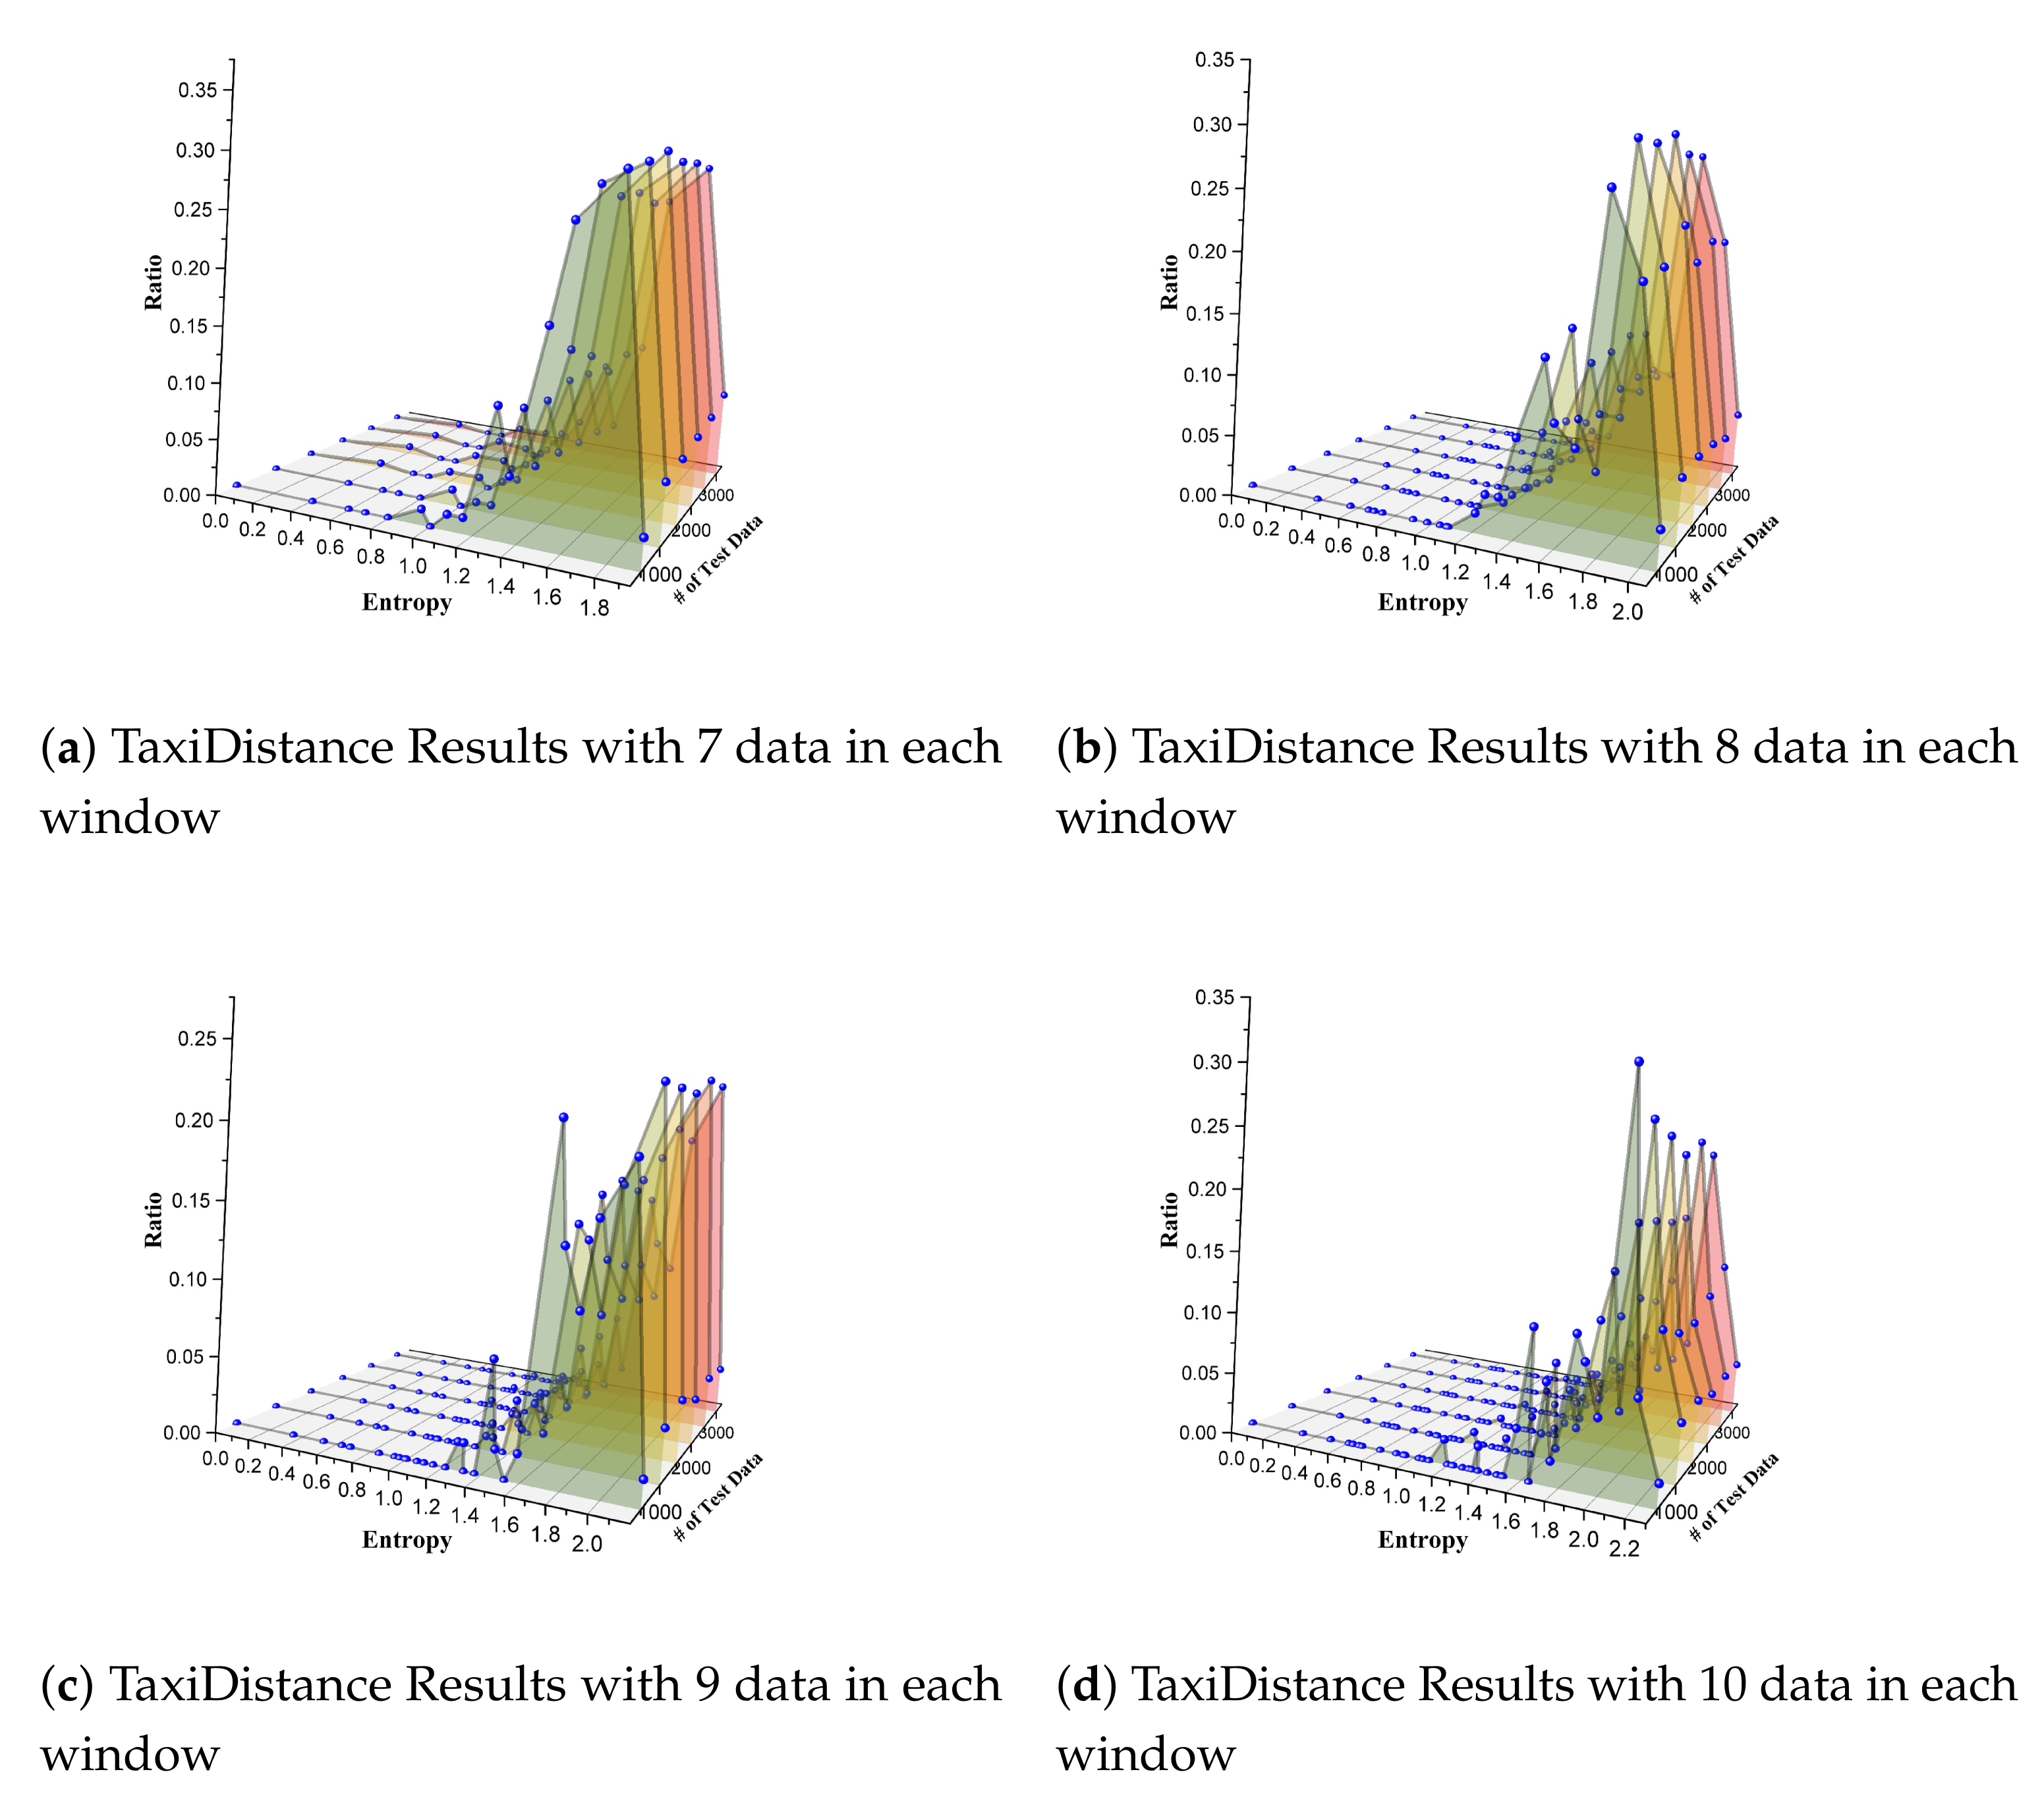
Our fourth case study demonstrates how PBT-based approaches can cover different stream reordering situations. We chose TaxiDistance as the subject program and generated test data with DiffStream.
For TaxiDistance, we adopted its original version (i.e., it consists of
project operator and
keyBy only). Since there was no internal window or other built-in mechanisms to divide streams into groups, we manually split the data series following a count-based method, i.e., every
N (we set
N as 7, 8, 9, and 10 separately in our experience) consecutive data were placed into one group. Then, we got various data fragments that were ordered or were out of order. We calculated entropy for each of these fragments and analyzed the distribution of entropy values. We generated eight sets of test data ranging from 500 to 4000 for each window setting. We calculated the reordering density and entropy for each group. Results are shown in
Figure 10. The
x-axis denotes the entropy value of any fragment of series data in one group. The
y-axis represents each experience that we took with the test data ranging from 500 to 4000. The
z-axis indicates the discrete density of the fraction of entropy, i.e., the percentage of the number of fragments that share the same entropy.
We can conclude from the results that the distribution of entropy was not even in each experience. In particular, the fragments with large entropy (e.g., larger than 1.4 in
Figure 10a) were in an absolute majority. There were few fragments with litter entropy. There were no fragments whose entropy was below some small value (0.4 for
Figure 10a, 1.0 for
Figure 10b, 0.9 for
Figure 10c, and 1.0 for
Figure 10d). These results expose the limitation of data generation approaches in PBT-based solutions in terms of the entropy distribution. This forces us to think about how to explicitly generate a test stream to cover as many reordering scenarios as possible. In our study, SPOT can potentially generate all possible reordering scenarios, and it will give out one stream for each reordering situation. Thus, our method can evenly produce test data.
In summary, although the random strategies in PBT-based methods generate individual data in an even distribution, the reordering entropy values are imbalanced when splitting them into various time-series fragments by grouping a few data nearby. Streams with small entropy values are seldom produced by these random generation methods. This, in turn, forces a requirement for our research to present SPOT to cover as many reordering situations as possible.
6. Related Work
The test is the dominant solution to verify software correctness comparing with other solutions such as formal methods. SUTs are executed with various test suites automatically or manually and detect deviations from expectations during the test process. Many modern test solutions that automatically derive test input for SUTs have been proposed to detect software crashes [
46] or reveal contract violations [
47].
Measuring test efficiency. In general, adding more test data implies improving the bug exposure probability. However, it is time-consuming when considering more test data. In addition, adding too much similar test data will only lead to an inferior test suite. Beyond the number of test data, some metrics exist to estimate the test suit quality, including code coverage, mutating testing, et cetera. In particular, code coverage measures the quantity of code executed after feeding these test data. Coverage is the criterion that is commonly used to guide the test data generating process. Among all coverage criteria, branch coverage is predominant. Another existing method to measure the efficiency of test data is mutation testing [
48] which evaluates the test data set by injecting bugs in SUT deliberately and then checking the adequacy that the tests reveal these bugs. In this paper, we adopt a code coverage metric, i.e., JDU path coverage [
12], to measure the efficiency of SPOT from one aspect. During our case study, we also describe the efficiency of SPOT from two other aspects: (1) the minimum number of test data required on average to trigger failures and (2) the number of reordering situations that can be covered.
Big data testing. Much effort has been made recently to develop test solutions for big data programs. These test methods are to generate test suites to trigger bugs and catch the deviation program behavior under the trade-off between completeness (i.e., full fault detection) [
46] and test cost [
49]. We investigate big data program testing research, including symbolic execution-based test data generation, property-based test data generation, et cetera. We briefly divide these solutions into two categories, i.e., source-code-dependent approaches vs. source-code-independent approaches.
Source-code-dependent approaches to test big data programs. This category refers to the test solutions that should be aware of the semantics of the programs, i.e., they should know the implementation of a program entirely or partially, and then conduct the test based on the knowledge of the source code. These approaches can be white-box or grey-box.
Csallner et al. [
19] presented a method to discover bugs leading to indeterminism in MapReduce programs. It uses symbolic execution methods to systematically explore the program and then generate test cases that will violate correct conditions.
Olston et al. [
50] presented an example data generation approach for dataflow programs. Their solutions focus on the core operations in Pig Latin, including Load, Filter, Group, et cetera. They model each of these operations with equivalence classes to express a dataflow program with these classes. A generic algorithm is then used to generate example data by considering operators one-by-one from the end to the start of the Pig Latin program. Similarly, Pawar [
51] extends the equivalence class concept and uses dynamic symbolic execution to generate the example data. These two approaches both share similar limitations, i.e., they are hard to process operators with UDFs and/or complex conditions.
To overcome these problems, Li et al. [
52] developed SEDGE, which integrates concrete execution and symbolic execution, to produce example data with higher coverage than past techniques. It reimplements the example data generation component of Apache Pig. SEDGE starts with a concrete execution with a small sample of the real input data and then performs a symbolic analysis to construct constraints for the paths that the concrete execution has not covered. At last, they use the Z3 SMT solver [
53] to solve the constraints.
Gulzar et al. present [
13,
20] BigTest to generate synthetic data for Apache Spark. It performs symbolic execution in UDFs, and then combines them on the logical specification of dataflow and relational operators. It explores all paths in Spark applications uniformly without considering the diverse possibility for each path. Symbolic execution in SPOT is initially inspired by BigTest, but has also ventured into its own.
Zhang et al. [
54] propose BigFuzz, a coverage-guided fuzz testing tool for Spark. It constructs an equivalent program fitting for fast test generation after conducting a source-to-source transformation. BigFuzz contains schema-aware data mutation operators guided by real-word error types, increasing the possibility of creating meaningful test data. BigFuzz, as a fuzz method, internally requires instrumentation for monitoring coverage and gear the mutation toward program errors.
However, all of these approaches generate test data independently, while the temporal relations are not widely considered. On the contrary, one of our key insight for SPOT is that various reordering in one stream will lead to different process results, which inspires us to synthesize the independent data into varied temporal relations.
Source-code-independent approaches to test big data program. In contrast with source-code-dependent approaches, these source-code-independent solutions do not require knowledge of source code and conveniently work in a black-box fashion.
Li et al. [
55] proposed a combinatorial test data generation method for ETL (i.e., extract, transform, and load) applications. Their solution works in two steps. First, create input domain models (IDMs) by automatically analyzing the original data source and incorporating the constraints derived from requirements manually. Second, test data are generated with the IDMs and achieve
t-way coverage. They also present adaptive IDMs to extend the original IDMs to avoid creating IDMs repeatedly when new change happens to the original source.
Morán et al. [
56] presented a testing approach that simulates different infrastructure configurations to detect software faults easily masked in a stable test environment but revealed in production. Their solution is based on combinatorial testing, partition testing, and random testing to choose the infrastructure configurations.
Kallas et al. [
25] presented DiffStream by adopting differential testing methods that are widely used in testing traditional software, e.g., compiler testing [
54]. Diffstream figures out the bugs in one DSP program that will be triggered in parallel execution mode. It generates input stream data randomly, feeds these data into this program in parallel and sequential versions, and then concludes the existence of bugs by comparing the equality of results from both versions. They target the problem caused by unordered data among operations, while we focus on the problems coming from the out-of-order input data. They constrain a strict order for dependent events, which may be overstrong, as one DSP program can still perform correctly when some kind of disorder happens (e.g., when late events arrive, retrigger the computation, and restore the previous result).
Espinosa et al. [
26] presented a property-based testing tool called FlinkCheck specifically for Apache Flink. The core idea of FlinkCheck is adopting bounded temporal logic to guide how random streams are generated (i.e., generators in PBT), and define the properties (i.e., formulae in PBT) that determine how outputs are expected to behave.
Nevertheless, the black-box method, especially random fashion, is hard to cover all program processing logic in high efficiency and always requires a tremendous amount of test data. To tackle this, the authors of some recent research studies have proposed coverage-guided generation approaches to enhance the random way. For instance, Goldstein et al. [
57] used coverage information to thin the random generator in property-based testing to provoke software bugs with fewer tests. Even though these approaches are not directly oriented to stream program testing, it inspires us to improve the random generation part to produce more “thinning” distribution of inputs to find bugs with fewer tests.
Measuring reordering. Several existing metrics measure the degree of package out-of-order in the network domain, including reordering density [
30,
31], entropy [
32], et cetera. Torres-Jr et al. [
51] make a survey to compare these metrics and highlight both the mean displacement and entropy metric. According to its equation, the mean displacement for one out-of-order stream may be zero, which is not as intuitive as the entropy metric. We prefer the zero to denote the ordered stream. For this reason, we choose entropy in our research to describe the reordering degree of stream data.
Running test in some order. Generally, tests should be able to conduct independently. However, in some cases, it is required to run tests in some specific order. Test case generation for traditional event-driven software (e.g., GUI-based applications) requires all possible combinations of events (e.g., menu open) and the mechanism to order test cases [
49]. For concurrent software testing, the inputs’ timing is critical [
58,
59]. Many existing test frameworks, e.g., Junit, NUnit, and TestNG, support specify the test order. For instance, TestNG will run the tests according to the order predefined in a configuration file, and it offers several ways to order the tests
7. Conclusions and Future Work
In this paper, we propose SPOT as an efficient and effective test data generation solution for DSP programs. Currently, there are few approaches directly applicable to DSP programs. FlinkCheck and DiffStream are the most recent solutions. They generate test data randomly, which covers stream reordering nonexplicitly. However, they are not efficient in terms of path coverage. The entropy distribution of the randomly generated data is highly skewed, where streams with little entropy are hard to generate. There are some symbolic execution-based approaches for batch processing systems (e.g., Hadoop, Spark). These approaches achieve high coverage efficiently. Test data, however, are independent and not aggregated as time series in different reordering situations. The pros and cons of these two categories of techniques inspire us to develop a novel solution, i.e., SPOT, which can achieve both high path coverage and various reordering situations.
SPOT achieves high coverage by producing representative data with symbolic execution. It then composes these independent data into streams in various reorderings with an iterative algorithm. To support symbolic analysis automatically, we have developed JPF-Flink, which coordinates the Flink program execution processes, and delegates the symbolic execution to SPF. Our case studies demonstrate that SPOT can symbolically analyze five common operators. Operators such as window are not considered in the symbolic analysis phase. Instead, the stream synthesis phase will consider the temporal information contained in these window-type operators. SPOT can generate test data more efficiently regarding JDU path coverage and triggering program failures. In addition, SPOT can generate streams covering all possible reordering situations evenly, while the random-generation-based approaches will usually produce entropy-skewed streams.
However, it should be noted that there are several limitations in this study. First, we rely on manually creating model classes of DSP frameworks, which is both error-prone and time-consuming in development and maintenance, and requires a significant upfront cost when analyzing a program with new DSP frameworks. One potential solution is to synthesize the framework models automatically, similar to PASKET [
37]. Second, SPOT supports only five common operators with the time and develop resource limits. In the future, we can support other operators such as
union in a similar process. Third, we rely on the entropy metric to measure the reordering of one stream. Other reordering metrics exist, and our approach to synthesize one stream may vary when those different metrics are considered. In the future, we will investigate how to integrate other reordering metrics in SPOT. Fourth, there will be
possible reorderings when one stream contains
k data. It is easily beyond the resource limitation when
k gets larger. One of our future work is to adopt heuristic algorithms to improve search efficiency and reduce the duplicated streams with the same entropy. Finally, the subject programs in our case studies are from former papers, or built ourselves basing on the snippets and descriptions from public websites (e.g., GitHub, Flink official website, et cetera). In the future, we will apply SPOT to more real cases from the industry.


