Abstract
Non-destructive testing of objects and structures is a valuable tool, especially in cultural heritage where the preservation of the inspected sample is of vital importance. In this paper, a decorative marquetry sample is inspected with three non-destructive testing (NDT) techniques: air-coupled ultrasound, X-ray micro-tomography, and infrared thermography. Results from the three techniques were compared and discussed. X-ray micro-tomography presented the most detailed results. On the other hand, infrared thermography provided interesting results with the advantage of being cheap and easy in the deployment of the NDT method.
1. Introduction
Non-destructive testing (NDT) techniques help both conservators and restorers to detect incipient defects in cultural heritage objects before that the damage is visible to the naked eye. By applying a clever and integrated approach in which each object is monitored in the course of time, money can be saved and materials from the decorative layer are preserved [1].
Marquetries, i.e., a particular typology of cultural heritage object, have been rarely monitored in the past by scientists. After an in-depth search in the Scopus® database, papers indexed and deserving to be cited should be less than fifteen. For example, infrared thermography (IRT) was used initially by Candorè et al. in [2] to detect delaminations or galleries due to woodworms.
Nakamura and Naruse characterized the ornamental adhesives used in the Shosoin treasures by NDT techniques such as attenuated total reflectance Fourier transform infrared spectroscopy (ATR/FTIR) and X-ray analyses. Second-derivative transformation of the FTIR spectra identified the adhesives on marquetry fragments as animal glue [3].
Samples reproducing marquetries with fabricated defects were inspected in [4] by means of visible imaging, ultraviolet testing, near-infrared reflectography and transmittography, infrared thermography, holographic interferometry, digital image correlation, laser speckle contrast imaging, and ultrasonic testing. Numerical simulations focusing on the optimization of the provided thermal flux anticipated the experimental results. A correlation of the individual informative content produced by each inspection procedure was explained and highlighted.
In [5], holographic interferometry was tested on mock-up (marquetries in such a case) with two different light sources, in an attempt to expand the technique towards an easy-to-operate, inexpensive, and tunable approach, offering a broad spectrum and wavelength selectivity, according to the needs of the experiments. The results demonstrated the effectiveness of the proposed modified experimental scheme for defect mapping.
IRT and optical coherence tomography (OCT) were used in combination to evaluate, more than one year ago, the state of conservation of the same marquetry here analyzed. Step-heating (SH) and pulsed thermography (PT) techniques allowed the implementation of a defect map refined by OCT [6]. In a view of conservation, cultural heritage objects should be inspected by routine tests because the degradation phenomena are faster than those in composite materials. This is a key message that the present research wants to leave with readers. Furthermore, air-coupled ultrasound (air-UT) [7] and X-ray micro-tomography (micro-CT) [8] complement the previous analyses [6] as, to the best of our knowledge, they have never been applied on real marquetries. Finally, two different spectral ranges (instead of one) were here studied, i.e., mid-wave infrared (MWIR) and long-wave infrared (LWIR) [9], therefore processing new thermographic data.
Shrestha et al. applied numerical simulations (with the intent to gently heat the surface), active IRT, X-ray fluorescence (XRF) spectroscopy, and radiography on a marquetry coming from the same parietal structure (or ceiling) of the one here analyzed, by demonstrating that it is possible to provide robust information without damage the precious tessellatum layer [10]. The tessellatum describes the upper layer of a marquetry; it is composed by tesserae that can be of different nature (e.g., ivory and bone) in the so-called intarsia. It is thought that the word intarsia is derived from the Latin word interserere which means “to insert”. This explains why marquetries are formed by different pieces of wood (or other materials) with the aim to produce a figure or, as in our case, a geometric/decorative surface. In the mosaics field—that is different from the marquetries fied, the main type of tessellatum that is usually cited is the opus tessellatum, i.e., a floor made of stone tesserae.
The work of Garrido et al. introduced the latest state-of-the-art deep learning (DL) model for instance segmentation—mask region-convolution neural network (Mask R-CNN)—for the automatic detection and segmentation of the position and area of different surface and subsurface defects in two different artistic objects belonging to the marquetry’s family. Active IRT was used after the application of two automatic thermal image preprocessing algorithms based on thermal fundamentals to improve the contrast between defective and sound areas. It was found that the performance of the Mask R-CNN was improved by the prior application of the proposed preprocessing algorithms [11].
Two ancient marquetries containing natural defects were inspected in [12] via active IRT by using time-tested, safe, and resilient advanced signal processing algorithms applied with the aim to providing a 2D map of defects. Furthermore, dynamic thermal tomography (DTT) was used to understand the volume of the subsurface defects. A special technique for defect thermal characterization was used to validate the tomographic results; both a calibrate thermal stimulus and the use of a thermal camera were fundamental in such a case.
By continuing exploring the volume of marquetries/inlays, truncated correlation photothermal coherence tomography (TC-PCT) was applied in [13] to identify subsurface features that are often invisible areas of vulnerability and damage. The TC-PCT modality proved capable of providing 3D images of specimens with high axial resolution, deep subsurface depth profiling capability, and high signal-to-noise ration (SNR). The experimental results demonstrated the identification of various defects (natural and fabricated) up to a depth range of 2 .
Finally, a thermographic data analysis method was proposed in [14] to overcome the shortcomings of the existing methods. The proposed method imposed both spatial connectivity and sparsity constraints in principal component thermography (PCT). An ancient marquetry sample belonging to the same parietal (or ceiling) that “hosted” the one here inspected was selected to illustrate the feasibility of the method.
Inspected Sample
As said in the first two phrases of this introduction, the diagnostic protocol we are proposing demonstrates how a joint and clever application of NDTs can detect various defects of different sizes in an ancient marquetry having both an unknown origin and an unusual decorative layer. It is important to underline the fact that results from each technique (air-UT, micro-CT, and IRT) show different features. Aesthetically, the marquetry under test (found several years ago in a junk shop in the North of Italy) seems to be Middle Eastern or North African; this, from a visual inspection performed by a professional restorer.
The main sizes on the geometrical plan are 208 × 212 , with thickness between 15 and 16 , where the decorative part composed by tesserae corresponds to something between and 2 . After a visual inspection, presumably the decorative layer was built as in the following. The support of the sample is made of wood and the upper layer is believed to be made by mother of pearl (white tesserae), bovine horn, cow (amber/gray tesserae), horn or tortoise (some brown tesserae), horn of another ungulate (some brown/black tesserae), and boxwood (at the perimeter). Tesserae are of different size and shape; they are not affected by thermocromism (usually caused by a sharp increase of temperature) because they are pigment-free [15]. The adhesive used is likely a protein glue, presumed to be a strong glue. Figure 1 shows a picture of the sample (on the left side, the decorative layer is visible, while on the right side a cross section is reported). The support is realized with axes obtained from a sub radial section (near to the heart of the plant) as shown on the right side of Figure 1.
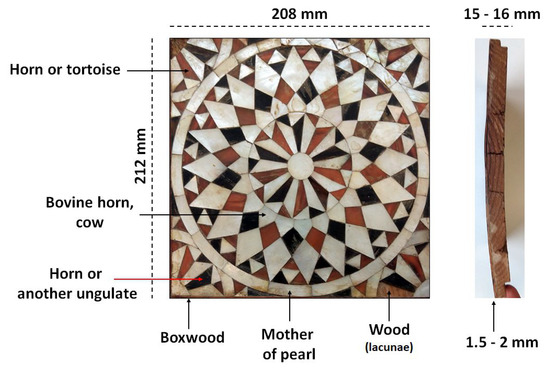
Figure 1.
The marquetry sample: top (on the left) and cross section (on the right).
The decorative surface was deliberately applied on the convex part of the support in relation to the well-known phenomenon of warping.
After a visual inspection, it seems that the tesserae were glued directly on the support. Once bound to the support, the tesserae were flattened (probably by means of a pumice stone). This explains why various thicknesses were obtained.
The decorative surface appears deformed due to the buckling of the wood. The deformation is more evident along one of the two sides. In addition, small lacunae are present on the decorative surface because some tesserae were lost. Other tesserae are deformed and tend to lift. Thanks to the lacunae, traces of glue on the wooden support are evident.
2. Air-Coupled Ultrasound
Experiments with air-coupled ultrasound were carried out in transmission using two focusing acoustic transducers. Their central resonance frequency being 580 . The focusing length of each transducer is 50 . Therefore, the sample is placed between the two transducers with a distance of 50 on each side.
As the surface is slightly curved, the measurements were divided into three sections. Thus, each section can be adjusted perpendicular to the transducers. For image acquisition, 16 ultrasound pulses were shot (and averaged) every 1 in scan (up/down or y-axis) and index (left/right or x-axis) directions. Figure 2 shows the setup for the air-coupled ultrasonic testing (air-UT) used during this study. In Figure 2a, it is possible to see the frontal view and frontal transducer. In Figure 2b, it is possible to see the lateral view and both transducers. Finally, in Figure 2c, the back side is visible as well as the back transducer.
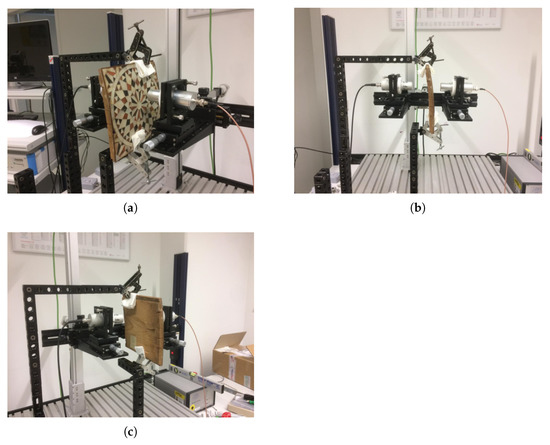
Figure 2.
Air-UT setup. (a) Front view, (b) lateral view, and (c) back view.
3. X-ray Micro-Tomography
X-ray micro-tomography (micro-CT) is a non-destructive technique to image the three-dimensional microstructure of an object using X-ray photons which are attenuated depending on their material composition.
An industrial CT system is basically built of three components as it can be seen in Figure 3: X-ray source, rotating sample holder, and X-ray detector. The widely spread microfocus tube uses an electron beam focused on a target material emitting breaking and characteristic radiation. As more than 99% of the electron energy is deposited in the target material, the target is commonly made of materials with a high melting point such as tungsten and can also be equipped with a cooling system. The emitted photons pass through the object placed on a rotational stage and hit the detector. The contrast mechanism in X-ray micro-CT is based on the attenuation of X-ray radiation, which depends on material composition, object thickness, and X-ray energy. Materials with a high atomic number and density lead to high X-ray attenuation. The remaining X-ray intensity follows the Lambert–Beer’s law:
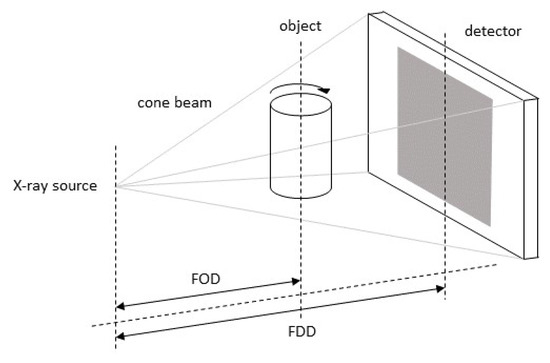
Figure 3.
Acquisition of a radiographic image in cone beam X-ray CT: The emitted X-ray radiation of a point-like source, attenuated by passing through an object, is measured as intensity in a pixelated detector.
For X-ray detection, direct or indirect converting systems are often used. In a direct converting detector, the incoming X-ray generates electron–hole pairs in a semi-conductor material like Si or CdTe. The measured charge in one pixel correlates with the energy of a photon. In an indirect converting detector the photon is initially converted to visible light in a scintillator, which generates an electrical current in a photodiode.
To obtain a radiographic image, the object is magnified geometrically and projected on the detector. Thereby, the magnification is defined as the quotient of focus–detector distance (FDD) to focus–object distance (FOD). The combination of a small electron beam and a thin target leads to a small X-ray focal spot of a few microns or less resulting in low geometrical blurring on the detector and high spatial resolution. To visualize a three-dimensional volume, the object is scanned from projection angles over 360, which are used as input for the volume reconstruction. The reconstruction algorithm is mostly based on filtered back-projection or iterative techniques like the algebraic reconstruction techniques [16,17].
CT inspection was performed at an in-house developed micro-CT system at Fraunhofer IZFP, using a tube voltage of 220 and a tube power of 100 . For the inspection of the sample investigated in this study, 1600 projections over 360 were acquired with an exposure time of 2 per projection and reconstructed afterwards.
4. Active Thermography
In active infrared thermography, an external source is used to disturb the thermal equilibrium in the samples by either heating it up or cooling it down. One of the techniques most used is pulsed thermography (PT) [18,19,20]. In PT, an optical source such as a photographic flash is used to heat up the sample. A short pulse, usually milliseconds, is fired and a camera captures the thermal response in the sample’s surface. In this work, PT was used to inspect, in reflection mode, the marquetry sample. The setup employed had a 2009 Thermosensorik QWIP Dualband 384, an infrared dual-band camera working simultaneously in the mid-wave (MWIR) and long-wave (LWIR) bands (4.4–5.2 and 7.8–8.8 µm, respectively). To heat up the sample, a circular flash device with several lamps ( 3 ) is used, as shown in Figure 4. Only half of the flash’s power was used during experiments to avoid any damage on the surface of the inspected sample. A short flash was fired for a period of 10 µs and the infrared camera recorded approximately 5 of images at a frame rate of 145 fps. It is important to mention that the used power did not damage the marquetry sample.
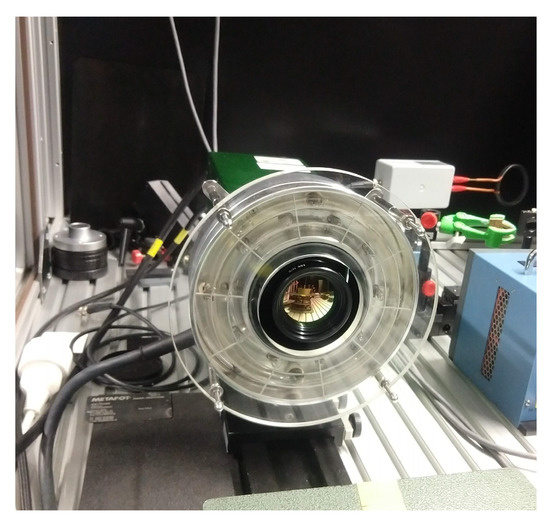
Figure 4.
IR camera and circular flash.
The infrared signal is often very subtle. Thus, an enhancement algorithm must be applied for better visualization of the features of body been inspected. In this paper, principal component thermography (PCT) [21] is used to process the infrared image sets acquired with the PT experiment. PCT involves the application of singular value decomposition to reduce data to a compact statistical representation of the spatial and temporal variations relating the contrasts associated with underlying material defects. In PCT, pixels are transformed into the MxN matrix in which M and N represent the number of pixels and frames, respectively. The transformed matrix is then standardized and reduced by singular value decomposition where the meaningful information in the sequence can be represented in 10 or less empirical orthogonal functions (EOF).
5. Results
Three different NDT techniques were applied to the sample: air-coupled ultrasound (air-UT), X-ray micro-tomography (micro-CT), and infrared thermography (IRT). Ultrasound images appear distorted due to curvature present in the sample. In this section, results are presented and discussed.
5.1. Air-UT Results
As mentioned in Section 2, the scanning area had to be divided in three sections to adjust the UT-transducers perpendicular to the panel surface as the samples has a curvature along its surface. Figure 5a shows an image, where the three sections (I, II, and III) were fused almost into its original shape. Note that Figure 5 resulted by rotating the original image (as scanned in Figure 2) by 90 for better comparison with IRT results. Additionally, Figure 5b depicts the amplitude signals over time of two arbitrary points in section I, representing the bright (high amplitude) and the darker areas. The latter indicates low amplitude and poor signal-to-noise ratio, which is most likely caused by poor US-wave transmission through the thick and, more importantly, anisotropic sample. This assumption is supported by the fact that three dark vertical lines (i) are present in the image. Their location agree perfectly with the wooden texture that is visible in Figure 1, indicating that the strong anisotropic properties strongly affect the US-wave attenuation. There are plenty more lines visible: convex in the left middle section (ii) and concave in the right middle section (iii), both agreeing perfectly with the wooden texture of the panel. Thus, concluding that the wooden texture plays a dominant role for the amplitude contrast.
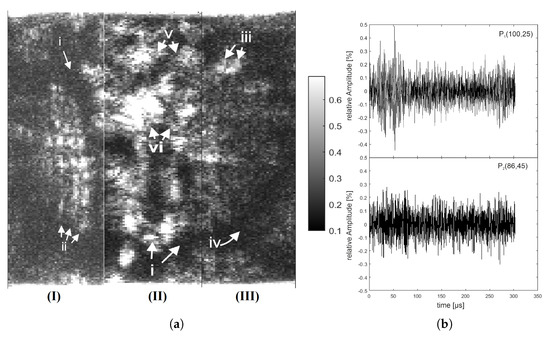
Figure 5.
Air-UT result: (a) amplitude image of the three scanned sections (I, II, and III) and (b) comparison of A-signals of two arbitrary points in section I with high and low signal-to-noise ratio.
However, the multitude of visible bright areas and features allow to identify certain areas on the marquetry sample and to further conclude on existent defects. To start again with areas of poor transmission, the attention is drawn to the dark ring-shaped structure surrounding the middle (iv). This zone can clearly be assigned to the circular pattern of the white pearl material.
Adjacent to the circular dark pattern are several small but bright zones (v), whose location match with the bigger prism-shaped tiles. Therefore, one may notice the repeating pattern of said bright zones, which are most noticeable on the upper and left side of the image. As these ornaments are also composed of the pearl material as the circular dark zone, this is no material contrast and thus indicating possible delaminations.
Continuing further towards the middle part of the image, several darker areas follow in a circular pattern, corresponding to the red, gray, and black horn evident in Figure 1. This also applies for the corners of the sample, where red, gray and black horn is also present. Therefore, a slight material contrast may be the cause. Even though, the interpretation should be handled carefully, as the overall image contrast is extremely low and different effects may be superimposed.
However, Figure 5 reveals some bright areas of high amplitude in the middle and upper middle section (vi). Small ornaments of the different aforementioned materials are located in this area (Figure 1), meaning absence of a material contrast. Nevertheless, different effects may contribute to the high amplitude, i.e., better transmission due to the wooden texture, delaminations, or flaws between neighboring ornaments.
5.2. Micro-CT Results
Micro-CT reveals the 3D microstructure with the greatest number of details. The selected scan parameters lead to a voxel size of in the reconstructed volume. Figure 6 shows some slices of the reconstructed volume and the picture of the marquetry sample in the bottom right corner to compare it with the CT images. The structure of the wooden support and the tessellatum on top of it is seen in the reconstructed XZ- and YZ-plane. The thicknesses of those two materials were measured to around – for the tessellatum and – for the wooden support.
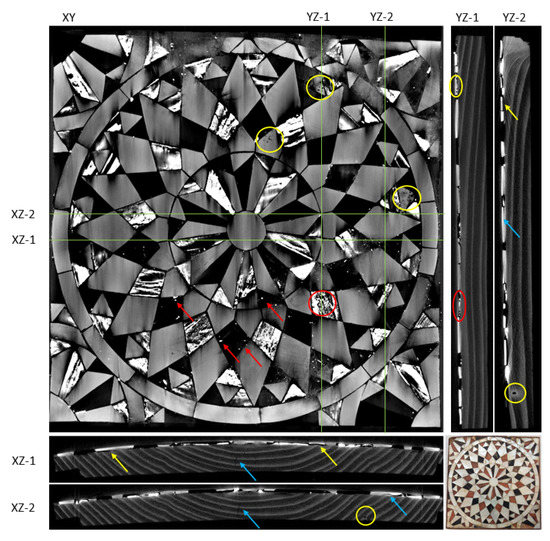
Figure 6.
2D slices of the reconstructed volume showing pores (yellow circle), cracks (blue arrow), delamination (yellow circle), and inclusions (red arrows). Due to the curvature of the sample, the XY-plane is a non-planar cross section through the sample surface and can be compared to the picture of the marquetry in the bottom right hand corner.
The reconstructed slices also depict the growth rings of the wood and reveal some cracks (blue arrows) and pores (yellow circles) in it. In the XZ-plane the curvature of the sample is clearly displayed. Furthermore, XZ-1 and YZ-2 shows several tessellatum parts where they are not completely in contact with the wooden sample (delamination) indicated by the yellow arrows. In addition, it is possible to see a crack in one of the tessellatum part in XZ-2-plane and the corresponding YZ-2-plane (blue arrows).
Because of the curved sample surface and for better visualization the XY section plane is non-planar and curved, showing the surface structure. The uneven surface causes deviations from the displayed XY-plane in some regions, especially in the upper part revealing the wooden layer, so the tessellatum is not visible there. The yellow circles in XY-plane depicts pores in the mother of pearl part, which can also been seen in the YZ-1-plane. All the mother of pearl parts of the picture can be matched to the one shown in the CT-slice by the same gray value. In fact, as the dark/black tesserae of the marquetry are also displayed in black in the CT image, it can be derived, that they are low absorbing materials and therefore likely organic. In some of these parts, small high absorbing inclusions can be resolved (red arrow). The amber/brown parts show all the same microstructure build of low and high absorbing structures indicated by the red circles.
5.3. IR Thermography Results
Infrared images are very attenuated by the effect of heat diffusion. Thus, they were processed for quality enhanced and better visualization of the structure of the sample. Images in both mid- and long-wave spectrum were processed with PCT (MWIR and LWIR, respectively). Figure 7 shows the first second and third EOFs for each spectrum.
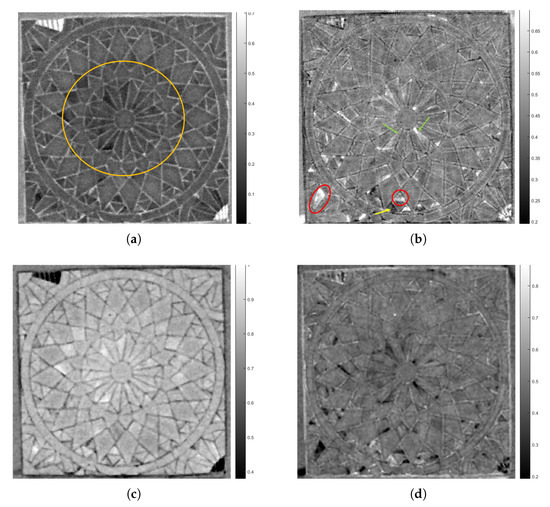
Figure 7.
PCT results obtained from infrared sequences. (a) Second EOF from MWIR, (b) third EOF from MWIR, (c) second EOF from LWIR, and (d) third EOF from LWIR.
In general, for PT, the first EOF is affected by the flash pulse being slightly saturated. Thus, the second and third EOFs are usually used for the purpose of damage detection. Here, the second and third EOFs present several regions with brighter (darker) values that may indicate some differences in the structure of the tessellatum and possible delaminations. Details revealed with mid-wave and long-wave images are the same; the only difference is that they are inverted. Thus, for this sample, either mid-wave infrared or long-wave infrared images could be used.
6. Discussion
Among the three NDT methods applied in this study, it is clear, based on the results and previous works widely available in the literature, that X-ray micro tomography provides clearer and more precise results. As it can be observed in Figure 6, it provides the best sensitivity revealing with detail porous delaminations and cracks both in the tessellatum and wooden parts as discussed in Section 5.2. However, it is also the most expensive test to be performed and it is not easy to apply it outside the laboratory. Thus, it is not always the method of choice for inspection of cultural heritage objects since the object to be inspected is often in its original place and can not be moved.
Cultural heritage inspections usually involves very sensitive material. Because of that, in most cases, ultrasound inspections are not applied due to the need of a coupling agent. On the other hand, air-coupled UT does not require this coupling agent which makes it a perfect candidate for inspection of cultural heritage artifacts. In Section 5.1, some results using this technique were presented. The darker lines shown by arrow in Figure 5a for instance are probably related to the wooden texture present underneath the decorative parts which indicates that the wooden texture plays an important role for the amplitude contrast of Air-UT inspection for this kind of sample. In addition, based on surface materials visible in Figure 1 and bright areas visible in Figure 5a, one can assume that bright areas are likely related to delaminations. However, due to low contrast (Figure 5b) this method is not the best candidate for NDT inspection of marquetry samples.
Finally, infrared thermography combines more interesting results (when compared to Air-UT) with a cheaper setup (when compared to micro-CT). For example, the bright areas that are depicted in Figure 5a are also distinguishable in the IRT results. One example are the ornaments in the orange circle in Figure 7a that coincide with bright areas in the Air-UT results. Additionally, the red circles shown in Figure 7b highlight two different ornaments made with the same material (Figure 1) that present different colors from its similar ornaments (in other places of the sample). This indicates that some defect is present in the regions indicated by the red circles. Another example are the regions indicated by the green arrows (Figure 7b). In the visible image, the ornaments look the same, but in the IRT image, they present different colors, which leads us to conclude that the region pointed by the second green arrow (in the right portion of the image) has a delamination. The yellow arrow in the same IRT result image indicate a crack in the tessellatum which shows that, similarly to the micro-CT results, it is also possible to detect cracks with IRT. In addition, among the three NDT techniques that were applied, IRT is cheaper and very easy to deploy on site, which makes it the more attractive technique. Table 1 summarizes the main differences found among the three different NDT methods used in this study.

Table 1.
Main differences among tested NDT methods.
7. Conclusions
Nowadays, the combination of different NDT techniques is very desirable for the inspection of artistic objects as each technique can provide different and useful information. In this paper, three NDT techniques were studied and applied to inspect a decorative marquetry sample: air-coupled ultrasound (air-UT), X-ray micro-tomography (micro-CT), and infrared thermography (IRT). Results from each technique show different features. Air-UT displays some bright regions that may indicate delamination areas. Micro-CT provided the most detailed images. In the reconstructed slices, it was possible to identify the thickness of the tessellatum parts as well as identify cracks, porous regions, and delamination throughout the sample. Infrared images processed with PCT revealed several parts with different false colors considering theirs neighbors. This may indicate that tessellatum parts are in different state of conservation. Two different wavelengths were examined in the IRT inspections: MWIR and LWIR. Results of both wavelength inspection are comparable, which indicates that, for this type of material/sample, either of wavelengths may be used for IRT inspection.
Even though micro-CT provided the best results, IRT and air-UT may be applied for determining the state of conservation of marquetry samples as they provided some interesting results when compared to the expensive micro-CT which are of interest for the restorer. The use of IRT is especially interesting since it may take advantage of portable camera and heat source (differently from Air-UT and micro-CT) for a field inspection when the sample may not be moved to the laboratory.
Author Contributions
IRT inspection, data analysis, original draft preparation, H.F.; air-UT analysis, data acquisition supervision, review and editing, J.S.; air-UT inspection J.D.; Supervision, review and editing, U.R.; micro-CT analysis, data acquisition, J.F.; conceptualization, investigation, data acquisition, review and editing, S.S.; restorer analysis, G.G.; Supervision, review and editing, H.-G.H. All authors have read and agreed to the published version of the manuscript.
Funding
This research was funded by Coordenacao de Aperfeicoamento de Pessoal de Nivel Superior—Brazil (CAPES) finance Code 001 and the Alexander von Humboldt Stiftung—Germany.
Institutional Review Board Statement
Not applicable.
Informed Consent Statement
Not applicable.
Data Availability Statement
All data generated or appeared in this study are available upon request by contact with the corresponding author.
Conflicts of Interest
The authors declare no conflict of interest.
References
- Sinigaglia, F.; Pizzato, G. Best Practices to Save Our Cultural Heritage. Available online: https://madineurope.eu/en/best-practices-to-save-our-cultural-heritage/ (accessed on 23 March 2021).
- Candorè, J.; Bodnar, J.; Detalle, V.; Grossel, P. Non-destructive testing of works of art by stimulated infrared thermography. Eur. Phys. J. Appl. Phys. 2012, 57, 21002. [Google Scholar] [CrossRef] [Green Version]
- Nakamura, R.; Naruse, M. Scientific analysis of Japanese ornamental adhesives found in Shosoin treasures stored since the mid-eighth century. J. Cult. Herit. 2016, 18, 355–361. [Google Scholar] [CrossRef]
- Sfarra, S.; Theodorakeas, P.; Černecký, J.; Pivarčiová, E.; Perilli, S.; Koui, M. Inspecting Marquetries at Different Wavelengths: The Preliminary Numerical Approach as Aid for a Wide-Range of Non-destructive Tests. J. Nondestruct. Eval. 2016, 36, 6. [Google Scholar] [CrossRef]
- Kosma, K.; Andrianakis, M.; Hatzigiannakis, K.; Tornari, V. Digital holographic interferometry for cultural heritage structural diagnostics: A coherent and a low-coherence optical set-up for the study of a marquetry sample. Strain 2018, 54, e12263. [Google Scholar] [CrossRef]
- Madruga, F.J.; Sfarra, S.; Real, E.; Gargiulo, G.; Conde, O.M.; López-Higuera, J.M. Complementary Use of Active Infrared Thermography and Optical Coherent Tomography in Non-destructive Testing Inspection of Ancient Marquetries. J. Nondestruct. Eval. 2020, 39, 39. [Google Scholar] [CrossRef]
- Maev, R.G.; Green, R.E., Jr.; Siddiolo, A.M. Review of Advanced Acoustical Imaging Techniques for Nondestructive Evaluation of Art Objects. Res. Nondestruct. Eval. 2006, 17, 191–204. [Google Scholar] [CrossRef]
- Morigi, M.P.; Casali, F.; Bettuzzi, M.; Brancaccio, R.; D’Errico, V. Application of X-ray Computed Tomography to Cultural Heritage diagnostics. Appl. Phys. A 2010, 100, 653–661. [Google Scholar] [CrossRef]
- Mercuri, F.; Cicero, C.; Orazi, N.; Paoloni, S.; Marinelli, M.; Zammit, U. Infrared Thermography Applied to the Study of Cultural Heritage. Int. J. Thermophys. 2015, 36, 1189–1194. [Google Scholar] [CrossRef]
- Shrestha, R.; Sfarra, S.; Ridolfi, S.; Gargiulo, G.; Kim, W. A numerical–thermal–thermographic NDT evaluation of an ancient marquetry integrated with X-ray and XRF surveys. J. Therm. Anal. Calorim. 2021. [Google Scholar] [CrossRef]
- Garrido, I.; Erazo-Aux, J.; Lagüela, S.; Sfarra, S.; Ibarra-Castanedo, C.; Pivarčiová, E.; Gargiulo, G.; Maldague, X.; Arias, P. Introduction of Deep Learning in Thermographic Monitoring of Cultural Heritage and Improvement by Automatic Thermogram Pre-Processing Algorithms. Sensors 2021, 21, 750. [Google Scholar] [CrossRef] [PubMed]
- Chulkov, A.O.; Sfarra, S.; Saeed, N.; Peeters, J.; Ibarra-Castanedo, C.; Gargiulo, G.; Steenackers, G.; Maldague, X.P.V.; Omar, M.A.; Vavilov, V. Evaluating quality of marquetries by applying active IR thermography and advanced signal processing. J. Therm. Anal. Calorim. 2021, 143, 3835–3848. [Google Scholar] [CrossRef]
- Tavakolian, P.; Shokouhi, E.B.; Sfarra, S.; Gargiulo, G.; Mandelis, A. Non-destructive imaging of ancient marquetries using active thermography and photothermal coherence tomography. J. Cult. Herit. 2020, 46, 159–164. [Google Scholar] [CrossRef]
- Wen, C.M.; Sfarra, S.; Gargiulo, G.; Yao, Y. Thermographic Data Analysis for Defect Detection by Imposing Spatial Connectivity and Sparsity Constraints in Principal Component Thermography. IEEE Trans. Ind. Inform. 2021, 17, 3901–3909. [Google Scholar] [CrossRef]
- Laureti, S.; Sfarra, S.; Malekmohammadi, H.; Burrascano, P.; Hutchins, D.; Senni, L.; Silipigni, G.; Maldague, X.; Ricci, M. The use of pulse-compression thermography for detecting defects in paintings. NDT E Int. 2018, 98, 147–154. [Google Scholar] [CrossRef] [Green Version]
- Fuchs, T.O.J.; Hanke, R. 3D X-ray Tomography—Basics and Latest Developments. In Handbook of Advanced Non-Destructive Evaluation; Ida, N., Meyendorf, N., Eds.; Springer International Publishing: Cham, Switzerland, 2018; pp. 1–14. [Google Scholar] [CrossRef]
- Stock, S.R. Microcomputed Tomography: Methodology and Applications; CRC Press: Boca Raton, FL, USA, 2019. [Google Scholar]
- Maldague, X. Techniques of infrared thermography: Part 2 Pulse Thermography. In Nondestructive Handbook, Infrared and Thermal Testing, 3rd ed.; Maldague, X., Moore, P.O., Eds.; The American Society for Nondestructive Testing—ASNT Press: Columbus, OH, USA, 2001; Volume 3, pp. 307–357. [Google Scholar]
- Summa, J.; Becker, M.; Grossmann, F.; Pohl, M.; Stommel, M.; Herrmann, H.G. Fracture analysis of a metal to CFRP hybrid with thermoplastic interlayers for interfacial stress relaxation using in situ thermography. Compos. Struct. 2018, 193, 19–28. [Google Scholar] [CrossRef]
- Zhang, H.; Sfarra, S.; Sarasini, F.; Santulli, C.; Fernandes, H.; Avdelidis, N.P.; Ibarra-Castanedo, C.; Maldague, X.P.V. Thermographic Non-Destructive Evaluation for Natural Fiber-Reinforced Composite Laminates. Appl. Sci. 2018, 8, 240. [Google Scholar] [CrossRef] [Green Version]
- Rajic, N. Principal component thermography for flaw contrast enhancement and flaw depth characterisation in composite structures. Compos. Struct. 2002, 58, 521–528. [Google Scholar] [CrossRef]
Publisher’s Note: MDPI stays neutral with regard to jurisdictional claims in published maps and institutional affiliations. |
© 2021 by the authors. Licensee MDPI, Basel, Switzerland. This article is an open access article distributed under the terms and conditions of the Creative Commons Attribution (CC BY) license (https://creativecommons.org/licenses/by/4.0/).