Abstract
The friction and imbalance of components in rotating machines are some of the most recurrent failures that significantly increase vibration levels, thus affecting the reliability of the devices, the shelf life of its elements, and the quality of the product. There are many publications related to the different techniques for the diagnosis of friction and imbalance. In this paper, an alternative and new phase-shift empirical mode decomposition integration (PSEMDI) method is proposed to transform the acceleration into its velocity and displacement in order to construct the phase plane and recurrence plot (RP) and analyze the friction. The focus of PSEMDI and RP is to analyze nonlinear failures in mechanical systems. In machinery fault diagnosis, the main reason for using RP is to solve the integration of acceleration, and this can be achieved by phase-shifting the intrinsic mode function () with the empirical mode decomposition (EMD). Although the highest contain some frequencies, most of them have very few; thus, by applying the phase shift identity, the integration can be carried out maintaining the nonlinearities. The proposed method is compared with Simpson’s integration and detrending with the EMD method (here referred to as SDEMDI). The experimental RP results show that the proposed method gives significantly more information about the velocity and displacement spectra and it is more stable and proportional than the SDEMDI method. The results of the proposed integration method are compared with vibration measurements obtained with an interferometer.
1. Introduction
There is much research related to fault diagnosis in machinery and most studies are based on the linear dynamics of physics. Unfortunately, in the real world, nonlinear phenomena are present in all type of machinery. The standard equipment used in the industry to diagnose fault in machinery does not have the capacity to deal with nonlinearities. If the diagnosis could include linear and nonlinear phenomena, a better understanding and failure prediction could be obtained to manage and control faults in machinery.
The industry has implemented various maintenance strategies throughout history, and conditioning monitoring (CM) has been the most successful. CM is based on monitoring vibrations to control machinery conditions and then implementing corrective actions by applying a scheduled maintenance program [,]. Thanks to CM, it has been possible to increase the reliability of machinery, reduce maintenance costs, improve the predict remaining life, and protect the environment. RP could be an interesting methodology option to analyze recurrences from experimental data in time series and to identify nonlinear behavior in nonstationary systems [,,,,]. Identifying a nonlinear phenomenon in a rotating operating machine is not an easy task because of the complexity of the techniques typically used in CM that are based on theoretical and simplified assumptions; therefore, a better characterization of the nonlinear behavior can significantly improve failure diagnosis.
In this work, the recurrence plot (RP) is applied to diagnose an unbalanced rotor subjected to a friction load. The rotor mass is located symmetrically on a flexible shaft supported by two bearings at its ends. A dry friction load is applied on the outer diameter of the disk. It is important to emphasize that the friction component is an essential element of analysis. This paper aims to address the suitability of RP to diagnose some classical mechanical faults of the nonlinear friction phenomenon and to propose a new alternative method to integrate the acceleration that keeps the nonlinearities of the vibration signal.
The imbalance in a rotor is due to the eccentricity between its rotation axis and the center of mass. Imbalance increases vibrations that then generate radial and axial forces, which affect the bending of the shafts and intensify the loads on bearings and couplings. Imbalance also has a negative influence on shaft deflection; therefore, imbalance increases wear and energy consumption of rotatory machine components. All rotating mechanical components present a certain degree of imbalance due to the manufacturing processes, especially when they are obtained from a machining process. About 99% of industrial equipment works under some degree of misalignment. When the vibration levels are not timely detected and controlled, they cause equipment failures [,].
Many studies have focused on imbalance characterization and applied order analysis to obtain the amplitude and phase of the vibration in order to determine the type of fault and its location []. To correct the imbalance, some authors [] have proposed intelligent algorithms based on the spectral analysis in both the time and frequency domains using fast Fourier transforms (FFT). One method to diagnose imbalance faults was proposed by Sendhilkumar et al. [] using Elman neural networks in conjunction with the analysis in the frequency domain, where the neural network was trained by varying the amplitude of the acceleration to characterize failure conditions. Some researchers have implemented adaptive controls applied to active bearings to compensate the forces due to rotor imbalance []. There are even methods [] specialized in diagnosing and correcting imbalance online, which are based on a spectral analysis in the time and frequency domain. Bartkowiak [] proposed the development of controls for imbalance due to system synchronization that is based on spectral and phase analyses combined with speed control. The instantaneous estimation of the velocity and the phase angle complemented with FFT is still a current topic for researchers such as Hongrui et al. [] who carried out the diagnosis and correction of the imbalance by transforming the effects of the fluctuations of the angular velocity into the angular domain. Recently, non-contact techniques have been used for the diagnosis of imbalance, obtaining the location of the unbalanced mass in 3D through a stereo video system, synchronized with high-speed cameras []. Other authors [] have applied speed gradient integral-differential algorithms to control phase variation between two rotors in the time series as an alternative to solve the synchronization problems caused by the imbalance that was diagnosed in the field. More recent studies consider the effect that overheating generated by extreme operating conditions has on the imbalance and apply structural, thermal, and spectral analyses, as well as Campbell diagrams [].
In recent years, many groups have studied the effect of friction on rotating components. Some authors studied the dynamic behavior of a rotor subjected to the friction generated by the contact between the rotor and the stator. They analyzed the trajectories in the subspaces using Poincaré’s theory [] and showed that the points of contact between surfaces strongly influence the behavior. Other studies focused on improving the prediction of the remaining life in bearings by characterizing the nonlinear responses of lubrication []. Hua et al. [] conducted some research on the nonlinear friction effect on rotor systems and they analyzed the structural design of the rotor with Stribeck curves to diagnose vibration faults. An overhung rotor with two degrees of freedom was proposed to determine friction during contact between the rotor and the stator []. Some recent work studied the effect of a bolted disk joint on the motion stability of the rotor bearing system and the friction coefficient on rotor dynamics using the fourth-order Runge–Kutta method []. These authors have complemented their work with other typical methodologies as bifurcation diagrams, waterfall plots, times series, orbit trails, phase plane portraits, and Poincaré maps to characterize the nonlinear friction effects. Further, the rotor–stator interaction phenomenon was investigated by finite element and Lagrange multiplier-based contact mechanics []. An elastic support/dry friction damper and a two-dimensional friction model-ball/plate model were used for active vibration control by Liao et al. []. Moirot and Nguyen [] proposed some study examples for friction vibration and instabilities. Essential contributions on aircraft brake systems were made by including friction-induced vibration [,]. Charroyer et al. [] analyzed systems with planar and rectilinear friction by studying the mode coupling instability and proposed a new shooting method to calculate the self-sustained vibrations of non-smooth contact dynamical systems for systems with planar friction []. Furthermore, friction and damping models, including the friction plane, were proposed by Mercier et al. [] to obtain physical amplitudes in the nonlinear analysis of friction-induced vibrations of a rotor–stator. Additionally, Kornaev et al. [] applied deep learning to reduce energy losses due to vibration and friction in rotor bearing, to control the clearance in the bearings, the hydrodynamic force, and the trajectory of the rotor. The nonlinear behavior of friction in a negative stiffness oscillator of a structure was controlled by minimizing the errors between the experimental measurements and the model predictions, using the harmonic balance method and forcing amplitudes [].
Converting acceleration to speed and displacement is still a topic of study. The two most common strategies to perform acceleration integration are in the time domain and in the frequency domain through the Fourier transform. Both methods generate significant errors that depend on the sampling resolution and the digital treatment of the signal, especially when there are many complex vibration sources []. Han [] proposed a curve fitting at the dominant frequency to deal with errors at low frequency originated by the DC components in the sampling process in order to obtain the displacement signal by double integration in the frequency domain. Zhu et al. [] presented an integration method of the vibration signal based on extracting information with a waveform correction using an ensemble empirical mode decomposition to solve the nonlinear and nonstationary signals, combining the indexes into a feature vector and extracting the connotative components from the vibration signal by the Euclidean distance search. Other authors proposed a baseline method to correct integration trends when the initial velocity and displacement conditions are unknown in order to improve the method of traditional polynomial detrending in the time series []. The Alpha-Modification of Cubic B-Spline Direct Time Integration Method was presented by Rostami et al. [] to solve the differential equation of motion for single and multiple degree-of-freedom systems with an algorithm for dynamic structural problems. A recursive Simpson’s 3/8 integration method combined with the Newton–Leibniz formula algorithm and detrending by polynomial fitting for vibration testing was implemented []. The double integration of acceleration has many applications, including determining the displacement of high-rise buildings [] and, more recently, it has been used by the Internet of Things with the times series and the Kalman filters []. The empirical mode decomposition (EMD) is a technique used to decompose empirically the signal into its intrinsic functions with its instantaneous frequencies and amplitudes. EMD was applied for the first time in spectral analysis to study nonlinear phenomena in nonstationary regimes of complex variables []. EMD has been gaining popularity in recent years as a solution to eliminate trends in acceleration integration [] and to separate deterministic and stochastic components of a dynamic system [].
Research shows a trend toward combining various methodologies when studying complex physical phenomena as in the case of Guariglia [,,], who characterized the physical behavior of a fractal antenna by considering the entropy in the system.
2. Methods
2.1. Phase Plane
The phase plane gives the position and momentum of a particle in a reference system, and its construction represents the transformation of the particle trajectory into a two-dimensional energy field []. The phase plane can be defined mechanically using the Hamilton’s principle:
where p, q, and are the linear momentum, the position, and the potential energy of the particle, respectively. The system equilibrium is given when: and . Then, for a function , the evolution of the phase plane as a function of time is:
The dynamic stability of the system according to Liouville’s theorem is obtained when:
Equation (3) means that the volume of the phase plane is preserved in time. Assuming that the linear momentum is only function of the velocity, and that the mass is constant, the phase plane describes the relation between velocity and position of the particle, as presented in Figure 1.
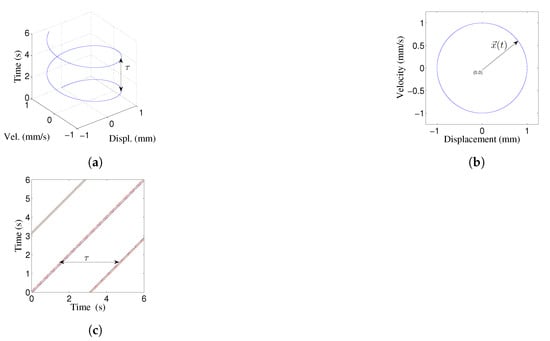
Figure 1.
(a) Evolution of state variables; (b) phase plane; (c) recurrence plot () for the
harmonic function: .
Figure 1a represents the phase plane evolution of a particle with harmonic motion, where the displacement is and the velocity is ; the pitch of the spiral is the period of the function. Figure 1b is the typical phase plot of a dynamic system; in this case, the perfect circle represents the same sinusoidal function as Figure 1a, in a two-dimensional space. Figure 1c is the RP of the same function. One of its main characteristics is that the period given by the spiral pitch in Figure 1a is obtained from the separation of the diagonal lines of Figure 1c. Ultimately, Figure 1 can be used to describe an unbalanced disk without friction.
2.2. Recurrence Plot
The RP allows to visualize the dynamics of phase space trajectories owing to the preservation of equilibrium between the velocity and position of a particle according to the Hamilton’s principle. The trajectory along the phase plane can be represented as a discrete vector shown in Figure 1b:
Then, the recurrence plot is defined [] as:
where is a predefined cut-off distance, is the norm and is the Heaviside function.
The cross recurrence plot is similarly defined as:
where and are the first and second trajectory to be analyzed. The RP for the harmonic function is illustrated in Figure 1c, and it was computed with an .
The recurrence quantification analysis (RQA) is used to quantify the structures in the RP [,,]: recurrence rate is the ratio of all recurrent states; determinism is the ratio of recurrence points forming diagonal structures for all recurrence points; Shannon entropy of diagonal length is a measurement of the disorder in the phase plane; laminarity is the percentage of recurrence points that create a vertical line; averaged diagonal length is the average time in which two segments of the trajectory are close to each other; length of longest diagonal line is the longest diagonal line found in the RP; trapping time is the average length of the vertical lines; and is the maximal length of the longest vertical lines.
2.3. Empirical Mode Decomposition
EMD is a method to analyze nonlinear and nonstationary systems. The essence of this technique is the decomposition of complex time series data in the time domain into a finite number of intrinsic modal functions (). This decomposition methodology is adaptive and very efficient. The decomposition is based on the extraction of the energy from the spectrum associated with the different intrinsic time scales, which are the most important parameters of the system []. The method consists in identifying all the local maxima and minima of the time series, constructing an envelope with cubic splines for each series of maxima and minima based on an interpolation. Then, a third envelope is calculated as the mean for each time point of the maximum and minimum envelopes. The difference between the mean and the data yields the . This procedure is repeated until the following conditions are obtained: (a) the mean value between the maximum and minimum envelops trends to zero, and (b) the number of extremes and zero crossings do not differ by more than one.
The result of this process generates a finite number of IMFs and a residual function as shown in the following Equation (7):
where represents all possible , N is the number of generated, and is a residue of the decomposition.
2.4. Description of the Newly Proposed PSEMDI Method
The decompose the original signal into a set of different simple nonperiodic or periodic time series. Despite these differences, it is interesting to note that each has one dominant frequency, which is the basis for applying the phase shift principle. Thus, the phase shift principle is applied to every individual mode of the original acceleration data, and the new shifted modes are added together to form the velocity function, and subsequently the displacement []. The following simple example explains this method. Assuming that represents an , then:
with the corresponding integration:
Thus, applying the phase shift principle:
where is the velocity, is the acceleration, is the amplitude, is the frequency, t is the time, is the main period, and K is the integration constant. The subscripts represent each of the signal obtained by EMD.
Similarly, the method is repeated one more time to transform the velocity into displacement.
Table 1 describes the steps for the proposed integration method. For the double integration, the same process has to be applied twice.

Table 1.
Steps for the proposed integration method.
It is important to remark that, for this method, the with the lowest frequency determines the amount of data in the analysis. This can usually be considered half of the original amount of data in the spectrum. Thus, in the analyses, it is crucial to consider this limitation of the method.
2.5. Simpson’s Rule Integration
In order to find the displacement spectrum, it is necessary to integrate the vibration as a function of the time twice. The two most common integration methods take place in the time and frequency domain. In the frequency domain integration, the original signal is transformed into the frequency by the Fourier transform, then it is integrated either once or twice to finally return the results to the time domain to obtain the speed and displacement. In the time domain integration, the original signal is directly integrated in the same time domain; however, in the time domain some integration trends are generated due to the cumulative errors of the method and the discretization of the data. These trends must be corrected for the results to be reliable. There are several methods used to correct effects of the trends by extracting the curve that represents the trend obtained by a polynomial fit, and EMD has been commonly applied in recent years. For simple functions, a second-order polynomial usually solves the problem; however, for complex vibrations, the degree of the polynomial increases and becomes somewhat subjective. In this article, the trend correction is performed with the EMD method. In addition to dealing with trends, there is a lack of knowledge of the initial conditions of speed and displacement, which are usually defined as zero. This consideration generates errors of vertical and horizontal displacements in the results, which must also be handled to minimize integration errors. Some of the most common integration methods are the trapezoid and the Simpson’s rule. In this work, the integrals will be performed using the Simpson’s 1/3 rule shown in Equation (11) because it has a reasonably small truncation error.
where the truncation error is:
2.6. Shaft with a Single Disk
Figure 2 shows a disk of mass M that is assembled on a shaft. The single disk is located between the two bearing supports. It is supposed that the mass of the shaft is not significant compared with the mass of the disk. Considering that M is the mass of the disk, O is on the shaft axis, G is the center of mass of the disk, y is the deflection of the shaft, e is the eccentricity, is the centrifugal force, and is the angular speed of the shaft, then is expressed by Equation (13):
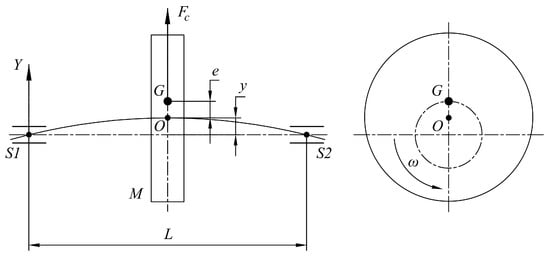
Figure 2.
Sketch of an unbalanced disk.
The shaft in Figure 2 can be viewed as a spring. Assuming that k is the shaft spring constant, the shaft resistance force produced by the deflection y is , which is equal to the centrifugal force of the system. Then, another expression can be formulated for y in Equation (14). Due to the angular speed and type of bearings, it is concluded that the deflection and the imbalance are in phase.
From Equation (14), it can be noted that, when , the deflection y is also zero. When , y tends to the infinite. For this condition, is known as critical speed:
Figure 3 details the behavior of Equation (15). When , y is positive and it changes of sign when . For a high angular speed, y trends to a negative value equal to the eccentricity e. Moreover, the larger deflection is given for values near to the natural frequency.
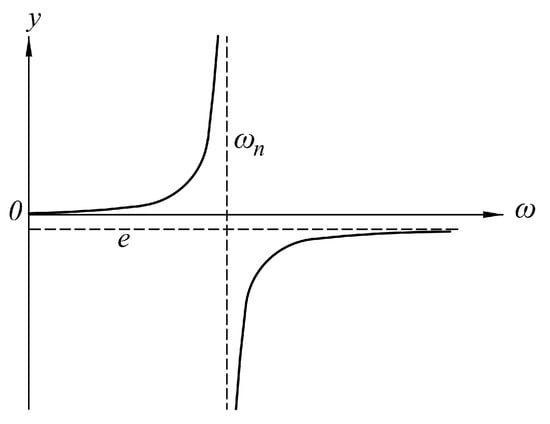
Figure 3.
Graph of angular speed (rpm) versus shaft deflection y (mm).
2.7. Friction
The friction in the disk system can be described by the rotor rubbing model shown in Figure 4, which uses the dry friction method, and is based on the Coulomb friction concept []:
where, is the friction force, is the friction coefficient, is the normal force, r is the shaft radius, e is the eccentricity between the geometric centers of the two circles, is the angle formed by the line between the contact point Q and P and the horizontal line intersecting P, and is the angular speed of the disk.
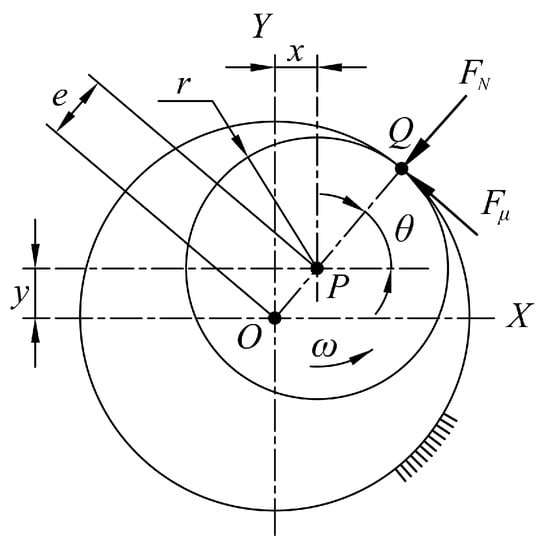
Figure 4.
Schematic representation of a dry friction rotor.
3. Results
3.1. Experimental Setup
The test bench used for the experimentation is presented in Figure 5. It consists of a steel rotor with a mass M = 0.819 kg, mounted on a flexible shaft with diameter d = 19 mm, and supported symmetrically between two bearings separated by 700 mm. An electric DC motor drives the shaft through a flexible coupling. The disk has M5 x 1 mm pitch threaded holes for unbalanced masses at a = 65 mm concentric circle and 16 equally spaced positions. The test mass is a constant weight of 12 g, and it is located symmetrically in a single hole. The unidirectional accelerometer is in the horizontal position at the base of bearing A. The friction plate has a unitary width of 38 mm for contact with the disc surface and a flexible arrangement. According to the design of the bench, the friction force increases with imbalance degree and speed.
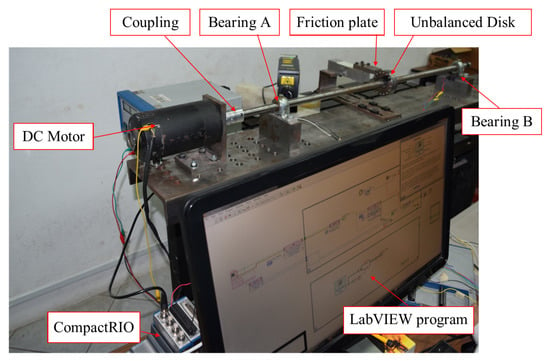
Figure 5.
Schematic test bench.
The data acquisition system consists of a cRio-9074 CompactRIO embedded controller (8 slots, 400 MHz CPU, 128 MB RAM, 256 MB storage, 2M FPGA Gateways) from National Instruments. It contains an NI9234 4-channel module for dynamic data acquisition, an NI9205 analog input channel, and another NI9403 32-channel digital module. The data were acquired and processed using a program developed in LabVIEW.
The acceleration was measured by an ADXL103 uniaxial accelerometer with a measurement range of ±1.7 g, a sensitivity of 1000 mV/g, and a bandwidth from 0.5 Hz to 2.5 kHz. The accelerometer was placed horizontally on the transverse axis under bearing A, as shown in Figure 5. The friction load was registered with a Rhino load cell model RH1242. The validation of the proposed integration method was performed with a single-point vibrometer model PV-100 from Polytec.
The sampling frequency was 3 kHz, and each measurement time series vector had 1042 data. According to Table 2, two cases were studied: (a) Case 1 consisted in taking a measurement of the rotor with a constant unbalanced test mass of 12 gr; (b) in Case 2, in addition to the first case conditions, a dry friction contact was applied on the outer diameter of the disk. Both cases were calculated at 700 and 1800 rpm.

Table 2.
Test conditions for the experiment.
Initially, it is important to know the critical speed of the system to avoid working close to its value. The critical velocity of the system was = 4775.7 rpm, from Equation (16), given a disk mass M = 0.819 kg, a = 350 mm, b = 350 mm, L = 700 mm, E = 210 GPa, I = 6397.1 mm, and assuming that the shaft and the disk are manufactured with AISI 4140 steel. The velocity test range is less than of the critical speed, thus will not affect the results.
3.2. Flow Chart of the Experimental Setup
The proposed method to diagnose the unbalanced rotor with friction is presented in Figure 6. The block diagram describes the Simpson’s integration and detrending with the EMD method (here referred to as SDEMDI) and the new phase-shift empirical mode decomposition integration (PSEMDI).
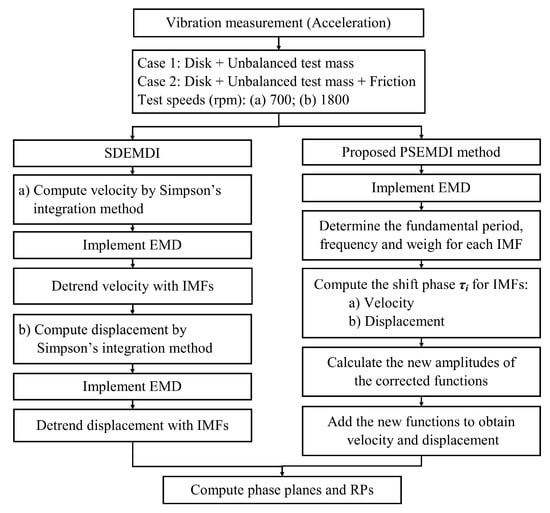
Figure 6.
Block diagram of the proposed method.
3.3. Friction Force Results
A comparison of the vibration levels in the system before applying additional mass and friction is shown in Figure 7a. The root mean square values for the three acceleration conditions (free, unbalanced, and unbalanced with friction) were 0.017, 0.18, and 1.260, respectively. The friction force in the measurement system has a nonlinear behavior which is shown in Figure 7b. This figure gives the mean friction force for each speed that for this experiment was changed from 700 to 1800 in 100-rpm steps. At the beginning, the friction force was the lowest (0.09 N), then it increased with speed up to 1400 rpm (0.88 N). Between 1500 and 1800 rpm, it decreased to 0.44 N and stabilized.
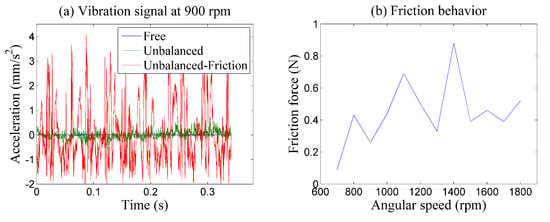
Figure 7.
(a) Comparison of signal for three different disk conditions at 900 rpm: free, unbalanced, and unbalanced with friction; (b) friction behavior for different speeds.
3.4. SDEMDI Method
The acceleration spectra were recorded for each test condition. Then, each spectrum was processed so that the mean value matches the zero axis of the vibration amplitude. All data were normalized before the integration process. The acceleration signal for Case 1, unbalanced disk without friction and 700 rpm (U-700), is presented in Figure 8a. The acceleration signal was integrated by the 1/3 Simpson’s rule. Only the first case is presented to show the methodology applied to obtain the velocity, and the displacement was estimated by repeating the process with the velocity. For all cases, the initial conditions for both velocity and displacement were set to zero. An algorithm carried out the signal processing on MATLAB to ensure all results had the same processing treatment. The velocity obtained after integration is presented in Figure 8b. The red line represents the trend of the velocity due to integration process and errors in the original signal in Figure 8b. The trend was computed by the two lowest IMFs of the integrated spectrum. The velocity was corrected according to its trend, and the final velocity is shown in Figure 8c.
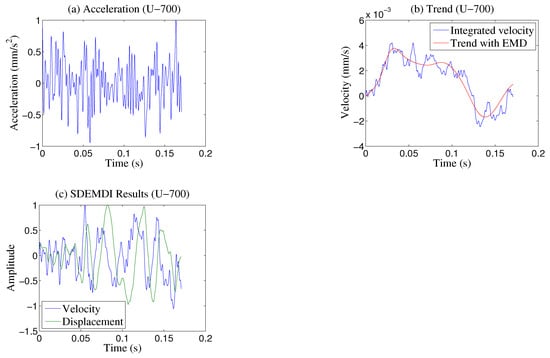
Figure 8.
Transformation of acceleration into velocity by detrending with the SDEMDI method for Case 1 at 700 rpm: (a) Acceleration signal; (b) velocity resulting from integration with its trend; (c) corrected velocity and displacement.
The resulting from EMD implementation are shown in Figure 9. The process was repeated to transform the velocity into position, then applied to all cases.
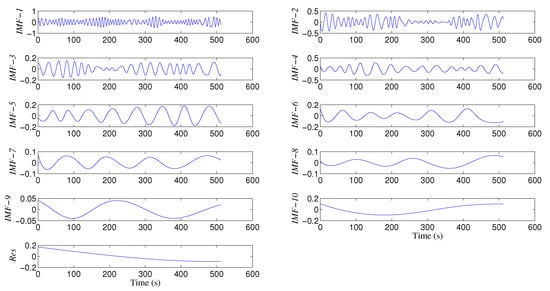
Figure 9.
IMFs obtained from acceleration by EMD.
3.5. Proposed PSEMDI Method
The proposed method was validated by comparing the velocity obtained using the PSEMDI with the signal measured directly by a laser vibrometer, and both devices were synchronized. The laser vibrometer focused on the disk surface close to the friction point. Due to the measurement points being different in position and orientation, the vibrometer signal had to be corrected in order to be compared. The input signal of the unbalanced disk with friction at 700 rpm is represented by Figure 10a. The velocity curves were compared as shown in Figure 10b, and then the coherence between both signals was calculated and it is presented in Figure 10c. The primary frequencies were located at the peaks A (11.72 Hz, 0.22), B (152.3 Hz, 0.14), and C (199.2 Hz, 0.13), where point A is the angular speed at 700 rpm and the others represent friction frequencies. The velocity signals compared in Figure 10b have a significantly similar pattern despite the low values of the coherence.
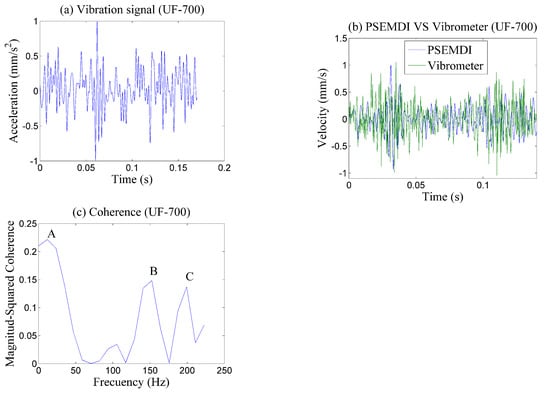
Figure 10.
Comparison of PSEMDI velocity with laser vibrometer for the unbalanced disk and friction at 700 rpm: (a) Acceleration signal; (b) comparison of PSEMDI velocity and vibrometer; (c) coherence results.
The PSEMDI procedure is described with two intrinsic mode functions for Case 1 at 700 rpm, according to the block diagram in Figure 6. IMF3 and IMF8 were chosen from results in Figure 11. For each , the FFT was computed and its fundamental frequency and amplitude were calculated. The fundamental frequency is used to phase shift the , and the amplitude was used to correct signal amplitude. Then, the velocity was estimated by shifting the by 1/4 of the fundamental frequency. These steps are shown in Figure 11 for two of the .
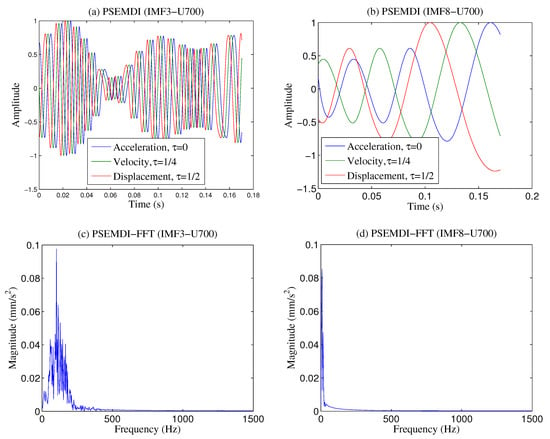
Figure 11.
The phase shift property applied on two (Case 1, 700 rpm): (a) ; (b) ; their fundamental FFT frequency and its amplitudes are (c,d), respectively. The phase shift are 1/4 of the fundamental frequency for velocity and displacement, respectively.
Finally, the were computed and added to obtain the final velocity and displacement. The penultimate provides the maximum amount of data for the calculation. The results of the calculation of the velocity and displacement with the PSEMDI method are shown in Figure 12. The displacement has the smallest trend, and all vibrations are symmetrical and stable. The results are very different from those obtained with the Simpson´s rule integration. The most interesting difference in the results is that there is no significant trend and, as a consequence, the spectra are more symmetric and stable in contrast with the SDEMDI.
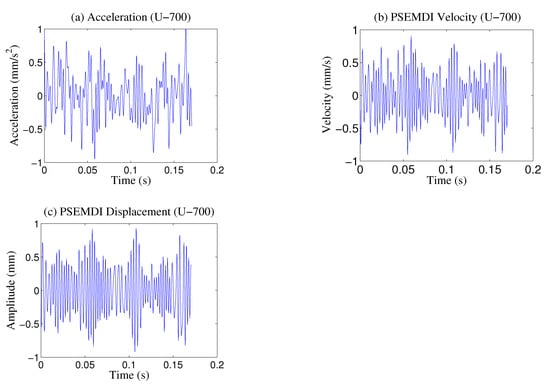
Figure 12.
Results of the PSEMDI method for Case 1 at 700 rpm: (a) Signal; (b) velocity; (c) displacement.
3.6. Qualitative Analysis by RP
The results for Case 1 at 700 rpm with the SDEMDI method are presented in Figure 13 and the same calculation for Case 2 at 700 rpm is shown in Figure 14. In both figures, it is possible to observe the evolution of the state variables. The behavior is dominated by the trends that remain in each spectrum; however, in the RP with friction, the characteristic diagonal lines of the nonlinearities of the system prevail. According to the results, there is a clear difference when friction is included in the system, and it is reflected in RP. All recurrence graphs were calculated with the same threshold, e = 0.1, for comparison purposes.
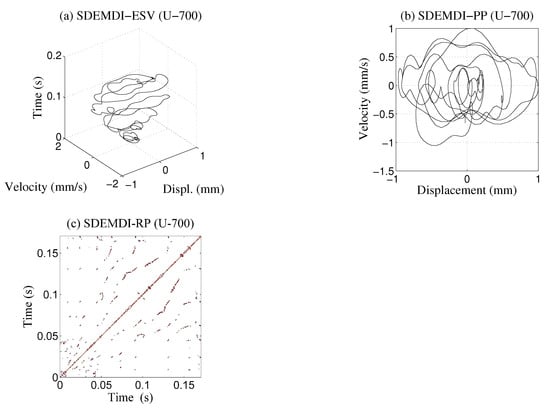
Figure 13.
(a) Evolution of state variables (ESV); (b) phase plane (PP); (c) recurrence plot for Case 1 at 700 rpm.
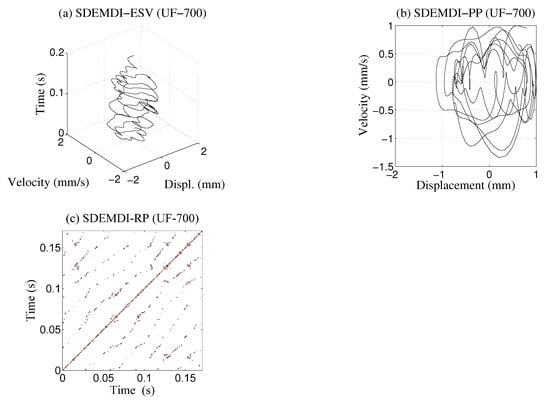
Figure 14.
(a) Evolution of state variables; (b) phase plane; (c) recurrence plot for Case 2 at 700 rpm.
The same two cases presented in the previous paragraph are calculated with the proposed PSEMDI method: Case 1 in Figure 15 and Case 2 in Figure 16. At first glance, there are striking visual differences between the results. The phase graphs show a more defined and symmetrical behavior. Similarly, the recurrence graphs are quite different and provide more information about the system. Again, a clear difference can be observed when friction is included in the analysis, although it is more uniform between both cases.
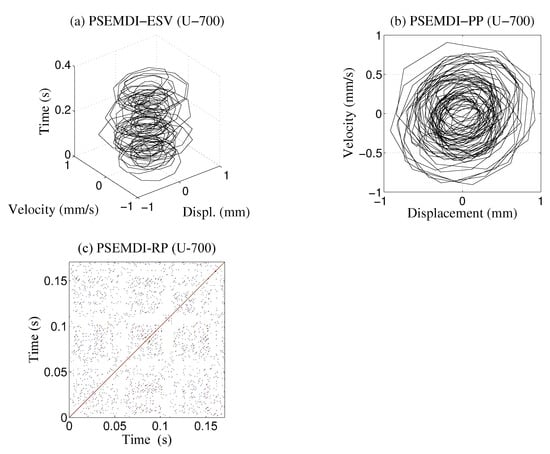
Figure 15.
(a) Evolution of state variables; (b) phase plane; (c) recurrence plot for Case 1 at 700 rpm.
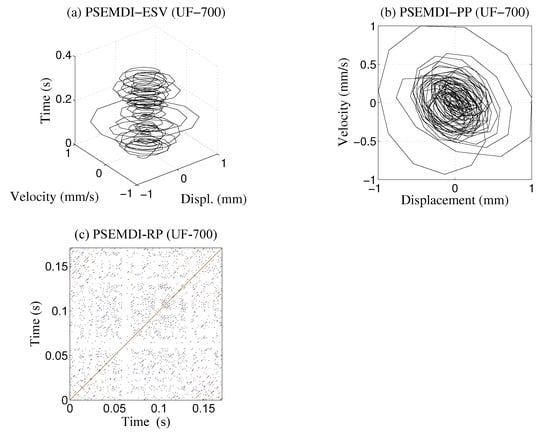
Figure 16.
(a) Evolution of state variables; (b) phase plane; (c) recurrence plot for Case 2 at 700 rpm.
The results for Case 2 at 700 rpm with the proposed method are presented in Figure 14. Friction has more influence on the main diagonal of the RP.
The results for the two cases at 1800 rpm are shown in Figure 17. The system behavior at higher speed showed a similar behavior to that at 700 rpm in the phase diagrams for each integration method, and it is shown here. The recurrence plots indicate a decrease in the pattern point density with the inclusion of friction, compared with the behavior at 700 rpm. Again, there is a big difference between the results from both methods. Similarly, friction also generates differences between the main diagonals in both methods.
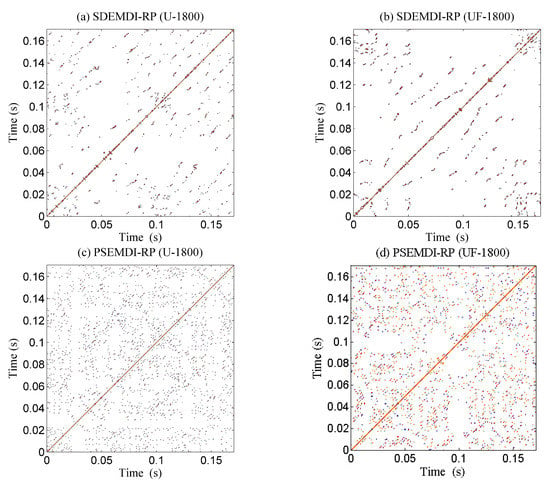
Figure 17.
RPs from the two methods for Case 1 and Case 2, at 1800 rpm: without friction (a,c); with friction (b,d).
3.7. Recurrence Quantification Analysis
The RQA of the experimental setup was carried out on the results from the SDEMDI method and it is reported in Table 3. At 700 rpm, the two parameters that contrasted the most and decreased with friction were and . The other parameters grew slightly with friction. On the contrary, at 1800 rpm, all the parameters increased with friction, except RR, which remained constant in all cases; therefore, it can be concluded that friction produces notable differences in some of the parameters.

Table 3.
Quantification of SDEMDI results.
Similarly, the results obtained with the proposed PSEMDI method were quantified by RQA and presented in Table 4. In this case, the differences due to friction are low for all parameters. The parameters that increased with friction for the two speeds were only and .

Table 4.
Quantification of PSEMDI results.
A graphical comparison of all the parameters for the two integration methods is shown in Figure 18. As it can be seen, the results for the PSEMDI method are more constant and uniform. Moreover, the most marked differences between the two methods are shown by the parameters and . These differences are due to the double integration process of the SDEMDI method, which has a very significant effect on the values of the maximum vertical and diagonal lines.
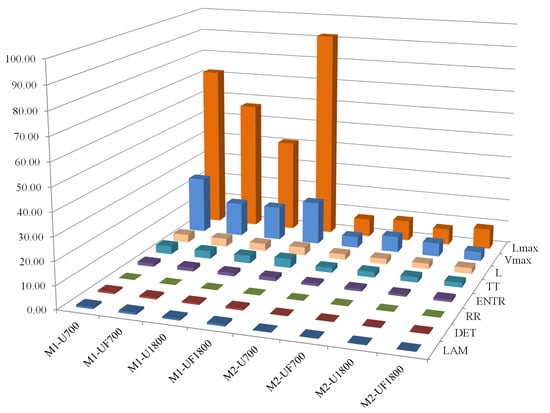
Figure 18.
Quantification analysis of the experimental data: SDEMDI (M1); PSEMDI (M2).
4. Discussion
Based on the results obtained with the SDEMDI method, it can be concluded that after each integration process, there is a certain degree of filtering in the signal. Moreover, the deviations are more significant when calculating the displacement. The selection of the degree of the polynomial used to calculate the trend that originates from the integration is somehow arbitrary and it is left to the researcher’s discretion. For the analyzed cases, the final spectra for speed and displacement continue to show significant trends. It can also be noted that as trends are removed, a more symmetrical vibration is obtained. This method depends on the initial conditions, which are set to zero. It can also be concluded that for more complex vibrations, the largest trends are obtained. Consequently, the graphs showed a low density in the vibratory behavior, and the quantification of the recurrence result confirmed the above findings; however, it was possible to distinguish and quantify the effects due to the inclusion of friction both graphically and by RP.
In contrast, the results obtained with the proposed PSEMDI method showed spectra with more symmetry, uniformity, and consistency. They practically did not show a low-frequency trend because the process does not apply the integration by finite differences as the first method does. The results do not depend on the initial values, nor on the subjective estimation of the degree of the polynomial used to eliminate the trend. The EMD is applied only once, and the speed and displacement are calculated with the same IMF spectra, considering only their respective phase shifts. Another fundamental characteristic of the proposed method is that it retains the exact nature of EMD and RP regarding their ability to analyze nonlinear and nonstationary systems. All these characteristics can be easily verified with the phase diagrams, the RP, and the quantification of the recurrence parameters; however, it was nonetheless possible to identify the effect of friction on the results.
5. Conclusions
The present work analyzed an unbalanced disk subjected to friction on its outer diameter, at 700 and 1800 rpm, using RP and a new integration method that keeps the nonlinearities of the vibration signal. The disk was mounted on a flexible shaft, and it was supported symmetrically by two bearings at both ends. The vibration was recorded with an accelerometer on the bearing next to the coupling. The acceleration was transformed into velocity and displacement with two methods. With the SDEMDI method, the acceleration was integrated with the Simpson’s rule and then detrended with EMD to obtain the velocity, and the process was applied twice to obtain the displacement. With the newly proposed PSEMDI method, the acceleration was integrated by applying the EMD only once. The results of the proposed integration method were compared with vibration measurements obtained with an interferometer and they had significantly similar patterns.
The results show a significant difference between the two methods. Graphs and quantification analysis with PSEMDI are more consistent, uniform, and symmetrical than those with SDEMDI. In both cases, friction can be observed and quantified. Friction produces more irregularities on the main diagonal in the RPs. The quantification parameters that respond to friction with the SDEMDI method are , , and , which increase at both speeds. Some additional advantages of PSEMDI are: it maintains the ability to take into account nonlinearities similar to the EMD method; the signal can be integrated without the need of filtering; it is not dependent on the initial conditions; there is no trend due to cumulative errors that typically derive from the integration process; and it does not depend on the subjective selection of a polynomial detrending.
Some future studies are required to evaluate the new PSEMDI and RP for another typical nonlinear fault in rotating machinery. Additional work could be necessary to improve the method and to deal with the highest frequencies.
Author Contributions
Conceptualization, validation, formal analysis, investigation, and writing original draft preparation, I.T.-C.; methodology, supervision and validation J.C.J.-C.; visualization, technical and writing editing reviewers, S.E.-V. and J.P.B.-R.; software, S.C.-M. All authors have read and agreed to the published version of the manuscript.
Funding
This research received no external funding.
Institutional Review Board Statement
Not applicable.
Informed Consent Statement
Not applicable.
Data Availability Statement
Not applicable.
Conflicts of Interest
The authors declare no conflict of interest.
References
- Olarte, W.; Botero, M.; Benhur, A. Análisis de vibraciones: Una herramienta clave en el mantenimiento predictivo. Sci. Tech. Año XVI 2010, 45, 219–222. [Google Scholar]
- British Standard. Maintenance–Maintenance Terminology; Standard BS EN 13306: 2010; British Standard Institution: London, UK, 2010. [Google Scholar]
- Eckmann, J.; Oliffson, S.; Ruelle, D. Recurrence Plots of Dynamical Systems. Europhys. Lett. 5 1987, 4, 973–977. [Google Scholar] [CrossRef] [Green Version]
- Samborski, S.; Wieczorkiewicz, J.; Rusinek, R. A numerical-experimental study on damaged beams dynamics. Europhys. Lett. 2015, 17, 624–631. [Google Scholar] [CrossRef]
- Kan, S.; Tan, A.; Rusinek, R.; Mathew, J. A review on prognostic techniques for non-stationary and non-linear rotating Systems. Mech. Syst. Signal Process. 2015, 62, 20. [Google Scholar] [CrossRef]
- Jauregui-Correa, J.C. Identification of Nonlinearities in Mechanical Systems Using Recurrence Plots. In Nonlinear Structural Dynamics and Damping, Mechanisms and Machine Science; Springer: Cham, Switzerland, 2019; pp. 83–118. [Google Scholar]
- Jauregui-Correa, J.C.; Camacho, S.; Basaldua-Sanchez, J. Analysis of the effect of different friction models on the dynamic response of a rotor rubbing the housing. Mech. Mach. Sci. 2019, 73, 4227–4236. [Google Scholar]
- Lozano, A.; Jáuregui-Correa, J.C. Las Vibraciones Mecánicas en el Mantenimiento Predictivo, 1st ed.; FUNDAp; Fundación Universitaria de Derecho, Administración y Polítics a, S.C.: Querétaro, Mexico, 2013; p. 160. ISBN 978-607-96048-8-2. [Google Scholar]
- Vojtko, I.; Baron, P.; Pollák, M. Examining the Effect of Alignment of the Rotor of the Emissions Exhaust Fan on Its Operating Parameters. Adv. Mater. Sci. Eng. 2019, 1–13. [Google Scholar] [CrossRef] [Green Version]
- Mogal, S.; Lalwani, D. Experimental investigation of unbalance and misalignment in rotor bearing system using order analysis. J. Meas. Eng. 2015, 3, 1–20. [Google Scholar]
- Yamamoto, K.; da Costa, C.; da Silva, J. A smart experimental setup for vibration measurement and imbalance fault detection in rotating machinery. Case Stud. Mech. Syst. Signal Process. 2016, 4, 8–18. [Google Scholar] [CrossRef] [Green Version]
- Sendhilkumar, S.; Mohanasundaram, N.; Senthilkumar, M.; Sivanandam, S. Elman Neural Network for Diagnosis of Unbalance in a Rotor-Bearing System. Int. J. Mech. Mechatron. Eng. 2016, 10, 613–617. [Google Scholar]
- Heindel, S.; Becker, F.; Rinderknecht, S. Unbalance and resonance elimination with active bearings on a Jeffcott Rotor. Mech. Syst. Signal Process. 2017, 85, 339–353. [Google Scholar] [CrossRef]
- Rahman, M.; Mohammad, N. Online Unbalanced Rotor Fault Detection of an IM Drive Based on Both Time and Frequency Domain Analyses. Mech. Syst. Signal Process. 2015, 8, 4087–4096. [Google Scholar]
- Bartkowiak, M. Controlled synchronization at the existence limit for an excited unbalanced rotor. Int. J. Non-Linear Mech. 2017, 91, 95–102. [Google Scholar] [CrossRef]
- Hongrui, C.; Dong, H.; Xi, S.; Chen, X. Vibration signal correction of unbalanced rotor due to angular speed fluctuation. Mech. Syst. Signal Process. 2018, 107, 202–220. [Google Scholar]
- Deng, D.; Diao, Y.; Zhang, J.; Zhang, P.; Ma, M.; Zhong, X.; Yu, L. Three-Dimensional Identification for Unbalanced Mass of Rotor Systems in Operation. Appl. Sci. 2018, 8, 173. [Google Scholar] [CrossRef] [Green Version]
- Andrievsky, B.; Fradkov, A.; Tomchina, O.; Boikov, V. Angular Velocity and Phase Shift Control of Mechatronic Vibrational Setup. IFAC Pap. Line 2019, 52, 436–441. [Google Scholar] [CrossRef]
- Ahobal, N.; Prasad, S. Study of vibration characteristics of unbalanced overhanging rotor. IOP Conf. Ser. Mater. Sci. Eng. 2019, 577, 10. [Google Scholar] [CrossRef]
- Moreira, R.; Paiba, A. The Influence of Friction in Rotor-Stator Contact Nonlinear Dynamics. In Proceedings of the 10th International Conference on Rotor Dynamics—IFToMM; Springer: Cham, Switzerland, 2019; Volume 61, pp. 428–441. [Google Scholar]
- Tse, P.W.; Wang, D. State Space Formulation of Nonlinear Vibration Responses Collected from a Dynamic Rotor-Bearing System: An Extension of Bearing Diagnostics to Bearing Prognostics. Sensors 2017, 17, 369. [Google Scholar] [CrossRef] [Green Version]
- Hua, C.; Cao, G.; Rao, Z.; Ta, N.; Zhu, Z. Coupled bending and torsional vibration of a rotor system with nonlinear friction. J. Mech. Sci. Technol. 2017, 31, 2679–2689. [Google Scholar] [CrossRef]
- Chipato, E.; Shaw, A.; Friswell, M. Frictional effects on the nonlinear dynamics of an overhung rotor. Commun. Nonlinear Sci. Numer. Simul. 2019, 78, 104875. [Google Scholar] [CrossRef]
- Li, Y.; Luo, Z.; Shi, B.; Liu, J. Influence of contact interface friction of bolted disk joint on motion stability of rotor-bearing system. Arch. Appl. Mech. 2021, 91, 2225–2236. [Google Scholar] [CrossRef]
- Mokhtar, M.A.; Darpe, A.K.; Gupta, K. Investigations on bending-torsional vibrations of rotor during rotor-stator rub using Lagrange multiplier method. J. Sound Vib. 2017, 401, 94–113. [Google Scholar] [CrossRef]
- Liao, M.; Li, Y.; Song, M.; Wang, S. Dynamics Modeling and Numerical Analysis of Rotor with Elastic Support/Dry Friction Dampers. Trans. Nanjing Univ. Aeronaut. Astronaut. 2018, 69, 69–83. [Google Scholar]
- Moirot, F.; Nguyen, Q.S. Some examples of friction-induced vibrations and instabilities. In Friction and Instabilities; Springer: Vienna, Australia, 2002; pp. 137–178. [Google Scholar]
- Sinou, J.J.; Dereure, O.; Mazet, G.B.; Thouverez, F.; Jezequel, L. Friction-induced vibration for an aircraft brake system—Part 1: Experimental approach and stability analysis. Int. J. Mech. Sci. 2006, 48, 536–554. [Google Scholar] [CrossRef] [Green Version]
- Sinou, J.J.; Thouverez, F.; Jezequel, L.; Dereure, O.; Mazet, G.B. Friction-induced vibration for an aircraft brake system—Part 2: Experimental approach and stability analysis. Int. J. Mech. Sci. 2006, 48, 555–567. [Google Scholar] [CrossRef] [Green Version]
- Charroyer, L.; Chiello, O.; Sinou, J.J.; Dereure, O.; Mazet, G.B. Parametric study of the mode coupling instability for a simple system with planar or rectilinear friction. J. Sound Vib. 2016, 384, 94–112. [Google Scholar] [CrossRef] [Green Version]
- Charroyer, L.; Chiello, O.; Sinou, J.J.; Dereure, O.; Mazet, G.B. Self-excited vibrations of a non-smooth contact dynamical system with planar friction based on the shooting method. Int. J. Mech. Sci. 2018, 144, 90–101. [Google Scholar] [CrossRef] [Green Version]
- Mercier, A.; Jezequel, L.; Besset, S.; Hamdi, A.; Diebold, J.F. Nonlinear analysis of the friction-induced vibrations of a rotor-stator system. J. Sound Vib. 2019, 443, 483–501. [Google Scholar] [CrossRef]
- Kornaev, A.; Zaretsky, R.; Egorov, S. Simulation of Deep Learning Control Systems to Reduce Energy Loses due to Vibration and Friction in Rotor Bearings. In Proceedings of the 2019 3rd School on Dynamics of Complex Networks and Their Application in Intellectual Robotics (DCNAIR), Innopolis, Russia, 9–11 September 2019; pp. 89–91. [Google Scholar]
- Tse, W.; Wang, D. Experimental Characterization of Friction in a Negative Stiffness Nonlinear Oscillator. Vibration 2020, 3, 132–148. [Google Scholar]
- Torres-Contreras, I.; Jáuregui-Correa, J.C.; López-Cajún, C.S.; Echeverría-Villagómez, S. Effects of Phase Shift Errors in Recurrence Plot for Rotating Machinery Fault Diagnosis. Appl. Sci. 2021, 11, 873. [Google Scholar] [CrossRef]
- Han, S. Measuring displacement signal with an accelerometer. J. Mech. Sci. Technol. 2010, 24, 1329–1335. [Google Scholar] [CrossRef]
- Zhu, Y.; Jiang, W.; Kong, X.; Shen, Z.; Hu, H. An Accurate Integral Method for Vibration Signal Based on Feature Information Extraction. Shock Vib. 2015, 2015, 1–13. [Google Scholar] [CrossRef]
- Han, S.; Zhang, R.; Luo, H.; Shen, H. Baseline correction of vibration acceleration signals with inconsistent initial velocity and displacement. Adv. Mech. Eng. 2016, 8, 1–11. [Google Scholar]
- Rostami, S.; Shojaee, S. Alpha-Modification of Cubic B-Spline Direct Time Integration Method. Int. J. Struct. Stab. Dyn. 2017, 17, 34. [Google Scholar] [CrossRef]
- Xu, J.; Xu, X.; Cui, X. A new recursive Simpson integral algorithm in vibration testing. Aust. J. Mech. Eng. 2019, 17, 1750118. [Google Scholar] [CrossRef]
- Han, H.; Park, M.; Park, S.; Kim, J.; Baek, Y. Experimental Verification of Methods for Converting Acceleration Data in High-Rise Buildings into Displacement Data by Shaking Table Test. Appl. Sci. 2019, 9, 1653. [Google Scholar] [CrossRef] [Green Version]
- Ferrero, R.; Gandino, F.; Hemmatpour, M. Estimation of Displacement for Internet of Things Applications with Kalman Filter. Appl. Sci. 2019, 9, 985. [Google Scholar] [CrossRef] [Green Version]
- Wang, H.; Ji, Y. A Revised Hilbert–Huang Transform and Its Application to Fault Diagnosis in a Rotor System. Sensors 2018, 18, 4329. [Google Scholar] [CrossRef] [Green Version]
- Wang, H.; Ji, Y. Effect of Different Detrending Approaches on Computational Intelligence Models of Time Series. In Proceedings of the WCCI 2010 IEEE World Congress on Computational Intelligence, Barcelona, Spain, 18–23 July 2010. [Google Scholar]
- Rios, R.; Mello, R. Applying Empirical Mode Decomposition and mutual information to separate stochastic and deterministic influences embedded in signals. Signal Process. 2016, 118, 159–176. [Google Scholar] [CrossRef]
- Guariglia, E. Entropy and Fractal Antennas. Entropy 2016, 18, 84. [Google Scholar] [CrossRef]
- Guariglia, E. Harmonic Sierpinski Gasket and Applications. Entropy 2018, 20, 714. [Google Scholar] [CrossRef] [Green Version]
- Guariglia, E. Primality, Fractality, and Image Analysis. Entropy 2019, 21, 304. [Google Scholar] [CrossRef] [Green Version]
- Marwan, N.; Schinke, S.; Kurths, J. Recurrence plots 25 years later—Gaining confidence in dynamical transitions. EPL Europhys. Lett. 2013, 101, 20007. [Google Scholar] [CrossRef] [Green Version]
- Marwan, N.; Romano, M.C.; Thiel, M.; Kurths, J. Recurrence Plots for the Analysis of Complex Systems. Phys. Rep. 2007, 438, 237–329. [Google Scholar] [CrossRef]
Publisher’s Note: MDPI stays neutral with regard to jurisdictional claims in published maps and institutional affiliations. |
© 2021 by the authors. Licensee MDPI, Basel, Switzerland. This article is an open access article distributed under the terms and conditions of the Creative Commons Attribution (CC BY) license (https://creativecommons.org/licenses/by/4.0/).