Abstract
Fluctuating Asymmetry (FA) in morphology is used as a proxy for developmental instability in response to stress factors. FA has important implications for understanding the impact of differential environments and stressors on the skeletal phenotype. Here, we explore FA in the mandibular morphology of wild and captive Macaca fuscata to detect differences induced by the captive environment. We use two different approaches in Geometric Morphometrics to characterise the degree and patterns of FA and Directional Asymmetry (DA) based on 3D mandibular landmarks. Our results show that the wild and captive groups exhibit morphological dissimilarities in the symmetric component of shape while no significant degree of asymmetry (fluctuating or directional) was detected. Based on our results and on previous literature on the subject, we suggest that (I) captivity is likely to affect the mandibular morphology of M. fuscata; (II) FA may not be a suitable indicator to detect stress in the conditions analysed; and that (III) the mandible may not be the ideal region to study asymmetry because of its functional nature.
1. Introduction
The degree and modes of anatomical asymmetry have been extensively studied for decades both in vertebrates and invertebrates [1,2,3,4,5,6,7,8,9,10,11]. In nature, we can observe principally three different types of asymmetry:
- Directional Asymmetry (DA) occurs when one side of a structure is consistently different (e.g., larger, smaller or differently shaped) than the other side [12]. DA in a biological structure might indicate that the deviating side serves a new specific function, and it is being consistently selected by nature over time (lateralised behaviour) [13].
- Bimodal Asymmetry (also called anti-symmetry) [14] occurs when both sides deviate from symmetry in equal proportions, creating a bimodal distribution. Biologically, this means that both left and right deviations from symmetry are favoured in equal proportions, with symmetric individuals being less frequent.
- Finally, Fluctuating Asymmetry (FA) indicates that both sides deviate from symmetry with no side preferred and with deviations that are random and non-directional [15].
FA has been used in the literature as a “measure of stress in populations or of individual quality” [4]. Following [16], we define stress as any condition that has the potential of altering or limiting the range of natural expression of the individual development and behaviour. Previous studies have linked the presence of FA in skeletal morphology with the epigenetic environmental conditions occurring during development [17,18,19,20,21]. Different morphological traits have been linked to different sensitivity to FA and some anatomical regions are more prone to become asymmetric [22]. This may occur because asymmetry in certain anatomical regions could severely affect the ability of an animal to perform a fundamental task, as is the case of limb proportions for locomotion [23]. In addition, sex might influence the degree and modes of asymmetry. Indeed, in some animals, the male’s morphology is more subject to asymmetric development, probably because of a faster and more variable growth [24].
Recently, researchers have begun to explore the link between captivity and the presence of morphological asymmetry [25]. Inbreeding and the consequent loss of genetic variability could explain, at least in part, the presence of FA in the skeleton [23], although a recent study [14] compared the magnitude of FA in the mandible of outbred and inbred mice and found no significant degree of FA in the latter. Alternatively, asymmetry could be the effect of epigenetic changes caused by stress-inducing factors derived by living in non-natural environments. Although modern zoo facilities work to achieve ever-growing knowledge of captive animal welfare, we are not aware of the full impact that an enclosure and its dynamics can have on the development of an individual. Changes in the natural diet, contact with pathogens other than those encountered in the wild, and the inevitable restrictions or alterations of the optimal habitat pose challenging conditions that can cause an irregular development [26].
Much evidence exists about the impact of captivity on animal behaviour [27,28]. However, how living in a captive environment can influence an individual or a group’s morphology is still unclear [29,30]. Fishes raised in captivity have shown significantly higher levels of fluctuating asymmetry on different morphological traits, some of remarkable functional importance, such as the length of the pectoral and ventral fins [31]. Ref. [29] provides an extensive review of the studies that investigated FA in captive mammals and birds, concluding that despite further and more conclusive studies are needed, FA is a promising measure of animal welfare [32].
The aim of this work is to test and characterise FA in the mandible of captive primates, namely Macaca fuscata, and to detect differences in the asymmetry patterns in wild and captive individuals that could indicate stress due to captivity. We chose the mandible because it is a main actor in the interaction of an animal and its environment. Few studies have tested the presence of FA in animals that were born or lived under altered environmental or genetic circumstances, and even fewer focused on mandibular morphology [14,33,34]. Functional alterations that derive from mandibular asymmetry could have an impact on the masticatory behaviour of individuals. Therefore, it is important to understand if and to what extent the mandible of captive individuals could become asymmetric under stressful conditions. We chose M. fuscata because this species offers an ideal sample for studying the effects of captivity on the mammal skeleton. First, a suitable sample of captive and wild specimens is made available by the Digital Morphology Museum, KUPRI (http://dmm.pri.kyoto-u.ac.jp/dmm/WebGallery/index.html, accessed on 20 March 2021); second, because M. fuscata was the subject of previous studies regarding the effect of captivity on mandibular morphology [33], thus providing a baseline for our investigation. Here, we hypothesise that the captive sample shows a higher degree of FA than the wild group due to stressors associated with captivity.
2. Material and Methods
2.1. The Sample
A set of 28 3D landmarks (24 paired landmarks and 4 along the midsagittal plane) were recorded on meshes of mandibles generated from CT-scans and belonging to the species Macaca fuscata (Figure 1 and Table 1). The 3D models were obtained from CT-scans via segmentation using the same Hounsfield threshold for the entire sample (the scans were recorded in similar CT conditions). The CT-scans are available from the Digital Morphology Museum, KUPRI (http://dmm.pri.kyoto-u.ac.jp/dmm/WebGallery/index.html, accessed on 20 March 2021).
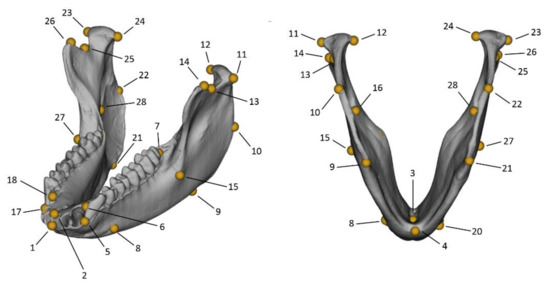
Figure 1.
Three-dimensional landmark configuration displayed on the mandible of an individual of Macaca fuscata. The landmark numbers refer to the definitions in Table 1.

Table 1.
List of landmark definitions used for the analyses of this study. The landmark type (I, II or III) is reported. The landmarks 1–4 are along the midline, the others are both left and right.
The landmarking process was repeated twice to account for inter-observer error. Multivariate Procrustes ANOVA was used to determine if differences between observers were lower than the differences between individuals, thus ensuring that the landmark positions were reproducible and unlikely to affect the existing differences among individuals [6].
Two groups were identified: a captive group, consisting of 51 adult individuals (25 males, 26 females), and a wild group, consisting of 51 adult specimens (26 males, 25 females). The sample only consists of mature specimens with fully erupted third molars. All the specimens are housed at the Primate Research Institute (PRI), Kyoto University, Inuyama, Japan, and were scanned, digitised and uploaded into the Digital Morphology Museum, KUPRI. The captive specimens come from the enclosures of the Primate Research Institute (PRI), Japan. These individuals were either born or spent at least a part of their lives in captivity. The captive individuals were mainly fed monkey chow (AS; Oriental Yeast Co., Ltd., Tokyo, Japan) and sweet potato. They all had been housed in an outdoor enclosure, occasionally being transferred to a group or isolated cage for research or care. The wild sample included specimens coming from different regions of Japan.
2.2. The Analytical Approach
Several procedures have been proposed to test for asymmetry in biological structures using Geometric Morphometrics and multivariate statistics. As a preliminary step of all these approaches, it is necessary to identify the type of symmetry under study. Symmetry can be defined as ‘object symmetry’ (the symmetry within a structure) or ‘matching symmetry’ (two separate mirrored copies of a structure). Our analysis focuses on ‘object symmetry’ as this is the case of the mandible. In the ‘object symmetry’ case, the asymmetry is quantified by comparing the object with its mirrored (reflected) counterpart. After the step of reflection, the mirrored landmarks were relabelled to maintain homology with the original configuration [6,35]. The original and the mirrored configurations were superimposed in a common Generalized Procrustes Analysis (GPA) [36], including the midline unpaired landmarks (along the mandibular symphysis).
Following these preliminary transformations of the landmarks, two approaches were adopted to quantify asymmetry. The first approach follows [35,37]. First, the differences between each landmark configuration and its reflection were computed, obtaining the individual asymmetric component. To explore the asymmetry visually, a modified PCA was performed, in which the origin of the axes represents perfect symmetry. The principal components of the asymmetry vectors were calculated around the symmetric origin; therefore, the asymmetry vectors represent the magnitude and direction of asymmetry starting from an origin of perfect symmetry. This method allows immediate visualisation of the degree (length of the vectors) and type (orientation of the vectors) of asymmetry (whether it is directional or fluctuating). Fluctuating asymmetry can then be estimated as the Procrustes distance between each individual and its relabelled mirrored version. The proportions of directional and fluctuating asymmetry were then estimated using a sum-of-squares decomposition of total asymmetry. Finally, following [35], we used the density distribution of the PC1 and PC2 scores to assess the degree of directional and fluctuating asymmetry. Additionally, PCA of the symmetric component was performed to visualise the symmetric shape variations within the sample and the potential differences between the captive and wild groups in the symmetric space. The symmetric shape was obtained by averaging each landmark configuration and its superimposed relabelled counterpart [35].
The shape variations of the first and second Principal Component axes (PC1 and PC2) were visualised using Thin-Plate-Splines (TPS) [38]. First, the 3D mesh of the mandible showing the smallest Procrustes distance from the mean shape of the symmetric shape space was chosen for the visualisation, and warped onto the mean shape. To visualise the shape variations of the symmetric shape space, the mesh was warped onto the maximum and minimum scores of the symmetric PC1 and PC2. Then, to visualise the asymmetric shape variations, the maximum and minimum scores of the asymmetric PC1 and PC2 were added to the symmetric mean shape, using again TPS to warp the symmetric mean shape mesh.
Multivariate Procrustes ANOVA was performed to test for symmetric and asymmetric shape differences between the mandibles of captive and wild M. fuscata. We used the shape (symmetric and asymmetric, in different ANOVA tests) as dependent variable and group (captive/wild) and sex as independent variables, allowing for the interaction of group and sex.
In the second approach, we performed a Multivariate Procrustes ANOVA using the overall shape as dependent variable (original and mirrored landmarks with no further transformations). In this analysis, the overall shape was tested against individual, reflection (a factor identifying the original and mirrored datasets), group (captive/wild groups), size, and sex. Interactions were allowed among individual, reflection and group [39]. The variation among individuals was quantified by the net effect of the variable “individual”. Directional asymmetry was tested by looking at the significance of the net effect of the variable “reflection”. Fluctuating asymmetry was evaluated by the interaction between “individual” and “reflection” [40]. The interaction between “group” and “reflection” was used to indicate differences in asymmetry between the wild and captive groups.
All the analyses were performed in the R programming environment [41]. For importing landmark data into R, we used the package “Arothron” [42]; for landmark mirrorisation and Principal Component Analysis, we used the package “Morpho” [43]; for performing Procrustes ANOVAs and TPS warping we used the package “geomorph” [44]. All other operations were performed in base R.
3. Results
To test for inter-observer measurement error, a Multivariate Procrustes ANOVA between the dependent variable of overall shape and the independent variables of “individual” and “replica” was performed. Results show a non-significant interaction between replica and individual, thus indicating that there is no significant difference between replicas of the same individuals (see Table 2). After verifying that there were no significant differences among sets of replicas, a single set was chosen and used for the following analysis.
Table 2.
Results of the Multivariate Procrustes ANOVA between the dependent variable of overall shape and the independent variables of “individual” and “replica” and their interaction. *** p-value ≤ 0.001.
Results from the symmetric component of the PCA (Figure 2) show that the first two com-ponents account respectively for 27% and 11% of the total variance. It appears that wild and captive M. fuscata show differences in their mandibular morphology, with the wild individuals shifted more toward negative values of the PC1 than the captive group (Figure 2), despite a certain degree of overlapping. Within each group, females appear to show lower PC scores than males along the PC1. The PC1 seems to record variations in the orientation of the mandibular ramus and the anterior region of the mandible (Figure 3). At positive values of the PC1, the ramus seems to project backward and to shorten, while the symphyseal region of the mandible projects forward. Additionally, the PC1 records a narrowing of the mandible, in particular the post-canine corpus and rami, going from positive to negative values. The PC2 seems to describe variations of the coronoid process, which projects forward at positive values, and the orientation of the gonial region, which moves outward toward negative values.
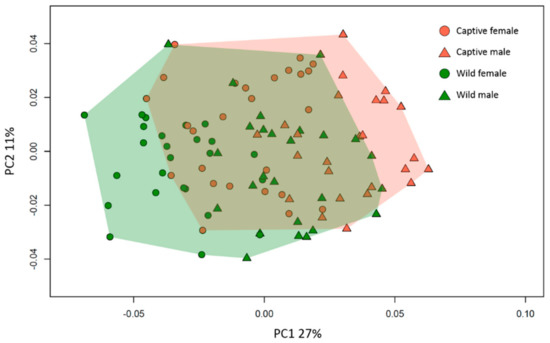
Figure 2.
PCA of the symmetric component of the mandible in the captive (brown) and wild (green) individuals. Males and females are represented by triangles and circles respectively. PC1 and PC2 explain 27% and 11% of the total variance, respectively. Convex hulls enclose group variability.
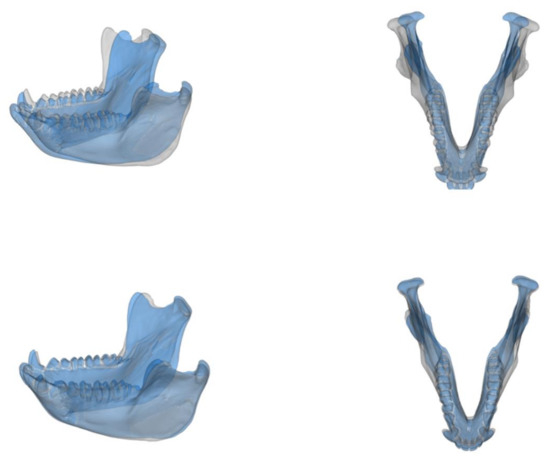
Figure 3.
Surface warpings of the extremes of PC1 (top) and PC2 (below) of the symmetric PCA. The grey surface indicates minimum (negative) values while the blue surface indicates maximum (positive) values along the PCA axes.
To test if the morphological differences between groups (wild/captive) are significant in the overall symmetric shape space, a Multivariate Procrustes ANOVA was performed. Sex was included as a covariate and the interaction between sex and group was allowed (Table 3). The results of Table 3 confirm that there are significant differences between the symmetric shape of captive and wild M. fuscata as well as differences between the two sexes but, within each group, there is no significant difference between males and females, therefore differences between the two groups are not to be attributed to differences between sexes.
Table 3.
Results of the Multivariate Procrustes ANOVA between the dependent variable of symmetric shape and the independent variables of “group” (wild and captive) and “sex” and their interaction. Asterisks indicate significance: * p-value ≤ 0.05; ** p-value ≤ 0.01; *** p-value ≤ 0.001.
Figure 4 shows the PCA of the asymmetric shape, produced following [35]. The vectors represent individual deviations from perfect symmetry (the origin of the graph). The length of the asymmetry vectors is interpreted as the individual degree of morphological asymmetry, independent of the direction of the vector, which specifies the morphological variations and patterns of asymmetry.
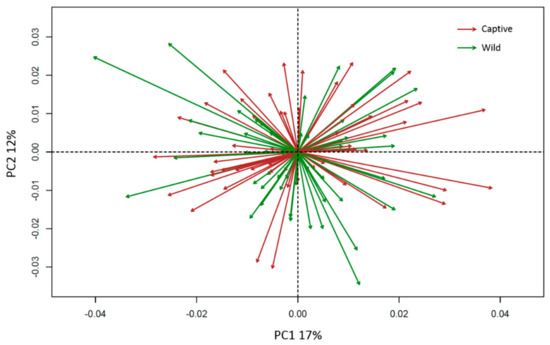
Figure 4.
PCA showing the asymmetric vectors of variation departing from the origin (perfect symmetry). The colours indicate the group: green for wild, brown for captive; PC1 and PC2 explain 17% and 12% of total variance, respectively.
The results of the asymmetric PCA (Figure 4, PC1 17%, PC2 12% of total variance) suggest that there is lack of directionality in both wild and captive groups, because the vectors look uniformly distributed both in length and direction between negative and positive values along PC1 and PC2. Three-dimensional mesh warpings of the asymmetric PCA along PC1 and PC2 are presented below (Figure 5). The asymmetric PC1 records a left-right difference in the placing of the upper region of the rami, affecting the position of the condyles, and in the relative left-right positioning of the gonial region. The PC2 seems to record slight asymmetry in the anterior region of the mandible.
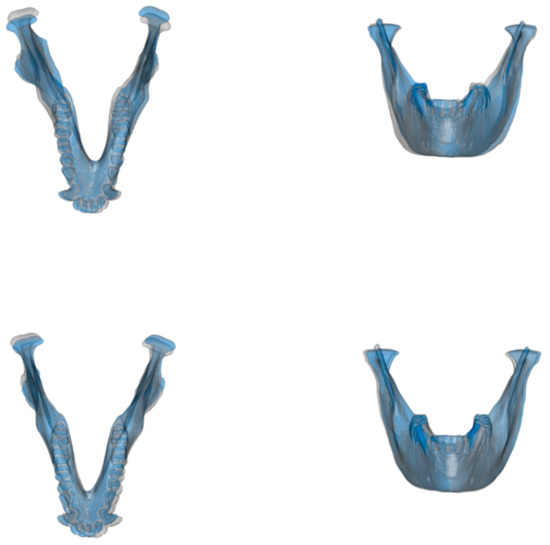
Figure 5.
Surface warpings of the extremes of PC1 (top) and PC2 (below) of the asymmetric PCA. The grey surface indicates minimum (negative) values while the blue surface indicates maximum (positive) values along the PCA axes.
Figure 6 shows the density distribution of the asymmetric PC scores of wild and captive individuals along PC1 and PC2. The percentage of positive and negative values was calculated to visualise and estimate directionality along the first two components. Individuals are spread almost equally on either side of the PC scores along PC1 and PC2, as shown by the percentages of data on either side of the distribution approaching 50% for both captive and wild individuals. This indicates non-directionality in the asymmetry patterns, as suggested by the PCA in Figure 4. In addition, the relative proportion of the directional and fluctuating asymmetric components in a sum-of-squares decomposition of total asymmetry was estimated to be as 0.03% and 99.97% respectively.
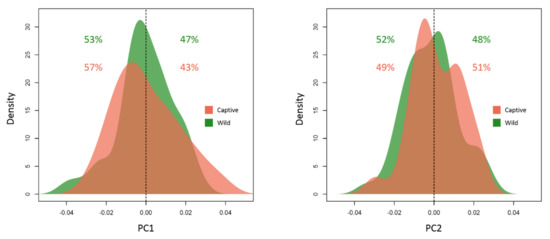
Figure 6.
Distribution of PC scores along the first two asymmetric PC axes. The percentages indicate the proportion of individuals below and above zero (perfect symmetry) for captive (brown) and wild (green) individuals.
To test for differences among groups (wild/captive) and sex in the overall asymmetric shape space, a Multivariate Procrustes ANOVA was performed between the dependent variable of asymmetric shape and the independent variables of “group” and “sex” (Table 4).
Table 4.
Results of the Multivariate Procrustes ANOVA between the dependent variable of asymmetric shape and the independent variables of “group” (wild and captive) and “sex” and their interaction. Asterisks indicate significance: * p-value ≤ 0.05; ** p-value ≤ 0.01; *** p-value ≤ 0.001.
The results of Table 4 indicate that the asymmetric component of shape cannot be discriminated based on sex, group or their interaction (non-significant p-values). This might indicate that if fluctuating asymmetry is present, as the PCA in Figure 4, the distribution plot of Figure 6 and the decomposition of variance seem to suggest, the wild/captive condition does not influence it, nor possessing more masculine or feminine characteristics.
Last, following a traditional approach to the analysis of asymmetry, we performed a Multivariate Procrustes ANOVA (Table 5). A series of independent variables were defined: individual, reflection (intended as the original and reflected datasets), group (captive/wild), size, and sex, and tested against the dependent variable of overall shape.
Table 5.
Results of the Procrustes ANOVA between the dependent variable of shape and the independent variables of “individual”, “reflection”, “group” (wild and captive), “sex”, “size” and the joint effect of “individual per reflection” and “individual per group”. Asterisks indicate significance: * p-value ≤ 0.05; ** p-value ≤ 0.01; *** p-value ≤ 0.001.
Results from the Procrustes ANOVA (Table 5) shows that prevalently sex (p-value = 0.001 ***, R2 = 0.13), but also group (wild/captive, p-value = 0.001 ***, R2 = 0.065) and size (p-value = 0.001 ***, R2 = 0.05) impact on the overall mandibular shape, suggesting that sexual dimorphism, allometry, and environmental conditions directly influence the way in which the mandible develops and reach its final morphology. However, when the overall mandibular morphology is put in relation to asymmetry, both directional (reflection), fluctuating (individual × reflection) and group asymmetry (group × reflection) show no significant results. These results suggest that the presence of fluctuating asymmetry observed in the first two principal components of the PCA in Figure 4 does not have a significant impact when the overall shape space is analysed.
4. Discussion
Fluctuating asymmetry has been used in recent and past literature as a way of measuring the morphological fitness and wellbeing of an individual, a group or a population in relation to the environment in which they live [5,18,45,46]. This article analyses the differences in magnitude and patterns of FA in the mandible of wild and captive Macaca fuscata to address the potential impact of captivity stressors on primate skeletal morphology. Our hypothesis holds that the captive macaques show a significantly higher degree of FA than the wild group due to the stress of an enclosed environment (with all its limitations regarding diet, mobility, etc.). Conflicting results and differences in the methodologies used in previous studies have led to uncertainty about the efficacy and consistency of FA in registering developmental instability [32]. In this paper, we used a combination of methods to address the presence and impact of FA on the morphology of captive individuals, thus overcoming the ambiguities of previous literature.
Our results indicate that the mandibles of captive and wild M. fuscata show distinct morphologies, as do the mandibles of male and female individuals. Such differences are significant for the overall morphology (Table 5) and the symmetric component (Table 3). The shape differences associated with sex and group (captive/wild) seem independent. If captivity does affect mandibular shape, it appears that the impact is not differential between females and males, whose mandibles vary independently from captivity. The anterior region of the mandible and the rami appear to be the major source of morphological variation in the symmetric component (Figure 3). These findings confirm the results observed by [33] about a morphological difference in the mandible of captive and wild M. fuscata. The most direct interpretation of our findings would be that the captive conditions could influence the overall shape of the macaque mandible. Nevertheless, caution must be applied because several potentially relevant factors were not tested in this work. For example, a dissimilar age composition in the wild and captive samples may drive the observed differences. We tried to limit the effect of age by only including individuals with fully erupted third molar.
Asymmetry in the positioning of mandibular condyles and in the orientation of the gonial region was highlighted by the PCA of the asymmetric shape (Figure 5). The presence of fluctuating, instead of directional, asymmetry was suggested by the distribution of the PC scores (Figure 6) along the first two principal components of the asymmetric shape, and demonstrated by the decomposition of total asymmetry (99.97% of total variance was attributable to FA). However, no significant difference in asymmetry (fluctuating or directional) was found between the captive and wild M. fuscata, regardless of the approach used [35,39]. The non-significant association between asymmetry, group (captive/wild) and sex (Table 4), and the non-significant impact of FA on the overall morphology (Table 5), suggest that FA is of negligible magnitude in the sample analysed.
Based on the findings above, three interpretations can be put forward:
- (1)
- The stress associated with the captive conditions of the individuals analysed was not strong enough to trigger a change in FA. In this case, captivity may not impose sufficient environmental stress to trigger a response in the asymmetry pattern of the mandible.
- (2)
- FA is not a good indicator to detect environmental stress, at least in the conditions and for the species analysed.
- (3)
- The mandible is not an ideal region to identify developmental stress using FA.
The shape differences observed here between captive and wild M. fuscata (when overall shape and the symmetric components are analysed) suggest that captivity has exerted pressures on development. In addition, even accounting for the limitations of our analysis, morphological differences between captive and wild mammal species have long been recognised [30], thus suggesting that captivity does have an impact on the developing morphology. Whether captivity (or, in general, environmental stress) tends to affect only the overall shape, skeletal symmetry, or both is still highly uncertain, although it has been suggested that FA and phenotypic variance arise from at least partially overlapping processes [21]. Based on these considerations, we would tend to discard the first interpretation, that the negligible FA found here is due to lack of captivity stressors.
The other two interpretations may both provide a persuasive explanation for the observed results. The use of FA as a universal measure of stress has been criticised on the ground of controversial and case-dependent results [32], likely because the mechanisms with which asymmetry develops are not fully understood and may not be extended to all animals in all environmental conditions. Additionally, it has been suggested that highly functional regions may be less prone to develop asymmetry because of the pressures to maintain their practical utility [31]. Asymmetry has been shown to increase masticatory stress in humans with mandibular deformities [47], which offers a partial indication that mandibular asymmetry can reduce performance during mastication. Based on these premises, the mandible of M. fuscata may not be a suitable region to be analysed when studying asymmetry.
In summary, this work contributes to the debate about the efficacy of FA as an indicator of environmental stress and suggests caution when inferring stress from FA measured on functional regions. In addition, our findings suggest that captivity can provide stressful conditions to alter the normal morphology of the mandible, although asymmetry (as measured in this work) can be unaffected. Nevertheless, a cautionary approach must be held when interpreting these results, and future studies should investigate other factors (e.g., development, diet) to draw conclusive deductions.
Author Contributions
F.L.: conceptualisation, project administration, methodology, formal analysis, software, validation, visualisation, writing (original draft, review, and editing); F.A.: data curation, methodology, investigation, writing (review and editing); I.T.: data curation, formal analysis, writing (review and editing); A.P.: Formal analysis, methodology, software, writing (review and editing); A.V.: conceptualisation, project administration, supervision, methodology, formal analysis, software, writing (original draft, review, and editing). All authors have read and agreed to the published version of the manuscript.
Funding
The authors received no funding for this research.
Institutional Review Board Statement
Not applicable.
Informed Consent Statement
Not applicable.
Data Availability Statement
The corresponding author can share the landmark data used in the study upon request. The CT-scans are available from the Digital Morphology Museum, KUPRI, upon request (http://dmm.pri.kyoto-u.ac.jp/dmm/WebGallery/index.html). The CT data were accessed on 20 March 2021.
Acknowledgments
The authors thank the Primate Research Institute (PRI), Kyoto University, Inuyama for giving access to their collections. In particular, we are grateful to Tsuyoshi Ito for the valuable information about the collection and specimens of Macaca fuscata used in this study and for his advice provided throughout the work.
Conflicts of Interest
The authors declare no conflict of interest.
Ethical Statement
All the specimens died naturally and were subsequently scanned when found and digitalised for museum and research purposes. No animals were sacrificed for the purpose of the study. All the material on the Digital Morphology Museum KUPRI website is free to download upon request, and only require proper mention during publication.
References
- Costa, M.; Mateus, R.P.; Moura, M.O. Constant fluctuating asymmetry but not directional asymmetry along the geographic distribution of Drosophila antonietae (Diptera, Drosophilidae). Rev. Bras. Entomol. 2015, 59, 337–342. [Google Scholar] [CrossRef]
- Hallgrímsson, B. Fluctuating Asymmetry in the Mammalian Skeleton. In Evolutionary Biology; Hecht, M.K., Macintyre, R.J., Clegg, M.T., Eds.; Springer: Boston, MA, USA, 1988. [Google Scholar]
- Hallgrímsson, B. Fluctuating asymmetry in Macaca fascicularis: A study of the etiology of developmental noise. Int. J. Primatol. 1993, 14, 421–443. [Google Scholar] [CrossRef]
- Klingenberg, C.P. Developmental instability as a research tool: Using patterns of fluctuating asymmetry to infer the developmental origins of morphological integration. In Developmental Instability: Causes and Consequences; Polak, M., Ed.; Oxford University Press: New York, NY, USA, 2003. [Google Scholar]
- Klingenberg, C.P. Analyzing fluctuating asymmetry with geometric morphometrics: Concepts, methods, and applications. Symmetry 2015, 7, 843–934. [Google Scholar] [CrossRef]
- Klingenberg, C.P.; Barluenga, M.; Meyer, A. Shape analysis of symmetric structures: Quantifying variation among individuals and asymmetry. Evolution 2002, 56, 1909–1920. [Google Scholar] [CrossRef] [PubMed]
- Leung, B.; Forbes, M.R.; Houle, D. Fluctuating asymmetry as a bioindicator of stress: Comparing efficacy of analyses involving multiple traits. Am. Nat. 2000, 155, 101–115. [Google Scholar] [CrossRef] [PubMed]
- Oxilia, G.; Menghi Sartorio, J.C.; Bortolini, E.; Zampirolo, G.; Papini, A.; Boggioni, M.; Martini, S.; Marciani, F.; Arrighi, S.; Figus, C.; et al. Exploring directional and fluctuating asymmetry in the human palate during growth. Am. J. Phys. Anthropol. 2021, 175, 847–864. [Google Scholar] [CrossRef] [PubMed]
- Smith, D.R.; Crespi, B.J.; Bookstein, F.L. Fluctuating asymmetry in the honey bee, Apis mellifera: Effects of ploidy and hybridization. J. Evol. Biol. 1997, 10, 551–574. [Google Scholar] [CrossRef]
- Vervust, B.; Van Dongen, S.; Grbac, I.; Van Damme, R. Fluctuating asymmetry, physiological performance, and stress in island populations of the Italian Wall Lizard (Podarcis sicula). J. Herpetol. 2008, 42, 369–377. [Google Scholar] [CrossRef]
- Zakharov, V.M.; Shadrina, E.G.; Trofimov, I.E. Fluctuating Asymmetry, Developmental Noise and Developmental Stability: Future Prospects for the Population Developmental Biology Approach. Symmetry 2020, 12, 1376. [Google Scholar] [CrossRef]
- Parés-Casanova, P.M. Directional asymmetry in the yellow-bellied slider turtles (Trachemys scripta scripta) (Schoepff 1792). Herpetol. Notes 2020, 13, 587–592. [Google Scholar]
- Abdel Fatah, E.E.; Shirley, N.R.; Mahfouz, M.R.; Auerbach, B.M. A three-dimensional analysis of bilateral directional asymmetry in the human clavicle. Am. J. Phys. Anthropol. 2012, 149, 547–559. [Google Scholar] [CrossRef]
- Ginot, S.; Agret, S.; Claude, J. Bite force performance, fluctuating asymmetry and antisymmetry in the mandible of inbred and outbred wild-derived strains of mice (Mus musculus domesticus). Evol. Biol. 2018, 45, 287–302. [Google Scholar] [CrossRef]
- Dongen, S.V. Fluctuating asymmetry and developmental instability in evolutionary biology: Past, present and future. J. Evol. Biol. 2006, 19, 1727–1743. [Google Scholar] [CrossRef]
- Cuevas-Reyes, P.; Canché-Delgado, A.; Maldonado-López, Y.; Fernandes, G.W.; Oyama, K.; González-Rodríguez, A. Patterns of herbivory and leaf morphology in two Mexican hybrid oak complexes: Importance of fluctuating asymmetry as indicator of environmental stress in hybrid plants. Ecol. Indic. 2018, 90, 164–170. [Google Scholar] [CrossRef]
- DeLeon, V.B. Fluctuating asymmetry and stress in a medieval Nubian population. Am. J. Phys. Anthropol. 2007, 132, 520–534. [Google Scholar] [CrossRef]
- Graham, J.H.; Özener, B. Fluctuating asymmetry of human populations: A review. Symmetry 2016, 8, 154. [Google Scholar] [CrossRef]
- Hallgrímsson, B.; Miyake, T.; Wilmore, K.; Hall, B.K. Embryological origins of developmental stability: Size, shape and fluctuating asymmetry in prenatal random bred mice. J. Exp. Zool. 2003, 296, 40–57. [Google Scholar] [CrossRef] [PubMed]
- Parsons, P.A. Fluctuating asymmetry: An epigenetic measure of stress. Biol. Rev. 1990, 65, 131–145. [Google Scholar] [CrossRef] [PubMed]
- Willmore, K.E.; Klingenberg, C.P.; Hallgrímsson, B. The relationship between fluctuating asymmetry and environmental variance in rhesus macaque skulls. Evolution 2005, 59, 898–909. [Google Scholar] [CrossRef]
- Aparicio, J.M. Patterns of growth and fluctuating asymmetry: The effects of asymmetrical investment in traits with determinate growth. Behav. Ecol. Sociobiol. 2001, 49, 273–282. [Google Scholar] [CrossRef]
- Siegel, M.I.; Doyle, W.J. Stress and fluctuating limb asymmetry in various species of rodents. Growth 1975, 39, 363–369. [Google Scholar]
- Badyaev, A.V.; Foresman, K.R.; Fernandes, M.V. Stress and developmental stability: Vegetation removal causes increased fluctuating asymmetry in shrews. Ecology 2000, 81, 336–345. [Google Scholar] [CrossRef]
- Joyce, B.J.; Brown, G.E. Short-term captivity drives hypothalamic plasticity and asymmetry in wild-caught northern red bellied dace (Chrosomus eos). J. Fish Biol. 2020, 97, 577–582. [Google Scholar] [CrossRef]
- Morgan, K.N.; Tromborg, C.T. Sources of stress in captivity. Appl. Anim. Behav. Sci. 2007, 102, 262–302. [Google Scholar] [CrossRef]
- Clubb, R.; Mason, G. Captivity effects on wide-ranging carnivores. Nature 2003, 425, 473–474. [Google Scholar] [CrossRef] [PubMed]
- Hosey, G.R. How does the zoo environment affect the behaviour of captive primates? Appl. Anim. Behav. Sci. 2005, 90, 107–129. [Google Scholar] [CrossRef]
- Knierim, U.; Van Dongen, S.; Forkman, B.; Tuyttens, F.A.M.; Špinka, M.; Campo, J.L.; Weissengruber, G.E. Fluctuating asymmetry as an animal welfare indicator—A review of methodology and validity. Physiol. Behav. 2007, 92, 398–421. [Google Scholar] [CrossRef] [PubMed]
- Siciliano-Martina, L.; Light, J.E.; Lawing, A.M. Cranial morphology of captive mammals: A meta-analysis. Front. Zool. 2021, 18, 4. [Google Scholar] [CrossRef]
- Almeida, D.; Almodóvar, A.; Nicola, G.G.; Elvira, B. Fluctuating asymmetry, abnormalities and parasitism as indicators of environmental stress in cultured stocks of goldfish and carp. Aquaculture 2008, 279, 120–125. [Google Scholar] [CrossRef]
- Lens, L.U.C.; Van Dongen, S.; Kark, S.; Matthysen, E. Fluctuating asymmetry as an indicator of fitness: Can we bridge the gap between studies? Biol. Rev. 2002, 77, 27–38. [Google Scholar] [CrossRef] [PubMed]
- Kamaluddin, S.N.; Tanaka, M.; Wakamori, H.; Nishimura, T.; Ito, T. Phenotypic plasticity in the mandibular morphology of Japanese macaques: Captive–wild comparison. R. Soc. Open Sci. 2019, 6, 181382. [Google Scholar] [CrossRef]
- Leamy, L. Morphological integration of fluctuating asymmetry in the mouse mandible. Genetica 1993, 89, 139. [Google Scholar] [CrossRef]
- Neubauer, S.; Gunz, P.; Scott, N.A.; Hublin, J.J.; Mitteroecker, P. Evolution of brain lateralization: A shared hominid pattern of endocranial asymmetry is much more variable in humans than in great apes. Sci. Adv. 2020, 6, eaax9935. [Google Scholar] [CrossRef] [PubMed]
- Bookstein, F.L. Morphometric Tools for Landmark Data: Geometry and Biology; Cambridge University Press: New York, NY, USA, 1997. [Google Scholar]
- Mardia, K.V.; Bookstein, F.L.; Moreton, I.J. Statistical assessment of bilateral symmetry of shapes. Biometrika 2000, 87, 285–300. [Google Scholar] [CrossRef]
- Bookstein, F.L.; Green, W.D. Thin-plate spline for deformations with specified derivatives. In Proceedings of the Mathematical Methods in Medical Imaging II Symposium, San Diego, CA, USA, 11–16 July 1993; International Society for Optics and Photonics: Bellingham, WA, USA, 1993; Volume 2035, pp. 14–28. [Google Scholar]
- Klingenberg, C.P.; McIntyre, G.S. Geometric morphometrics of developmental instability: Analyzing patterns of fluctuating asymmetry with Procrustes methods. Evolution 1998, 52, 1363–1375. [Google Scholar] [CrossRef] [PubMed]
- Graham, J.H.; Raz, S.; Hel-Or, H.; Nevo, E. Fluctuating asymmetry: Methods, theory, and applications. Symmetry 2010, 2, 466–540. [Google Scholar] [CrossRef]
- R Core Team. R: A Language and Environment for Statistical Computing; R Foundation for Statistical Computing: Vienna, Austria, 2020; Available online: https://www.R-project.org/(version4.1.1) (accessed on 5 May 2021).
- Profico, A.; Costantino, B.; Silvia, C.; Marina, M.; Paolo, P.; Alessio, V.; Pasquale, R. Arothron: An R package for geometric morphometric methods and virtual anthropology applications. Am. J. Phys. Anthropol. 2021, 176, 144–151. [Google Scholar]
- Schlager, S. Morpho and Rvcg—Shape Analysis in R. In Statistical Shape and Deformation Analysis; Zheng, G., Li, S., Szekely, G., Eds.; Academic Press: London, UK, 2017; pp. 217–256. [Google Scholar]
- Adams, D.C. Otárola-Castillo, E. geomorph: An R package for the collection and analysis of geometric morphometric shape data. Methods Ecol. Evol. 2013, 4, 393–399. [Google Scholar] [CrossRef]
- Hill, A.K.; Cárdenas, R.A.; Wheatley, J.R.; Welling, L.L.; Burriss, R.P.; Claes, P.; Apicella, C.L.; McDaniel, M.A.; Little, A.C.; Shriver, M.D.; et al. Are there vocal cues to human developmental stability? Relationships between facial fluctuating asymmetry and voice attractiveness. Evol. Hum. Behav. 2017, 38, 249–258. [Google Scholar] [CrossRef]
- Schlager, S.; Rüdell, A. Analysis of the human osseous nasal shape—Population differences and sexual dimorphism. Am. J. Phys. Anthropol. 2015, 157, 571–581. [Google Scholar] [CrossRef]
- Cattaneo, P.M.; Kofod, T.; Dalstra, M.; Melsen, B. Using the finite element method to model the biomechanics of the asymmetric mandible before, during and after skeletal correction by distraction osteogenesis. Comput. Methods Biomech. Biomed. Eng. 2005, 8, 157–165. [Google Scholar] [CrossRef] [PubMed]
Publisher’s Note: MDPI stays neutral with regard to jurisdictional claims in published maps and institutional affiliations. |
© 2021 by the authors. Licensee MDPI, Basel, Switzerland. This article is an open access article distributed under the terms and conditions of the Creative Commons Attribution (CC BY) license (https://creativecommons.org/licenses/by/4.0/).