Abstract
Two key mechanisms of the Internet are congestion control in the Transmission Control Protocol (TCP) and Active Queue Management (AQM) in routers. The former divides the bandwidth between flows and prevents the Internet from congestion collapse. Simultaneously, the latter informs hosts of the forthcoming congestion by preventive dropping of packets in network nodes. Although these two key mechanisms may severely interact with each other, they are often being researched independently, in parallel. This has led to the development of a few new congestion controls and AQM algorithms known for excellent performance under the assumption that the counterpart remains unaltered. It is unclear, however, how these new solutions in both areas interact with each other. The purpose of this paper is to fill this gap. Namely, in an extensive set of simulations, the impact of interactions between the state-of-the-art congestion control and AQM algorithms on the TCP connection performance is studied. As a result, recommendations for using some particular TCP-AQM pairs, which are observed to perform especially well, are formulated.
1. Introduction
Congestion is an inevitable phenomenon in many wired and wireless networks as network resources are limited in the available bandwidth. Congestion leads to dropping packets, unreliable transmission, high latency, and small goodput, which causes user frustration and the inability to use the Internet facilities effectively. On the other hand, sending data at a very low rate does not provide acceptable resource utilization and results in a poor user experience. Therefore, every user must send data at the “correct” rate to effectively use the available resources concerning other users. Altogether, this is the main role of congestion control implemented in TCP.
Given that it is impossible to know the capacity and availability of all links between every pair of sender and receiver, dealing with congestion is a critical mechanism for the proper functioning of the Internet. Congestion control is built on the received acknowledgments of the transmitted data. If packets are dropped and not acknowledged, it signals the sending rate is too high. If packets are properly delivered, the sending rate may be lower than the available bandwidth. Basing on this information, the sender can adjust the sending rate to maintain an accurate pace.
TCP remains the only transport protocol that controls the amount of sent data. Its main role is to control the transmission rate to maximize the utilization of the available bandwidth and respond to emerging congestion, provide reliable data delivery, and provide a fair share of link capacity to all competing flows. To maximize throughput, TCP increases the sending rate to the point it causes congestion and dropping of packets, leading to slowing down and recovery from loss. Therefore, designing a TCP behavior is always a problem of finding the optimal formula for a congestion window size that provides a favorable resource utilization yet does not overwhelm the network.
Since the first version of TCP in the 1970s [1], many TCP flavors have been introduced to adapt to the emerging problems, enhanced network capabilities, and varying patterns of user traffic characteristics. With the advancement in network technology, TCP was confronted with numerous problems such as under-utilization of bandwidth, unfairness, unnecessary retransmissions, and non-congestion losses.
TCP variants may be classified based on their behavior: loss-based (reactive), delay-based (proactive), and loss-based with bandwidth estimation or problem-orientated (congestion, reordering, wireless transmission, bandwidth utilization, and fairness issues). The detailed TCP survey with an analysis of strengths and weaknesses and classification of congestion control mechanisms is presented in [2]. Although several dozens of TCP versions exist, only a few are commercially implemented and used. This paper focuses on the TCP versions implemented in currently used operating systems and, according to [2], the most commonly used, i.e., TCP New Reno, TCP Compound, and TCP Cubic.
Most TCP variants lead to persistently full buffer in network nodes, which causes many undesired problems like buffer overflow and bufferbloat (see Section 4 for more details). The problem of buffer overflow is discussed since the early 1980s. In 1998, IETF indicated that the Congestion Avoidance mechanism of TCP, although powerful and essential, should be complemented with Active Queue Management (AQM) in network nodes [3]. The main role of AQM is to predict the incoming congestion and preventively drop some packets to reduce the transmission rate of TCP sources. The AQM should provide high link utilization, along with short and low varying queuing delays, which requires a low and stable queue in the first place.
Since 2015, AQM is recommended by IETF feature in all routers [3]. AQM, along with TCP/IP protocols, are fundamental to closed-loop congestion control and are the main elements of the network infrastructure. Although the problem of reducing and stabilizing end-to-end latency is known and has been discussed for many years, the widespread deployment of any AQM has not happened so far, mainly because of their sensitivity to varying network conditions. Some relatively new AQM schemes, i.e., PIE and CoDel, attempt to tackle the problem of tedious configuration and parametrization. Despite the considerable amount of research on TCP congestion control algorithms and AQM performance, the interdependence of those two mechanisms is yet to be efficiently studied and addressed. The unique characteristics of any congestion avoidance component require a comprehensive analysis under various network conditions.
In this paper, the interactions between the most commonly used TCP versions and state-of-the-art Active Queue Management algorithms are evaluated. We are trying to answer the following questions:
- To what extent an AQM influences the end-to-end congestion control mechanism?
- What are the effects of network parameters, such as RTT variation and congestion level, on the combined TCP and AQM performance?
- Can cross-layer interaction between TCP and AQM overcome the challenges of network heterogeneity and variability?
- Is there one universal TCP-AQM combination for all cases?
The rest of the paper is organized as follows. Section 2 reviews the related research. In Section 3 and Section 4, the evaluated TCP and AQM approaches are described in detail. The performance evaluation of different AQM and TCP combinations in different scenarios is presented in Section 5. Finally, conclusions are provided in Section 6.
2. Related Work
The problem of congestion control is widely discussed in many research papers. The majority of them are focused on a specific key component of the Internet mechanisms evaluated with the assumption that other key components remain unchanged. Moreover, the presented analyses are usually oriented towards a specific purpose, e.g., the buffer size influence or impact of the network heterogeneity on different aspects of transmission performance.
Suffice it to mention several papers related to the evaluation of TCP versions assessed in this paper in conjunction with the Drop Tail (DT) mechanism. The authors of [4] explore the fairness of high-speed TCPs. The broader comparison of high-speed TCPs over the high-BDP network is drawn by Alrshah et al. [5]. In [6], the authors study the interactions between multiple versions of TCP. Another comparison of multiple TCP versions (Cubic and New Reno) in various network scenarios (wired/wireless) is presented in [7]. The authors of [8] perform a similar evaluation concerning Linux versions of TCPs. The analytical tool to compare the TCP versions evaluated in this paper is submitted in [9]; the simulation results and performance analysis are reported in [10].
In this paper, we focus on two AQMs: PIE and CoDel. The comparison of those state-of-the-art AQMs’ limits and hints for tuning and improvement are presented in [11]. The authors also provide a discussion concerning the operational range of both algorithms. The assessment of the introduced delay and bandwidth utilization provided by three different AQMs, namely, ARED, PIE, and CoDel for the sender using TCP Cubic, in the presence of CBR-traffic, is studied in [12]. Different queuing mechanisms, in the presence of TCP Reno, are also evaluated in [13].
A few papers evaluate the cross-layer interaction between end-to-end TCP congestion control and buffer management strategies provided by AQM. In [14], the performance of AQMs in the presence of new versions of the TCP congestion control mechanism is evaluated. The paper focuses on TCP SACK, New Reno, FACK, and Cubic versions and compares RED, AVQ, PI, REM, and AN-AQM along with DT approach. All the evaluated AQM algorithms, although thoroughly discussed and analyzed in many research papers, are not commonly used in commercial buffers due to configuration issues; they do not fall into the category of recommended by RFC 7567 [3] AQMs algorithms. In this paper, the recommended CoDel and PIE are verified against the most widespread TCP versions.
The authors of [15] evaluate RED, PIE, and CoDel, however in combination with TCP Reno, BIC, and Vegas, which are rather less popular TCP flavors. Moreover, the authors use a very simple, real-time testbed consisting of a client, router, and server. The client sends data to the server via the router, and the receiver sends back ACKs via the same router. The results are obtained based on one generated flow. The outcomes presented in this paper are based on a much more diversified and extensive set of simulation scenarios and more common TCP versions.
In the assumptions, those nearest to this paper’s work are presented in [16]. The authors perform a cross-comparison of eight TCP flavors and five AQM variants in several network scenarios. The most significant differences concern network configuration, i.e., link capacity, MTU, as well as the selection of RTT distribution. The authors restrain the bottleneck link to 10 Mbps and MTU to 500 B. Assuming TCP Cubic and Compound were designed for more demanding environments (high speed and high latency) in 10 Mbps simulation, their expected superiority may not be visible. Moreover, the smaller MTU shortens the experienced delay in low-speed networks, however, leads to network under-utilization, especially in high-speed environments. In this paper, the TCP-AQM interactions are evaluated in the Data Center scenario with 1 Gbps links and the Access Link scenario with bandwidth set to 100 Mbps. In both scenarios, a 1500 B MTU is used.
RTT proposed in this paper is based on the recommendations for Data Center and Access Link scenarios provided in [17]. The selected values are supposed to provide a “realistic distribution of round-trip times for traffic on the central link”. In the aforementioned paper, the authors use their own uniformly distributed proposition of RTT settings.
Summarizing, the novelty of this paper lies in the following: (1) comparison of TCP-AQM pairs in classic network scenarios, (2) evaluation of the most common combinations of TCPs and modern AQMs, and (3) verification of how the most widespread TCP versions interact with each other in combination with AQMs in representative network scenarios.
3. TCP Variants
Not all proposed in the literature TCP versions are available in common operating systems. Only a few of them gained popularity and are provided for everyday usage. In this section, the most popular and widespread TCP versions are recalled.
3.1. TCP New Reno with SACK
TCP New Reno is implemented in most operating systems, along with SACK (Selective Acknowledgment) support. It is the default version used by Windows 10 and Windows Server 2016 operating systems and FreeBSD.
TCP New Reno is an improved version of TCP Reno [18]. It modifies only the Fast Recovery phase, while other phases are identical to TCP Reno, which is based on one of the earliest versions of TCP, i.e., TCP Tahoe proposed by Jacobson [19]. The congestion window of TCP New Reno increases exponentially in the Slow Start phase and linearly in the Congestion Avoidance phase. When duplicated ACKs are received, the congestion is detected, the congestion window is reduced by half, and the Fast Recovery phase is started.
TCP New Reno overcomes the problem of multiple losses, which causes reducing the congestion window multiple times. TCP New Reno remains in the Fast Recovery phase until all outstanding segments, at the time it enters the Fast Recovery, are acknowledged. During this phase, it may retransmit multiple loss segments before returning to the Congestion Avoidance phase.
Without SACK, New Reno requires one RTT to detect each packet loss. SACK allows acknowledging the received packets selectively; therefore, it improves the recovery from multiple losses. Each ACK has a block that describes which segments have already been received and do not require retransmission.
The main flaw of TCP New Reno is its poor bandwidth utilization in high-speed environments with moderate or high RTTs, e.g., in a network having 10 Gbps capacity, 100 ms RTT, and a maximum packet size of 1500 bytes, it would take almost two hours of error-free transmission to get to a theoretical upper bound of transfer rate [20].
3.2. TCP Cubic
TCP Cubic [21] has been the default congestion control algorithm in Linux, Android, and iOS since 2018, and it is also the default version in Windows Server 2019.
The main design objective of TCP Cubic is to provide effective bandwidth utilization in high-speed scenarios and provide RTT and inter-TCP fairness to other competing flows. The main idea is to slow down the increase of the congestion window () when the previous network maximum is achieved (concave increase) and increase it rapidly if the threshold is surpassed without a loss (convex increase). This is achieved using a cubic function for the congestion window size (instead of linear):
where C is a predefined constant, is the time elapsed since the last congestion event, is a coefficient of the multiplicative decrease in the Fast Recovery phase, and is the observed congestion window size just before the last registered loss. The function of the congestion window growth results in a very fast rise in the transmission rate after loss detection and entering the Fast Recovery phase. The closer to the target value of the congestion window , the slower increase in the growth rate. TCP Cubic improves scalability and stability under fast and long-distance networks. It ensures that the achieved throughput is not lower than the throughput achieved by TCP New Reno by providing that is set to in the case it would be lower when calculated using Equation (1).
TCP Cubic is based on BIC TCP (Binary Increase Congestion control) [22], which extends TCP New Reno with an additional phase meant to rapidly discover, in a binary search manner, the optimal congestion window value. The main advantage of Cubic is its RTT-independent congestion window growth function, which improves the RTT fairness.
3.3. TCP Compound
TCP Compound (C-TCP) [23] is a Microsoft algorithm. It was implemented in Windows XP (as a patch), Vista, and Windows 7. It is also available in Windows 10 and Windows Server 2016, as well as in the Linux kernel. According to the work in [2], it was the most deployed version of TCP in 2010, owing to the fact that it has replaced the conventional congestion control in Windows operating systems since Windows Vista and Windows 2008 Server. However, in Windows 10, the default congestion control was set to New Reno and Windows Server 2019 uses Cubic by default, therefore its commonness dropped.
The first objective of TCP Compound is to fully utilize the available bandwidth in high-speed and long-distance networks (high BDP) and provide RTT- and inter-TCP fairness at the same time. The algorithm uses a delay-based estimator of the network state (based on TCP Vegas [24]) to combine the Reno-type congestion control with a scalable component of congestion control derived from High-Speed TCP (HS-TCP) [20].
The congestion window increases exponentially in the Slow Start phase, identical to TCP Reno Slow Start. In the Congestion Avoidance phase, the window size () is the sum of the standard congestion window (), calculated as in Reno and the additional parameter (), which is calculated as follows:
where and are predefined constants, is an increase coefficient in the Congestion Avoidance phase, and is a decrease factor after a loss detection. is the Vegas estimator of network buffering. If it is below , the congestion window increases according to the HS-TCP rule. If it exceeds the threshold, the additional component is gently reduced to provide a smooth transition between the aggressive behavior of HS-TCP and the much slower Reno mode.
The main flaw of C-TCP is inherited from TCP Vegas and affects the accuracy of the estimator. If a competing flow observes the minimal RTT value that already consists of a buffering delay caused by an already existing flow, it behaves much more aggressively and unfairly to other flows.
4. AQM Algorithms
Packet buffers are essential elements of a network router. They compensate for the traffic bursts, which are a natural consequence of the best-effort nature of the network. However, the unwelcome consequence of buffering is an additional packet delay, which affects the performance of interactive and transaction-based applications. High and variable latency may also impair the congestion control mechanism of TCP. The main problems with buffers are buffer overflows and so-called bufferbloat, i.e., “persistently full buffer” [25]. Buffer overflows are caused by bottlenecks that result from a decrease in the transmission rate or at the convergence point of many links.
Throughout the last 20 years, despite the awareness and dramatic increase in the buffer memory size and memory access speed up, the problem still affects network performance. Actually, the increase of memory size and availability is the main cause of bufferbloat, and the solution for this is AQM. With the increased usage of the Internet as well as the change in traffic characteristics due to the growth of video streaming and time-critical traffic (video conferences, VoIP, and gaming), the urge for proper buffer management is even more critical.
The main limitation of most AQM algorithms is that they are vulnerable to parameters’ tuning and require adapting of parameters when the network condition changes. This is probably the most important reason why AQMs (as RED, for example), although thoroughly researched, are not commonly deployed. Drop Tail is still the most popular buffer management strategy applied at routers, resulting in packet drops only when the buffer is full.
The purpose of any Active Queue Management algorithm is to control the queue size to reduce its variability and queuing delay and preserve the possibility of absorbing packet bursts at the same time. An extensive survey of Active Queue Management schemes, developed and evaluated in the last decades, has been published by Adams [26]. Two state-of-the-art AQM algorithms that address the problem of bufferbloat along and provide a parameterless configuration are presented below.
4.1. PIE
The main purpose of the Proportional Integral Enhanced (PIE) controller [27] is to deal with a bufferbloat problem by effectively controlling the average queuing delay to a target value and providing high bandwidth utilization under varying conditions at the same time. PIE is an enhancement to the Proportional Integral (PI) controller. Assumptions that stand behind PIE design are straightforward implementation and scalability in high-speed networks. In contrast to PI, PIE parameters are auto-tuned.
On a reception, PIE drops a packet randomly with a probability p before enqueuing. When the packet is dequeued, PIE calculates the average dequeue rate . This value is used to estimate the available bandwidth and to track its variation. The calculations are performed in measurement cycles. If the current queue length exceeds a defined threshold (set to 16 kB by default), a new measurement cycle is started, during which PIE keeps track of the summed size of dequeued packets. The threshold should mean that the measurements are carried out when the queue backlog is large enough; such a precaution provides a meaningful estimate of the dequeue rate. The measurement cycle ends when the number of dequeued bytes exceeds the defined threshold. Then, PIE computes the dequeue rate and derives the average dequeue rate as a weighted average of the previous average dequeue rate and the last dequeue rate sample.
For every interval rate (15 ms as recommended by [27] ), the current queuing delay is updated—from the Little’s Law—as a ratio of the current queue length and the estimated average dequeue rate . The dropping probability p is also updated as a linear combination of the previous value, the difference between the current queue delay and the reference value (weighted by a parameter ), and the difference between the current queue delay and the previous queue delay (weighted by a parameter ). PIE steady state is achieved when the current queue delay equals the reference queue delay. PIE scales parameters and to adapt the dropping probability to the current network conditions. Summarizing, in every rate interval, the following calculations occur:
Basing on the current value of dropping probability p, the scale parameters and are determined as follows:
where and are the initial values of both parameters.
The main problem of PIE in the real world comes from the implementation. Linux traffic control module dequeues several packets simultaneously, which influences the average dequeue rate, which is closer to the estimated rate at which packets are stored in the device driver’s transmission ring. To overcome this issue, the authors of [28] proposed using packet timestamps for dequeue rate calculations. Moreover, in [29], the authors claim that in 100 Mbps and faster networks, adapting the results in shorter standing queues.
4.2. CoDel
The CoDel (Controlled Delay) algorithm was first presented in [25] and was published as RFC 8289 document [30]. Its main purpose is to control and provide low delays while permitting bursts of traffic. The superiority of CoDel over other AQMs is also the lack of configuration. It is parameterless and insensitive to varied round-trip delays, link rates, and traffic loads.
Implementation of CoDel is based on the idea of distinguishing a good queue that allows maintaining the 100% link utilization from a bad queue, resulting from setting a congestion window over the pipe size, which persists in a queue for several RTTs. As long as the good queue is acceptable and beneficial, the bad queue should be avoided.
Many AQMs use the average queue length as an indicator of congestion. However, the metric is sensitive to the process of estimation and measurement. CoDel consists of three main components: an estimator, a set point, and a control loop.
CoDel tries to distinguish the bad queue from the good queue. The good queue may be ignored as it will disappear in the RTT whatsoever. The bad queue should be handled. The distinction is made based on the delay. CoDel uses sojourn time to estimate the congestion. If there is at least one packet with zero sojourn time, the queue is not persistent (it is a good queue). The packet sojourn time is measured when the packet is dequeued for transmission.
CoDel switches between a dropping state (bad queue detected) and a non-dropping state. It starts in the non-dropping state. The persistent queue is detected by tracking the minimum experienced packet delay in intervals. The sojourn time is compared to the target value (5 ms by default), and if it is above, a timer is started. As long as the noticed sojourn times remain above the target value, the timer is running. If it reaches the value of the interval ( 100 ms by default), CoDel enters the dropping state.
During the dropping state, CoDel drops a packet and resets the interval timer; the number of dropped packets is tracked using the parameter . The dropping and resetting of the timer are repeated until the sojourn time gets below the target value. When a single packet is dropped, the interval value is reduced by the square root of the number of drops, as follows:
Thus, CoDel drops a packet only every to give senders time to reduce transmission rate.
When CoDel returns to the non-dropping state, it restores the default values for the target delay and the interval, while the number of dropped packets is set to zero. The set point target of 5% of nominal RTT (5 ms for 100 ms RTT) yields substantial utilization improvement for the small added delay. The predefined values of the target and the interval length were determined via experiments. In [25], the authors provide discussion and justification for their selection.
The main advantage of CoDel is its lack of configuration and easy implementation, as the only addition to packet arrival is the timestamp registered for each packet. However, the authors of [31] noticed that the default target value should be tuned “to be at least the transmission time of a single MTU-size packet at the prevalent egress link speed”. In wireless low-speed access networks, it may be at least 15 ms.
5. Performance Evaluation
The purpose of the simulations was to verify how the most commonly used TCP congestion control algorithms interact with the state-of-the-art Active Queue Management approaches. Simulations were carried out using ns-3, release 3.30 with added TCP Cubic [32], and TCP Compound [33] implementations. The simulation network was configured based on the topology and scenarios presented in [17] and described in detail below.
The standard dumbbell topology with two routers and six nodes (N1–N6) was used (see Figure 1). The simulations were carried out using two basic scenarios presented in [17], i.e., Data Center and Access Link.
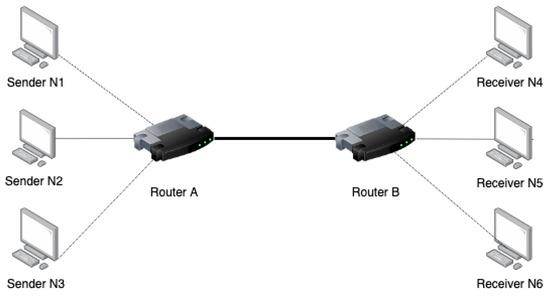
Figure 1.
The dumbbell topology.
The Data Center scenario modeled a high-speed network with low delays. All links had a capacity of 1 Gbps. Links between nodes N1, N2, N4, and the router had 10 s delay, links between nodes N3, N5, N6, and the router had 100 s delay; the central link introduced no delay (0 ms). The average RTT of all nine connections was around 200 s. The recommended buffer size should absorb 10 s of traffic which, assuming 1500 B sized packets, was 900 packets.
In the Access Link scenario, every link rate was set to 100 Mbps, the propagation delay between routers A-B was set to 2 ms. The one-way propagation delays were distributed from 0 ms to 75 ms. The RTT values for all connections are gathered in Table 1. According to the work in [17], this is a representative distribution of RTTs on the central link. The buffer size was set according to the BDP rule (using the mean RTT), which was 900 packets.

Table 1.
Values of RTT [ms] between all node pairs.
TCP sources were located in nodes N1–N3, nodes N4–N6 acted as data recipients. All TCP flows used 1500-byte packets. The total number of TCP flows was set according to the assumed congestion scenario. Three congestion scenarios were considered: the uncongested network (9 flows), mild congestion (90 flows), and heavy congestion (900 flows). Flows were started randomly during the first three seconds. Simulations were carried out for 100 s.
For every scenario, the simulations were performed for a single TCP version (common TCP) or all TCP versions simultaneously (mixed TCPs). In the common TCP scenario sets, the same TCP congestion control mechanism for all nodes was used throughout the simulation. Simulations were carried out for each TCP algorithm in combination with every buffer management strategy and every congestion state. In the mixed TCPs scenario set, node N1 used TCP New Reno, node N2 used TCP Compound, and node N3 used TCP Cubic. Simulations were executed for each AQM and DT pair under varying congestion state.
Although PIE and CoDel should not require any configuration, according to the work in [29], even in 100 Mbps, the default reference value of delay set to 20 ms results in PIE acting as a simple DT, which was verified through the simulation. Therefore, in 1 Gbps and 100 Mbps networks, the target delay variable of PIE was set to 2 ms and 5 ms, respectively. Moreover, to provide comparable results for CoDel in the Data Center scenario, the sojourn time was also set to 2 ms.
To compare the obtained results, the overall throughput of the bottleneck link was monitored, as well as the mean queue length, the standard deviation of queue length, and the drop ratio at router A. The simulations lasted for 100 s, but the first 30 s were used for stabilization. Therefore, the queue measurements were taken from the 30th second of the simulation. The mean throughput for each flow was also calculated. Jain’s index was computed to evaluate the fairness of link sharing between competing flows. The Jain’s index calculated for different flow combinations is interpreted as inter-, intra-, or RTT-fairness. The inter-fairness indicated a fair share among flows using the same TCP congestion control mechanism. The intra-fairness concerned flows that use different TCP versions, and RTT-fairness applied to flows transmitted through links with different RTT values.
5.1. Data Center Scenario, Common TCP
The first simulation set is supposed to verify the overall performance and the cross-layer interactions between AQMs and TCP congestion control mechanisms in the Data Center scenario, i.e., with high-speed links and very short propagation delays, under the varying traffic load. The simulation results are gathered in the following tables. Table 2 presents the quartiles of single flows’ throughput. Table 3 gives the Jain’s index (inter-fairness) among all flows. Table 4 compares the average queue size with standard deviation and finally, Table 5 presents the packet drop ratio at the bottleneck link.
Table 2.
Quartiles of flows’ throughput [Mbps] in the Data center scenario with common TCPs, UC—uncongested, MC—mildly congested, HC—heavily congested network.
Table 3.
Jain’s index (fairness) among long-lived flows in the Data center scenario with common TCPs, UC—uncongested, MC—mildly congested, HC—-heavily congested network.
Table 4.
Mean queue length and standard deviation of queue length [pkts] in the Data center scenario with common TCPs, UC—uncongested, MC—mildly congested, HC—heavily congested network.
Table 5.
Packet drop ratio [%] in the Data center scenario with common TCPs, UC—uncongested, MC—mildly congested, HC—heavily congested network.
The overall throughput is very similar for all TCPs and AQMs interactions; it varies from 0.92 to 0.93 Gbps in the uncongested network to 0.95–0.96 Gbps during heavy congestion. Neither the AQM algorithm nor the TCP version influences the bandwidth utilization. It also implies that the average throughput of every TCP connection is similar and equal to 103, 10.5, and 1.05 Mbps in uncongested, mildly, and heavily congested networks, respectively. However, when comparing the median values as well as the first and the third quartile of the flow’s throughput (see Table 2), the differences are significant.
First of all, regardless of the traffic load, the worst results, in terms of fairness, are observed for TCP Cubic and DT combinations. The median throughput is far below the average and, the flows’ throughput distribution does not appear uniform. More precisely, during heavy congestion, DT with all TCPs is not able to provide acceptable fairness. It is not surprising, given the fact that only around 10 to 15% of all streams are able to transmit data packets effectively. Most connections are not even established due to continuous losses.
Replacing DT with PIE or CoDel notably improves the fairness and similarity of the mean throughput registered by every flow (Table 2). It is also visible when comparing the Jain’s index (Table 3); in the majority of all interactions with PIE or CoDel, it is equal or almost equal to 1.00. However, it is worth mentioning that in the uncongested network, C-TCP with DT provides better results in terms of fairness and throughput variations than in combination with any AQM. Nonetheless, the higher the network load, the poorer inter-fairness yielded by C-TCP and DT.
In Table 4, the average queue size and standard deviation of the queue size are listed. The queue length variation over simulation time is depicted in Figure 2 (uncongested network), Figure 3 (during mild congestion), and Figure 4 (during heavy congestion).
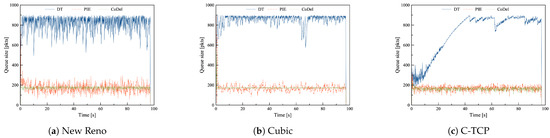
Figure 2.
The queue length of DT, PIE and CoDel in combination with (a) New Reno, (b) Cubic, and (c) C-TCP in the Data center scenario with common TCPs in uncongested network.
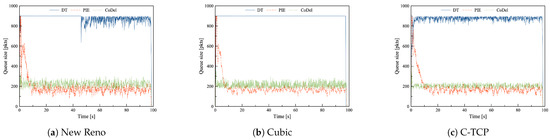
Figure 3.
The queue length of DT, PIE and CoDel in combination with (a) New Reno, (b) Cubic, and (c) C-TCP in the Data center scenario with common TCPs during mild congestion.
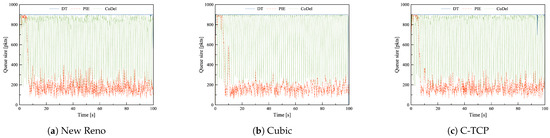
Figure 4.
The queue length of DT, PIE and CoDel in combination with (a) New Reno, (b) Cubic, and (c) C-TCP in the Data center scenario with common TCPs during heavy congestion.
The highest values of the average queue size are noticed for all DT cases since DT fills the entire buffer before dropping packets. Moreover, in the uncongested network, DT causes major queue size variations, which implies the high variability of experienced delay. PIE and CoDel significantly reduce the average queue size and its variability. In the uncongested network, the best results in terms of queue length and stability are observed for CoDel and C-TCP.
In the mildly congested network, both AQMs—PIE and CoDel—with any TCP combination, provide rather stable and much shorter than DT queues. There are no significant differences for any TCP-AQM pair. PIE in all TCP interactions yields shorter queues; actually, the average queue size of PIE is similar in all load scenarios. The average queue size provided by CoDel heavily depends on the congestion. Once again, in this load scenario, the most stable queue provides C-TCP and CoDel combination.
During heavy congestion, PIE results in notably smaller average queue size and much lower queue size variations than any other buffer management strategy. In Figure 4, it is visible that PIE allows filling the buffer at first but eventually stabilizes the queue around the target value. CoDEL with any TCP introduces enormous variability. The queue oscillates between the maximum and the target value, which results in high latency variations.
In Table 5, the summarized drop ratio at the bottleneck bandwidth is listed. In the uncongested network, the drop ratio is negligible. When the traffic load increases, the number of losses intensifies. It may appear that the best results in terms of packet loss ratio may be achieved when DT is used, but we have to keep in mind that in the mildly or heavily congested networks, only some part of all flows can perform an effective transmission. In all cases with any AQM, the drop ratio is comparable. Note that PIE with all TCPs causes a slightly higher drop ratio than CoDel and TCP Cubic with any AQM leads to more losses in comparison to New Reno or C-TCP.
The presented results reveal that regardless of the applied TCP, there are problems that can be addressed by improving the buffer management strategy. As the congestion grows, CoDel has difficulty in maintaining a short and stable queue. The CoDel’s sensitivity to network load was suggested in [11], and the above results confirm this dependence in a high-speed network scenario. CoDel allows filling the whole buffer because, during the dropping state, it drops a packet every , which is updated as per Equation (5) and under heavy congestion, it is not enough. To prevent this behavior, the update parameter should be tuned to provide faster response time in high-speed networks. The default value of is set to the value of nominal RTT, and in this scenario the average RTT is 500 times smaller. However, it should be verified via simulation if tuning only the interval parameter is enough.
Summary:
- Replacing DT with PIE or CoDel considerably improves the achievable fairness, the experienced delay, as well as delay variations for all evaluated TCP congestion control mechanisms.
- PIE provides satisfactory and comparable results regarding fairness, drop ratio, and queue stability in all network load scenarios.
- TCP Compound provides satisfactory fairness and transmission efficiency even with DT in the uncongested and mildly congested network.
- The following combinations provide the best results in terms of satisfactory fairness, delay, and drop ratio at the same time: CoDel with C-TCP (for uncongested and mildly congested network) and PIE with any TCP (during heavy congestion).
5.2. Access Link, Common TCP
The second simulation group was supposed to verify the performance and interactions in a more common scenario with a different delay set to each link, representing the access link connecting an institution to an Internet Service Provider (ISP) [17]. The results are gathered in the following tables. Table 6 presents the quartiles of single flows’ throughput. Table 7 compares Jain’s index (RTT-fairness) for all flows. Table 8 gives the average queue size with its standard deviation, and Table 9 shows the packet drop ratio.
Table 6.
Quartiles of flows’ throughput [Mbps] in the Access Link scenario with common TCPs, UC—uncongested, MC—mildly congested, HC—heavily congested network.
Table 7.
Jain’s index (fairness) among long-lived flows in the Access Link scenario with common TCPs, UC–uncongested, MC—mildly congested, HC—heavily congested network.
Table 8.
Mean queue length and standard deviation of queue length [pkts] in the Access Link scenario with common TCPs, UC—uncongested, MC—mildly congested, HC—heavily congested network.
Table 9.
Packet drop ratio [%] in the Access Link scenario with common TCPs, UC—uncongested, MC—mildly congested, HC—heavily congested network.
Introducing the varied RTT did not change the overall throughput. This is because neither the AQM algorithm nor the TCP version influences the bandwidth utilization, which is approximately 93–95%. It also implies that the average throughput of TCP connections is comparable in all cases. However, the throughputs of particular flows are significantly different. It is visible when we compare the quartiles of single flows’ throughput (Table 6) and Jain’s index (Table 7).
Varied RTT highly influences how the bandwidth is shared among all long-lived flows. In the analogous DC scenario, all evaluated TCPs combined with both AQMs, provide very high fairness (Jain’s index around 1); in this scenario, especially in uncongested and mildly congested networks, achieving even close results proved unattainable.
In the uncongested and mildly congested network, the worst results in terms of equal bandwidth sharing are observed for two interactions, i.e., New Reno and Cubic with DT; the median throughput is far below the average, the Jain’s index is also low. Moreover, New Reno, even with PIE or CoDel, does not provide satisfactory results in terms of RTT-fairness. Similarly, as in the DC scenario with common TCPs (see Section 5.1), the C-TCP and DT combination yields the highest RTT-fairness. Note that Cubic, especially in the mildly congested network, benefits the most from replacing DT with PIE or CoDel. TCP Cubic preserves higher fairness than the other two protocols because the congestion window growth function is independent of RTT.
In a heavily congested network, the fairness provided by any TCP combined with PIE or CoDel is significantly better than in combination with DT. Nevertheless, the values of Jain’s index are noticeably worse than in the Data Center scenario, which implies that the varied RTT hinders providing a fair share of the bottleneck bandwidth.
The queue size and stability dependence on the TCP version and buffer management strategy are presented in Table 8. In the DC scenario, we could observe that the average queue size and its stability depend on the level of congestion and the buffer management strategy applied at the router. In this scenario, it is apparent that the TCP version also influences the queue behavior. In most cases, TCP Cubic leads to slightly higher average queue size in comparison to New Reno and C-TCP.
In the uncongested network, Drop Tail strategy with New Reno and Cubic leads to considerable average queue size and queue size variations, which implies the high variability of experienced delay. Surprisingly C-TCP, even with DT, is able to maintain a relatively short average queue size, however with high fluctuations. C-TCP with PIE or CoDel provides the best results in terms of the average queue length. All TCP versions benefit from interacting with PIE or CoDel in terms of the average queue size and the standard deviation of the queue size; all TCP-AQM pairs provide a rather low and stable queue (see Figure 5).
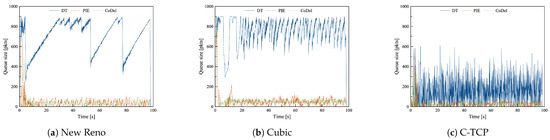
Figure 5.
The queue length of DT, PIE and CoDel in combination with (a) New Reno, (b) Cubic, and (c) C-TCP in the Access Link scenario with common TCPs in uncongested network.
During mild and heavy congestion, DT leads to a persistently full queue. Although the observed fluctuations are not significant, a full queue implies long delays, which may be unacceptable in many applications. PIE, in combination with all TCPs, achieves remarkably better results than CoDel. During heavy congestion, CoDel, similarly as in the DC scenario, oscillates between the maximum and target values, however at a significantly lower frequency. The queue size variability in the mildly congested network is depicted in Figure 6 and during heavy congestion in Figure 7.
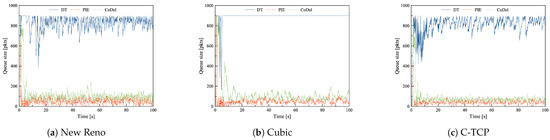
Figure 6.
The queue length of DT, PIE and CoDel in combination with (a) New Reno, (b) Cubic, and (c) C-TCP in the Access Link scenario with common TCPs during mild congestion.
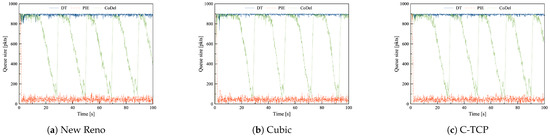
Figure 7.
The queue length of DT, PIE and CoDel in combination with (a) New Reno, (b) Cubic, and (c) C-TCP in the Access Link scenario with common TCPs during heavy congestion.
TCP Cubic leads to the highest drop ratio compared to the other two TCPs (see Table 9). On the other hand, C-TCP, regardless of the queue management, provides the least packet losses. In the uncongested network, the TCP Cubic and DT combination achieves the worst results in terms of the drop ratio; replacing DT with any evaluated AQM considerably improves this metric. Nevertheless, the drop ratio is relatively small in this network load scenario.
In the mildly congested network, C-TCP once again provides the lowest and Cubic the highest drop ratio. During heavy congestion, it is visible that the drop ratio depends on the applied AQM, i.e., PIE causes slightly more losses than CoDel and DT; however, it provides the shortest and most stable queue at the same time.
Similarly, as in the previous scenario, improvements can be proposed for the buffer management strategy. CoDel experiences similar problems with oscillations under heavy congestion, however a slower network causes less frequent oscillations. The average RTT is close to the nominal RTT, therefore it is clear that updating only the interval parameter according to the network speed, is not enough. It is necessary to increase the number of rejected packets per every . This number could depend on the increase rate of the average queue size.
Another problem that appears in this scenario is much lower fairness in uncongested and mildly congested networks, which results from varied RTTs. TCP flows with longer RTT occupy a much smaller part of bandwidth than TCP flows with shorter RTT. Deploying AQM already introduces randomization to which flow experiences loss. To improve this approach, both AQMs could adopt a simple mechanism to approximate the flow rate, e.g., borrowed from CHOKe [34]. CHOKe verifies if the upcoming packet belongs to the same flow as a randomly selected packet in the queue. If both packets belong to the same flow, it decides to drop the packet.
Summary:
- Varied RTT significantly worsens the achievable fairness among competing flows for any combination of TCP congestion control mechanism and buffer management strategy.
- DT leads to a very high drop ratio, unfairness, and persistently full buffer. Applying PIE or CoDel improves the experienced delay and delay variations and, in most cases, fairness provided by the TCP congestion control mechanism.
- TCP Cubic benefits the most from replacing DT with AQM.
- In combination with DT, C-TCP provides a very high Jain’s index, acceptable average queue size; however, high queue size variations and only in an uncongested network scenario.
- The following combinations provide the best results in terms of satisfactory fairness, delay, and drop ratio at the same time: PIE with C-TCP (for uncongested network), PIE with Cubic (for mildly congested network), and PIE with any TCP (during heavy congestion).
5.3. Data Center, Mixed TCPs
In the third scenario, the combination of all TCP versions is used simultaneously, i.e., every node implements a different congestion control mechanism. The results are shown in Table 10 and Table 11. Table 10 shows the average throughput, bandwidth sharing, and fairness. The average throughput and standard deviation of the throughput (column AvgThr (SD)) are calculated for each node, thus for different TCP flavors, depending on the congestion load, it is the average of three, thirty, or three-hundred values. Column BD presents the percentage of the overall throughput achieved by the streams of a given TCP version. Column JI contains the Jain’s index calculated either for flows using the same TCP version (inter-fairness) or for all connections (intra-fairness). The results are presented for three different congestion levels and three evaluated buffer management strategies.
Table 10.
The summary results in the data center scenario with mixed TCPs, UC—uncongested, MC—mildly congested, HC—heavily congested network.
Table 11.
Mean queue length (QS) and standard deviation (SD) of queue length [pkts] and packet drop ratio (DR) [%] in the Data center scenario with mixed TCPs, UC—uncongested, MC—mildly congested, HC—heavily congested network.
The most unfair bandwidth allocation is observed when DT is applied at the buffer. Even in the uncongested network, although the inter-fairness is preserved, the intra-fairness is rather poor, and it drops significantly as the congestion grows. In the uncongested and mildly congested network, New Reno acts most aggressively and utilizes more than 60% of the available bandwidth. On the other hand, C-TCP is the least competitive and suffers significant performance degradation. During heavy congestion, TCP Cubic overtakes the whole bandwidth.
Replacing DT with PIE or CoDel noticeably improves the inter- and intra-fairness in all scenarios, even during heavy congestion state. However, there are minor differences in terms of the average throughput; in most cases, TCP Cubic acts slightly more aggressively towards New Reno and C-TCP connections.
Table 11 shows the mean queue length and the standard deviation of queue length as well as the drop ratio for each scenario case. The queue length variation over time is presented in Figure 8. As far as queue behavior is concerned, similar dependencies can be observed as in the DC scenario with common TCP. CoDel provides a rather low and stable queue in the uncongested and mildly congested network. However, as the network load increases, CoDel’s queue oscillates between the maximum and the target value, which causes high latency variability. The problem is discussed in the Data Center scenario with common TCPs (Section 5.1). PIE results in a comparable average queue size and queue size variation, regardless of the congestion level. During mild and heavy congestion, PIE causes 10% more packet losses than CoDel.
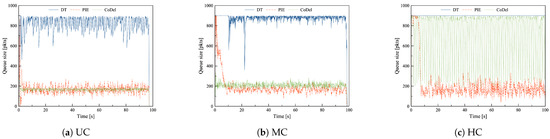
Figure 8.
The queue length of DT, PIE and CoDel in combination with mix TCP flows in the Data Center scenario (a) in uncongested network, (b) during mild congestion, (c) during heavy congestion.
We summarize our findings are follows:
- Applying PIE or CoDel significantly improves the inter- and intra-fairness among competing flows using different TCP versions.
- CoDel maintains a short and stable queue only if the network is not overloaded. The average queue size provided by CoDel depends on the network load.
- PIE provides satisfactory and comparable results regarding fairness, drop ratio, and queue stability in all network load scenarios.
5.4. Access Link, Mixed TCPs
In the last scenario, the Access Link topology with varied RTTs is used along with all TCP versions, i.e., every node implements a different congestion control mechanism.
Table 12 gathers the average throughput, bandwidth sharing, and fairness. The average throughput and standard deviation of the throughput (column AvgThr (SD)) are calculated for each node, thus for different TCP flavors. Column BD presents the percentage of the overall throughput achieved by the streams of a given TCP version. Finally, column JI contains the Jain’s index calculated either for flows using the same TCP version (inter-fairness) or for all connections (RTT-fairness). The results are presented for three different congestion levels and three evaluated buffer management strategies.
Table 12.
The summary results in the Access Link scenario with mixed TCPs, UC—uncongested, MC—mildly congested, HC—eavily congested network.
Preserving acceptable inter- and RTT-fairness, when all TCPs are used simultaneously, is much harder in Access Link scenario than in the Data Center scenario. In combination with DT, connections using TCP Compound can take only a disproportionately small percentage of the accessible resources. Thus, TCP New Reno and TCP Cubic consume almost all available bandwidth. This is because Cubic is more aggressive than the other two TCPs and the links dedicated to New Reno have the shortest average RTT values. TCP Cubic and C-TCP provide significantly better inter-fairness than New Reno. However, in all load scenarios, the overall RTT-fairness is rather poor.
Applying PIE or CoDel does not significantly affect the inter-fairness, actually C-TCP provides better results in combination with DT. Nonetheless, both AQMs improve the fair bandwidth distribution. From the conducted simulations, it cannot be clearly stated which version of TCP behaves the most aggressively or how RTT differentiation influences the achieved throughput. To fully understand and verify these dependencies, additional simulation studies would be required.
Table 13 shows the mean queue length and the standard deviation of queue length, as well as the drop ratio for each scenario case. The queue length variation over time is presented in Figure 9.
Table 13.
Mean queue length (QS) and standard deviation (SD) of queue length [pkts] and packet drop ratio (DR) [%] in the Access Link scenario with mixed TCPs, UC—uncongested, MC—mildly congested, HC—heavily congested network.
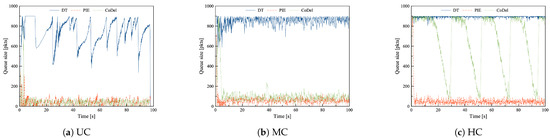
Figure 9.
The queue length of DT, PIE and CoDel in combination with mix TCP flows in the Access Link scenario (a) in uncongested network, (b) during mild congestion, (c) during heavy congestion.
The observed queue behavior is similar to previous scenarios. DT allows filling the queue, which results in a large average queue size and, consequently, long delays. In the uncongested network, the queue oscillations, therefore delay variations, are the highest (see Figure 9a). In the uncongested and mildly congested network, PIE and CoDel provide similar results, i.e., rather short and stable queues. CoDel, as depicted in Figure 9c, fluctuates between the maximum and the target value of queue size in the heavily congested network, which results in unacceptably high queue size variations. PIE acts similarly in all load scenarios and provides comparable average queue size and rather small variations. However, during heavy congestion, it causes considerably more packet losses than the other two approaches.
A similar problem with fairness in the uncongested and moderately congested networks is observed in the Access Link scenario with common TCPs. Once again, the RTT fairness could be improved by deploying the dropping function, which would more accurately penalize the faster flows.
A summary of our findings is given below.
- Varied RTT significantly worsens the results in terms of achievable RTT- and inter-fairness.
- Applying PIE or CoDel improves the RTT-fairness among competing flows using different TCP versions, however, unsatisfactorily.
- C-TCP, combined with DT, provides very high inter-fairness even in the presence of connections using more aggressive TCP variants.
- PIE is the only buffer management strategy that provides acceptable results in terms of fairness, and queue stability in all load scenarios, however, at the cost of a higher drop ratio.
6. Conclusions
In this paper, an extensive evaluation of cross-layer interactions between commonly used TCP flavors, including New Reno, Cubic, Compound, and recent Active Queue Management strategies, was conducted to answer fundamental questions:
- To what extent an AQM influences the end-to-end congestion control mechanism?
- What are the effects of network parameters, such as RTT variation and congestion level, on the combined TCP and AQM performance?
- Can cross-layer interaction between TCP and AQM overcome the challenges of network heterogeneity and variability?
- Is there one universal TCP-AQM combination for all cases?
Re (1) The simulation results revealed that in combination with DT, none of the evaluated TCP provides fair bandwidth sharing, especially when the network load increases. Moreover, when all TCPs are used simultaneously without any AQM TCP Compound, which is a delay-based algorithm, there is a decrease in performance when competing with TCP flows from the loss-based group. On the other hand, TCP Cubic is the most aggressive congestion control mechanism, utilizing over 50% of available bandwidth. Applying PIE or CoDel significantly improves the inter- and intra-fairness provided by the evaluated congestion control mechanisms.
Re (2) Varied RTT significantly worsens the performance of all TCP-AQM combinations in terms of achievable fairness among competing flows. Moreover, with the growing network load, the fairness decreases even more, the drop ratio is higher, and providing a low and stable queue becomes very challenging.
Re (3) DT always leads to a persistently full buffer, which results in long delays and high delay variations; furthermore, the higher network load, the fewer flows can transmit data packets efficiently. Applying any AQM noticeably improves the RTT-fairness; though, the aggressiveness of the congestion control protocol cannot be eliminated. In most cases, PIE and CoDel allow maintaining relatively short and stable queues, which reduces the experienced delay and delay variations, and improves the inter- and intra-fairness among competing flows.
Re (4) No combination would result in the highest fairness, low drop ratio, and low and stable queue simultaneously, regardless of the congestion level or RTT variability. In general, CoDel, especially in combination with C-TCP, maintains the shortest queues and provides satisfactory fairness, however only in an uncongested network. PIE is the only AQM that, with all TCPs, in all load scenarios provides similar results in terms of queue length and stability, reasonable fairness, however at the cost of a slightly higher drop ratio.
PIE and CoDel configuration parameters were supposed to be auto-tuned and insensitive to varied round-trip delays, link rates, and traffic loads. Unfortunately, there are some operational ranges for which both AQMs work as desired and provide low and stable queuing delay. Outside those ranges some additional configuration is beneficial. Especially, the target delay should be reduced, according to the network speed, for both AQMs.
PIE and TCP Cubic seem to represent the most universal combination that works well in both the high-speed network with low delays and the access link connecting an institution to an ISP. PIE is insensitive to traffic load, and TCP Cubic deals better with varied RTT in terms of fairness provided. CoDel with C-TCP works well in the network with similar RTTs and low traffic load. C-TCP is a good choice in an uncongested network when we cannot deploy the AQM, because it provides the highest fairness and prohibits filling the entire buffer.
The results obtained in this paper are contradictory to the results presented in [16]. However, it is not surprising, taking into account the configuration of the simulation environment. We believe that the simulation parameters and analyses submitted in this paper apply to current technological standards and represent more common cases. Moreover, the results confirm the limitations of both algorithms suggested in [11] for high-speed network and heavily congested networks.
While there is no universal solution for all scenarios, it is clear that replacing DT with PIE or CoDel should be a must, especially when we consider that aggressive TCP Cubic is likely to be the most common solution in the future. As part of future work, we will repeat the simulations using real TCP implementations.
Funding
This work was carried out within the statutory research project of the Department of Computer Networks and Systems.
Institutional Review Board Statement
Not applicable.
Informed Consent Statement
Not applicable.
Conflicts of Interest
The author declares no conflict of interest.
References
- Postel, J. Service mappings. RFC 795, RFC Editor. Available online: https://www.rfc-editor.org/info/rfc795 (accessed on 22 August 2021).
- Afanasyev, A.; Tilley, N.; Reiher, P.; Kleinrock, L. Host-to-Host Congestion Control for TCP. IEEE Commun. Surv. Tutor. 2010, 12, 304–342. [Google Scholar] [CrossRef]
- Baker, F.; Fairhurst, G. IETF Recommendations Regarding Active Queue Management. Available online: https://www.rfc-editor.org/info/rfc7567 (accessed on 22 August 2021).
- Miras, D.; Bateman, M.; Bhatti, S. 2008 22nd IEEE International Conference on Advanced Information Networking and Applications. Available online: http://toc.proceedings.com/05076webtoc.pdf (accessed on 22 August 2021).
- Alrshah, M.A.; Othman, M.; Ali, B.; Mohd Hanapi, Z. Comparative study of high-speed Linux TCP variants over high-BDP networks. J. Netw. Comput. Appl. 2014, 43, 66–75. [Google Scholar] [CrossRef]
- Turkovic, B.; Kuipers, F.A.; Uhlig, S. Fifty Shades of Congestion Control: A Performance and Interactions Evaluation. arXiv 2019, arXiv:1903.03852. [Google Scholar]
- Lin, J.; Cui, L.; Zhang, Y.; Tso, F.P.; Guan, Q. Extensive evaluation on the performance and behaviour of TCP congestion control protocols under varied network scenarios. Comput. Netw. 2019, 163, 106872. [Google Scholar] [CrossRef]
- Callegari, C.; Giordano, S.; Pagano, M.; Pepe, T. Behavior analysis of TCP Linux variants. Comput. Netw. 2012, 56, 462–476. [Google Scholar] [CrossRef]
- Poojary, S.; Sharma, V. Analysis of multiple flows using different high speed TCP protocols on a general network. Perform. Eval. 2016, 104, 42–62. [Google Scholar] [CrossRef][Green Version]
- Abdeljaouad, I.; Rachidi, H.; Fernandes, S.; Karmouch, A. Performance analysis of modern TCP variants: A comparison of Cubic, Compound and New Reno. In Proceedings of the 2010 25th Biennial Symposium on Communications, Kingston, ON, Canada, 12–14 May 2010; pp. 80–83. [Google Scholar]
- Kuhn, N.; Ros, D.; Bagayoko, A.B.; Kulatunga, C.; Fairhurst, G.; Khademi, N. Operating ranges, tunability and performance of CoDel and PIE. Comput. Commun. 2017, 103, 74–82. [Google Scholar] [CrossRef]
- Schwardmann, J.; Wagner, D.; Kühlewind, M. Evaluation of ARED, CoDel and PIE. In Advances in Communication Networking; Kermarrec, Y., Ed.; Springer International Publishing: Cham, Switzerland, 2014; pp. 185–191. [Google Scholar]
- Dash, P.K.; Bisoy, S.K. Analysis of AQM router of network supporting multiple TCP flows. In Proceedings of the 2014 IEEE International Conference on Computational Intelligence and Computing Research, Coimbatore, India, 18–20 December 2014; pp. 1–5. [Google Scholar]
- Chydzinski, A.; Brachman, A. Performance of AQM Routers in the Presence of New TCP Variants. In Proceedings of the 2010 Second International Conference on Advances in Future Internet, Venice, Italy, 18–25 July 2010; pp. 88–93. [Google Scholar]
- Vyakaranal, S.B.; Naragund, J.G. Performance Evaluation of TCP using AQM Schemes for Congestion Control. In Proceedings of the 2018 Second International Conference on Advances in Electronics, Computers and Communications (ICAECC), Bangalore, India, 9–10 February 2018; pp. 1–6. [Google Scholar]
- Grazia, C.A.; Patriciello, N.; Klapez, M.; Casoni, M. Transmission Control Protocol and Active Queue Management together against congestion: Cross-comparison through simulations. SIMULATION 2019, 95, 979–993. [Google Scholar] [CrossRef]
- Andrew, L.; Marcondes, C.; Floyd, S.; Dunn, L.; Guillier, R.; Gang, W.; Eggert, L.; Ha, S.; Rhee, I. Towards a Common TCP Evaluation Suite. Available online: http://www.icsi.berkeley.edu/pubs/networking/pfldnet2008-submitted.pdf (accessed on 22 August 2021).
- Gurtov, A.; Henderson, T.; Floyd, S.; Nishida, Y. The NewReno Modification to TCP’s Fast Recovery Algorithm. Available online: https://www.rfc-editor.org/info/rfc6582 (accessed on 22 August 2021).
- Jacobson, V. Congestion Avoidance and Control. SIGCOMM Comput. Commun. Rev. 1988, 18, 314–329. [Google Scholar] [CrossRef]
- Floyd, S. HighSpeed TCP for Large Congestion Windows. Available online: https://www.rfc-editor.org/info/rfc3649 (accessed on 22 August 2021).
- Ha, S.; Rhee, I.; Xu, L. CUBIC: A New TCP-Friendly High-Speed TCP Variant. SIGOPS Oper. Syst. Rev. 2008, 42, 64–74. [Google Scholar] [CrossRef]
- Xu, L.; Harfoush, K.; Rhee, I. Binary increase congestion control (BIC) for fast long-distance networks. In Proceedings of the IEEE INFOCOM 2004, Hong Kong, China, 7–11 March 2004; Volume 4, pp. 2514–2524. [Google Scholar]
- Tan, K.; Song, J.; Zhang, Q.; Sridharan, M. A Compound TCP Approach for High-Speed and Long Distance Networks. In Proceedings of the IEEE INFOCOM 2006. 25TH IEEE International Conference on Computer Communications, Barcelona, Spain, 23–29 April 2006; pp. 1–12. [Google Scholar]
- Brakmo, L.S.; Peterson, L.L. TCP Vegas: End to end congestion avoidance on a global Internet. IEEE J. Sel. Areas Commun. 1995, 13, 1465–1480. [Google Scholar] [CrossRef]
- Nichols, K.; Jacobson, V. Controlling Queue Delay. Queue 2012, 10, 20–34. [Google Scholar] [CrossRef]
- Adams, R. Active Queue Management: A Survey. IEEE Commun. Surv. Tutor. 2013, 15, 1425–1476. [Google Scholar] [CrossRef]
- Pan, R.; Natarajan, P.; Baker, F.; White, G. Proportional Integral Controller Enhanced (PIE): A Lightweight Control Scheme to Address the Bufferbloat Problem. Available online: https://www.rfc-editor.org/info/rfc8033 (accessed on 22 August 2021).
- Imputato, P.; Avallone, S.; Tahiliani, M.P.; Ramakrishnan, G. Revisiting design choices in queue disciplines: The PIE case. Comput. Netw. 2020, 171, 107136. [Google Scholar] [CrossRef]
- Pan, R.; Natarajan, P.; Piglione, C.; Prabhu, M.S.; Bernstein, A.; Baker, F.J. Adapting Proportional Integral Controller Enhanced Algorithm for Varying Network Conditions in a Network Environment. U.S. Patent 9,674,104, 15 January 2014. [Google Scholar]
- Nichols, K.; Jacobson, V.; McGregor, A.; Iyengar, J. Controlled Delay Active Queue Management. Available online: https://www.rfc-editor.org/info/rfc8289 (accessed on 22 August 2021).
- Hoeiland-Joergensen, T.; McKenney, P.; Taht, D.; Gettys, J.; Dumazet, E. The Flow Queue CoDel Packet Scheduler and Active Queue Management Algorithm. Available online: https://www.rfc-editor.org/info/rfc8290 (accessed on 22 August 2021).
- Levasseur, B.; Claypool, M.; Kinicki, R. A TCP CUBIC Implementation in Ns-3. In WNS3 ’14: Proceedings of the 2014 Workshop on ns-3; Association for Computing Machinery: New York, NY, USA, 2014. [Google Scholar] [CrossRef]
- Craig, K. Available online: https://web.cs.wpi.edu/~rek/Adv_Nets/Fall2014/TCP_Compound_Project.pdf (accessed on 22 August 2021).
- Pan, R.; Prabhakar, B.; Psounis, K. CHOKe—A stateless active queue management scheme for approximating fair bandwidth allocation. In Proceedings of the IEEE INFOCOM 2000, Conference on Computer Communications, Nineteenth Annual Joint Conference of the IEEE Computer and Communications Societies (Cat. No.00CH37064), Tel Aviv, Israel, 26–30 March 2000; Volume 2, pp. 942–951. [Google Scholar] [CrossRef]


Publisher’s Note: MDPI stays neutral with regard to jurisdictional claims in published maps and institutional affiliations. |
© 2021 by the author. Licensee MDPI, Basel, Switzerland. This article is an open access article distributed under the terms and conditions of the Creative Commons Attribution (CC BY) license (https://creativecommons.org/licenses/by/4.0/).