
How Poloxamer Addition in Hyaluronic-Acid-Decorated Biodegradable Microparticles Affects Polymer Degradation and Protein Release Kinetics

 ,
, 
 and
and 
Abstract
:1. Introduction
2. Materials and Methods
2.1. Materials
2.2. Microparticle Preparation
2.3. Microparticle Size
2.4. Microparticle Yield and Protein Entrapment Efficiency
2.5. BSA Release Kinetics
2.6. Degradation Studies of MPs
2.7. Gel Permeation Chromatography (GPC)
2.8. Thermodynamic Analysis by Differential Scanning Calorimetry (DSC)
3. Results and Discussion
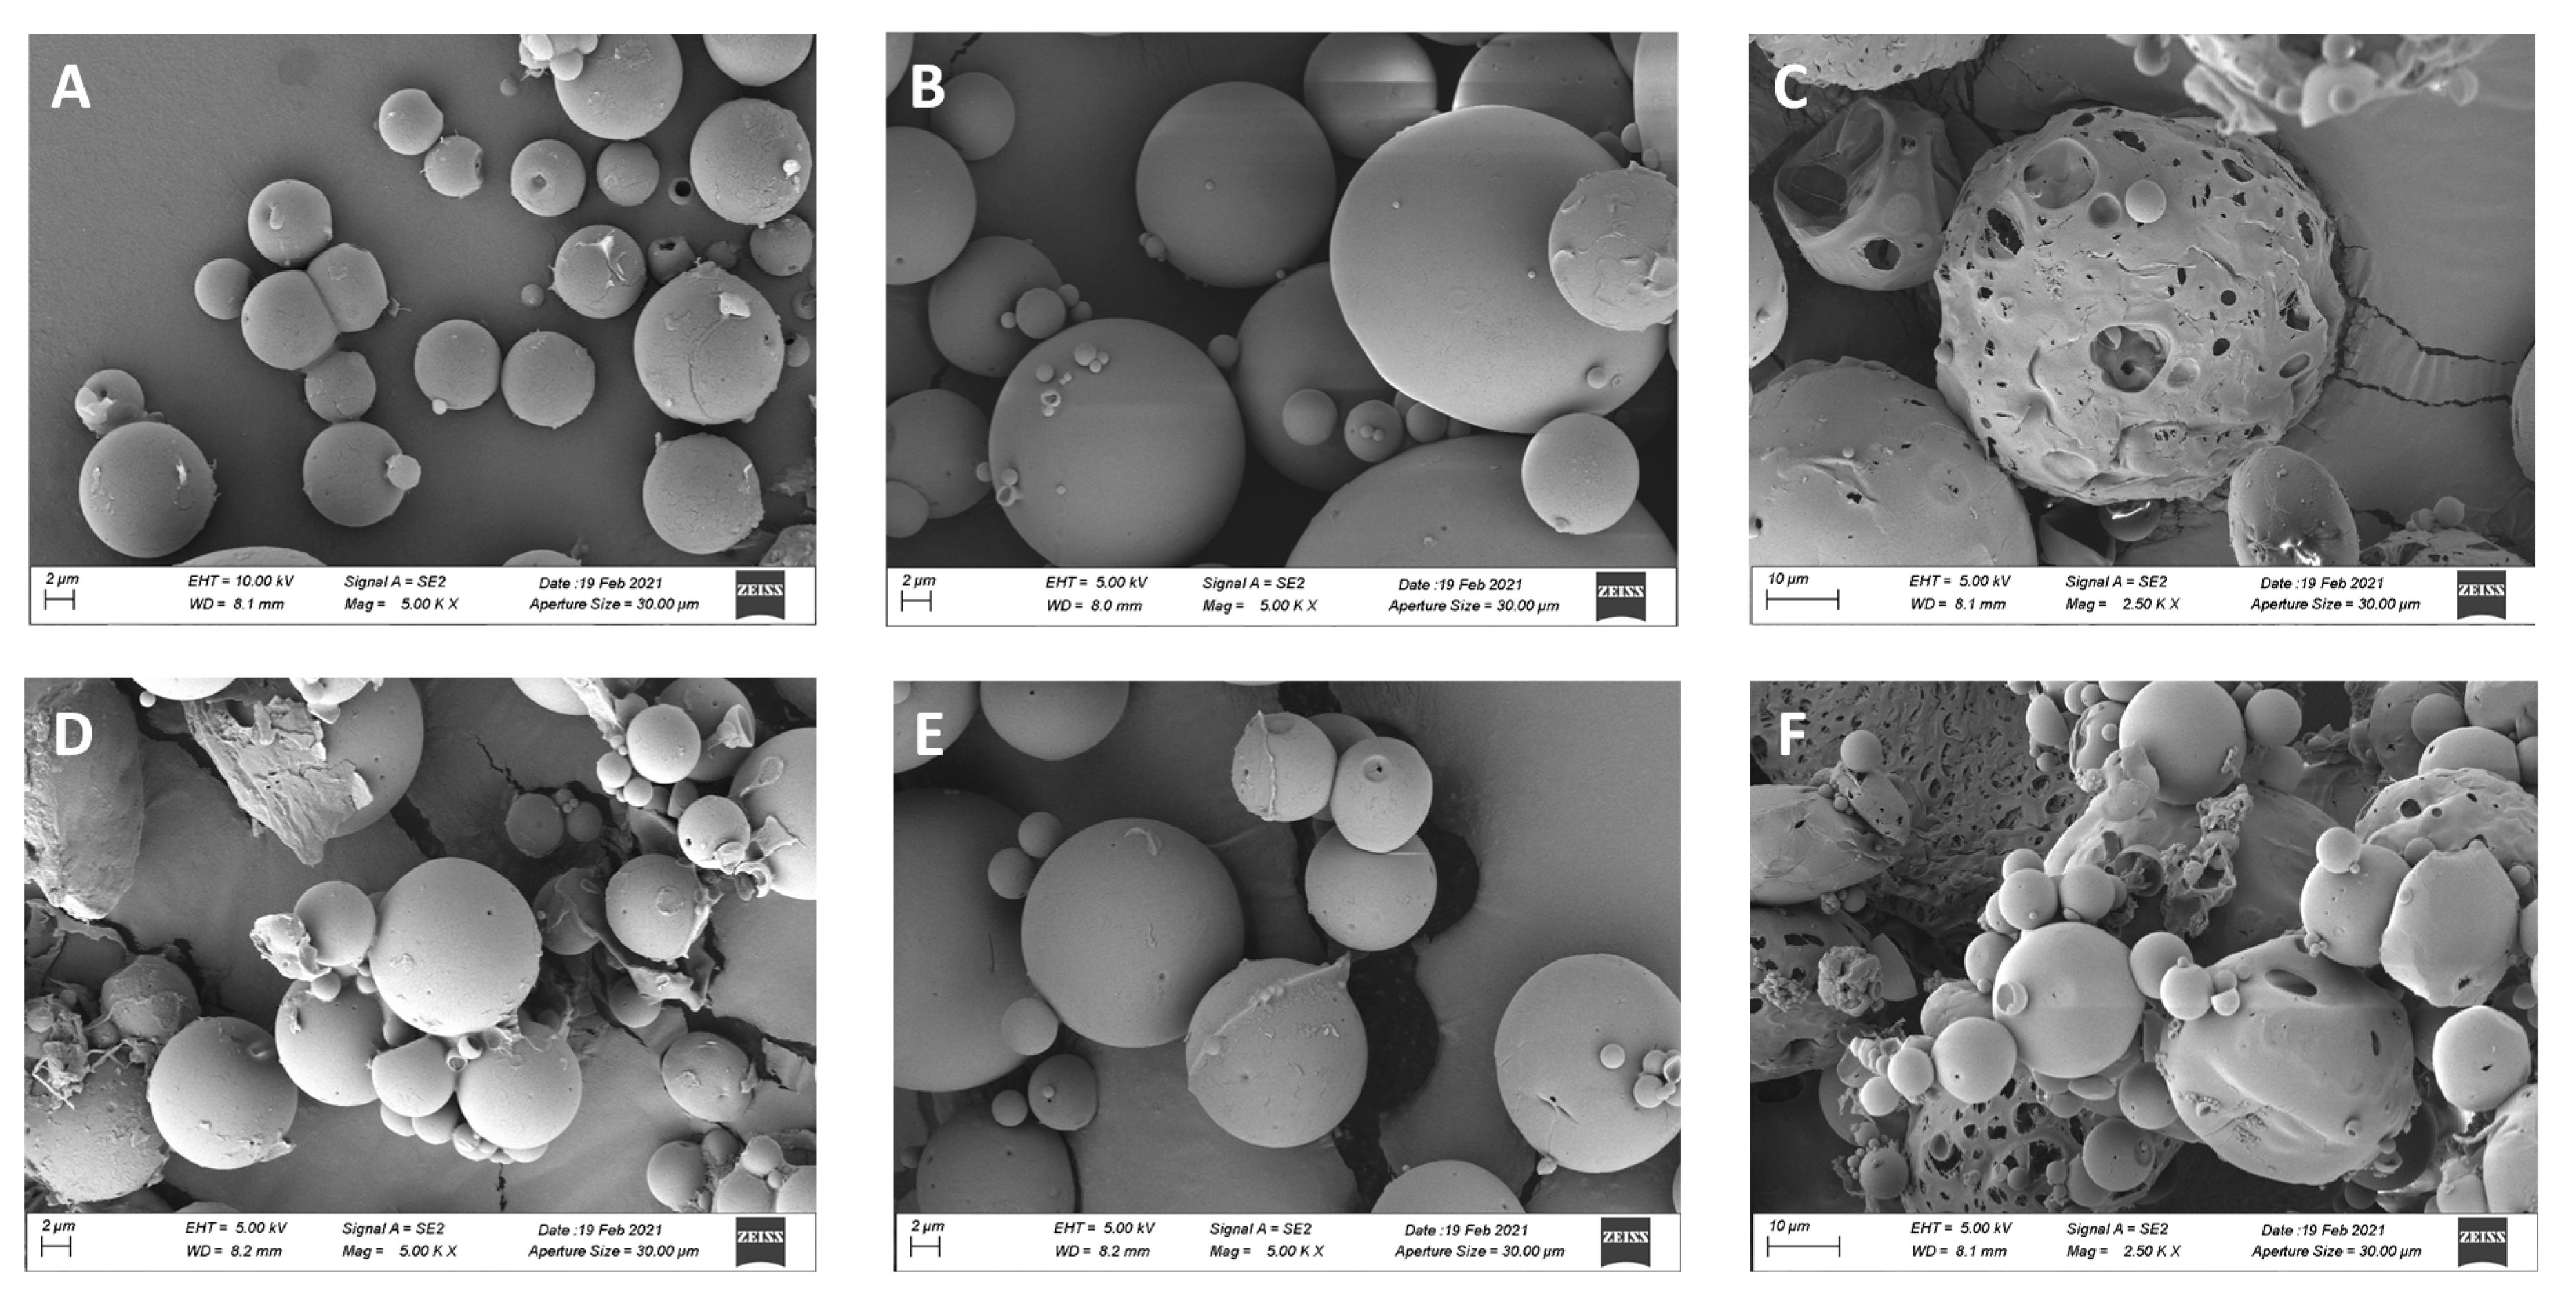
3.1. Microparticle Characterization
3.2. Release Kinetics of BSA in MPs
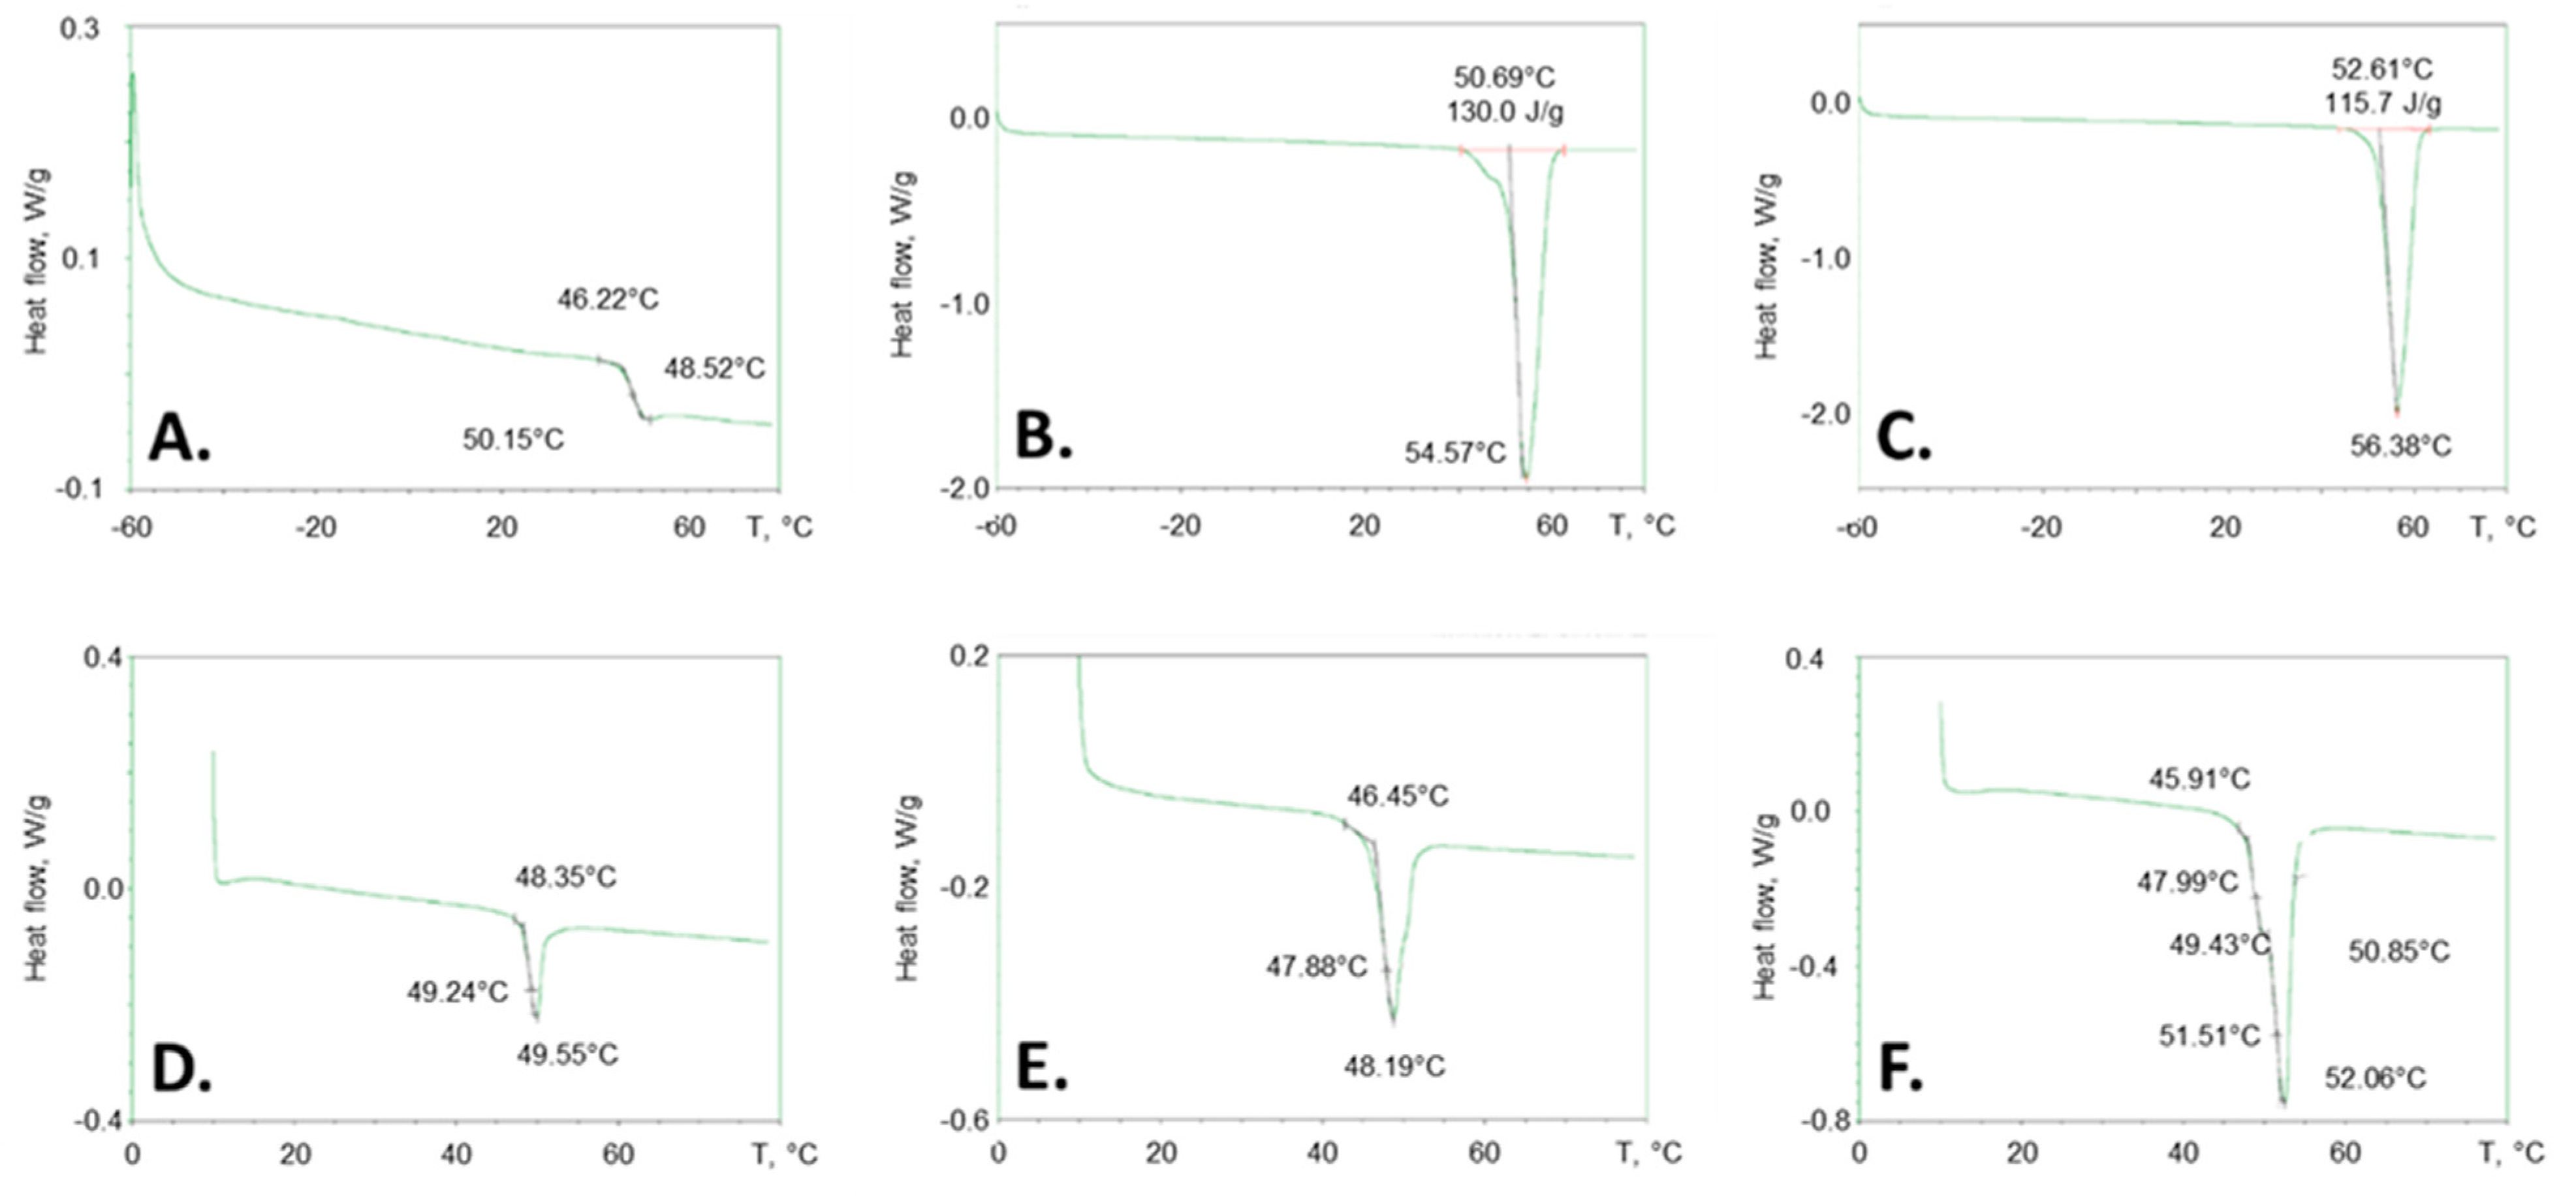
3.3. DSC
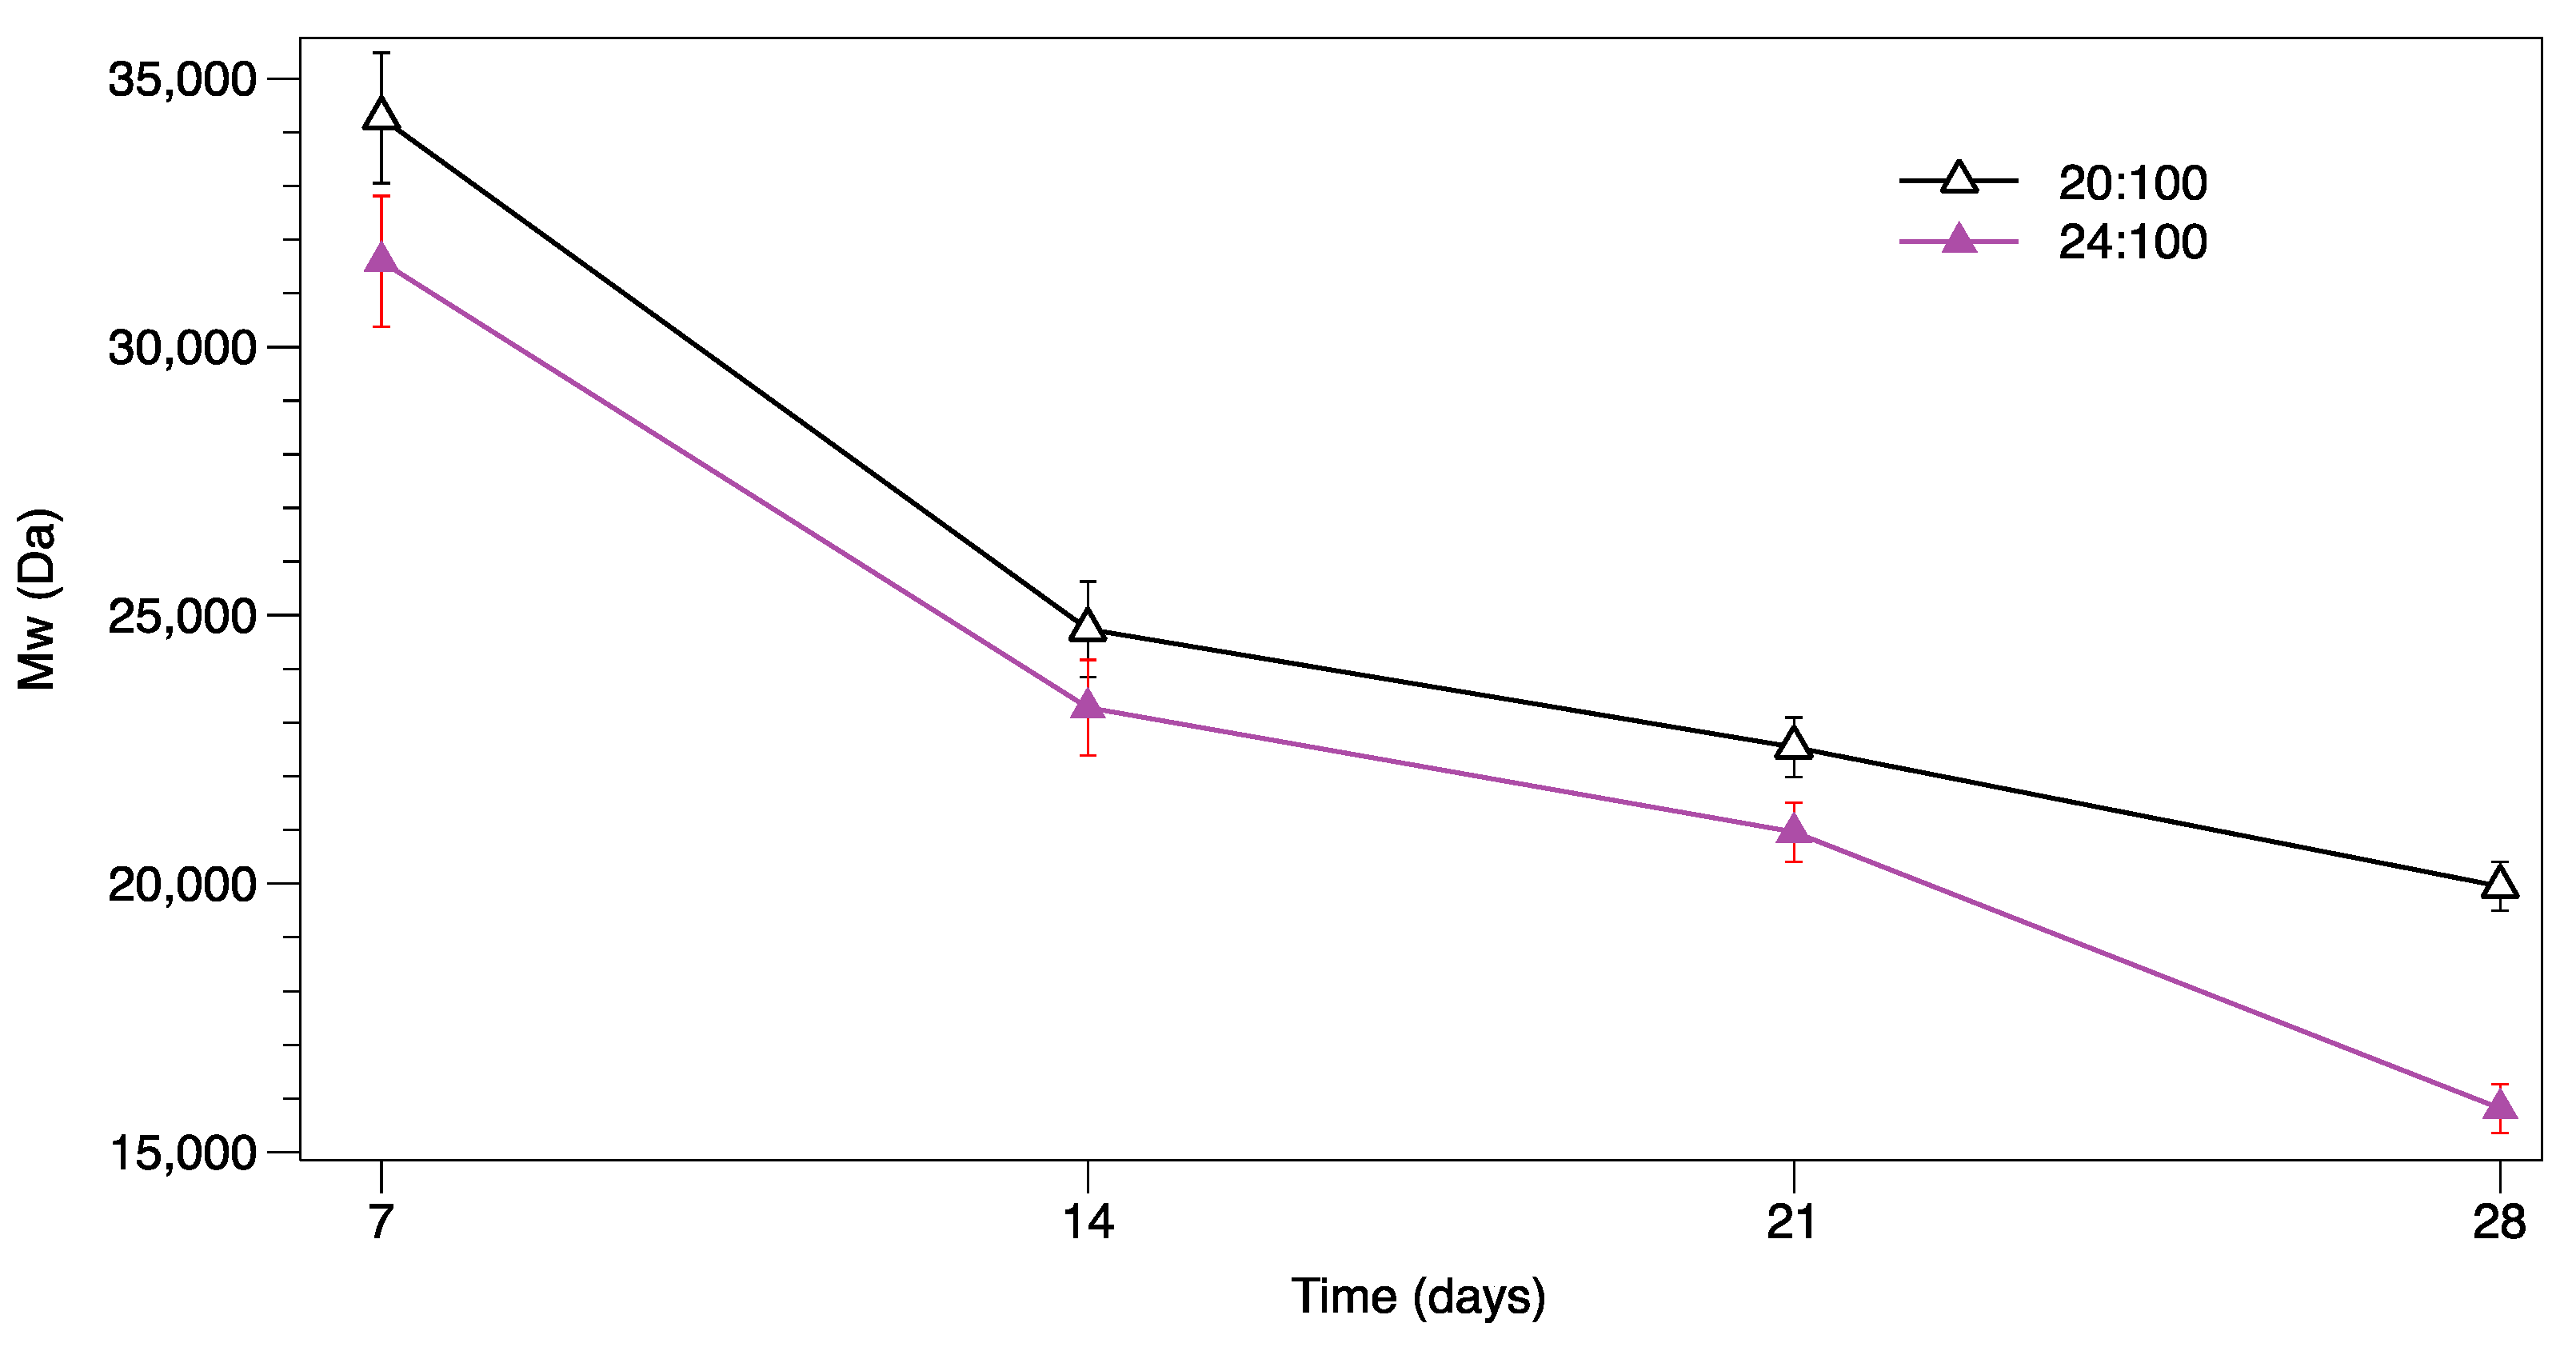
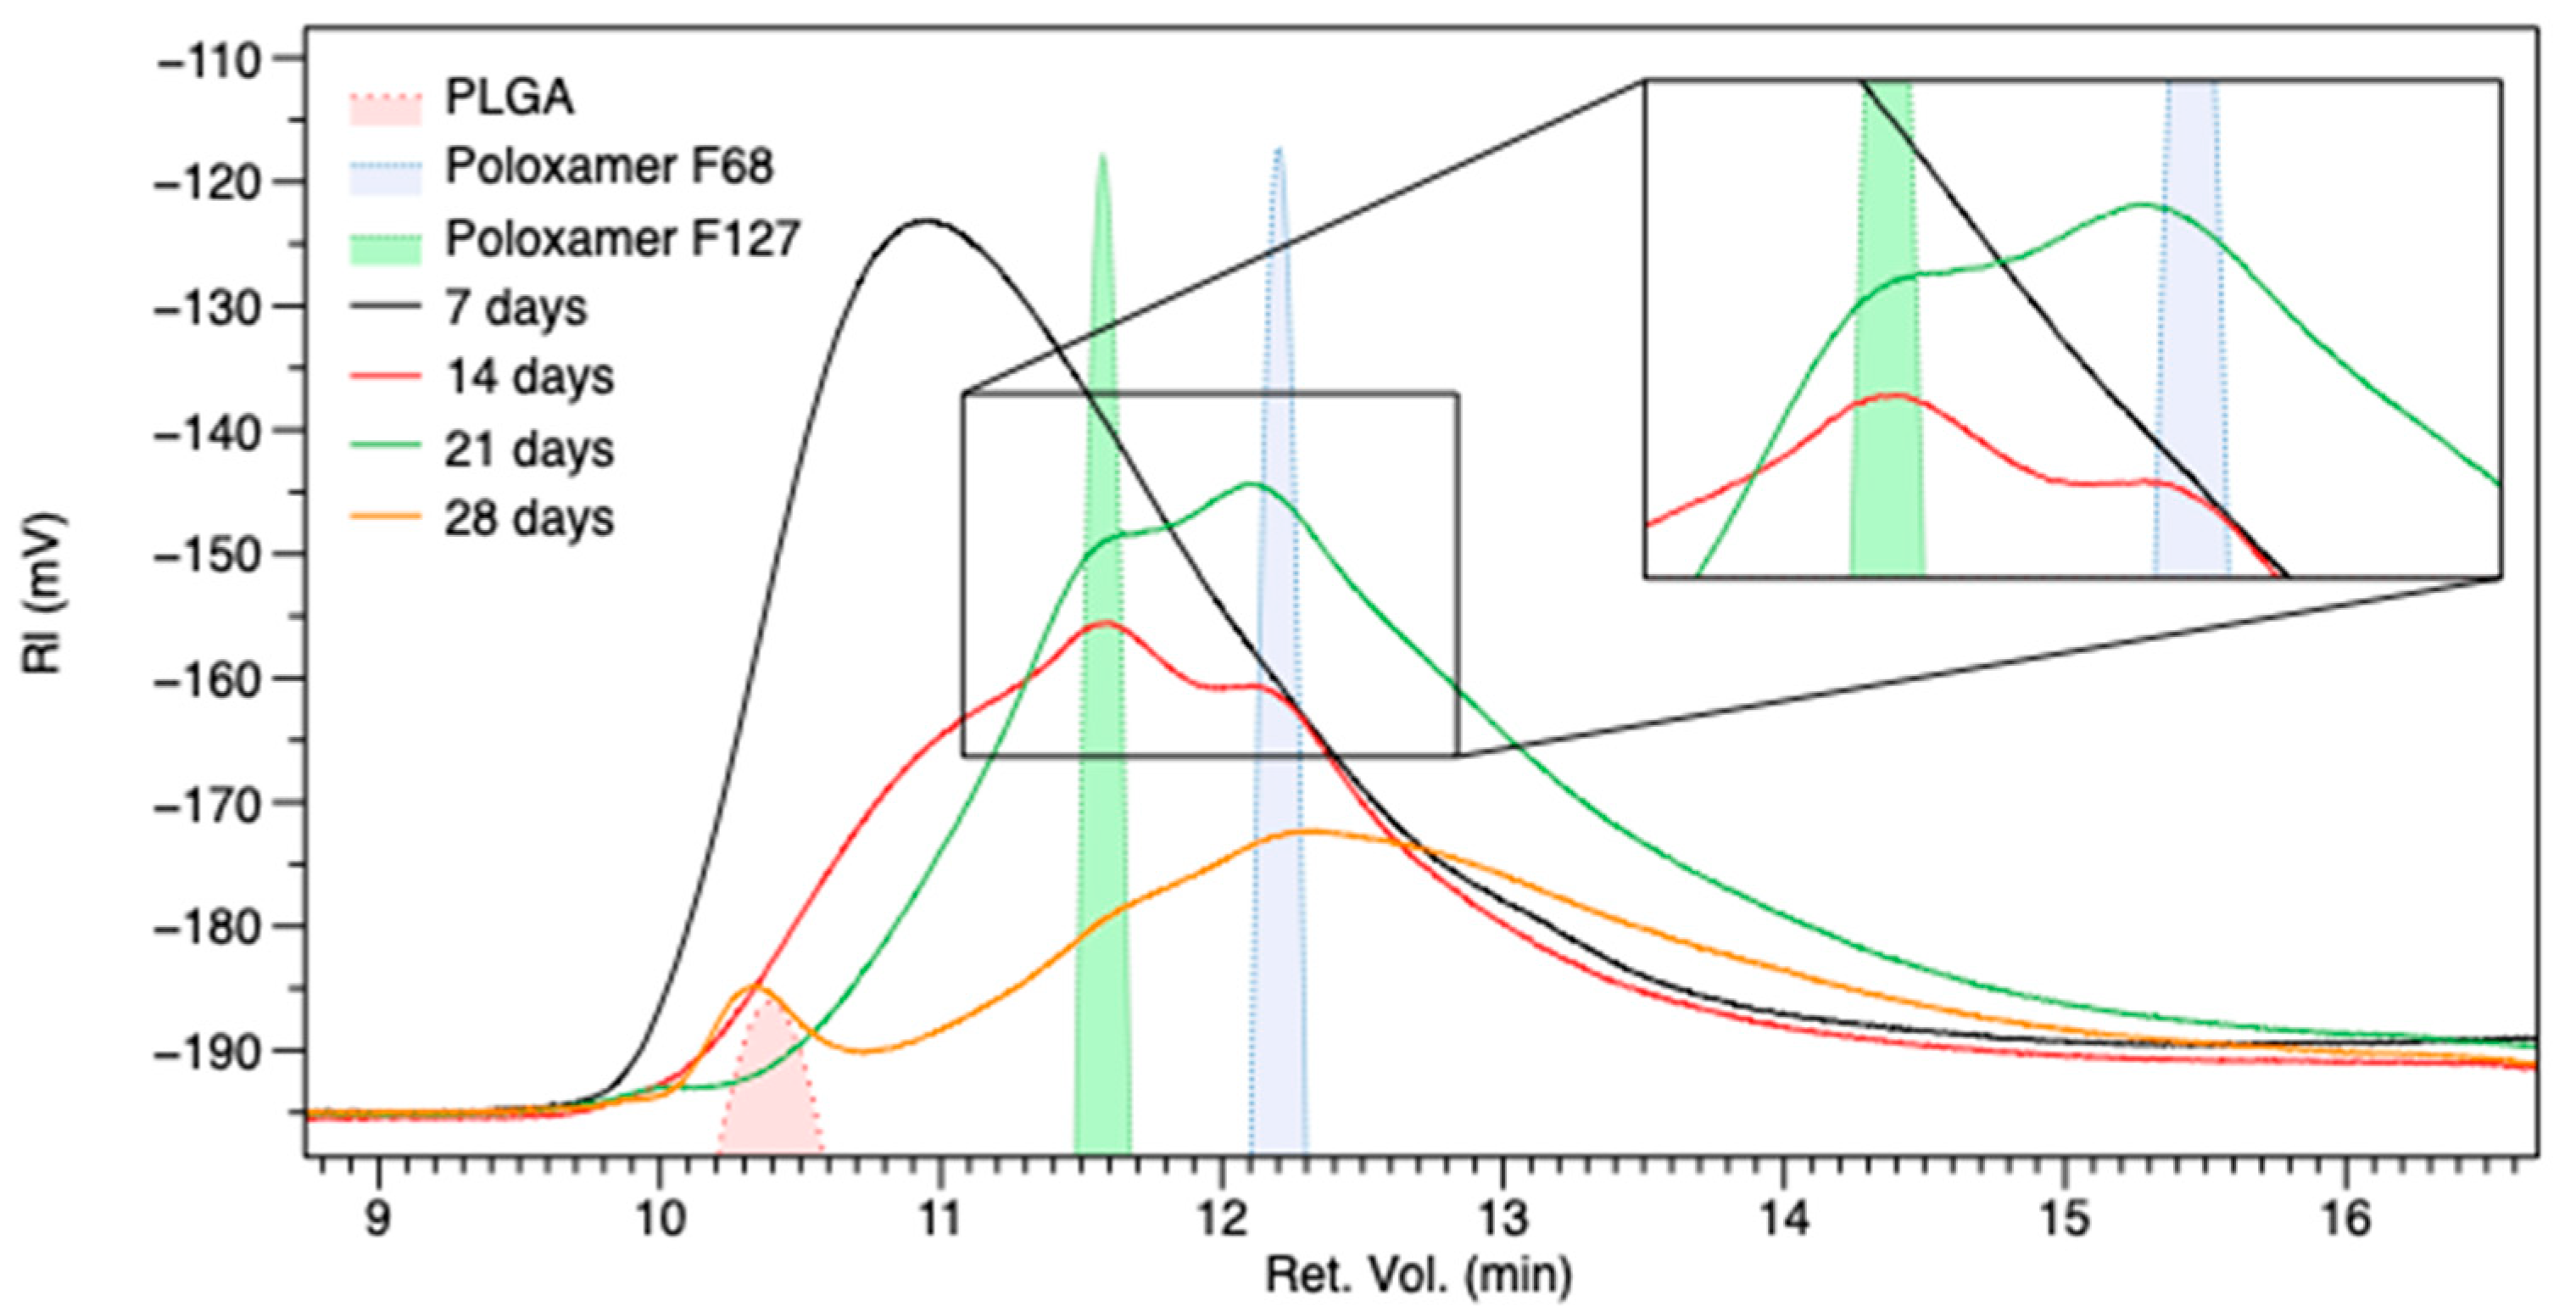
3.4. GPC Analysis
4. Conclusions
Supplementary Materials
Author Contributions
Funding
Acknowledgments
Conflicts of Interest
References
- Khalil, H.E.D.M.; El Gendy, H.A.; Youssef, H.A.R.; Haroun, H.E.; Gheita, T.; Bakir, H.M. The Effectiveness of Intraocular Methotrexate in the Treatment of Posterior Uveitis in Behçet’s Disease Patients Compared to Retrobulbar Steroids Injection. J. Ophthalmol. 2016, 2016, 1–5. [Google Scholar] [CrossRef] [PubMed]
- Herrero-Vanrell, R.; Refojo, M.F. Biodegradable microspheres for vitreoretinal drug delivery. Adv. Drug Deliv. Rev. 2001, 52, 5–16. [Google Scholar] [CrossRef]
- Geroski, D.H.; Edelhauser, H.F. Drug delivery for posterior segment eye disease. Investig. Ophthalmol. Vis. Sci. 2000, 41, 961–964. [Google Scholar]
- Edelhauser, H.F.; Rowe-Rendleman, C.L.; Robinson, M.R.; Dawson, D.G.; Chader, G.J.; Grossniklaus, H.E.; Rittenhouse, K.D.; Wilson, C.G.; Weber, D.A.; Kuppermann, B.D.; et al. Ophthalmic Drug Delivery Systems for the Treatment of Retinal Diseases: Basic Research to Clinical Applications. Investig. Opthalmol. Vis. Sci. 2010, 51, 5403–5420. [Google Scholar] [CrossRef] [PubMed]
- Bodor, N.; Buchwald, P. Ophthalmic drug design based on the metabolic activity of the eye: Soft drugs and chemical delivery systems. AAPS J. 2005, 7, E820–E833. [Google Scholar] [CrossRef] [PubMed] [Green Version]
- Gaudana, R.; Ananthula, H.K.; Parenky, A.; Mitra, A.K. Ocular Drug Delivery. AAPS J. 2010, 12, 348–360. [Google Scholar] [CrossRef]
- Falavarjani, K.G.; Nguyen, Q.D. Adverse events and complications associated with intravitreal injection of anti-VEGF agents: A review of literature. Eye 2013, 27, 787–794. [Google Scholar] [CrossRef] [PubMed] [Green Version]
- Herrero-Vanrell, R.; Ramirez, L.; Fernandez-Carballido, A.; Refojo, M.F. Biodegradable PLGA Microspheres Loaded with Ganciclovir for Intraocular Administration. Encapsulation Technique, in Vitro Release Profiles, and Sterilization Process. Pharm. Res. 2000, 17, 1323–1328. [Google Scholar] [CrossRef] [PubMed]
- Janoria, K.G.; Gunda, S.; Boddu, S.H.; Mitra, A.K. Novel approaches to retinal drug delivery. Expert Opin. Drug Deliv. 2007, 4, 371–388. [Google Scholar] [CrossRef]
- Sampat, K.M.; Garg, S.J. Complications of intravitreal injections. Curr. Opin. Ophthalmol. 2010, 21, 178–183. [Google Scholar] [CrossRef]
- Joseph, M.; Trinh, H.M.; Cholkar, K.; Pal, D.; Mitra, A.K. Recent perspectives on the delivery of biologics to back of the eye. Expert Opin. Drug Deliv. 2016, 14, 631–645. [Google Scholar] [CrossRef] [Green Version]
- Serri, C.; Frigione, M.; Ruponen, M.; Urtti, A.; Borzacchiello, A.; Biondi, M.; Itkonen, J.; Mayol, L. Electron dispersive X-ray spectroscopy and degradation properties of hyaluronic acid decorated microparticles. Colloids Surf. B Biointerfaces 2019, 181, 896–901. [Google Scholar] [CrossRef]
- Mayol, L.; Silvestri, T.; Fusco, S.; Borzacchiello, A.; De Rosa, G.; Biondi, M. Drug micro-carriers with a hyaluronic acid corona toward a diffusion-limited aggregation within the vitreous body. Carbohydr. Polym. 2019, 220, 185–190. [Google Scholar] [CrossRef]
- Giarra, S.; Serri, C.; Russo, L.; Zeppetelli, S.; de Rosa, G.; Borzacchiello, A.; Biondi, M.; Ambrosio, L.; Mayol, L. Spontaneous arrangement of a tumor targeting hyaluronic acid shell on irinotecan loaded PLGA nanoparticles. Carbohydr. Polym. 2016, 140. [Google Scholar] [CrossRef]
- Kogan, G.; Šoltés, L.; Stern, R.; Gemeiner, P. Hyaluronic acid: A natural biopolymer with a broad range of biomedical and industrial applications. Biotechnol. Lett. 2006, 29, 17–25. [Google Scholar] [CrossRef] [PubMed]
- Netti, P.A.; Biondi, M.; Frigione, M. Experimental Studies and Modeling of the Degradation Process of Poly(Lactic-co-Glycolic Acid) Microspheres for Sustained Protein Release. Polymers 2020, 12, 2042. [Google Scholar] [CrossRef] [PubMed]
- Biondi, M.; Indolfi, L.; Ungaro, F.; Quaglia, F.; La Rotonda, M.I.; Netti, P.A. Bioactivated collagen-based scaffolds embedding protein-releasing biodegradable microspheres: Tuning of protein release kinetics. J. Mater. Sci. Mater. Med. 2009, 20, 2117–2128. [Google Scholar] [CrossRef] [PubMed]
- Ding, A.G.; Schwendeman, S.P. Determination of water-soluble acid distribution in poly(lactide-co-glycolide). J. Pharm. Sci. 2004, 93, 322–331. [Google Scholar] [CrossRef] [Green Version]
- Siepmann, J.; Elkharraz, K.; Siepmann, A.F.; Klose, D. How Autocatalysis Accelerates Drug Release from PLGA-Based Microparticles: A Quantitative Treatment. Biomacromolecules 2005, 6, 2312–2319. [Google Scholar] [CrossRef]
- Schädlich, A.; Kempe, S.; Mäder, K. Non-invasive in vivo characterization of microclimate pH inside in situ forming PLGA implants using multispectral fluorescence imaging. J. Control Release 2014, 179, 52–62. [Google Scholar] [CrossRef]
- Kummer, M.P.; Abbott, J.J.; Dinser, S.; Nelson, B.J. Artificial vitreous humor for in vitro experiments. In Proceedings of the 2007 29th Annual International Conference of the IEEE Engineering in Medicine and Biology Society, Lyon, France, 22–26 August 2007. [Google Scholar] [CrossRef]
- Corrigan, O.I.; Li, X. Quantifying drug release from PLGA nanoparticulates. Eur. J. Pharm. Sci. 2009, 37, 477–485. [Google Scholar] [CrossRef]
- Batycky, R.P.; Hanes, J.; Langer, R.; Edwards, D.A. A Theoretical Model of Erosion and Macromolecular Drug Release from Biodegrading Microspheres. J. Pharm. Sci. 1997, 86, 1464–1477. [Google Scholar] [CrossRef] [PubMed]
- Patel, R.R.; Chaurasia, S.; Khan, G.; Chaubey, P.; Kumar, N.; Mishra, B. Cromolyn sodium encapsulated PLGA nanoparticles: An attempt to improve intestinal permeation. Int. J. Biol. Macromol. 2016, 83, 249–258. [Google Scholar] [CrossRef] [PubMed]
- Siepmann, J. Mathematical modeling of bioerodible, polymeric drug delivery systems. Adv. Drug Deliv. Rev. 2001, 48, 229–247. [Google Scholar] [CrossRef]
- Von Burkersroda, F.; Schedl, L.; Göpferich, A. Why degradable polymers undergo surface erosion or bulk erosion. Biomaterials 2002, 23, 4221–4231. [Google Scholar] [CrossRef]


| Formulation Name | Overall Polymeric Concentration % | PLGA: POLOX Ratio | PLGA, mg | F68, mg | F127, mg |
|---|---|---|---|---|---|
| 20–100 | 20 | 100:0 | 500 | 0 | 0 |
| 20–90 | 20 | 90:10 | 450 | 25 | 25 |
| 20–70 | 20 | 70:30 | 350 | 75 | 75 |
| 24–100 | 24 | 100:0 | 600 | 0 | 0 |
| 24–90 | 24 | 90:10 | 540 | 30 | 30 |
| 24–70 | 24 | 70:30 | 420 | 90 | 90 |
| Formulation | Mean Diameter (μm) (±SD) | E.E. (%) (±SD) | Yield (±SD) |
|---|---|---|---|
| 20–100 | 30 ± 8.4 | 49 ± 4 | 27 ±12 |
| 20–90 | 14 ± 6.0 | 63 ± 13 | 38 ±10 |
| 20–70 | 14 ± 6.0 | 43 ± 1.0 | 43 ±24 |
| 24–100 | 31 ± 5.0 | 61 ± 10 | 30 ±15 |
| 24–90 | 15 ± 7.0 | 68 ± 19 | 35 ±21 |
| 24–70 | 15 ± 6.2 | 81 ± 18 | 27 ±15 |
| 20–70 | 20–90 | 20–100 | 24–70 | 24–90 | 24–100 | |
|---|---|---|---|---|---|---|
| [day−1] | 4.60 | 4.41 | 4.86 | 4.40 | 4.33 | 4.33 |
| 0.031 | 0.089 | 0.429 | 0.204 | 0.080 | 0.146 | |
| [day−1] | 0.234 | 0.241 | 0.202 | 0.391 | 0.262 | 0.229 |
| [day] | 9.78 | 11.7 | 9.89 | 14.0 | 11.0 | 11.5 |
Publisher’s Note: MDPI stays neutral with regard to jurisdictional claims in published maps and institutional affiliations. |
© 2021 by the authors. Licensee MDPI, Basel, Switzerland. This article is an open access article distributed under the terms and conditions of the Creative Commons Attribution (CC BY) license (https://creativecommons.org/licenses/by/4.0/).
Share and Cite
Silvestri, T.; Immirzi, B.; Dal Poggetto, G.; Di Donato, P.; Mollo, V.; Mayol, L.; Biondi, M. How Poloxamer Addition in Hyaluronic-Acid-Decorated Biodegradable Microparticles Affects Polymer Degradation and Protein Release Kinetics. Appl. Sci. 2021, 11, 7567. https://doi.org/10.3390/app11167567
Silvestri T, Immirzi B, Dal Poggetto G, Di Donato P, Mollo V, Mayol L, Biondi M. How Poloxamer Addition in Hyaluronic-Acid-Decorated Biodegradable Microparticles Affects Polymer Degradation and Protein Release Kinetics. Applied Sciences. 2021; 11(16):7567. https://doi.org/10.3390/app11167567
Chicago/Turabian StyleSilvestri, Teresa, Barbara Immirzi, Giovanni Dal Poggetto, Paola Di Donato, Valentina Mollo, Laura Mayol, and Marco Biondi. 2021. "How Poloxamer Addition in Hyaluronic-Acid-Decorated Biodegradable Microparticles Affects Polymer Degradation and Protein Release Kinetics" Applied Sciences 11, no. 16: 7567. https://doi.org/10.3390/app11167567
APA StyleSilvestri, T., Immirzi, B., Dal Poggetto, G., Di Donato, P., Mollo, V., Mayol, L., & Biondi, M. (2021). How Poloxamer Addition in Hyaluronic-Acid-Decorated Biodegradable Microparticles Affects Polymer Degradation and Protein Release Kinetics. Applied Sciences, 11(16), 7567. https://doi.org/10.3390/app11167567