Article

High Resolution STEM Images of the Human Tooth Enamel Crystals

by
José Reyes-Gasga
1,* and
Etienne F. Brès
2
1
Instituto de Física, Universidad Nacional Autónoma de México, Circuito de la Investigación Científica s/n, Cd. Universitaria, Coyoacán, Ciudad de México 04510, Mexico
2
UMET, UMR 8207 CNRS, Bâtiment C6, Faculté des Sciences et Technologies, Université de Lille, 59650 Villeneuve d’Ascq, France
*
Author to whom correspondence should be addressed.
Appl. Sci. 2021, 11(16), 7477; https://doi.org/10.3390/app11167477
Submission received: 8 July 2021 / Revised: 7 August 2021 / Accepted: 12 August 2021 / Published: 14 August 2021
(This article belongs to the Special Issue Nanoscale Characterization of Bioceramics)

Abstract

:
High-resolution scanning transmission electron microscopy (STEM) images of human tooth enamel crystals, mainly in the high-angle annular dark-field (STEM-HAADF) mode, are presented in this work along the [1000], [10-11]. and [1-210] directions. These images allow knowing some structural details at the nanometric level of the human tooth enamel crystals and of the central dark line (CDL) observed at their centers. The transmission electron microscopy (TEM) and high-resolution TEM (HRTEM) images of the CDL showed the Fresnel contrast. In the STEM bright-field (STEM-BF) and annular-dark-field (STEM-ADF) images, the CDL was observed as an unstrain hydroxyapatite (HAP)-like zone but surrounded by a strained zone. In the STEM-HAADF images, the CDL appeared with a weak contrast, and its contrasts’ thickness was registered between 3 and 8 Å. The arrangement obtained in the STEM-HAADF images by identifying the bright points with the Ca atoms produced the superposition of the HAP atomic sites, mainly along the [0001] direction. The findings provide further information on the structure details at the center of enamel crystals, which favors the anisotropic carious dissolution at the CDL.

1. Introduction

1.1. Human Tooth Structure

The human tooth is made up of dentin, which is a connective tissue that gives shape and stiffness. In the crown, dentin is covered by enamel, the most wear-resistant tissue in the human body. Enamel is responsible for protecting teeth from wear and tear caused by chewing as well as corrosion from acids produced from food debris. The dentin–enamel junction zone is where dentin meets enamel.
Dentin is made up of a 70% inorganic material, a 20% organic material, and 10% water. Enamel is composed of a 90% inorganic material, a 5% organic material, and 3% water [1]. The inorganic component is calcium phosphate named hydroxyapatite (HAP, Ca10(PO4)6(OH)2). The organic part is collagen. The EDS analyses of enamel and dentin indicate the existence of substitute elements, such as Mg, Na, and Cl, and residual organic elements, such as C and N, in addition to the HAP elements Ca, P, and O [2,3].
At the micrometric level, enamel is made up of elongated structures arranged in rows with sinuous trajectories from the dentin–enamel junction to the enamel surface named rods or prisms. This prismatic structure has a keyhole-type shape. At the nanometer level, the enamel prisms are made up of ribbon-shaped crystals which are approximately 70 to 170 nm long, aligned with the length of the rods. When cross-sectioned, the crystallites appear as semi-polygons with a 20-to-50 nm thickness range [1]. In the center of the enamel crystals, small concentrations of Mg2+ and Na+ have been reported [3], which indicates modifications in the elements of the HAP unit cell at this region. Understanding the structure and chemistry of enamel at the nanoscale is essential for elucidating the enamel dissolution process and for developing new dental treatments.

1.2. The Central Dark Line

At the central region of the human tooth enamel crystals, a defect named as “the central dark line” (CDL) was observed. In transmission electron microscopy (TEM) images, the CDL showed a contrast similar to the “Fresnel contrast” of edge-on defects; that is, it appeared as a dark line with a width of ~1 nm out-of-focus in both cross-sectional and transverse section samples, but it was white in over-focus and disappeared in-focus (the Gaussian focus) [3,4,5]. Figure 1 shows a bright-field TEM image of human tooth enamel crystals, where the arrows indicate the positions of the CDL. The inset shows a high-resolution TEM (HRTEM) image of the CDL in one of these crystals.
Because enamel crystals begin to dissolve from the center during acidic attacks such as caries [6], the CDL is of particular interest. Figure 2a shows the graphic representation of the dissolution of the human tooth enamel by acid attack, and Figure 2b shows its HRTEM image as they began to dissolve after treated with orthophosphoric acid for simulating acid attacks: the acid attack always started at the center of the crystals. Taking as a basis the hexagonal unit cell of HAP, during caries, the human tooth enamel crystals were destroyed systematically: first, a central lesion elongated along the [11–20] direction appeared on the basal (0001) planes; and secondly, the lesion developed anisotropically along the [0001] direction across the crystals [7].
The TEM observations of the enamel crystals indicated that the CDL was in fact a planar defect. Several hypotheses have been proposed in its possible origin. One of them is that the CDL is a transformation-mismatched layer from octacalcium phosphate (OCP) to HAP. However, the HAP–OCP interface model generated does not fully reproduce the TEM data [8]. Another possibility is that the CDL is a Ca-rich region within enamel crystals and therefore cannot be the residual of the OCP–HAP mismatch [8,9].
The contrast of the CDL, when observed with a scanning transmission electron microscope (STEM) using an annular detector, gave additional clues on the CDL’s structure. Modern STEM microscopes were equipped with aberration correction systems, and the low- and high-angle scattered electron annular detectors provided bright-field (BF), low-angle annular dark-field (ADF), and high-angle annular dark-field (HAADF) images with sub-angstrom resolution [10]. STEM-BF images include the transmitted beam and small-angle scattered beams produced by Rutherford elastic scattering, plasmons, and phonons [11]. When human tooth enamel crystals were observed by an STEM, the BF image showed a contrast similar to the HRTEM images, and the CDL appeared dark (Figure 3a). In the STEM-ADF image, the collection of scattered beams was made at angles between 25 and 250 mrad and, therefore, their contrast present elastic deformation fields (Figure 3b) [11]. In this case, the CDL showed a bright contrast surrounded by an extended gray zones produced by strain (Figure 3d) [2,3]. For the HAADF-STEM image, scattered beams at angles between 50 and 250 mrad were collected. These large-angle scattered beams were related to the atomic number of the sample (the Z-contrast), and the contrast of these images at atomic resolution was “interpretable” in a direct way [11]. That is, the light contrast indicated atomic positions with a larger Z value, and the gray and dark contrast were related to atomic positions with a smaller Z value. Figure 3c shows the HAADF-STEM image of the human tooth enamel crystal at a low magnification. In this case, the CDL contrast was weak and, sometimes, becomes almost invisible, which indicated that the large-angle scattered beams were generated in practically the whole crystal.
The electron diffraction patterns (EDPs) of human tooth enamel crystals indicated a hexagonal unit cell in agreement with the HAP data of a PDF 09–0432 X-ray diffraction card (hexagonal unit cell with lattice parameters (a = 9.418 Å and c = 6.884 Å) and space group P63/m (No. 176)). Figure 4a shows the electron diffraction pattern of a human tooth enamel crystal along the [10-10] direction (the diffraction patterns shown in Figure 4 are in fact nano-diffraction patterns (nano-EDP), since the crystals had nanometric dimensions and the minimum cross-section of the incident electron beam used to obtain EDPs in TEM was greater than 10 nm and the nanometric region of the crystals from which the EDPs came was practically the whole crystal of the human tooth enamel). The CDL plane was perpendicular to the [10-10] direction and parallel to the plane formed by the [0001] and [1-210] directions (Figure 4b). Therefore, for the observation of the CDL, the crystals must be oriented in directions perpendicular to the [10-10] axis, such as the [0001], [10-11], and [1-210] directions, and these were the directions in which the crystals were observed to obtain the STEM images that we presented in this work. If the [0001] axis was designated as 0°, the [10-11] and [1-210] axes were at 54° and 90°, respectively.
Figure 5 shows a three-dimensional (3D) representation of the CDL plane in the hex-agonal HAP unit cell. The CDL plane coincided with the plane formed by [0001] and [1-210], i.e., the plane (10-10). Figure 5 also includes the views of the HAP unit cell along the [0001] (Figure 5b) and [10-11] (Figure 5b) axes. As observed in Figure 5b, the HAP unit cell was symmetric on both sides of the CDL plane, which became a mirror plane m.

1.3. Dental Caries and Defects at the Nanoscale

Dental caries and periodontal diseases are the most common bacterial infections in humans [12]. As observed in Figure 2, at the nanoscale, during carious processes or other acidic attack, human tooth enamel crystals were destroyed systematically: first a central lesion elongated along the [11-20] direction appeared on the (0001) basal planes of the crystals; secondly, this lesion developed anisotropically along the [0001] direction across the crystals; and third, the crystals were break open [7]. No full explanation for the anisotropic crystal dissolution has yet been put forward. Neither the structural reason for the anisotropic dissolution nor the implications for the mineralization/demineralization process have yet been fully understood.
Nevertheless, several common-sense observations have been made (Figure 2): (1) there was a structural feature on the center of the crystal basal faces different from the adjoining surface; (2) after dissolution, the lesion was hexagonal in shape and did not split the crystal along the [11-20] direction; (3) the dissolution process propagated anisotropically along the [0001] direction, which indicated that the structural feature was 3D.
Several approaches are followed to conduct the ongoing research on that subject such as the analysis of etch pits at the HAP surface [13,14] and surface energy calculations [15]. Defects in tooth enamel crystals aligned along the [11-20] direction have been analyzed by HRTEM. Brès et al. [6] identified some types of disorders that may act as dissolution sites. Recent work by Gordon et al. [16] and by Yun et al. [3] have shown a high concentration of Na+ and Mg2+ ions at the center of enamel crystals. These findings have been specified by DeRocher et al. [2], who have shown the existence of two nanometric layers enriched with Mg2+ flanking a core rich in Na+, F, and CO32− ions. This sandwich core being surrounded by a shell with lower concentrations of substitutional defects. The residual stress created by the chemical gradients may favor the anisotropic carious dissolution.
All these works are still in progress. It must be noted that no explanation has yet been given on the elongated shape of the lesion along the [11-20] direction and for the fact that it does not split open the crystals as would a grain boundary. Another approach to understanding the structural mechanisms of the dissolution anisotropy is the analysis of a contrast phenomenon observed at the very dissolution sites such as the CDL.
In this paper, we present the analysis of the aberration-corrected high-resolution HAADF-STEM images of the CDL of human tooth enamel crystals along the [0001] (0°/a), [10-11] (54°/a), and [1-210] (90°/a) directions, which will allow obtaining more detailed information on the structural characteristics of the CDL at the nanometric level.

2. Materials and Methods
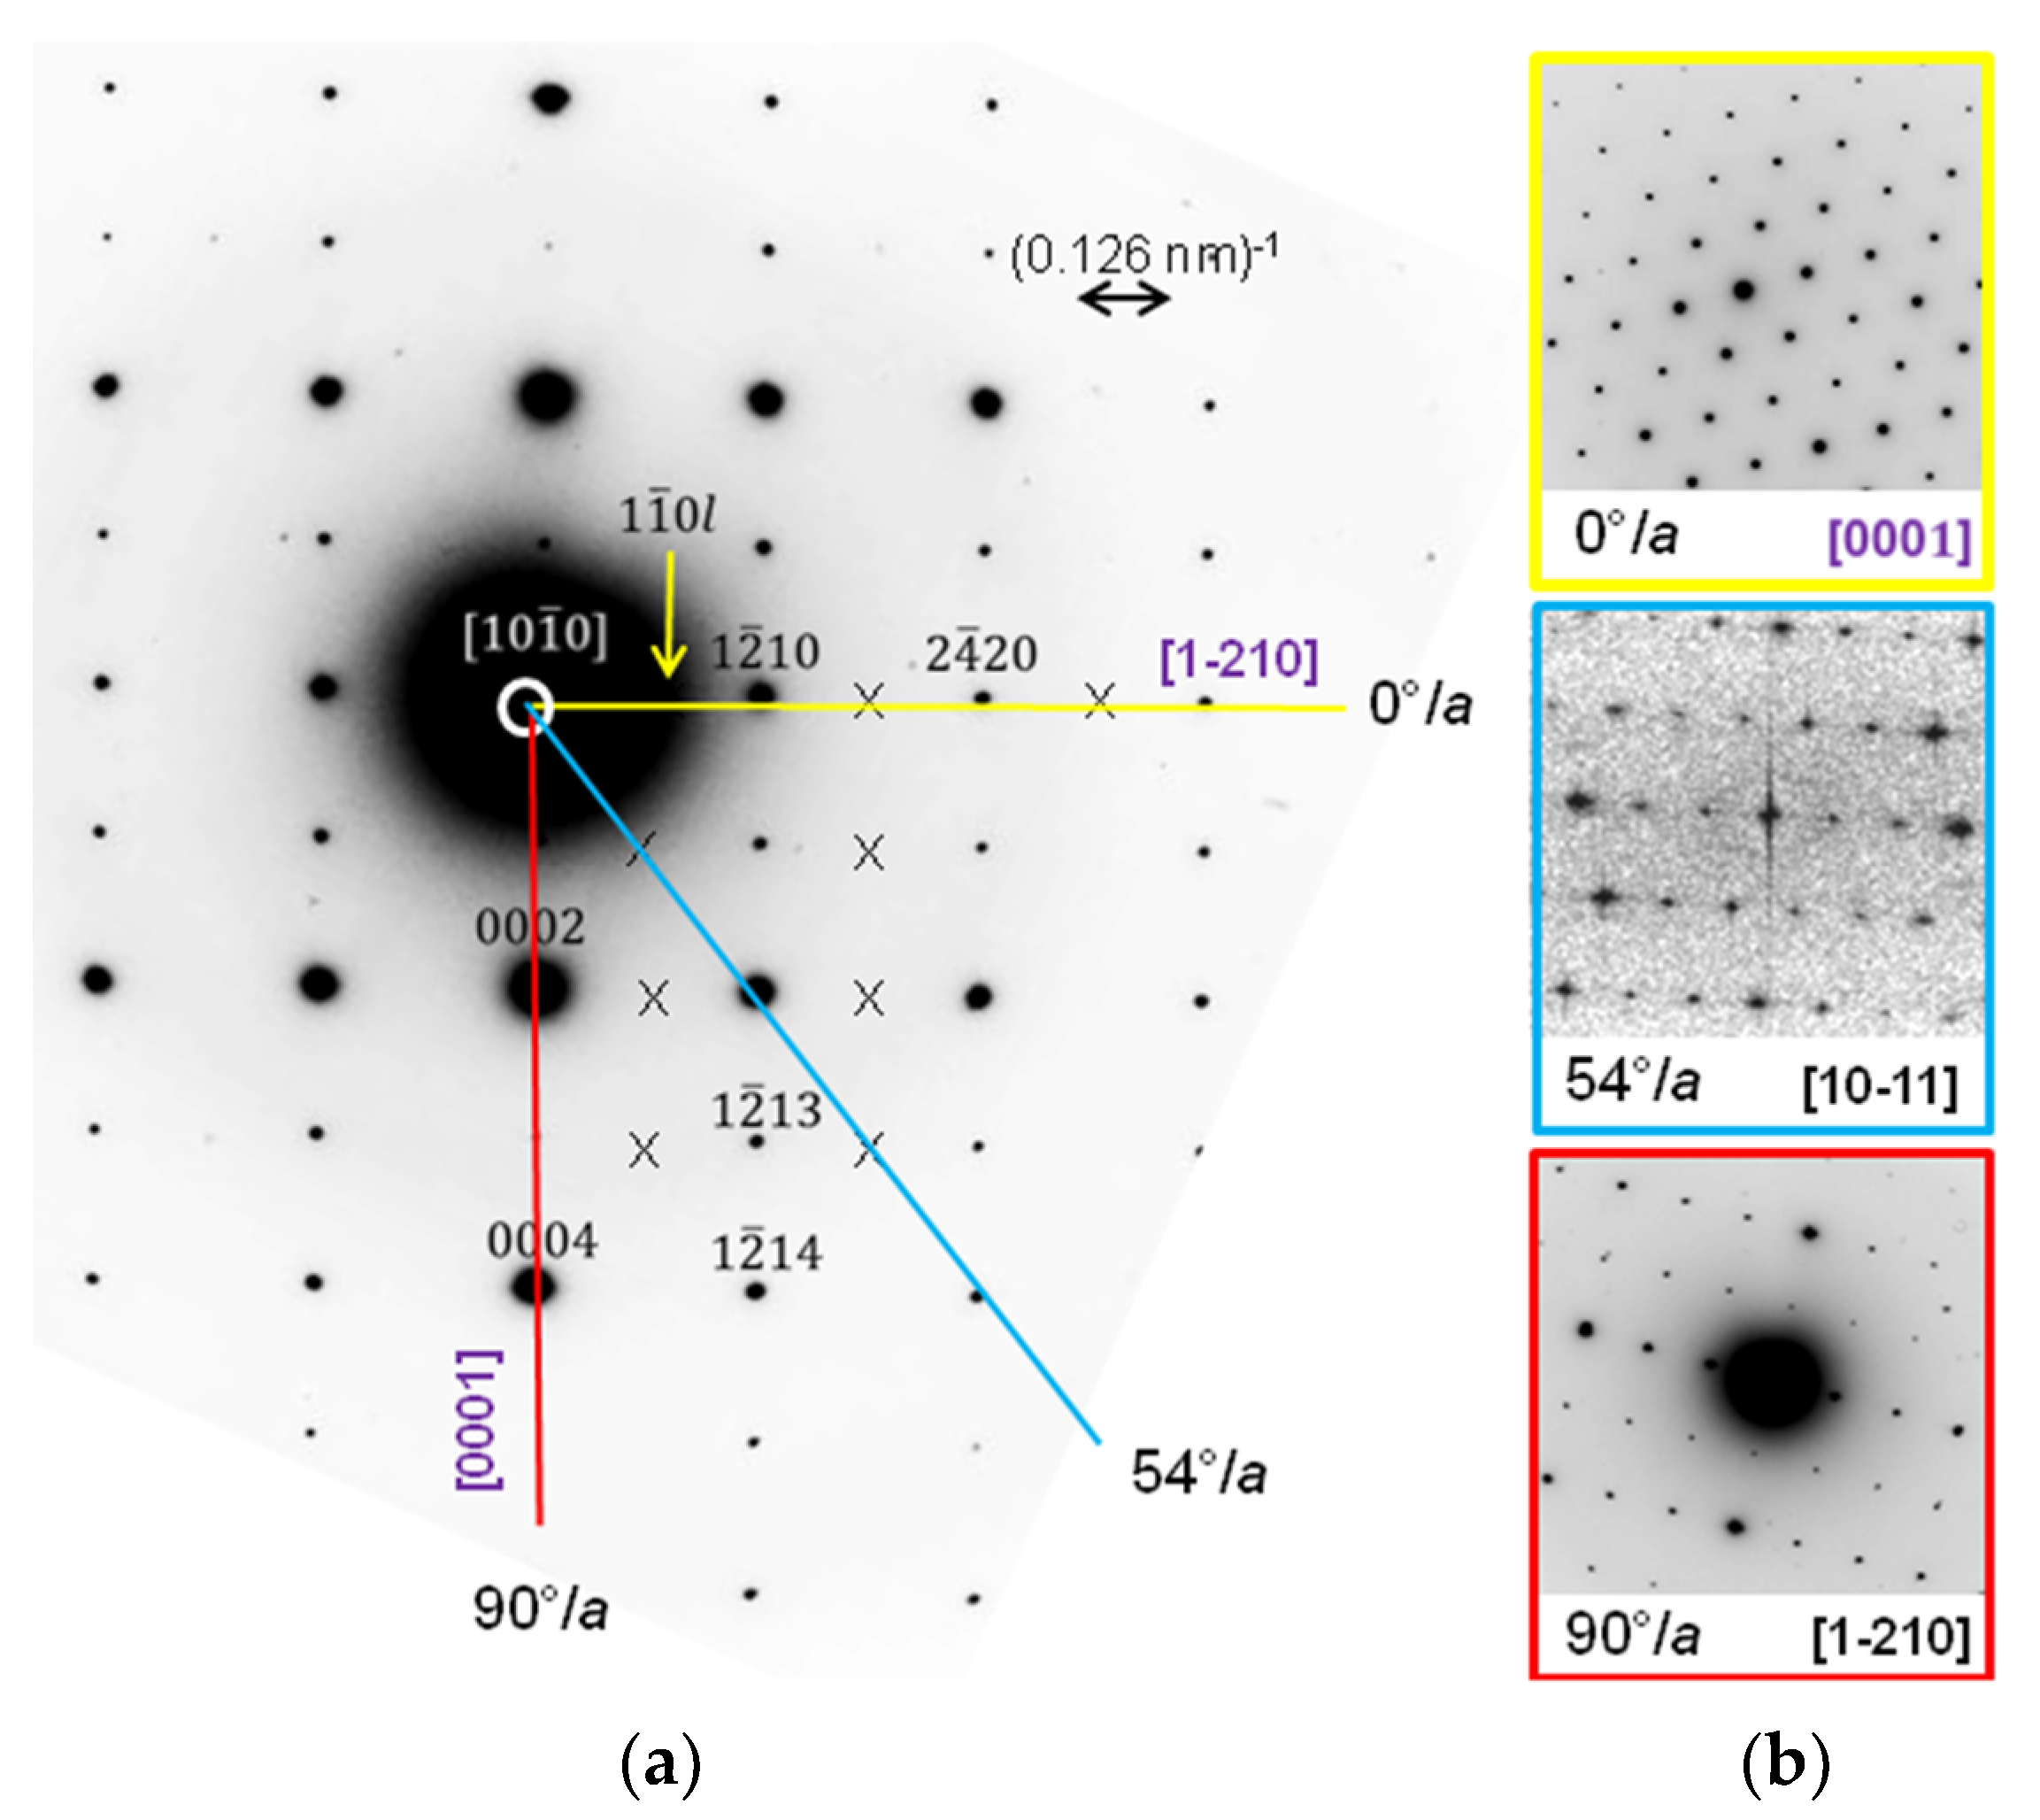
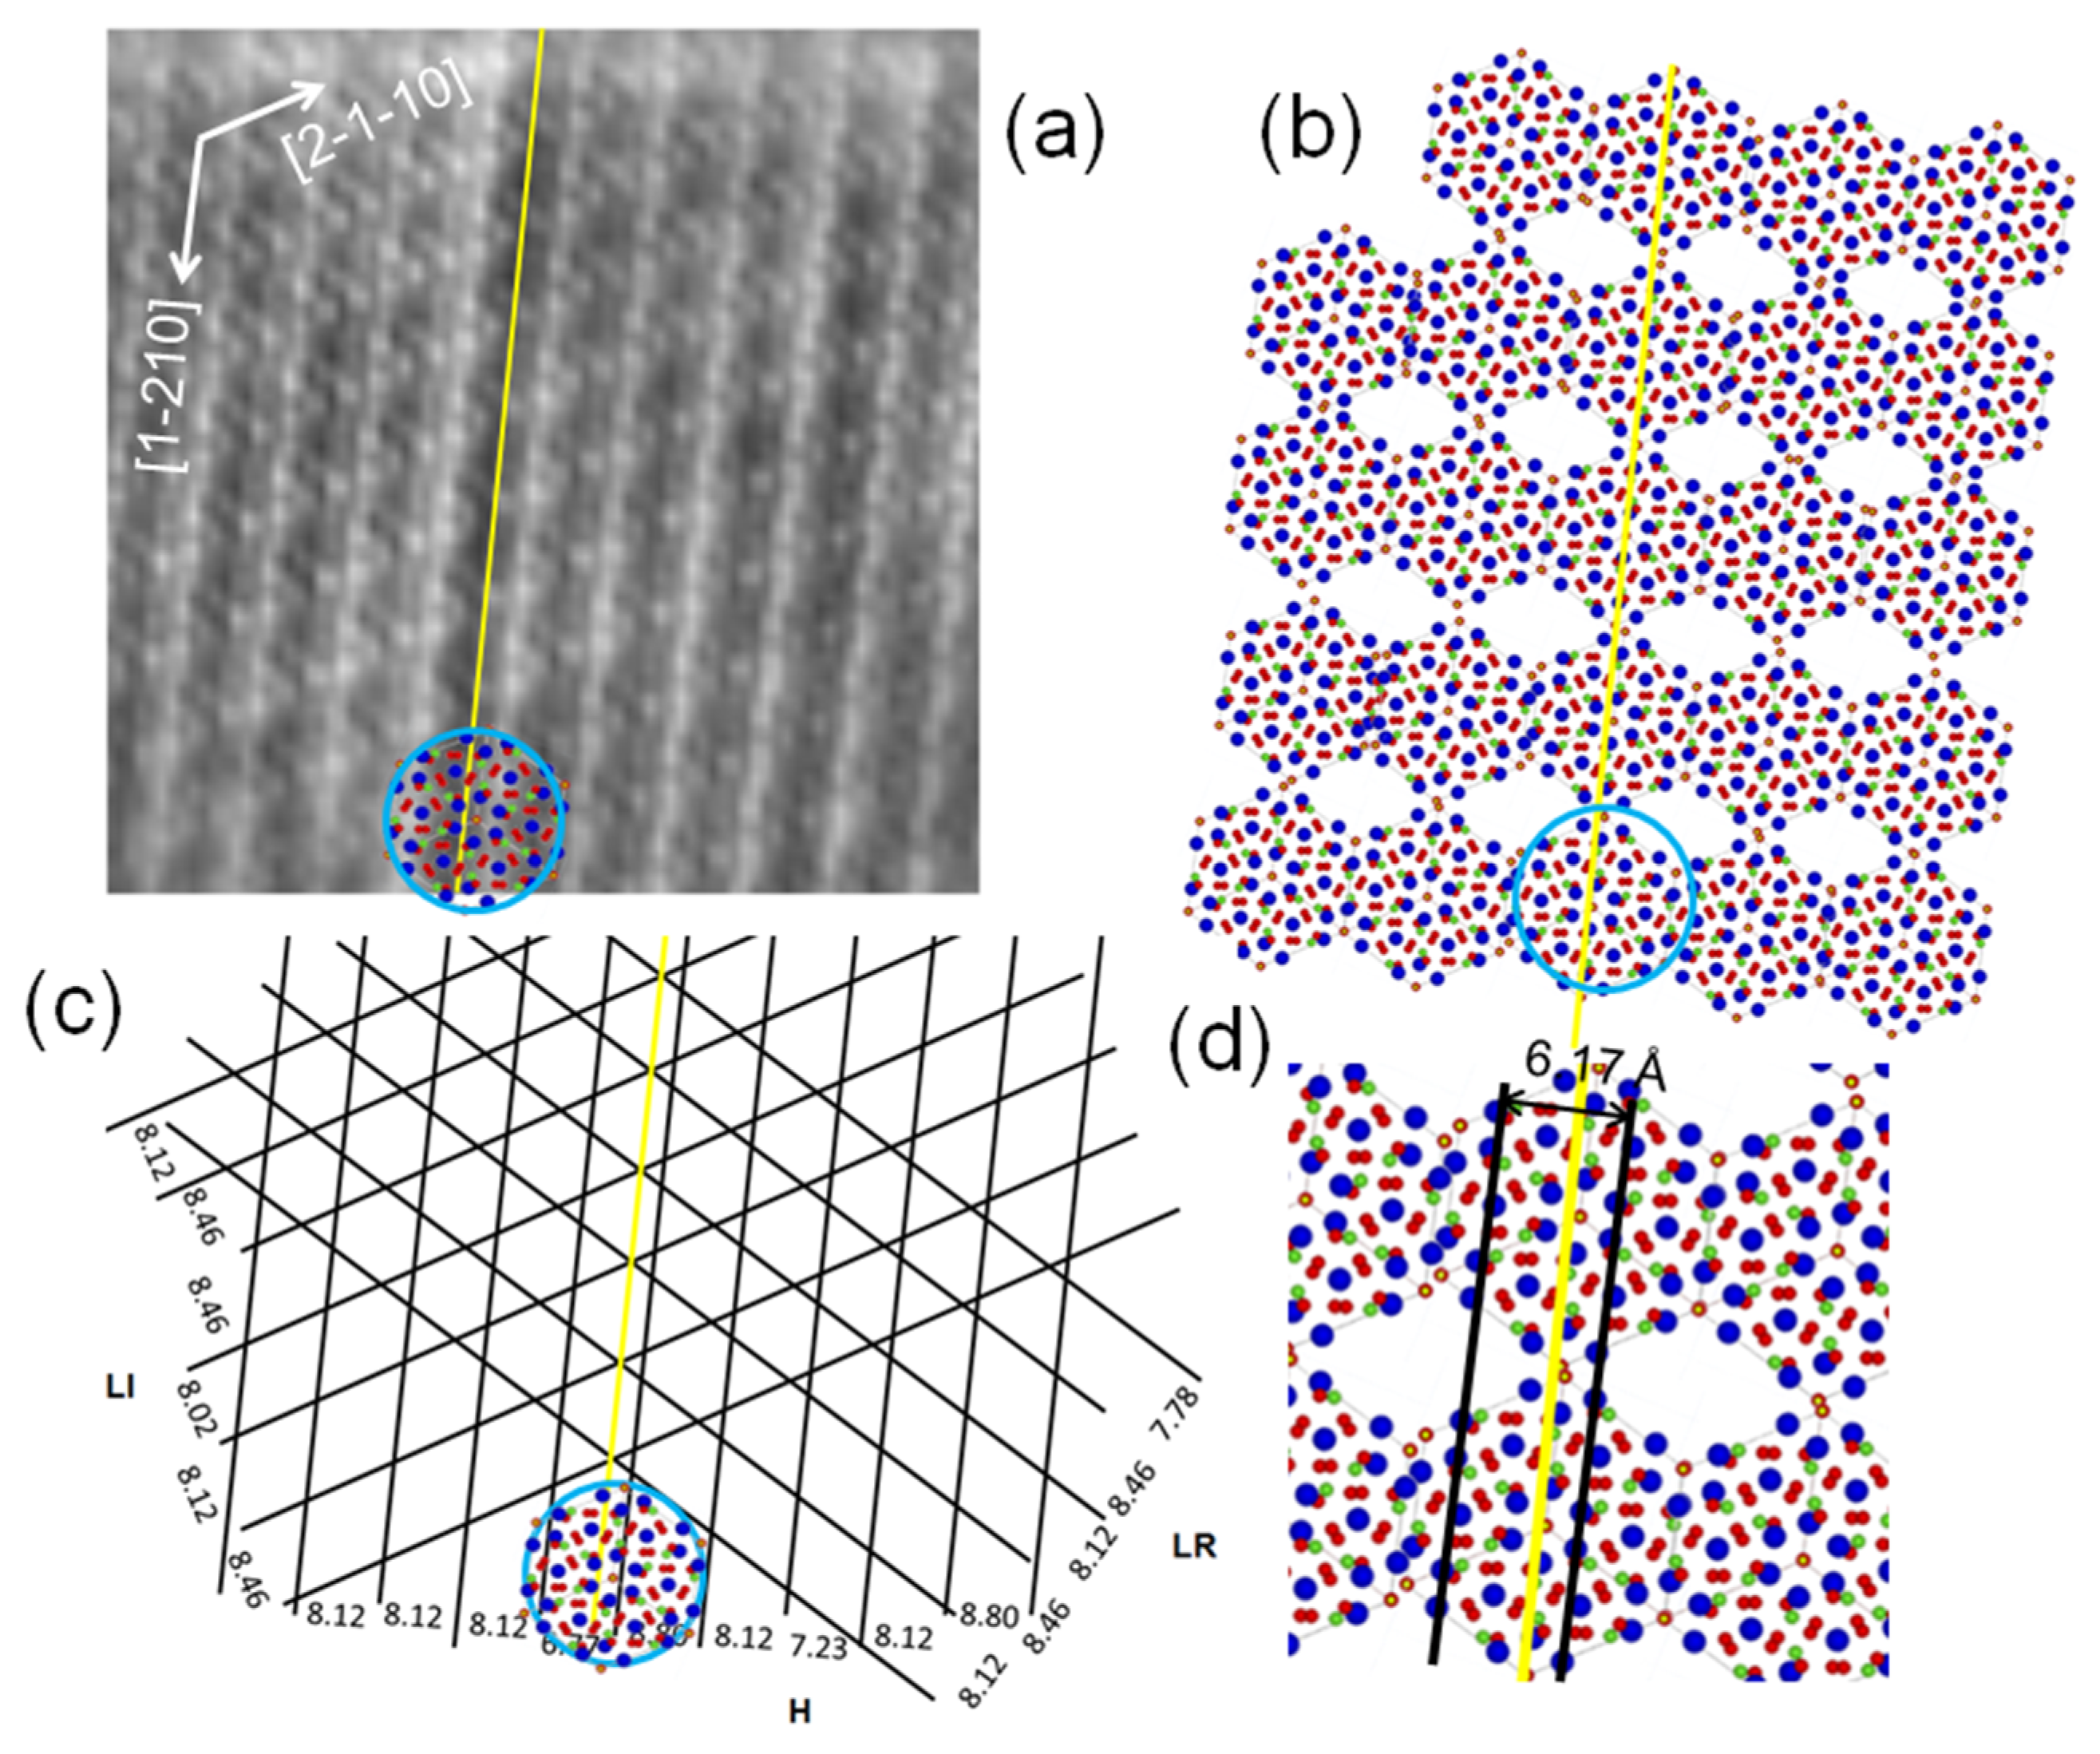
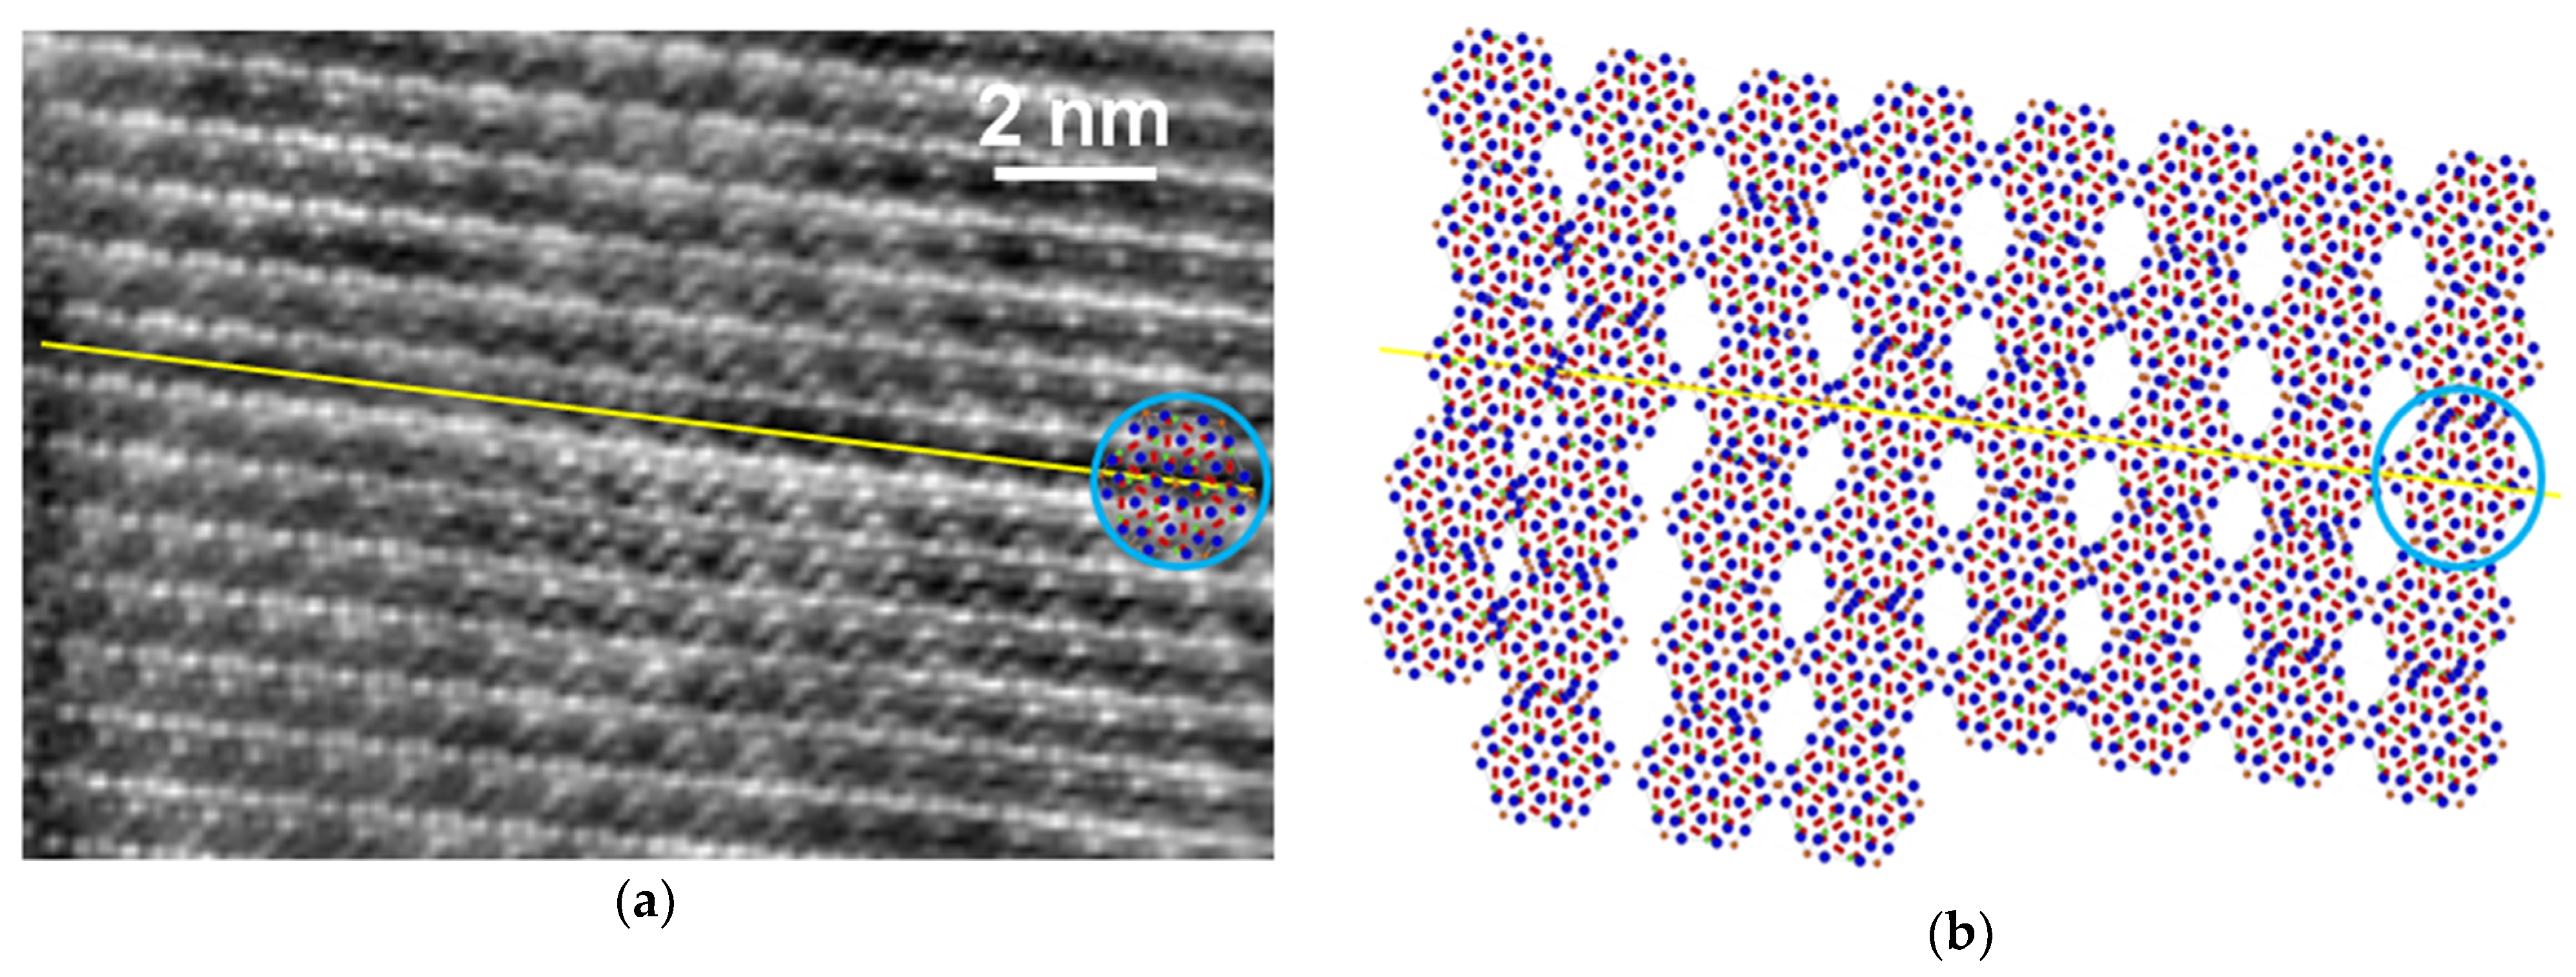
Human tooth samples of 30-year-old permanent molar teeth obtained from dental treatments were used according to the Institutional Review Board (IRB) approval protocol (FMED/CI/SPR/083/2015) approved by the University of Mexico. The general sample preparation procedure consisted of the following: (1) cutting the tooth, (2) mechanical thinning, (3) polishing to mirror finish, (4) etching with orthophosphoric acid, and (5) cutting with a focused beam (FIB). A careful selection of teeth was made to avoid those with cracks and/or severe decay damage.
Human tooth enamel was cut with a diamond disc into 3 × 3 mm slices with 250 to 500 µm thickness. The thickness reduction was carried out by mechanical polish down with a sandpaper to thicknesses less than 100 µm. The samples were mirror-polished with a micro cloth and alumina powder. To clean the sample, it was placed in a solution of isopropanol and acetone (v/v: 60%:40%) in the ultrasonic cleaner for 15 min. The mirror-finished sample was etched with phosphoric acid to reveal its structure. Finally, the sample was washed with distilled water for 10 min and dried with compressed air.
With the FIB equipment of gallium (Ga) ions, foils of the sample with an adequate TEM thickness were obtained. At the end, the foil was set on a TEM grid for observation. A Thermo Fisher Scientific QUANTA 200-3D FIB (Thermo Fisher Scientific, Hillsboro, OR, USA) with a field emission filament (FIB) and a Ga ion source was used. The acceleration voltage was 30 kV for the two beams at probe currents of 200 nA for the electron beam and 50 nA for the ion beam. The electron and Ga ion beams coincided at a working distance of 10 mm. The OmniprobeTM (Oxford Instruments, Abingdon, UK) 100.7 micromanipulator equipped with gas injection systems for platinum (Pt) deposition was used for the in-situ manipulation of TEM samples.
STEM images were obtained with the FEI Qu-Ant-EM microscope with Cs correction at the EMAT of the University of Antwerp. This was an FEI Titan G3 microscope (FEI, Eindhoven, The Netherlands) equipped with a Schottky field emission electron gun and spherical aberration correctors. The double aberration correctors offered a spatial resolution of 0.5 Å with TEM and that of 0.8 Å with STEM and a flexible choice of acceleration voltages between 60 and 300 kV.
For enamel samples observations, we worked with 200 kV and with the lowest electron dose, <0.1 e/A2, because the electron damage in enamel samples was greater at 60 kV and 80 kV than at 200 kV (result commonly observed in ceramic materials in which radiolysis damage and heating are registered [17]). The main observation parameters were as following: voltage, 200 kV; spot size, 9; probe current, 0.04 nA; and working length, 56–91 mm for HAADF observations with internal detection angles of 41 to 92 mrad and 220–230 mm for HAADF observations with internal detection angles of 10 to 35 mrad for ADF observations. Because low-dose STEM images are very noisy, the image contrast was increased by digital processing using the Fast Fourier Transform (FFT) and dot filters with the GATAN’s Digital-Micrograph software (Gatan Inc., Boston, MA, USA). JEMS software [18] was used for the simulation.

3. Results

Considering that the STEM-HAADF images depend on the atomic number of the sample and that Z = 20 for Ca, Z = 15 for P, Z = 8 for O, and Z = 1 for H, the bright spots are related to the Ca atoms, followed in intensity by the P atoms. The O and H atoms had the minimum intensity. This made the contrast of these images to be directly interpreted.
Figure 6a shows the STEM-HAADF image of human tooth enamel crystals in the [0001] direction. The crystalline periodicity can be clearly observed in the enamel crystals, and neither planar defects nor dislocations were directly observed in the CDL region. Taking that the brightest points corresponded to the Ca atom positions in the HAP unit cell, and the line indicates the CDL position, Figure 6b shows the arrangement generated (the voids presented were deliberately introduced for the clarity of the arrangement). The periodicities observed along the H, LI, and LR lines (Figure 6c), which were parallel in the hexagon sides, were 8.02 ± 0.66 Å, 8.26 ± 0.26 Å, and 8.19 ± 0.27 Å, respectively, while for HAP free of defects, this periodicity was 8.17 Å. These periodicities implied, therefore, the existence of stress or strain fields in the tooth enamel crystal. The superposition of the HAP atom positions is another fact observed. For a better observation of the mentioned overlap, Figure 6d shows an enlargement of Figure 6b around the region through which the CDL went. The overlapping produced is a direct result of the strain fields present in the atomic arrangement of the crystals. The thickness of the CDL in the STEM image was 6.17 Å.
Figure 7a shows the STEM-HAADF image of human tooth enamel crystals in the [10-11] direction. Again, the crystalline periodicity was observed in the enamel crystals, and neither planar defects nor dislocations were observed in the CDL region. Considering the brightest points corresponding to the Ca positions in the HAP unit cell, the arrangement shown was generated. As for the [0001] direction, note the superposition that occurred on the positions of the cells, as shown in Figure 7b. Figure 8c shows the periodicities observed in Figure 7a along the V and H lines, which were parallel to the rectangle sides, which were 8.17 ± 0.51 Å and 5.54 ± 0.41 Å, respectively. Figure 7d shows again an enlargement of Figure 7B around the CDL. The overlapping was produced by the strain fields present in the atomic arrangement of the crystals. The thickness of the CDL observed in the STEM image was 3.7 Å.
Figure 8a shows the STEM-HAADF image of human tooth enamel crystals in the [1-210] direction. Once again, the crystalline periodicity was observed in the enamel crystals, and no planar defects nor dislocations were observed in the CDL region. The arrangement obtained with the HAP unit cell by the superposition of the bright spots with the Ca atoms is presented in Figure 8b. Figure 8c shows the periodicities observed in Figure 8a along the V and H directions, which were parallel on the rectangle sides. These were 8.17 ± 0.72 Å and 3.44 ± 0.25 Å, respectively. Figure 8d shows again an enlargement of Figure 8b around the CDL, and the overlapping observed was produced by the strain fields present in the atomic arrangement of the crystals. The thickness of the CDL in this case was 4.7 Å.

4. Discussion

4.1. TEM and STEM Contrasts

The high-resolution STEM-HAADF images of human tooth enamel crystals presented in this work indicated that the CDL thickness was between 3 and 8 Å. The CDL plane was formed by the [1-210] and [0001] directions, and it divided the enamel crystal into two parts, which were related by a mirror plane m. Table 1 summarizes the contrasts presented by the CDL when it was observed by TEM, HRTEM, and STEM in BF and dark-field (DF) modes.
In TEM, the CDL behaved as a Fresnel contrast, because it changed from dark in overfocus conditions to bright in underfocus conditions, and disappears at the Gaussian focus. This Fresnel contrast suggests a change in the internal mean potential produced by the local deviation in stoichiometry in the central region of the enamel crystal [6] similar to the one presented in the TEM by the oriented-in-edge-on-direction grain boundary dislocations and voids [19]. Thus, the origin of the CDL would be a local deviation in stoichiometry in the HAP unit cell at the center of the enamel crystal.
The STEM-ADF contrasts suggested that enamel crystals had a “core-shell” type structure (Figure 3d). DeRocher et al. [2] indicated that the dark contrast around the CDL was a strained zone and the light contrast in the periphery was free of strain. DeRocher et al. [2] and Yun et al. [3] have also indicated that the dark zone is rich in Mg and Na. The presence of Mg2+ in human tooth enamel crystals has been well established [3,20], together with high carbon concentrations due to the presence of carbonate (CO32−) ions [2,3]. Therefore, the size relationship between Ca2+ and Mg2+ results in the lattice contraction deformation observed [2]. In this way, residual stresses due to chemical gradients agree quite well with the preferential dissolution from the CDL of the enamel crystal in acidic media.
Yun et al. [3] commented that an antiphase boundary (APB) can also be produced when enamel crystals grow during amelogenesis, as it happens in the monoclinic crystals [3]. The APB has higher energy than the rest of the crystal provided surely by ions such as Mg2+ and Na+, and it would also explain why CDL is susceptible to demineralization. Although the APB shows the same structure on both sides, the arrangement should be staggered by half an atomic plane. However, this displacement was not observed in the high-resolution STEM-HAADF images.
Therefore, it is reasonable to believe that the contrast behavior of the CDL is an indication that in the CDL the mean internal potential is lower than in the perfect crystal and produced by the local deviation of the stoichiometry of the HAP unit cell.

4.2. Importance of Crystal Defects for the Properties of Enamel Crystals

The knowledge of the fine structural details favoring the dissolution anisotropy of enamel crystals during the carious process is of prime importance for the development of the medical treatment of the disease. It is striking to note that the initial dissolution takes place at the very CDL site. Hence, any development in the knowledge on the CDL advances the knowledge of the dissolution anisotropy and vice versa.
The existence of screw dislocations inside ionic crystals not only favors dissolution, by also growth as first shown by Frank [21], who has shown that dislocations favor low saturation growth. The growth mechanism is favored by the difficulty encountered by the crystal to balance electrical charges at the surface [22]. Hence, the importance is for mineralization.
Furthermore, in ionic crystals such as HAP, there exists a relationship between crystal defects and electric charges, as jogs on surfaces and dislocations act as sources and sinks for point defects. The establishment of the electrical equilibrium with the vacancies, solute ions, and interstitials produces a net charge on the surface or dislocation, surrounded by a compensating space charge region. Within this space, the charge region typically has a thickness of the order of 10 nm. There are very large electric fields (up to about 105 V/cm) and very large perturbations of point defect concentrations (by factors of several hundred). It is likely that such electric fields are related to the change in mean inner potential that give rise to the CDL [23,24].
It is also likely that the surface charge at the emergence of dislocations on ionic surfaces can favor the adhesion of proteins [25].

4.3. Electron Radiation Damage

It is also well-known that human tooth enamel crystals are susceptible to electron beam radiation damage during TEM observation [13,17]. As an example of this, Figure 9 shows the high-resolution STEM-HAADF image of the human tooth enamel crystals along the [0001] direction with higher electron damage. The generated arrangement obtained by identifying the bright points with the Ca atoms of the HAP unit cell showed a higher density of defects and a major overlapping of the atoms. Therefore, the TEM electron beam increased the overlap of the HAP atoms during the observation of human tooth enamel crystals. On the other hand, Figure 10 shows the STEM-HAADF image of human tooth enamel crystals along the [0001] direction but with drastic electron damage and, therefore, higher defect density. Therefore, to have a better interpretation of the structural characteristics of the CDL and the human tooth enamel crystal structure, a way should be sought to reduce or avoid this situation. One possible way to reduce this effect is by coating the sample surface with a layer of amorphous carbon.
It is important to mention here that in the results presented in this work, a simple superposition of images of the hydroxyapatite unit cell was performed in the mentioned direction and we have not performed an atomic simulation. In addition, although the overlap produced is the direct result of the deformation fields present in the atomic arrangement of the human tooth enamel crystals, we must find a way to perform an atomic simulation in the near future because it is necessary.

5. Conclusions

Aberration-corrected high-resolution HAADF-STEM images indicate that the CDL thickness is between 3 and 8 Å, depending on the axis of observation. The CDL plane was the plane formed by the [0001] and [1-210] directions, i.e., the plane (10-10). This plane divided the enamel crystal into two parts, which were related by a mirror plane m, implying a reduction in the symmetry of the HAP unit cells on which the CDL was located.
The dark contrast observed in the ADF-STEM images and the superposition of the atoms of the HAP unit cell implied the existence of stress and strain around the CDL, suggesting a “core-shell”-type structure for enamel crystals. The Fresnel contrast of the CDL in TEM images, in which it changed from dark in the overfocus and bright in the underfocus conditions and disappeared at the Gaussian focus, suggested a change in the mean internal potential of the crystal at this site produced by the local deviation of the stoichiometry of the HAP unit cell.
Care should be taken to reduce electron radiation damage in tooth enamel samples rather than introduce additional parameters during the study of the structure of the CDL and of the crystal of human tooth enamel itself.
We proposed that the findings described in the present paper provide further information on the structure details at the center of enamel crystals; these details favor both the anisotropic carious dissolution and the CDL. However, we are very conscious that further work is required before a full understanding of both phenomena can be reached.

Author Contributions

J.R.-G. and E.F.B. have done the data curation, the formal analysis, and the writing of the manuscript. All authors have read and agreed the published version of the manuscript.

Funding

This work was financially supported by the DGAPA-UNAM through the project PAPIIT IN101319.

Institutional Review Board Statement

The study was conducted according to the guidelines of the Declaration of Helsinki, and human tooth samples of 30-year-old permanent molar teeth were obtained from dental treatments approved by the Institutional Review Board (IRB) approval protocol (FMED/CI/SPR/083/2015) approved by the University of Mexico.

Informed Consent Statement

It is included in the IRB approval protocol. Informed consent was obtained from all subjects involved in the study.

Data Availability Statement

Not applicable.

Acknowledgments

The authors thank Gustaaf Van Tendeloo for ESTEEM support at EMAT, University of Antwerpen (Belgium), and Johan Verbeeck for comments and suggestions. The authors also thank Stuart Torner for technical support and practical suggestions. This research received funding from the European Union Seventh Framework Programme under Grant Agreement 312483-ESTEEM2 (Integrated Infrastructure Initiative-I3). The authors also thank S. Tehuacanero-Nuñez, and P. López-Arriaga for their technical support in the elaboration of this work.

Conflicts of Interest

The authors declare no conflict of interest.

References

  1. LeGeros, R.Z. Calcium Phosphates in Oral Biology and Medicine. Monogr. Oral Sci. 1991, 15. [Google Scholar] [CrossRef]
  2. DeRocher, K.A.; Smeets, P.J.M.; Goodge, B.H.; Zachman, M.J.; Balachandran, P.V.; Stegbauer, L.; Cohen, M.J.; Gordon, L.M.; Rondinelli, J.M.; Kourkoutis, L.F.; et al. Chemical gradients in human enamel crystallites. Nature 2020, 583, 66. [Google Scholar] [CrossRef]
  3. Yun, F.; Swain, M.V.; Chen, H.; Cairney, J.; Qu, J.; Sha, G.; Liu, H.; Ringer, S.P.; Han, Y.; Liu, L.; et al. Nanoscale pathways for human tooth decay—Central planar defect, organic rich precipitate and high-angle grain boundary. Biomaterials 2020, 235, 119748. [Google Scholar] [CrossRef]
  4. Marshall, A.F.; Lawless, K.R. TEM study of the central dark line in enamel crystallites. J. Dent. Res. 1981, 60, 1773–1782. [Google Scholar] [CrossRef]
  5. Reyes-Gasga, J.; Hémmerlé, J.; Brès, E.F. Aberration-corrected transmission electron microscopic study of the central dark line defect in human tooth enamel crystals. Microsc. Microanal. 2016, 22, 1047–1055. [Google Scholar] [CrossRef]
  6. Brès, E.F.; Barry, J.C.; Hutchison, J.L. A structural basis for the carious dissolution of the apatite crystals of human tooth enamel. Ultramicroscopy 1983, 12, 367–372. [Google Scholar] [CrossRef]
  7. Voegel, J.C.; Frank, R.M. Stages in the dissolution of human enamel crystals in dental caries. Calcif. Tissue. Res. 1977, 24, 19–27. [Google Scholar] [CrossRef] [PubMed]
  8. Reyes-Gasga, J.; Arellano-Jiménez, M.J.; Garcia-Garcia, R. On the observation of the HAP-OCP interface by electron microscopy. Acta Microsc. 2010, 19, 279–284. [Google Scholar]
  9. Reyes Gasga, J.; Carbajal-de-la-Torre, G.; Bres, E.; Gil-Chavarria, I.M.; Rodrıguez-Hernandez, A.G.; Garcia-Garcia, R. STEM-HAADF electron microscopy analysis of the central dark line defect of human tooth enamel crystallites. J. Mater. Sci. Mater. Med. 2008, 19, 877–882. [Google Scholar] [CrossRef]
  10. Haider, M.; Rose, H.; Uhlemann, S.; Schwan, E.; Kabius, B.; Urban, K. A spherical-aberration-corrected 200kV transmission electron microscope. Ultramicroscopy 1998, 75, 53–60. [Google Scholar] [CrossRef]
  11. Grieb, T.; Muller, K.; Fritz, R.; Schowalter, M.; Neugebohrn, N.; Knaub, N.; Volz, K.; Rosenauer, A. Determination of the chemical composition of GaNAs using STEM-HAADF imaging and STEM strain state analysis. Ultramicroscopy 2012, 117, 15–23. [Google Scholar] [CrossRef] [PubMed]
  12. Loesche, W.J. Role of streptococcus mutans in human dental decay. Microbiol. Rev. 1986, 50, 353–380. [Google Scholar] [CrossRef] [PubMed]
  13. Arends, J. Dislocations and dissolution of enamel. Caries Res. 1973, 7, 261–268. [Google Scholar] [CrossRef]
  14. Kwon, K.Y.; Wang, E.; Chung, A.; Chang, N.; Saiz, E.; Choe, U.J.; Koobatian, M.; Lee, S.W. Defect induced asymmetric pit formation on hydroxyapatite. Langmuir 2008, 24, 11063–11066. [Google Scholar] [CrossRef]
  15. Arends, J.; Jongebloed, W.L. Dislocations and dissolution in apatites: Theoretical considerations. Caries Res. 1977, 11, 186–188. [Google Scholar] [CrossRef]
  16. Gordon, L.M.; Cohen, M.J.; MacRenaris, K.W.; Pasteris, J.D.; Seda, T.; Joester, D. Amorphous intergranular phases control the properties of rodent tooth enamel. Science 2015, 347, 746–750. [Google Scholar] [CrossRef] [PubMed] [Green Version]
  17. Reyes-Gasga, J.; García-García, R. Analysis of the electron beam radiation damage of TEM samples in the accelerating energy range from 0.1 MeV using the standard theory for fast electrons. Radiat. Phys. Chem. 2002, 64, 359–367. [Google Scholar] [CrossRef]
  18. Stadelmann, P.A. EMS-a software package for electron diffraction analysis and HREM image simulation in materials science. Ultramicroscopy 1987, 21, 131–145. Available online: http://cimewww.epfl.ch/stadelmann/jemsWebSite/jems.html (accessed on 10 May 2021). [CrossRef]
  19. Ruhle, M.; Sass, L. The detection f the change in mean inner potential at dislocations in grain boundaries in NiO. Phil. Mag. A 1984, 49, 759–782. [Google Scholar] [CrossRef]
  20. Brès, E.F.; Reyes-Gasga, J.; Rey, C.; Michel, J. Probe size study of apatite irradiation in STEM. Eur. Phys. J. Appl. Phys. 2014, 67, 20401. [Google Scholar] [CrossRef] [Green Version]
  21. Frank, F.C. The influence of dislocations on crystal growth. Discuss. Faraday Soc. 1949, 5, 48–66. [Google Scholar] [CrossRef]
  22. Henricks, S.P. Screw dislocation and charge balance as a factor of crystal growth. J. Am. Miner. Soc. 1955, 40, 139–146. [Google Scholar]
  23. Slifkin, L. Surface and Dislocation Effects on Diffusion in Ionic Crystals. In Diffusion in Materials; Laskar, A.L., Bocquet, J.L., Brebec, G., Monty, C., Eds.; NATO ASI Series (Series E: Applied Sciences); Springer: Dordrecht, The Netherlands, 1990; Volume 179. [Google Scholar] [CrossRef]
  24. Amelinckx, S. Dislocations in particular structures. In Dislocations in Solids Volume 2 Dislocations in Crystals; Nabarro, F.R.N., Ed.; North Holland Publ., Co.: Amsterdam, The Netherlands, 1979; pp. 377–398. [Google Scholar] [CrossRef]
  25. Shtukenberg, A.G.; Ward, M.D.; Kahr, B. Crystal growth with macromolecular additives. Chem. Rev. 2017, 117, 14042–14090. [Google Scholar] [CrossRef] [PubMed]
Figure 1. TEM image of human tooth enamel. The Inset shows the high-resolution TEM (HRTEM) image of one of these crystals. The arrows indicate the central dark line (CDL) positions.
Applsci 11 07477 g001
Figure 2. (a) Graphic representation of the dissolution of the enamel crystals of human teeth by acid attack. This starts from the center of the crystal. (b) HRTEM image of enamel crystals in step 2 of an enamel sample after treated with orthophosphoric acid for simulating acid attacks.
Applsci 11 07477 g002
Figure 3. Scanning transmission electron microscopy (TEM) images of the human tooth enamel crystals. (a) STEM-bright-field (BF) image; (b) STEM-angular dark-field (ADF) image; (c) STEM-high-angle angular dark-field (HAADF) image. Note the CDL contrast in each case; (d) magnified ADF-STEM image of one of the human tooth enamel crystals where the dark contrast around the CDL indicates a region of strain. The arrows indicate the CDL positions.
Applsci 11 07477 g003
Figure 4. (a) Electron diffraction pattern of a human tooth enamel crystal along the [10-10] axis. It was indexed with the hexagonal hydroxyapatite (HAP) unit cell. (b) The [1000], [10-11], and [1-210] diffraction patterns, which are perpendicular to the [10-10] axis. The color of the line indicates the zone axis of the diffraction pattern of the squares with the same color.
Applsci 11 07477 g004
Figure 5. (a) Three-dimensional (3D) representation of the hexagonal HAP unit cell indicating the position of the CDL plane (the [10-10] plane). (b) View along the [0001] axis. The rectangle indicates the position of the CDL. (c) View along the [1-011] axis. Ca atoms are in blue, P atoms are in green, O atoms are in red, and H atoms are in yellow.
Applsci 11 07477 g005
Figure 6. (a) STEM-HAADF image of human tooth enamel crystals in the [0001] direction. (b) Arrangement obtained by identifying the bright points with the Ca atoms of HAP. The voids are presented just for the clarity of the arrangement. Note the superposition of the atoms positions. (c) Periodicities observed along the H, LI, and LR lines separately. (d) Magnification of the CDL zone; the observed thickness of the CDL is also indicated. The blue circle is at the same position in the three cases. The yellow line indicates the position of the CDL. Ca atoms are in blue, P atoms are in green, O atoms are in red, and H atoms are in yellow.
Applsci 11 07477 g006
Figure 7. (a) STEM-HAADF image of human tooth enamel crystals in the [10-11] direction. (b) Arrangement obtained by identifying the bright points with the Ca atoms in the HAP unit cell. The voids are presented for the clarity of the arrangement. (c) The periodicities observed along the V and H directions separately. (d) Magnified CDL zone; the observed thickness of the CDL is indicated. The blue rectangle is at the same position in the three cases. The yellow line indicates the position of the CDL. Ca atoms are in blue, P atoms are in green, O atoms are in red, and H atoms are in yellow.
Applsci 11 07477 g007
Figure 8. (a) STEM-HAADF image of human tooth enamel crystals in the [1-210] direction. (b) Arrangement obtained by identifying the bright points with the Ca atoms in the HAP unit cell. (c) The periodicities along the V and H directions separately. (d) Magnified CDL zone. The observed thickness of the CDL is indicated. The blue rectangle is at the same position in the three cases. The yellow line indicates the position of the CDL. Ca atoms are in blue, P atoms are in green, O atoms in red, and H atoms are in yellow.
Applsci 11 07477 g008
Figure 9. (a) STEM-HAADF image of human tooth enamel crystals in the [0001] direction with electron damage. (b) Arrangement obtained by identifying the bright points with the Ca atoms of the HAP unit cell. The voids presented were generated for clarity. The blue circle is at the same position in both cases. The yellow line indicates the position of the CDL. Ca atoms are in blue, P atoms are in green, O atoms are in red, and H atoms are in yellow.
Applsci 11 07477 g009
Figure 10. STEM-HAADF image of human tooth enamel crystals along the [0001] direction with severe electron beam damage.
Applsci 11 07477 g010
Table 1. CDL contrast observed when it is viewed by TEM, HRTEM, and STEM in the BF and dark field (DF) modes.
ImageTEMHTEMSTEM
ContrastAmplitude
(1-beam)
Phase
(N-beams)
Amplitude
(N-beams)
ModeBFDFBFBFADFHAADF
Contrast colorDark or white
(defocusing function)
DarkDarkWhiteDark
(but weak)
Publisher’s Note: MDPI stays neutral with regard to jurisdictional claims in published maps and institutional affiliations.

