
Spatiotemporal Inversion and Mechanism Analysis of Surface Subsidence in Shanghai Area Based on Time-Series InSAR


Abstract
:1. Introduction
2. Methodology
3. Study Area and Data
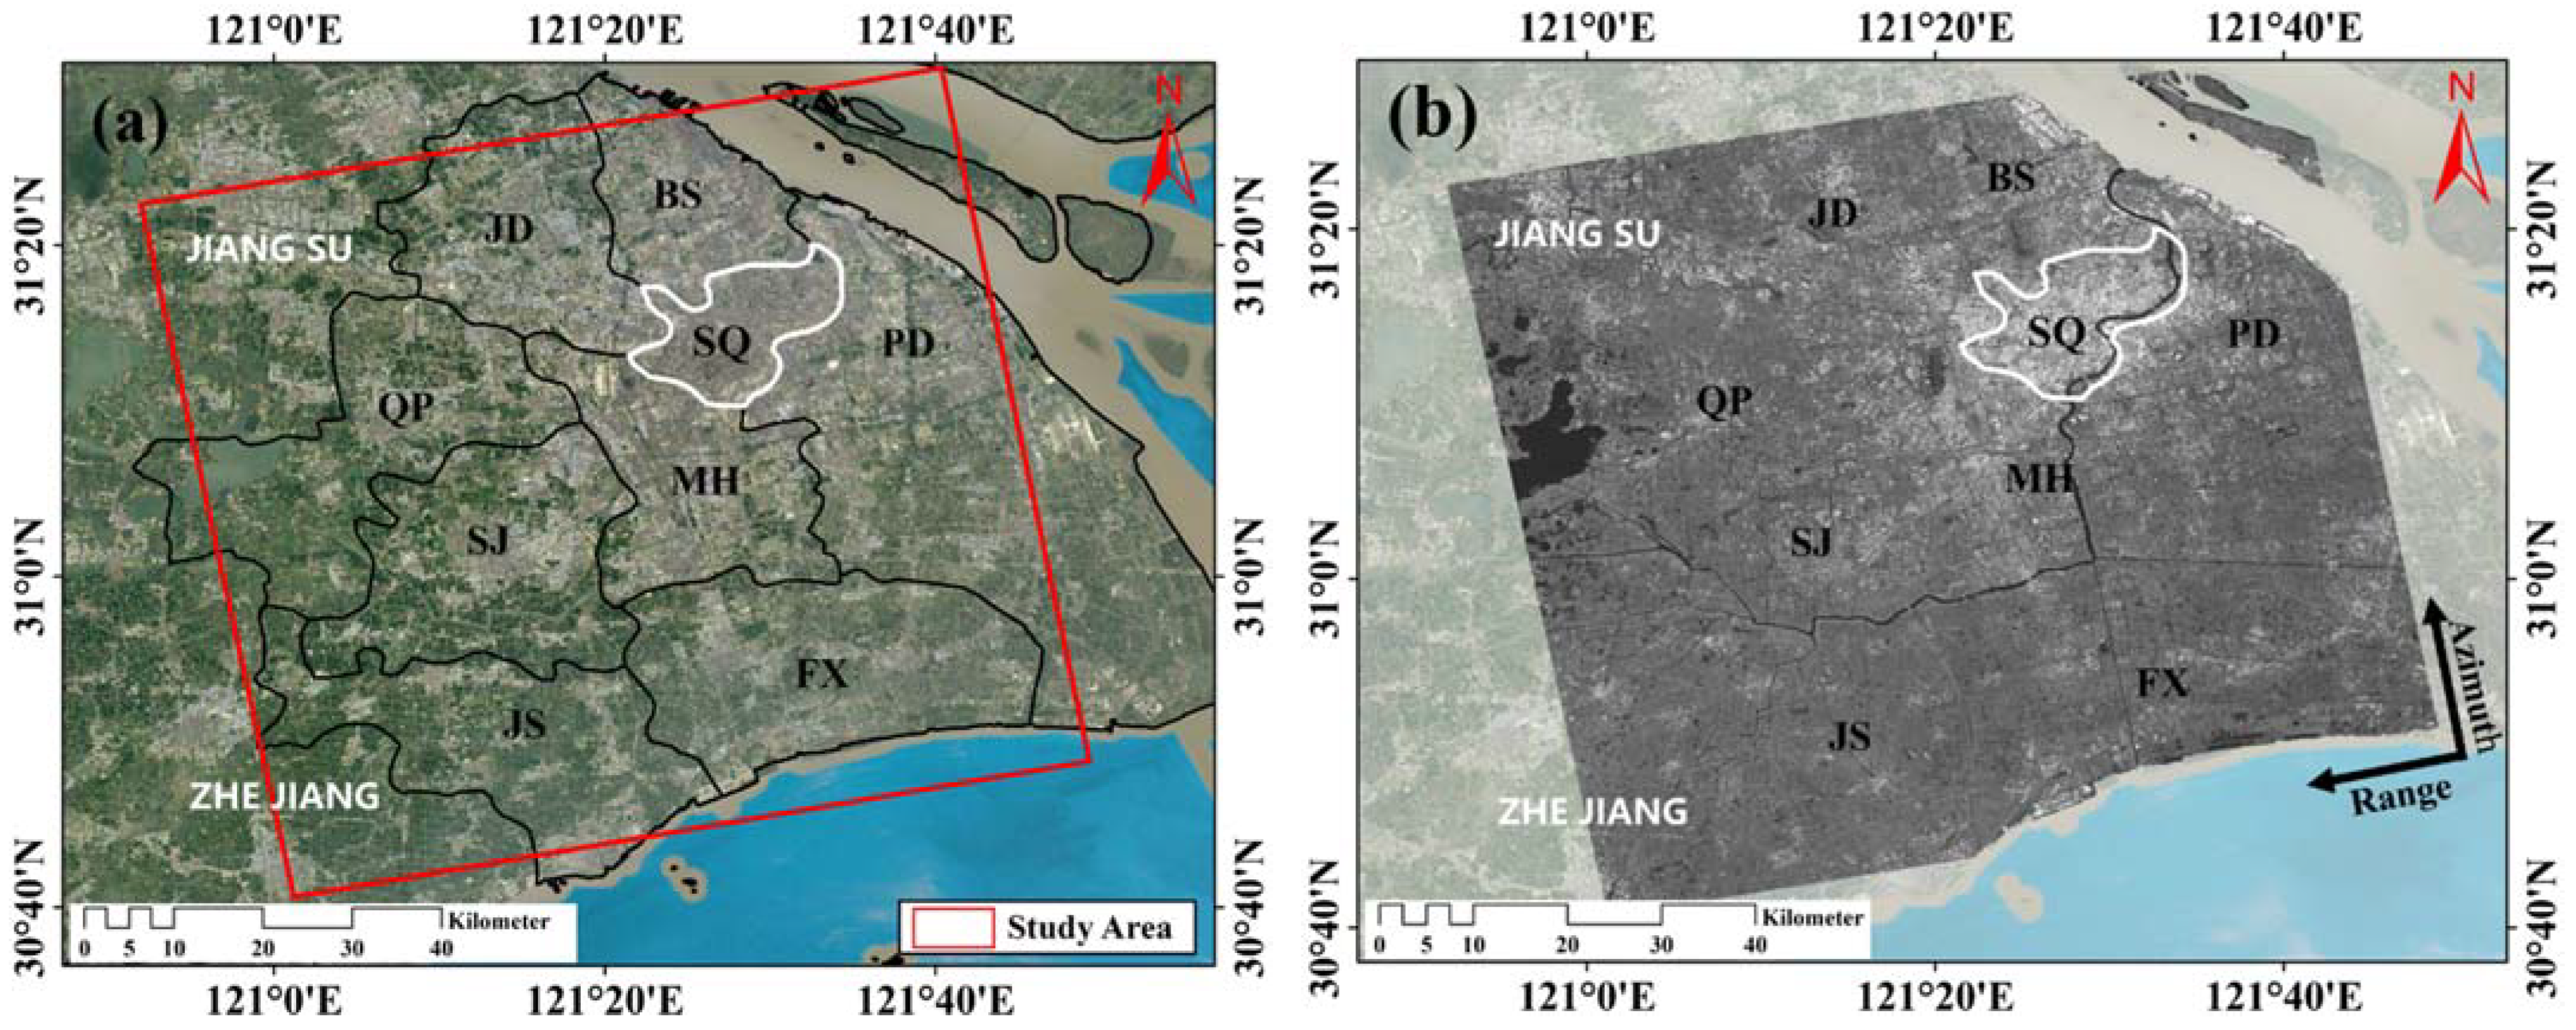
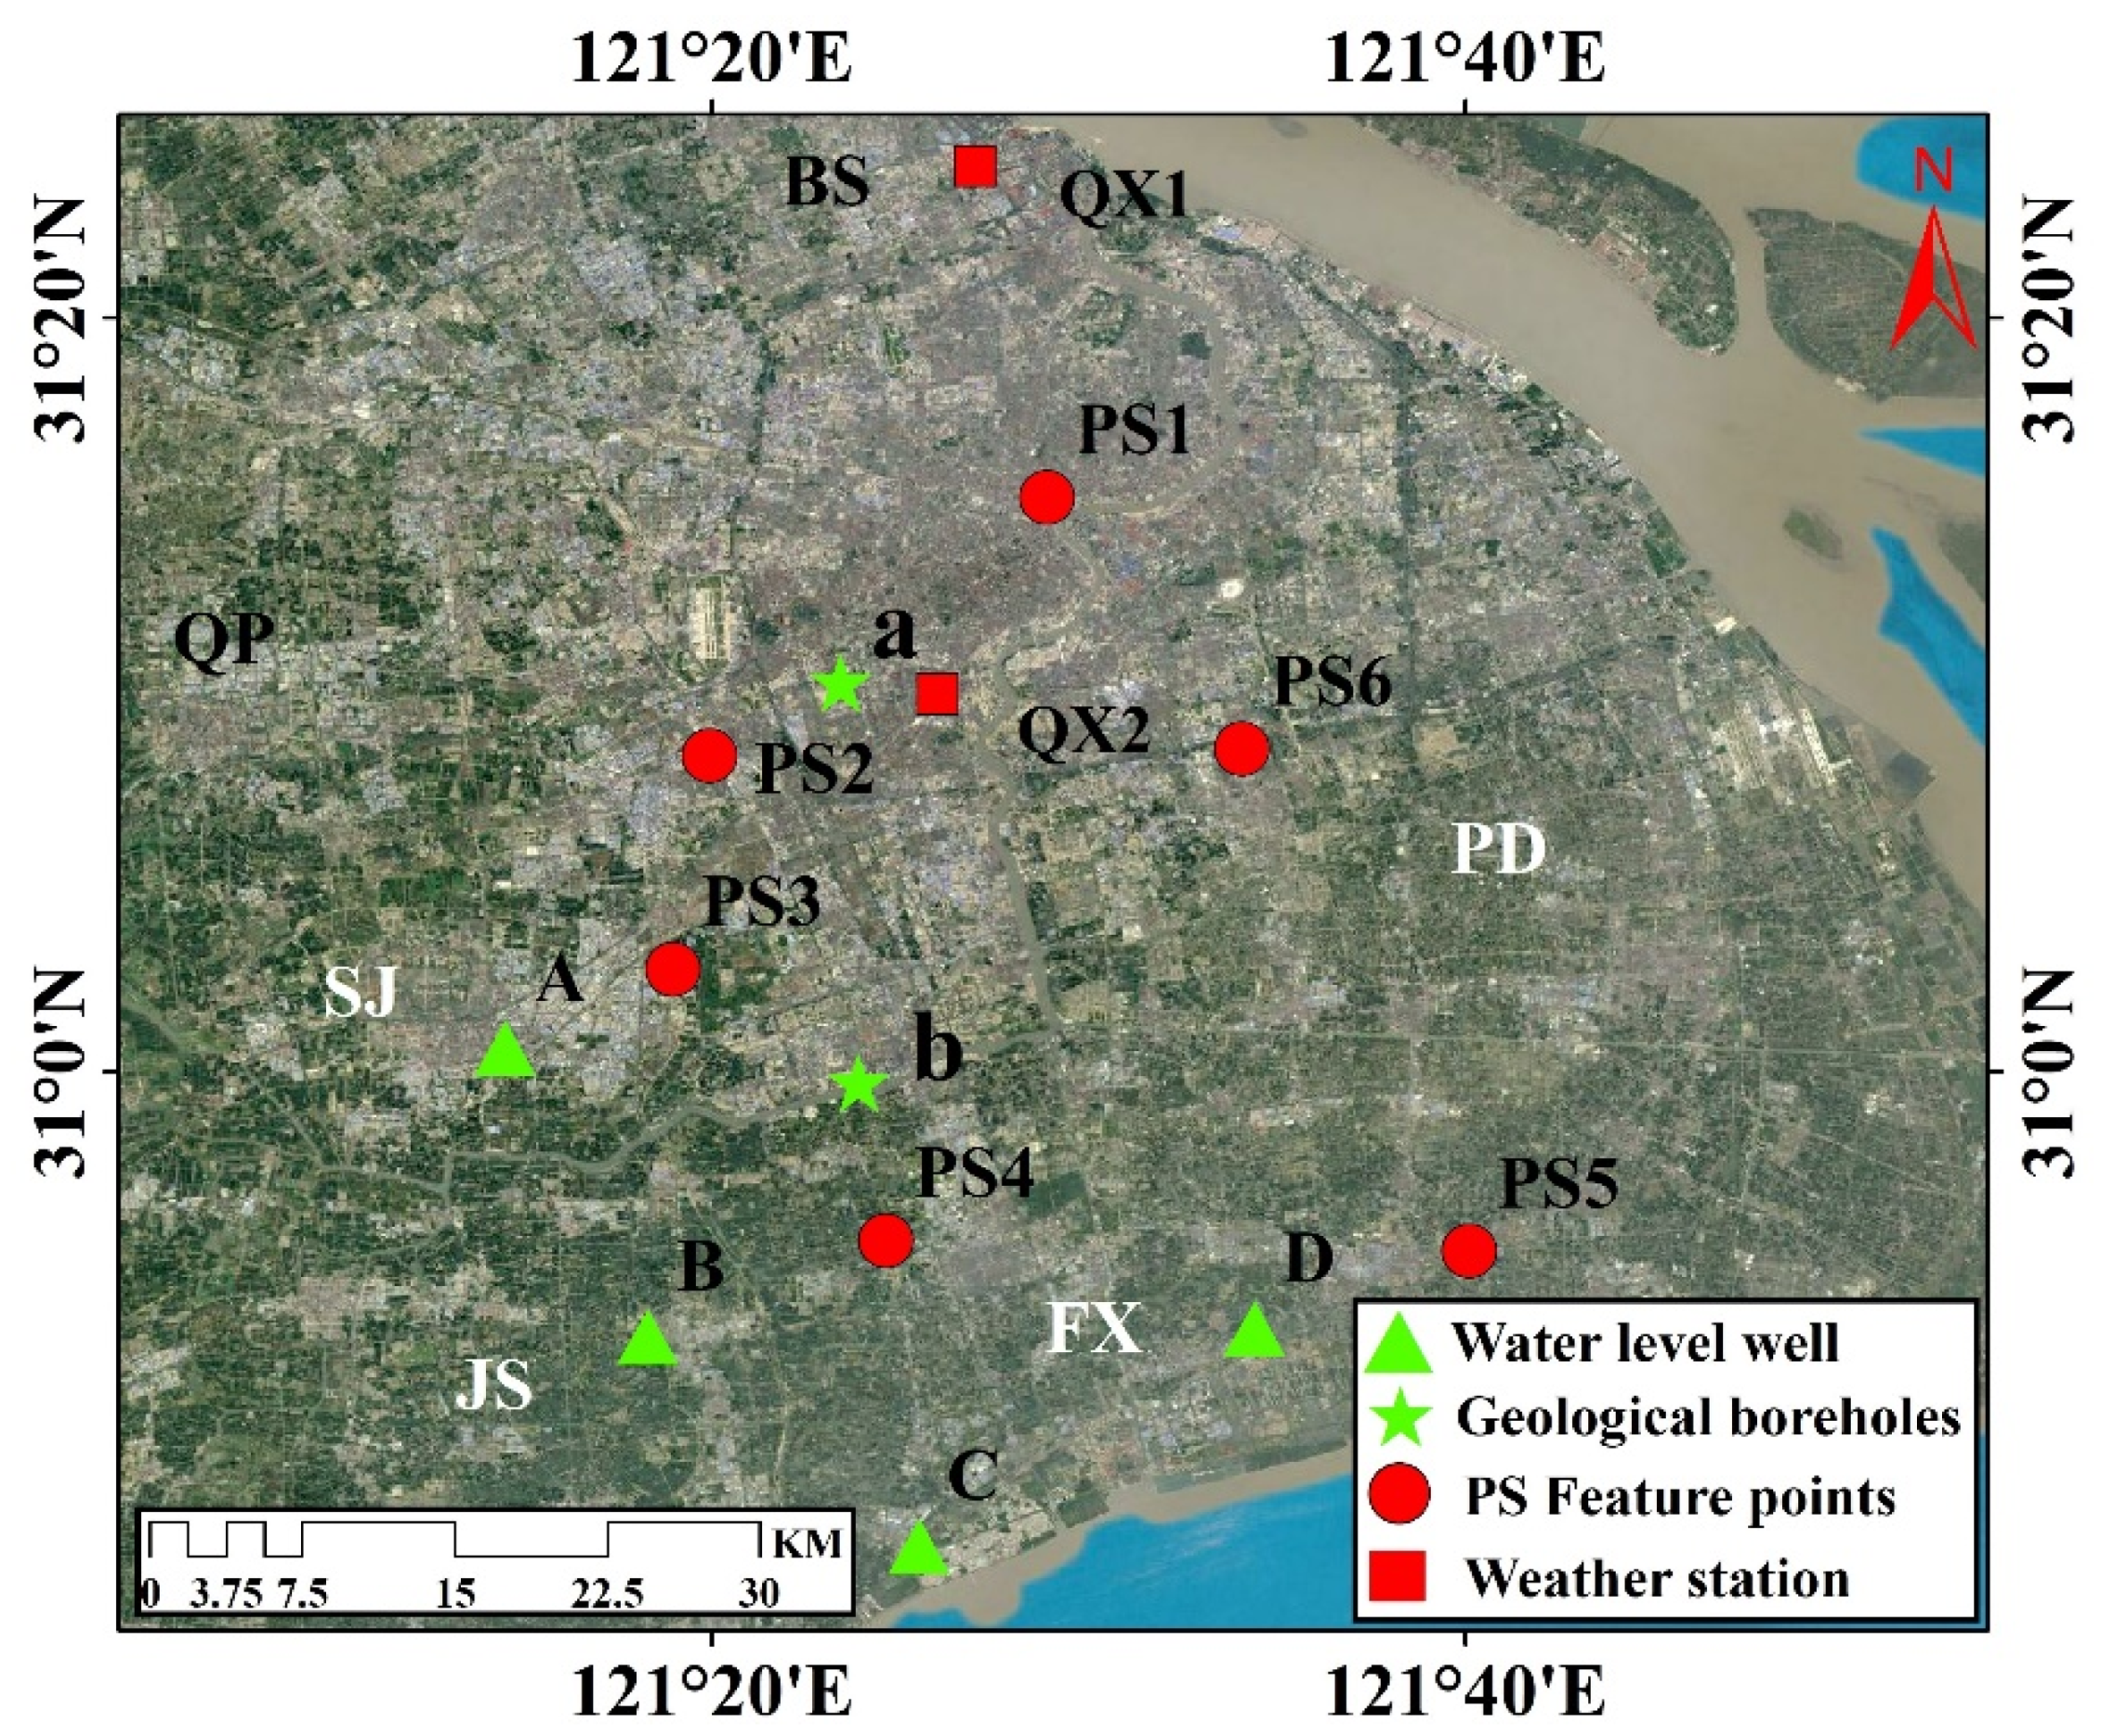
3.1. Study Area
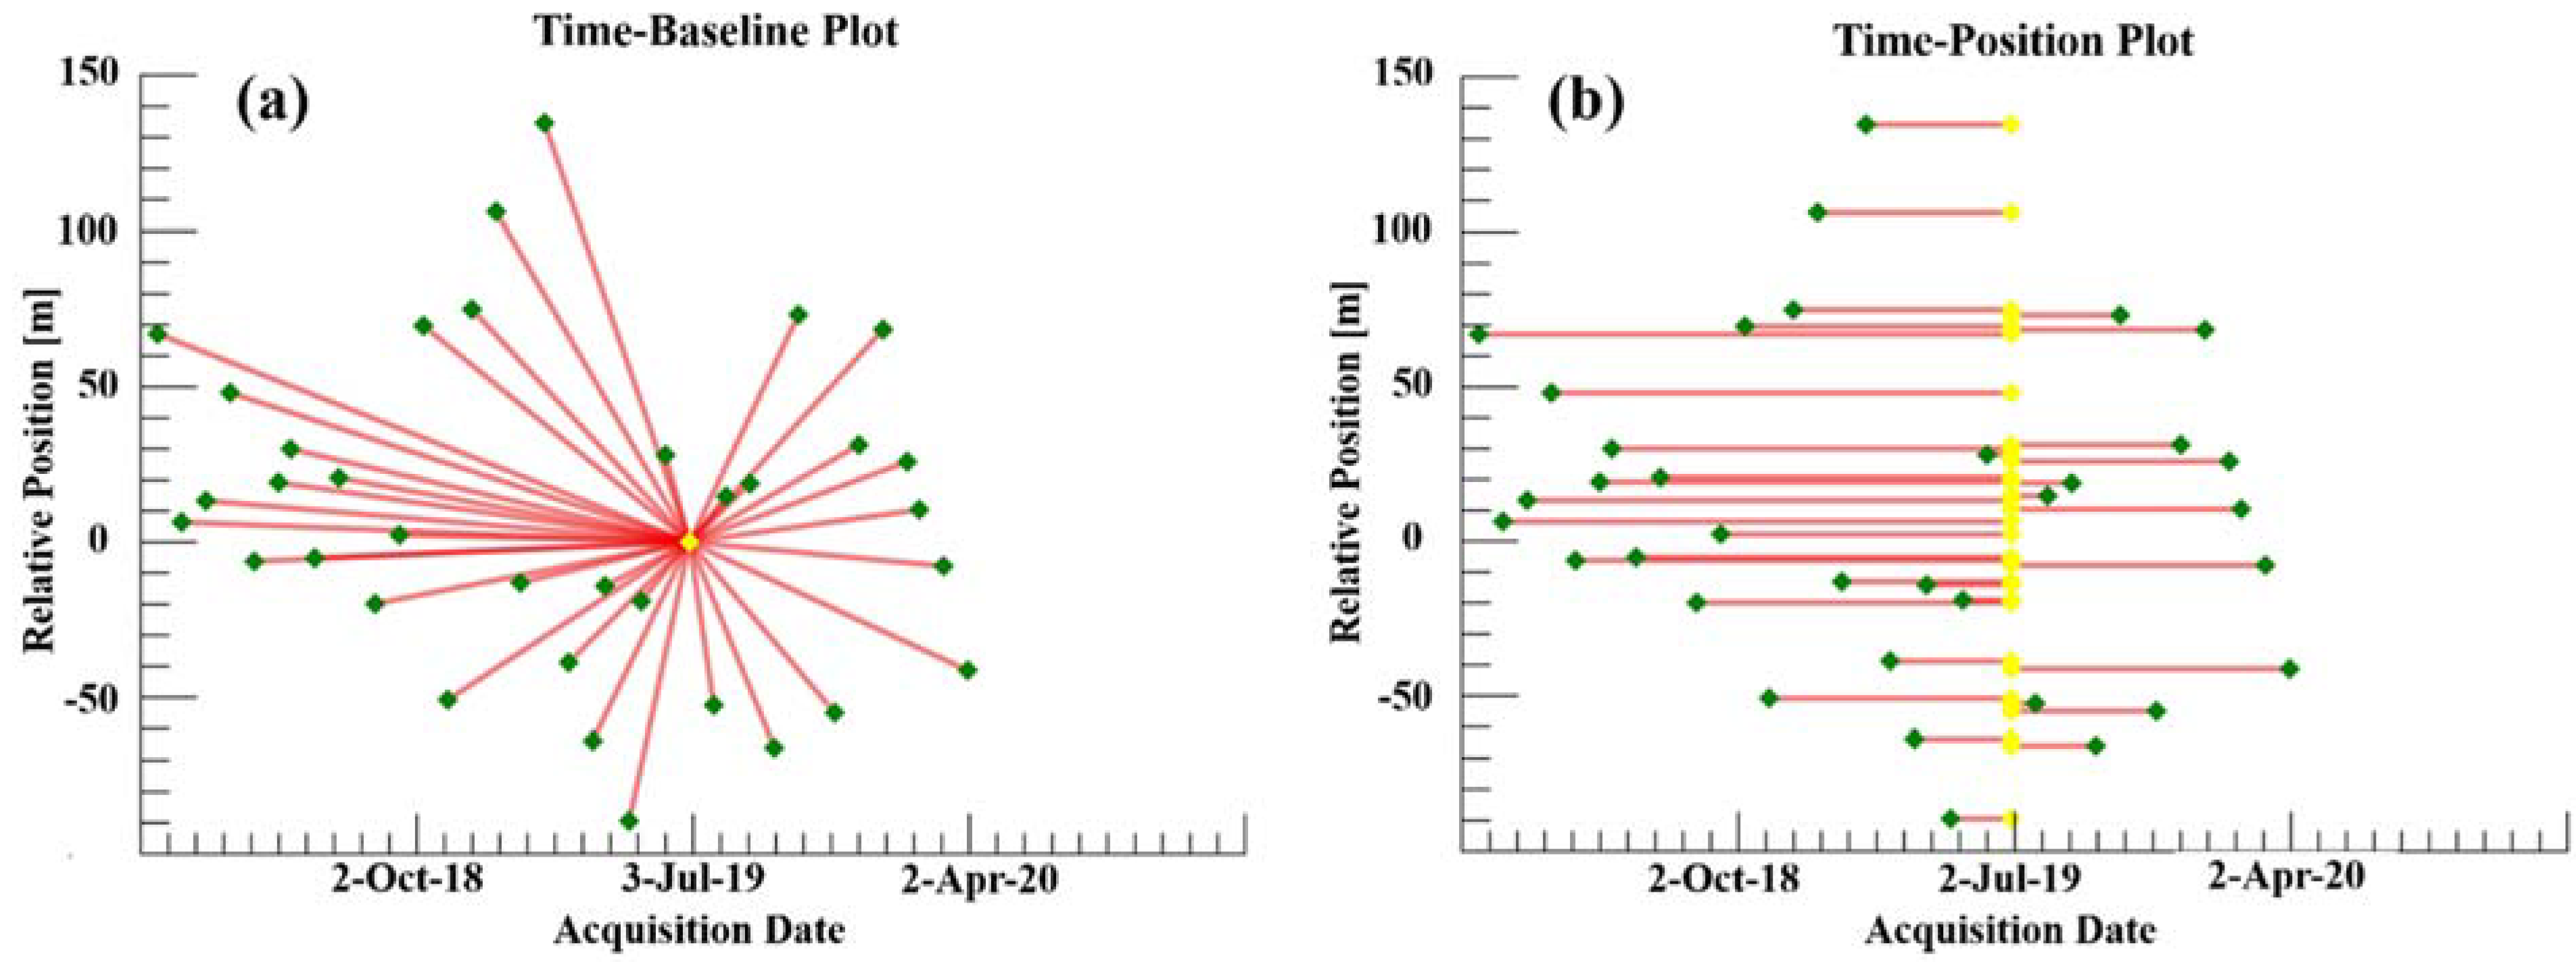
3.2. Data
4. Results
4.1. Results and Analysis of Subsidence Rate
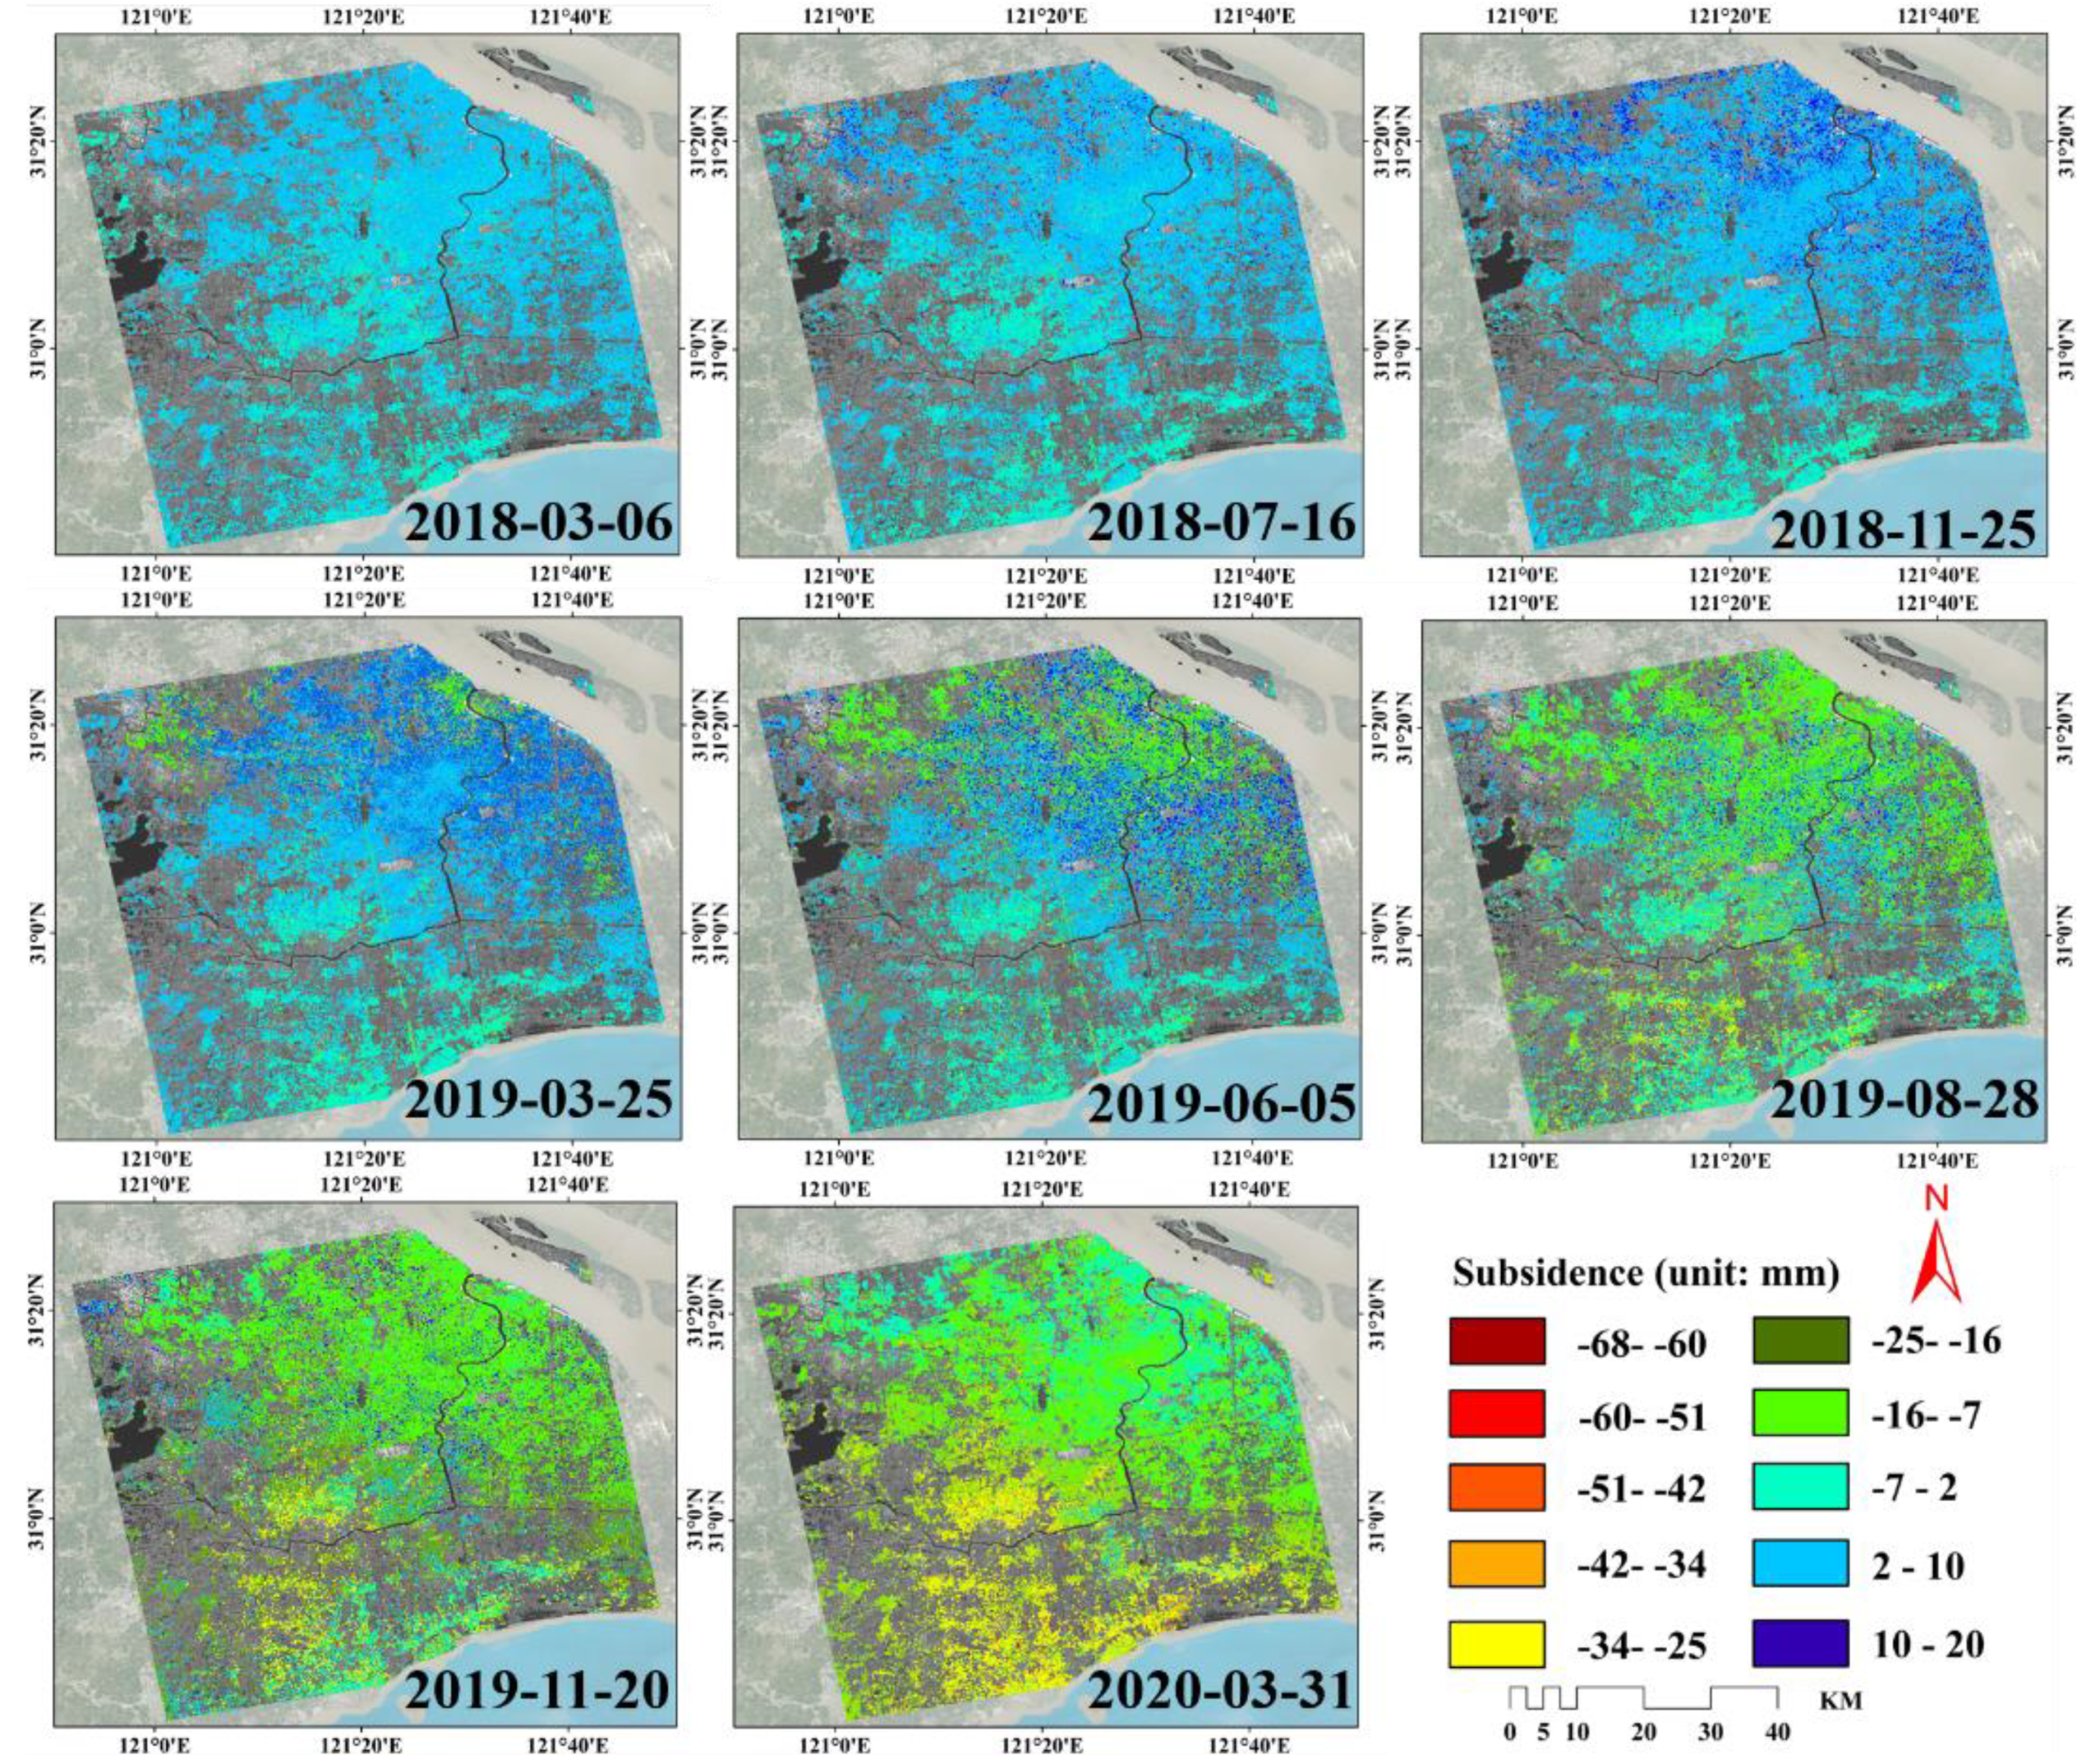
4.2. Results and Analysis of Subsidence Time Series
4.3. Accuracy Evaluation of Time Series InSAR Results
5. Discussion
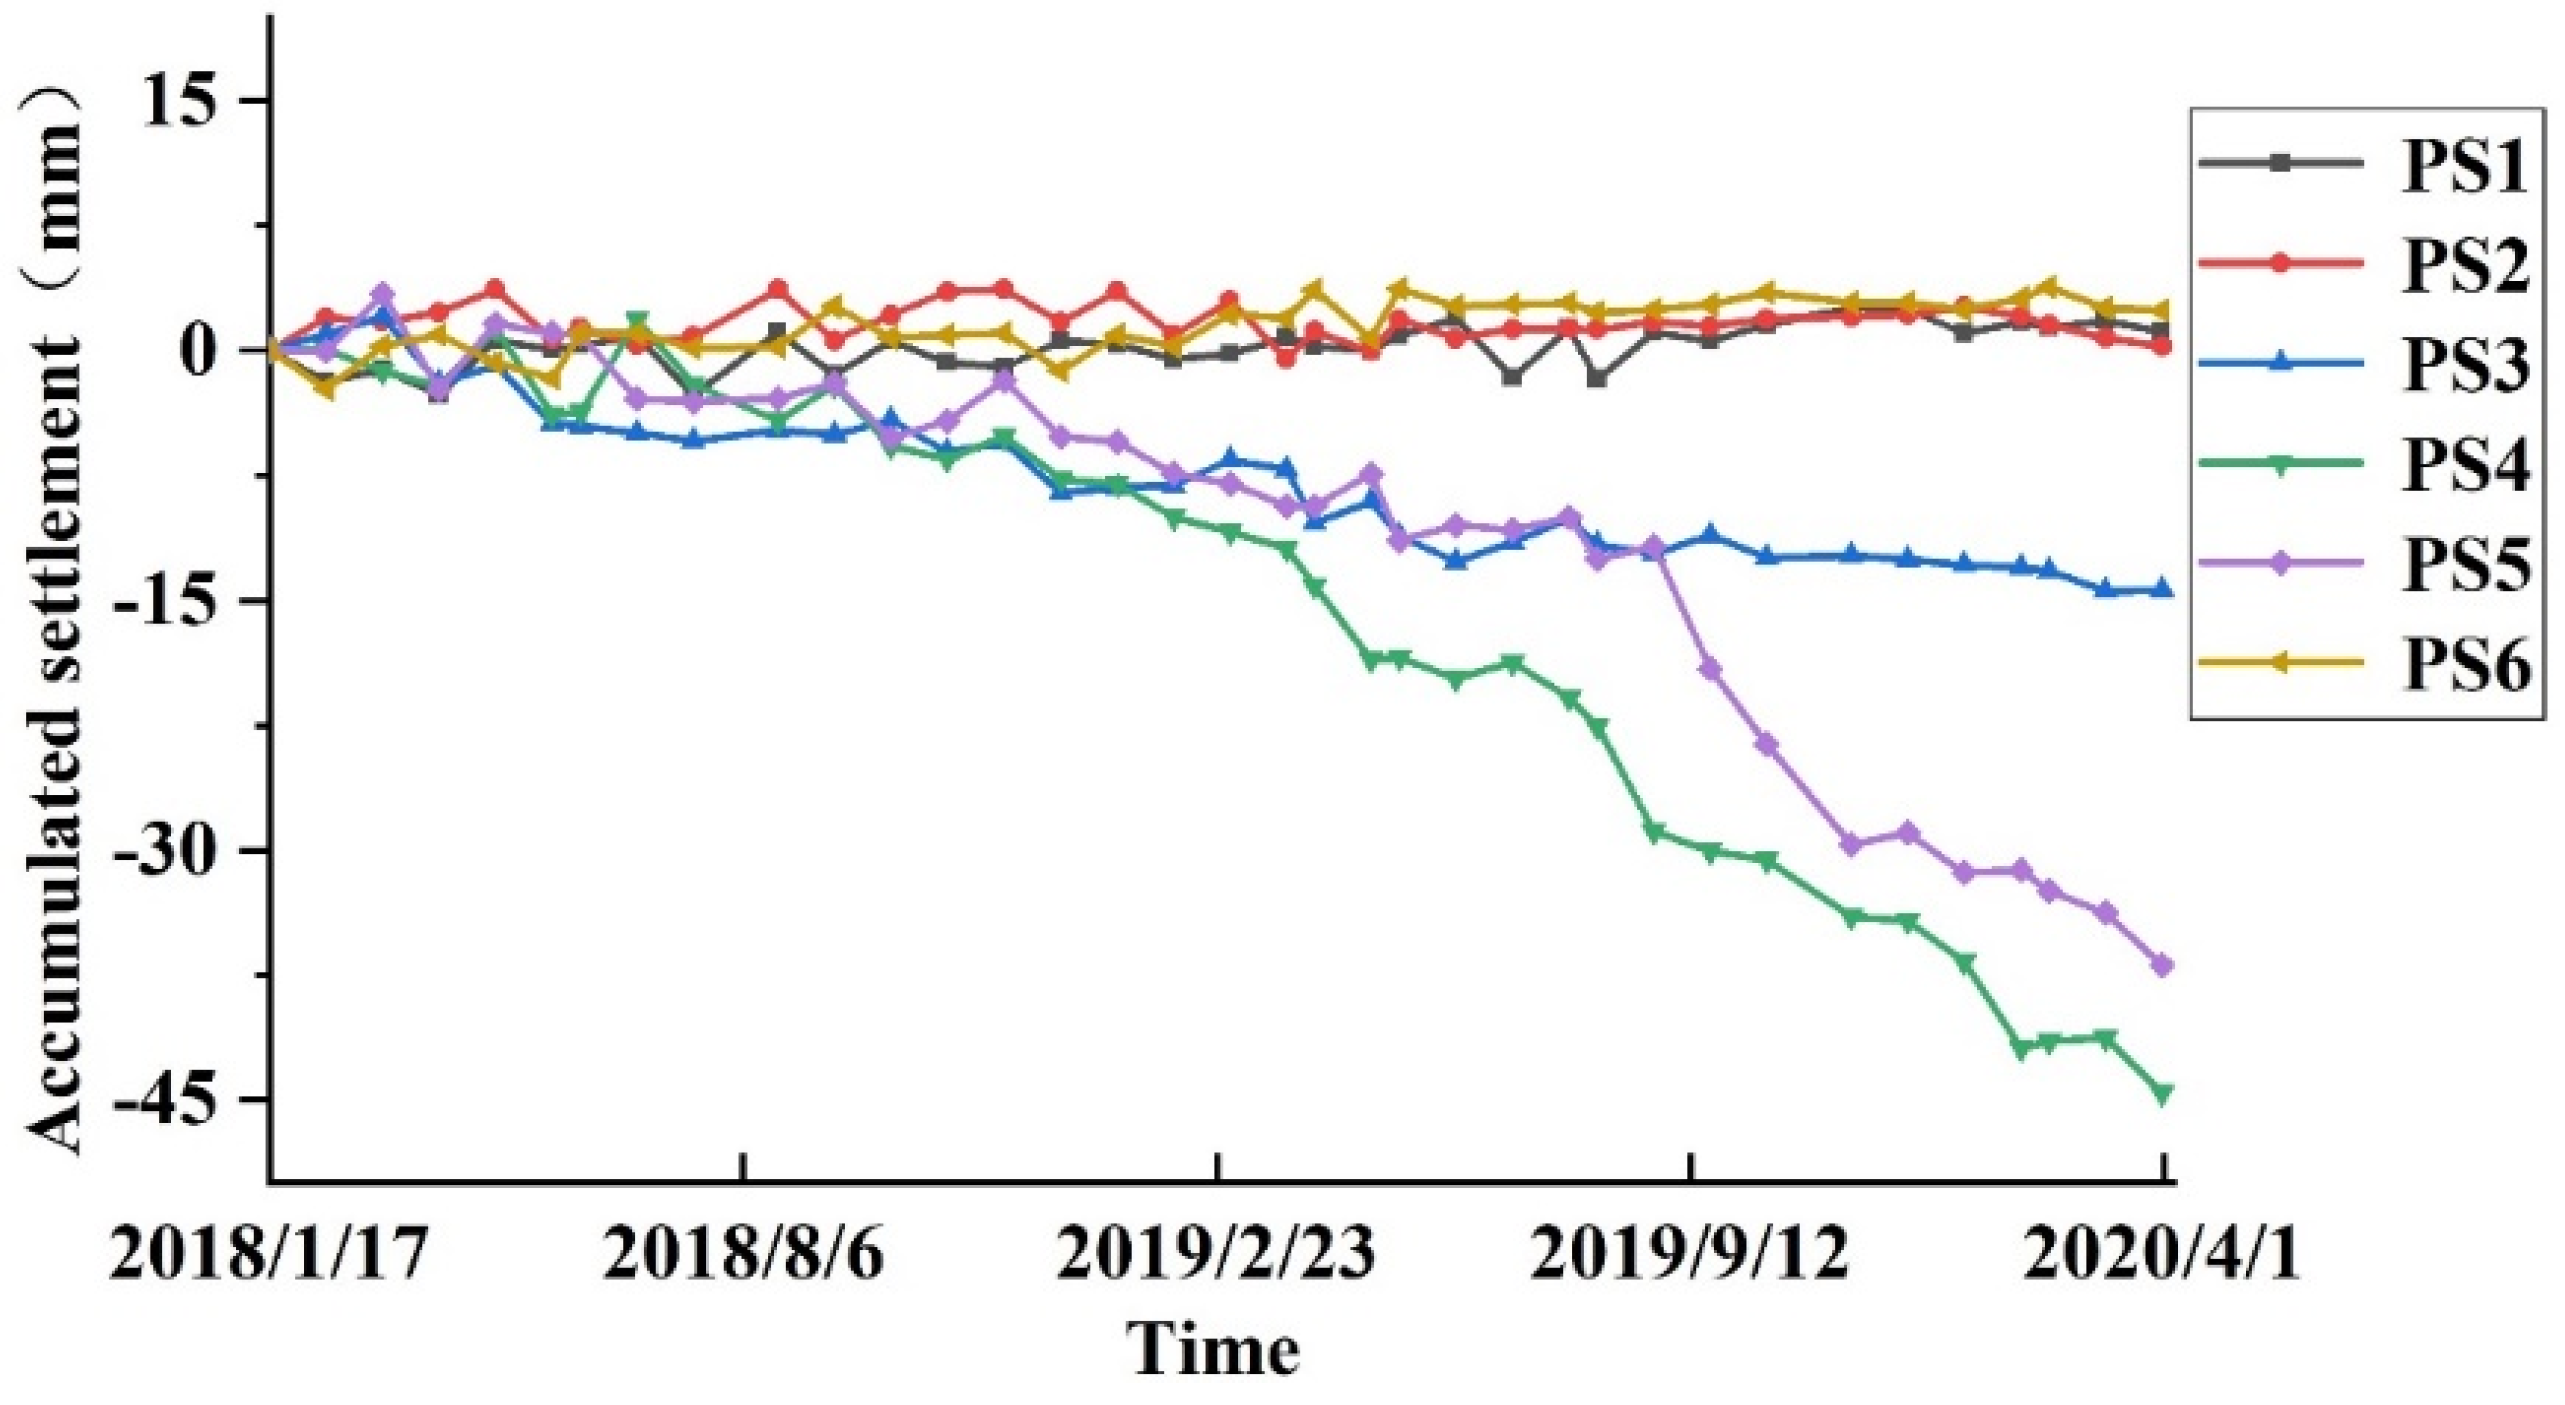
5.1. Time Series Analysis of Feature Points
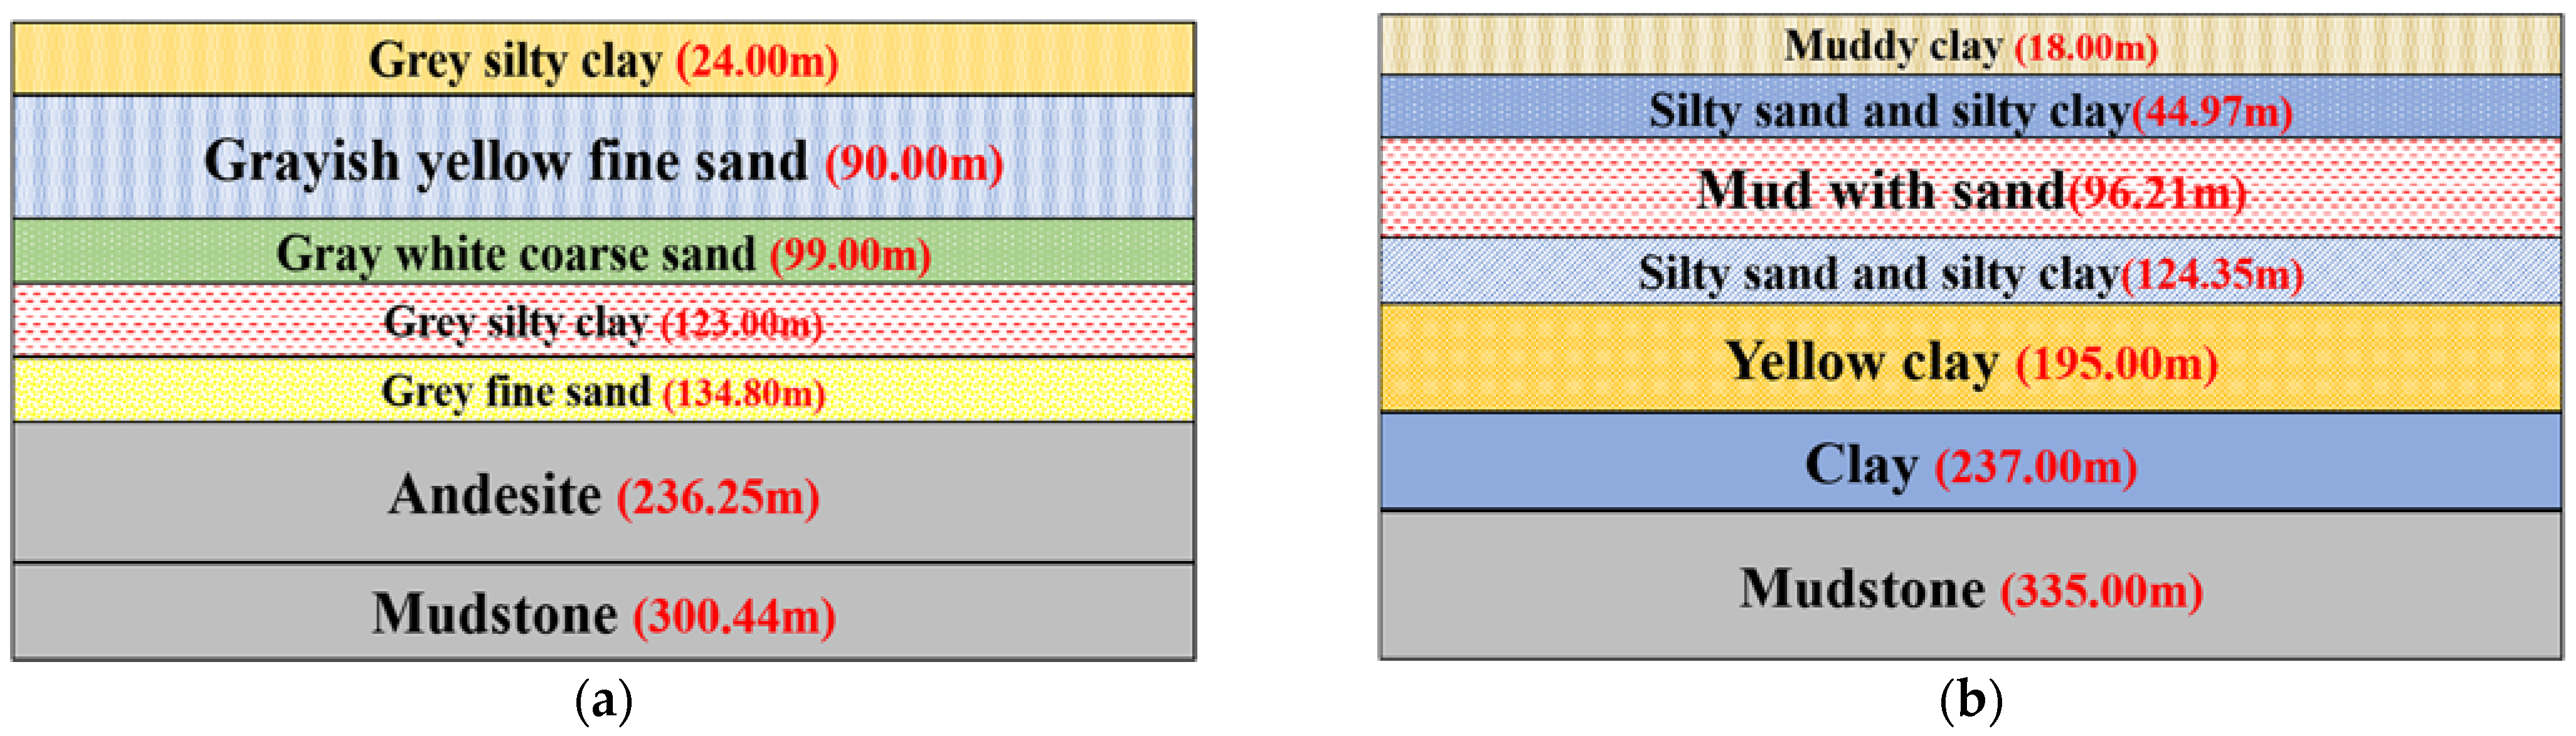
5.2. Influence of Regional Stratigraphic Structure on Surface Subsidence
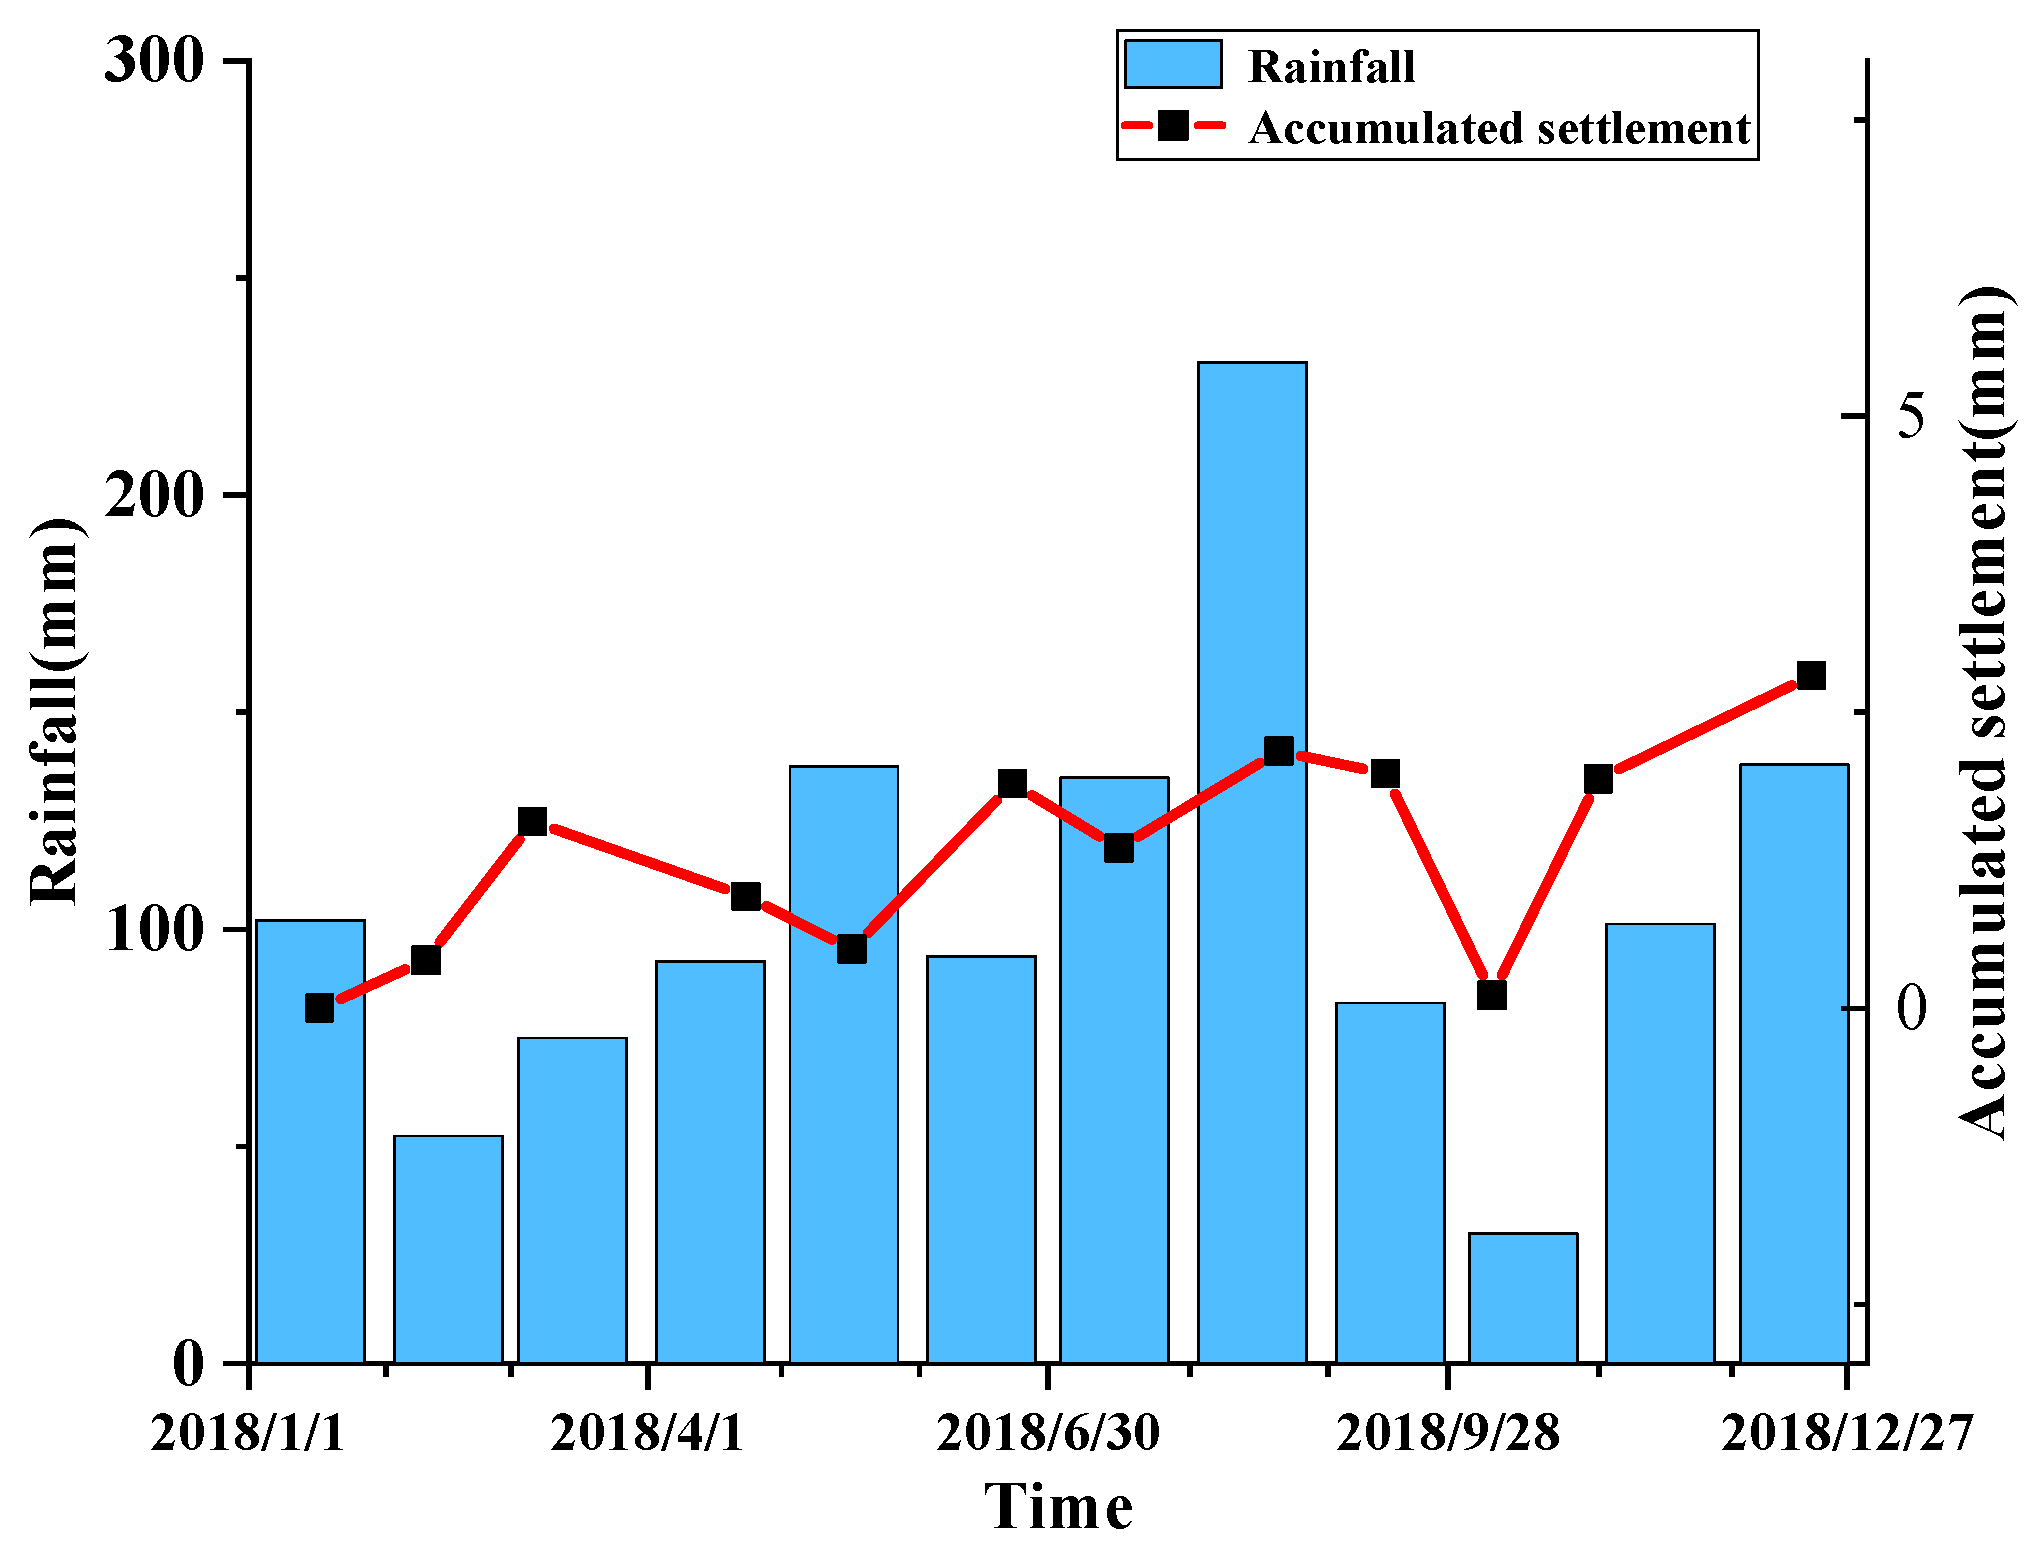
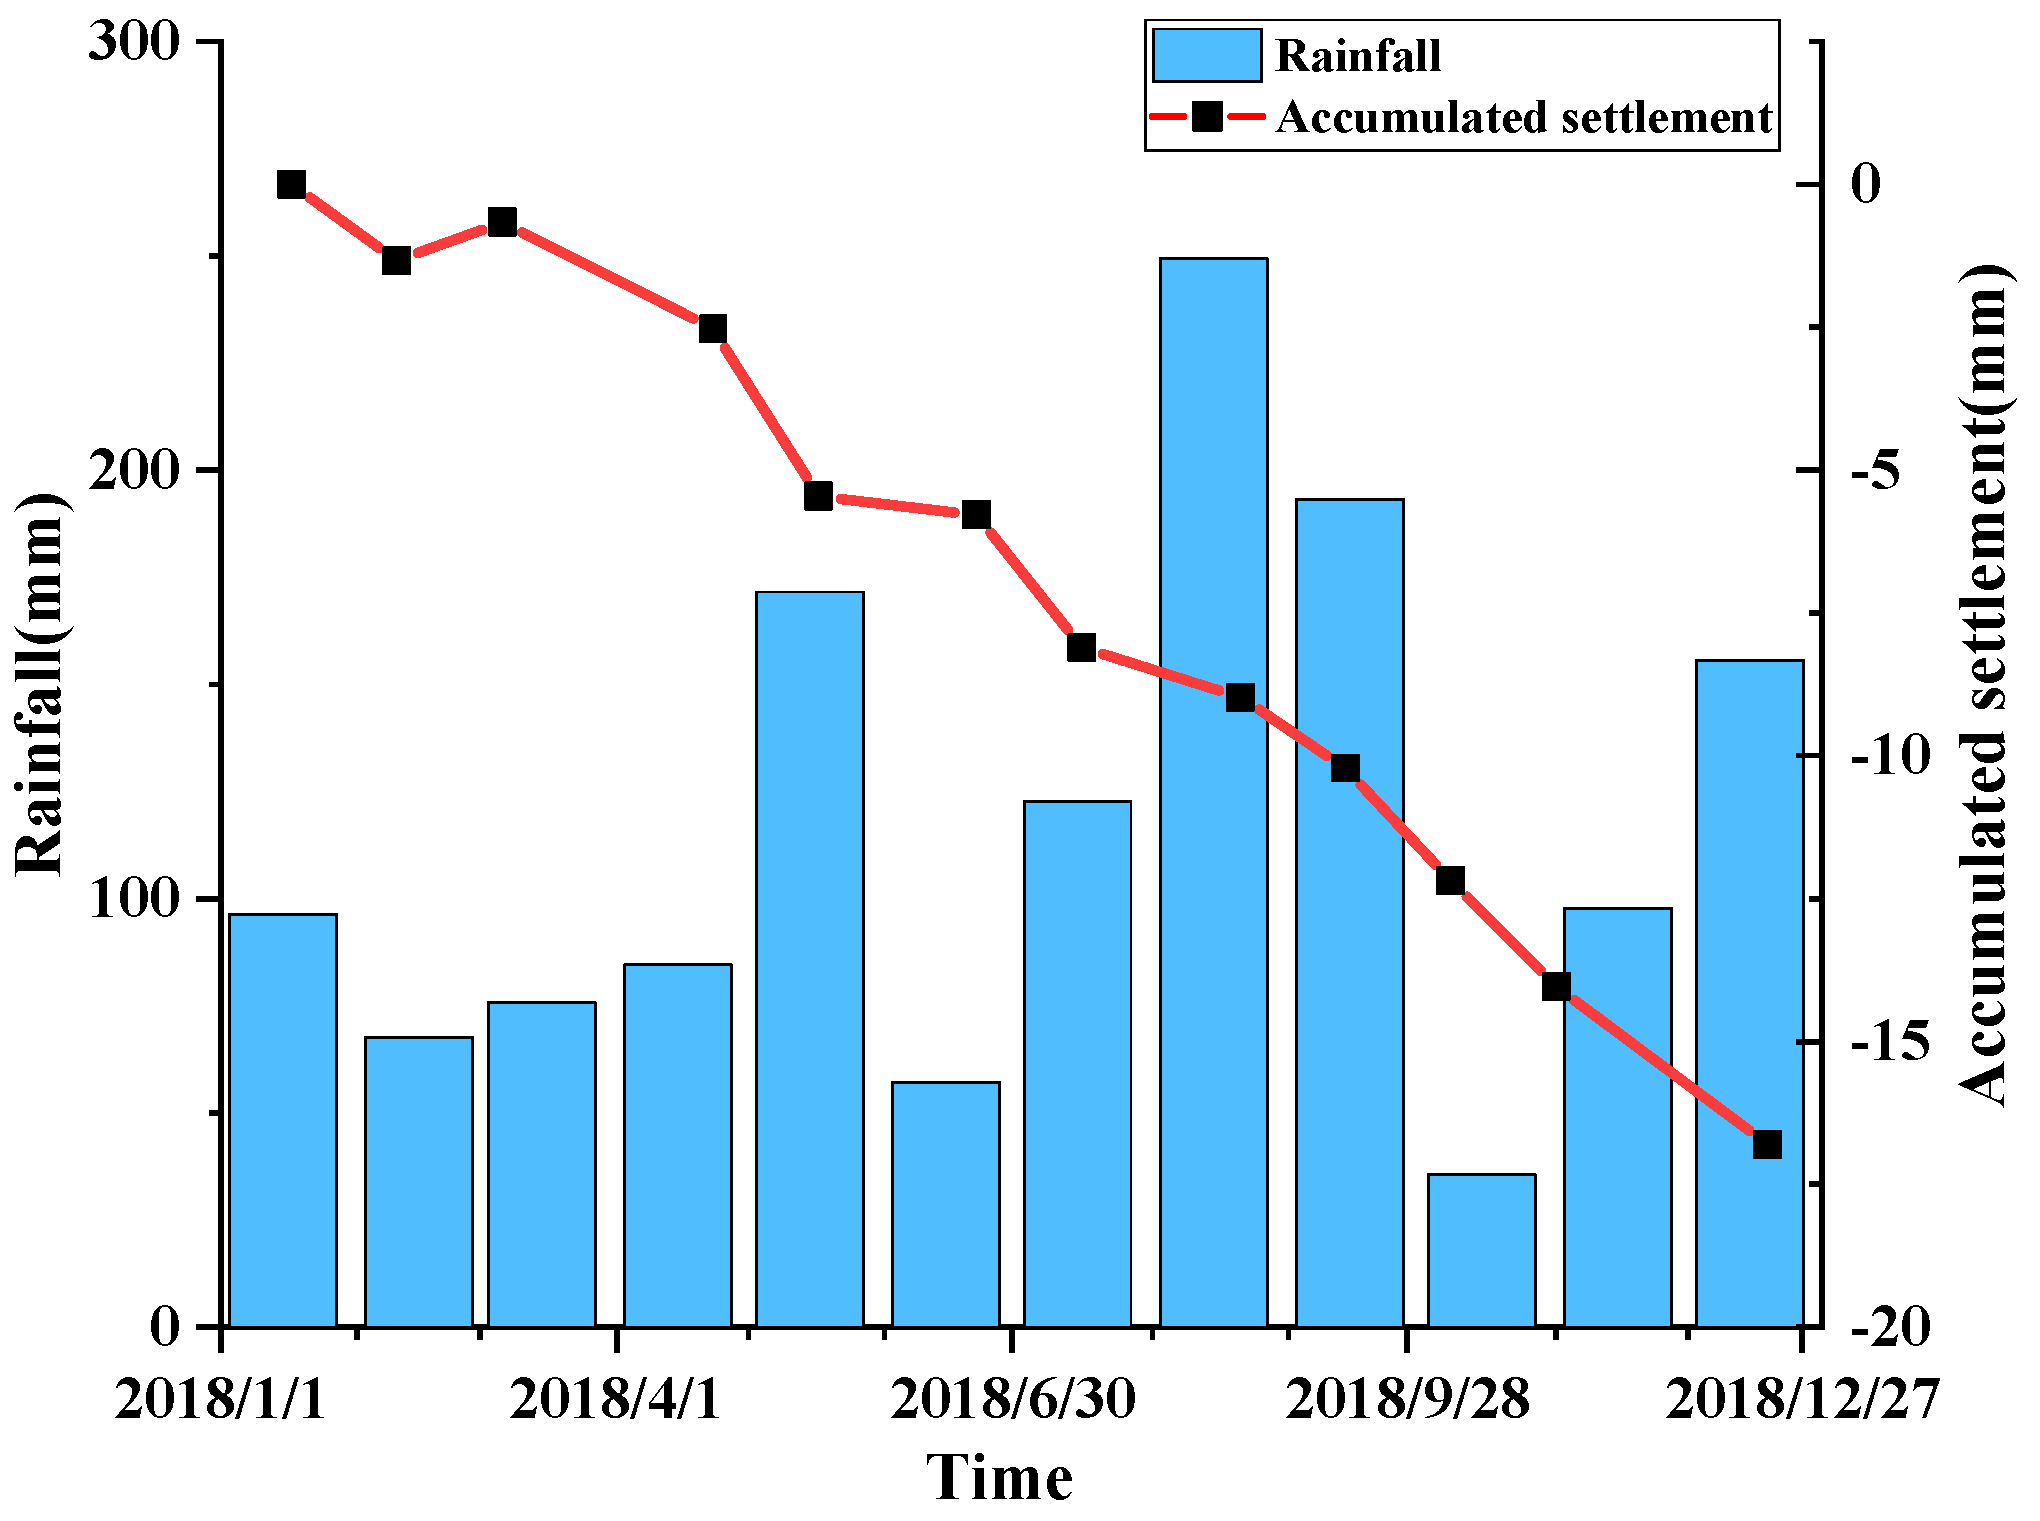
5.3. Correlation Analysis between Surface Subsidence Time Series and Rainfall
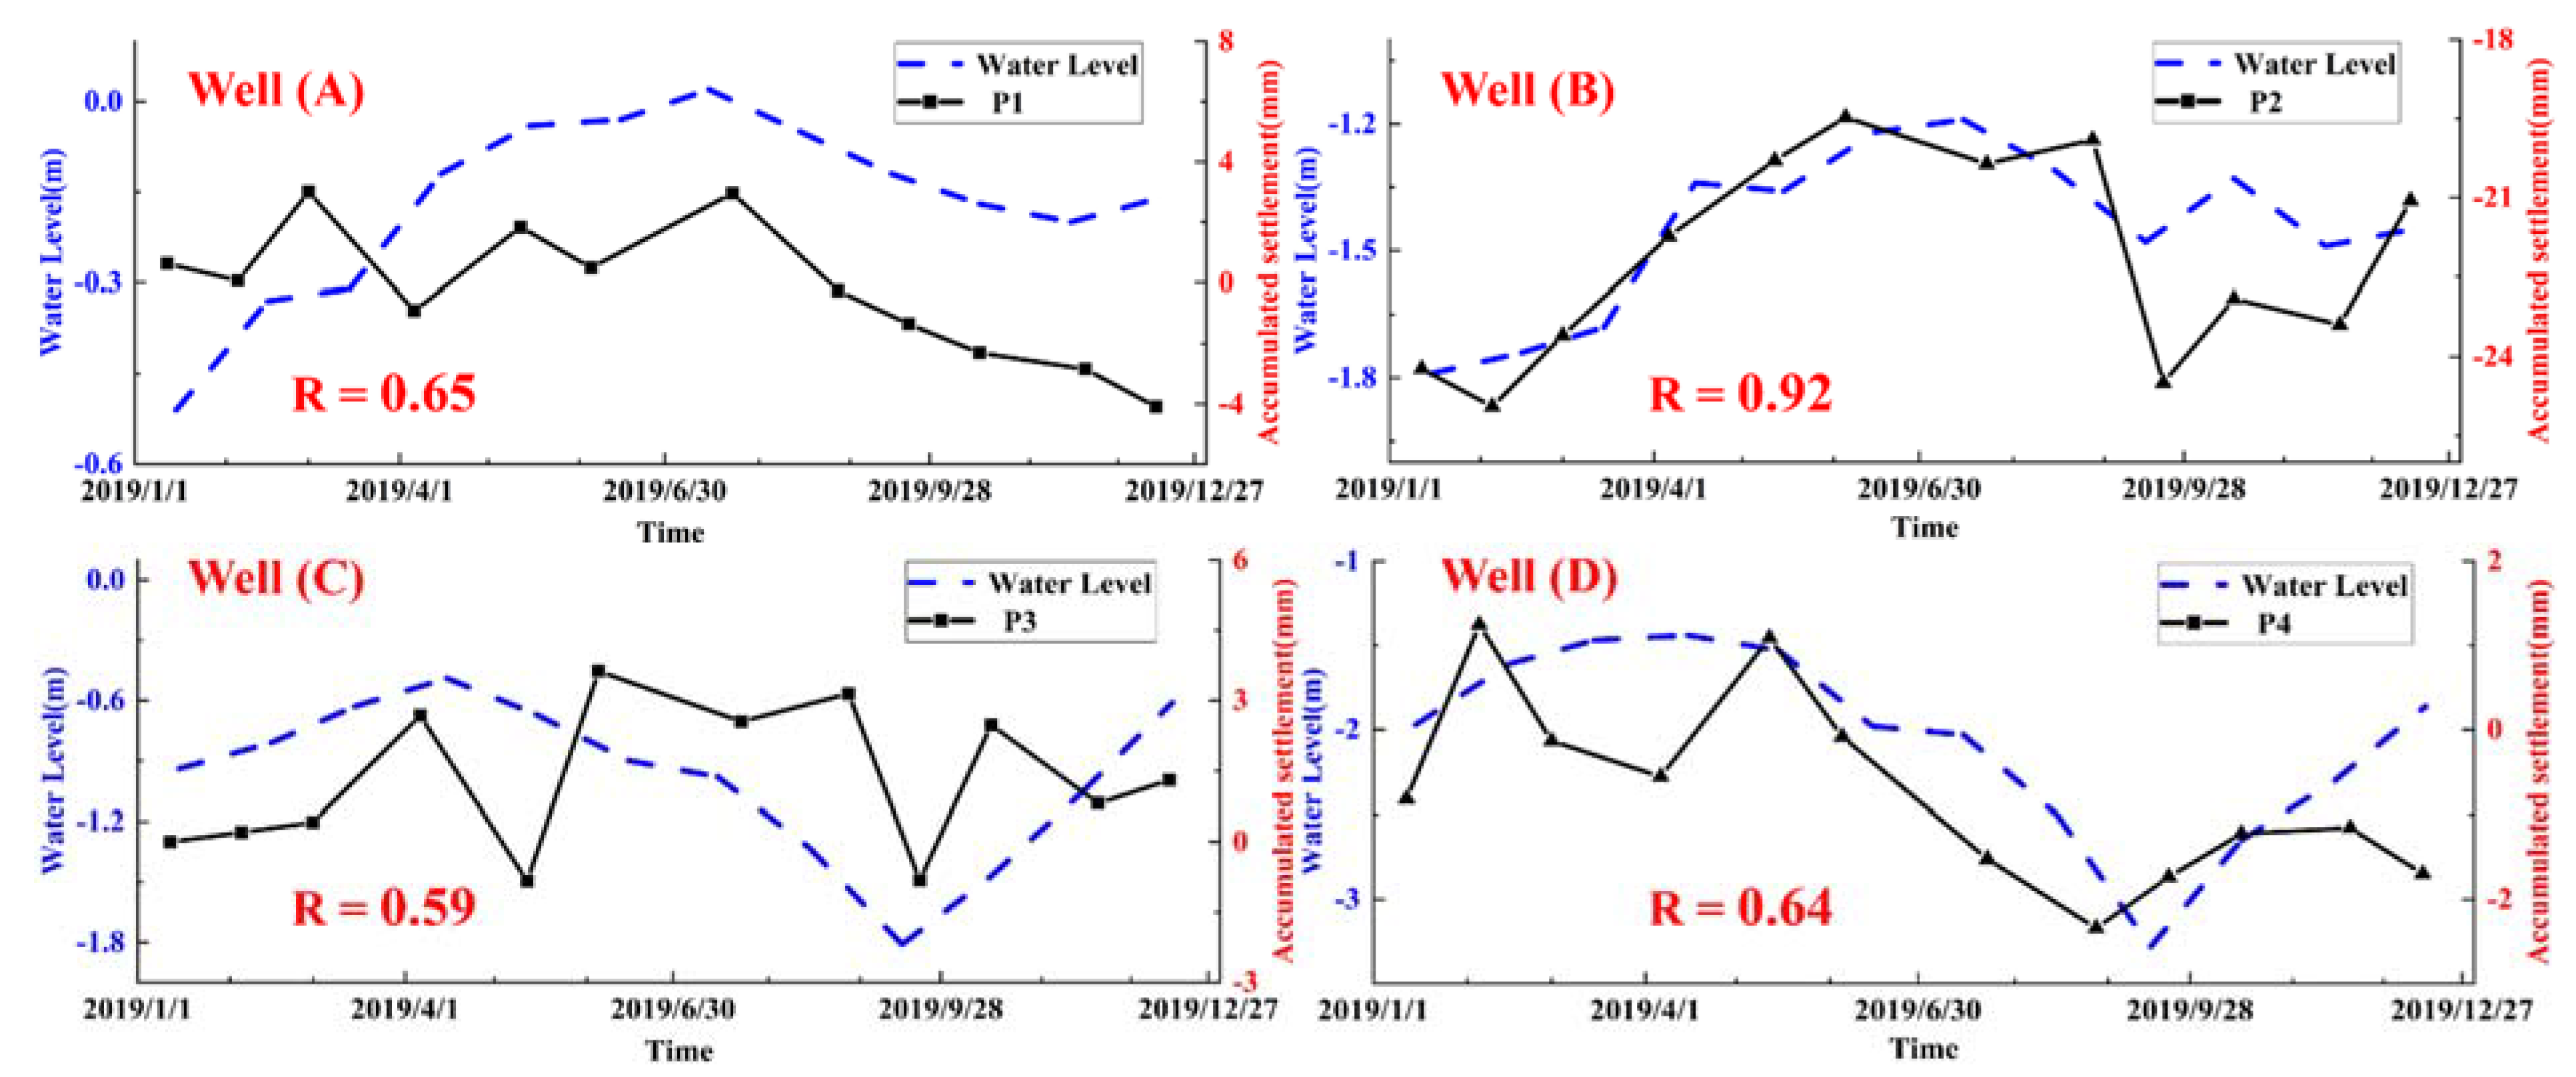
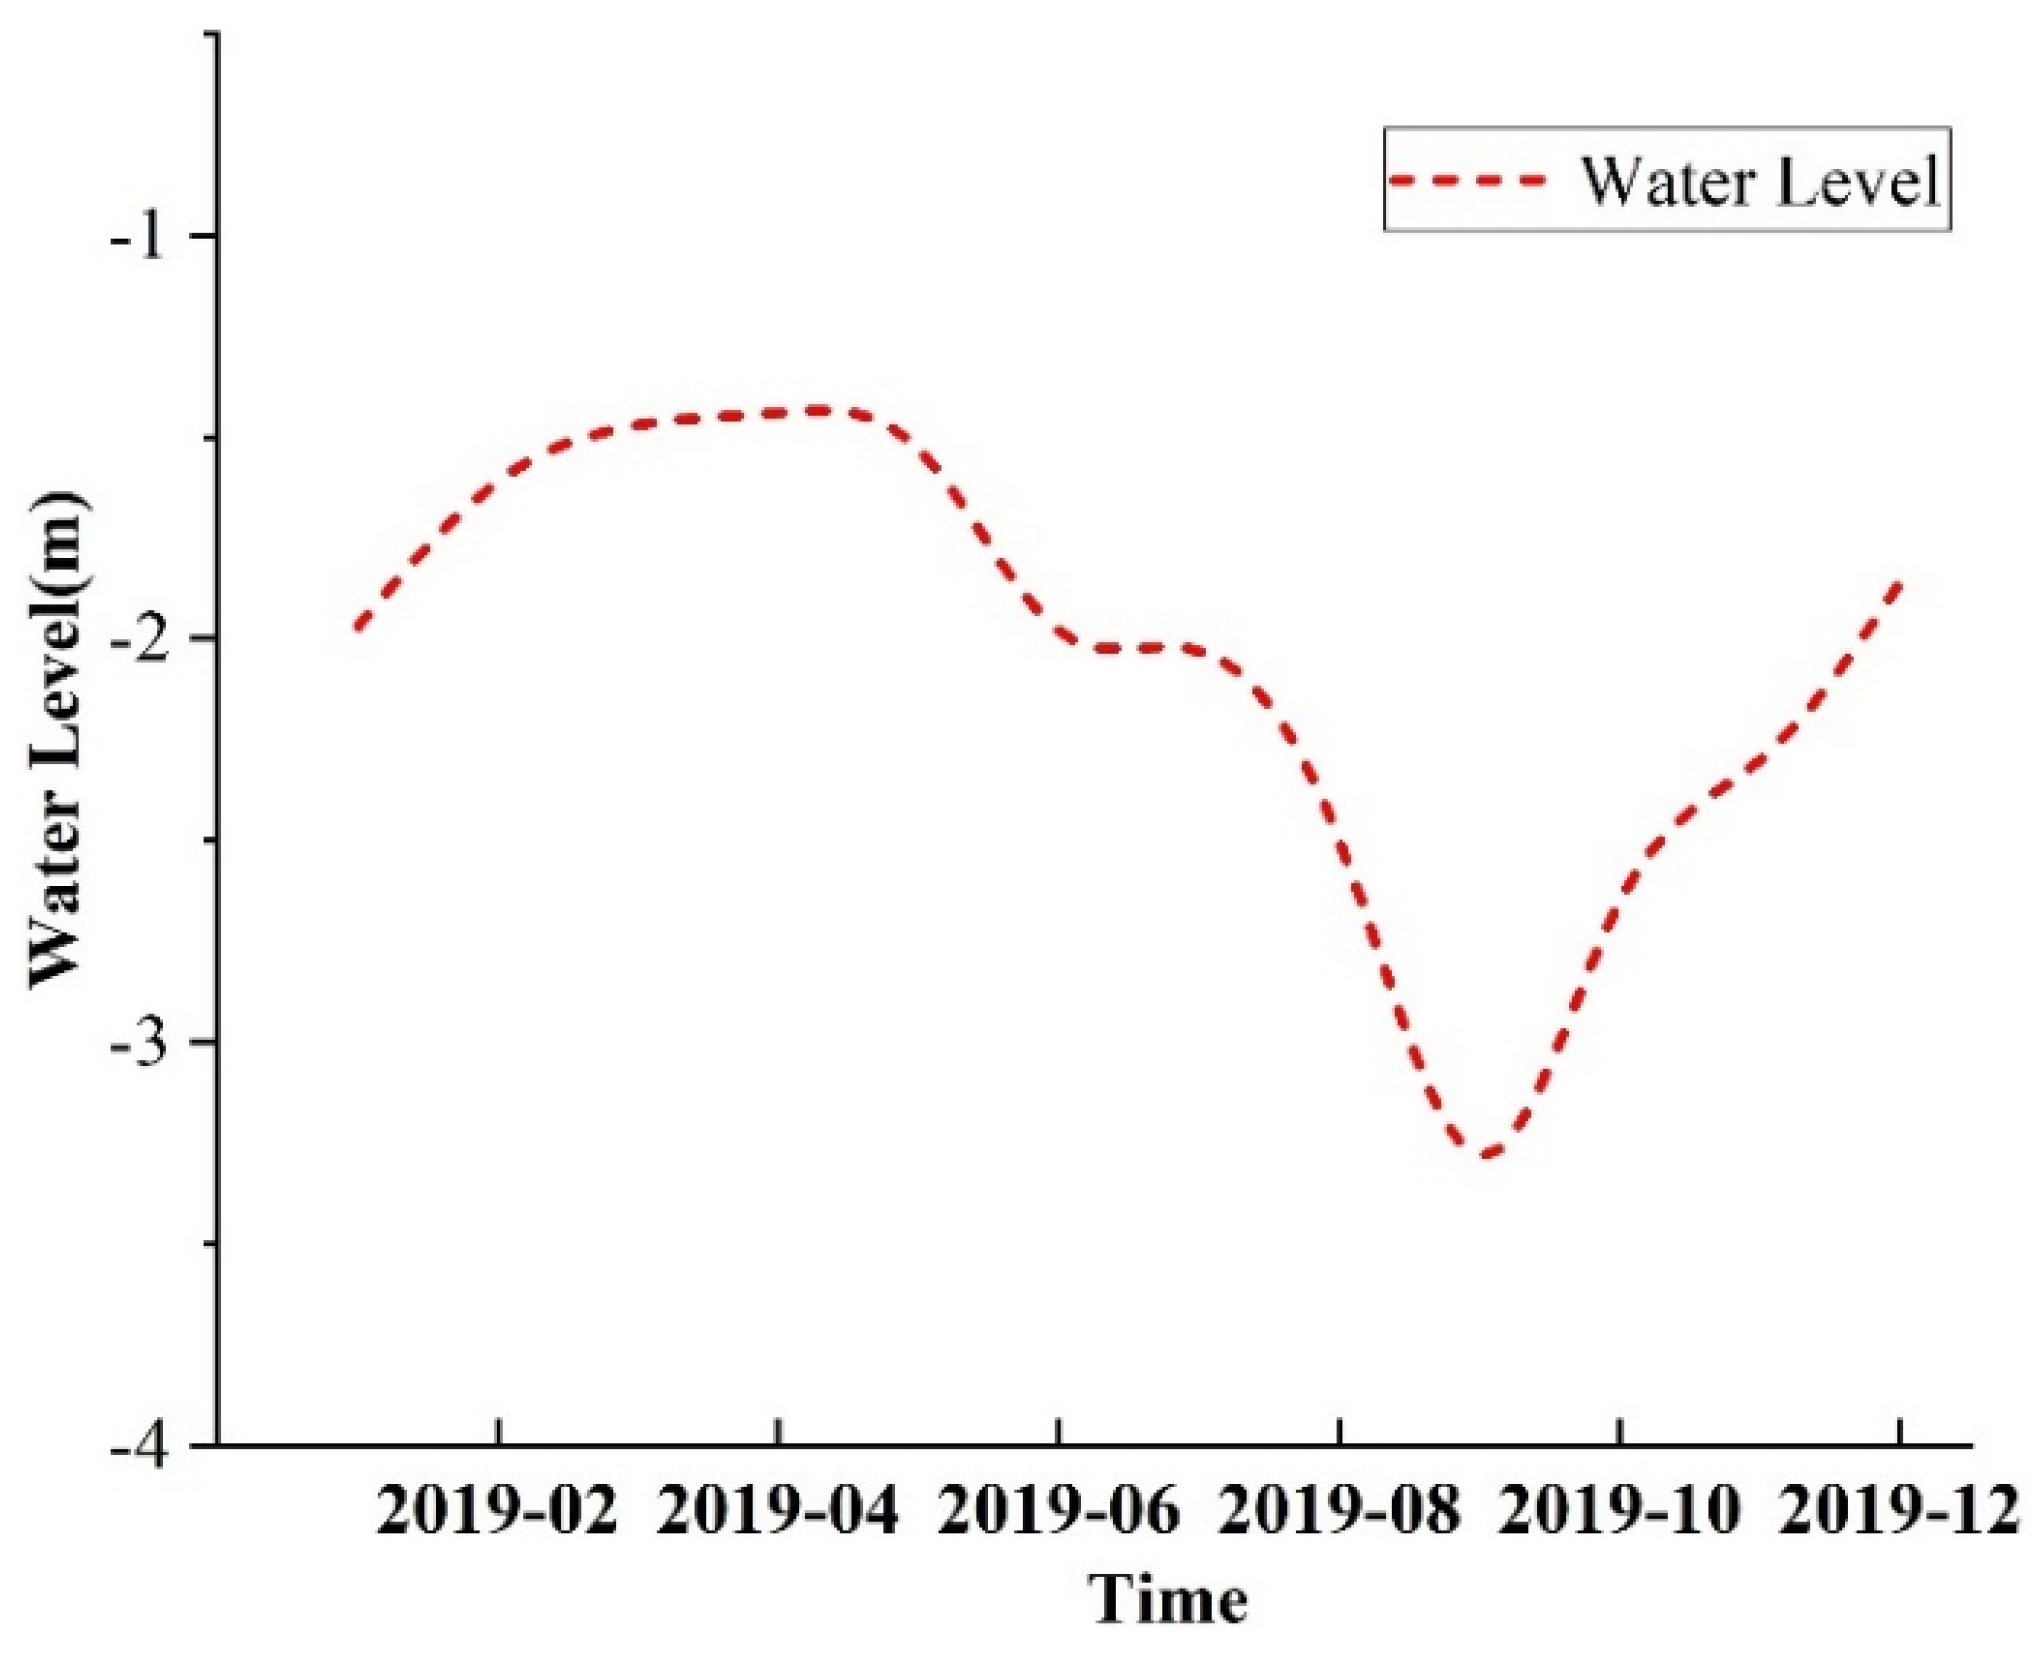
5.4. Surface Subsidence and Groundwater Level Change
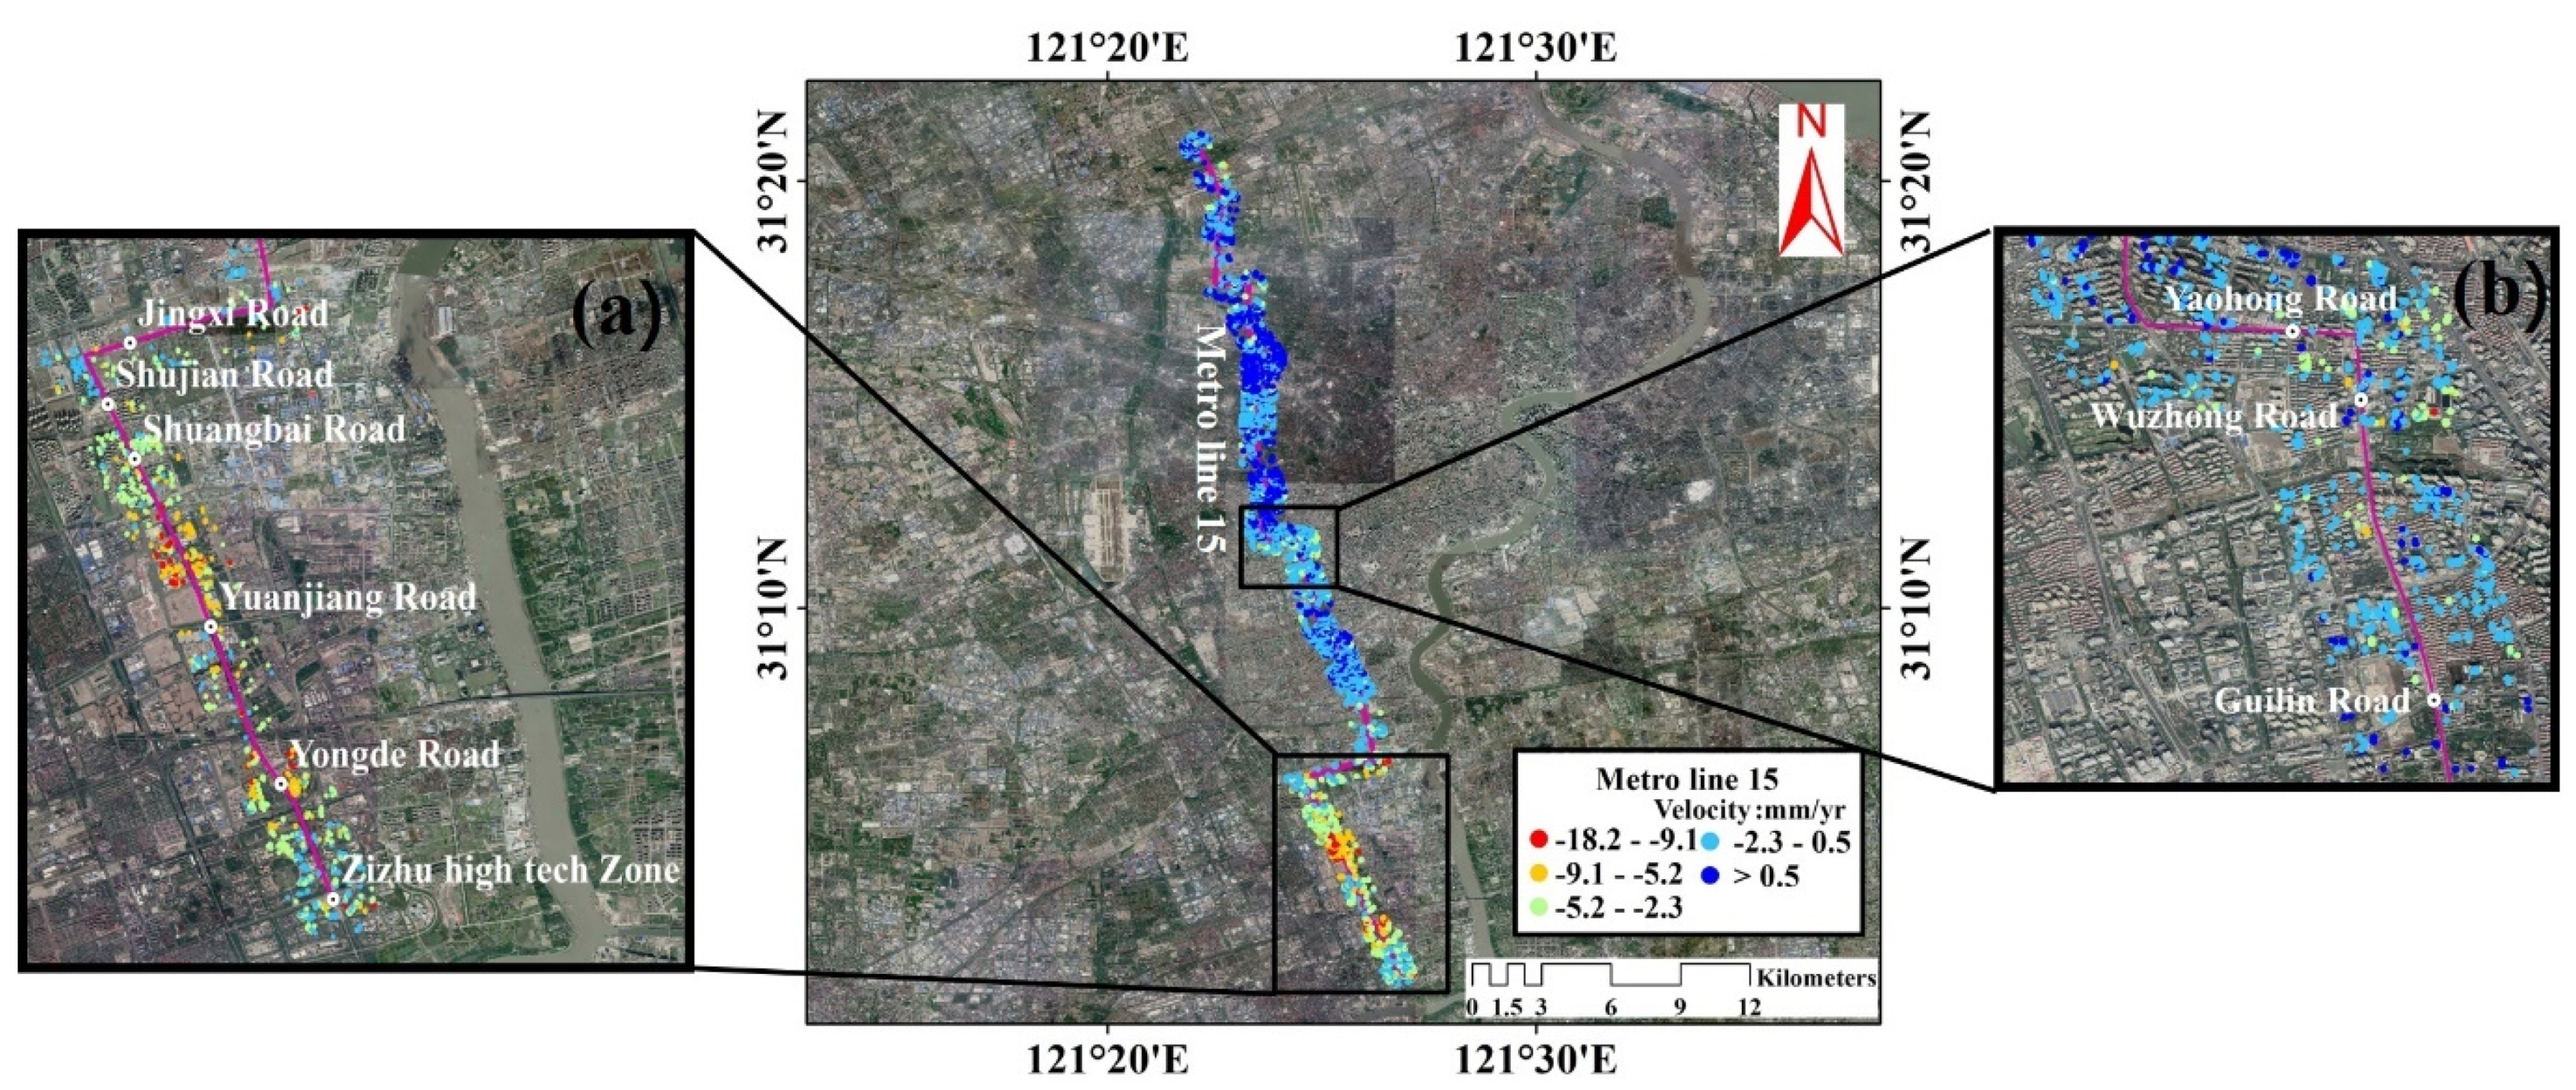
5.5. Surface Subsidence and Underground Rail Transit Construction
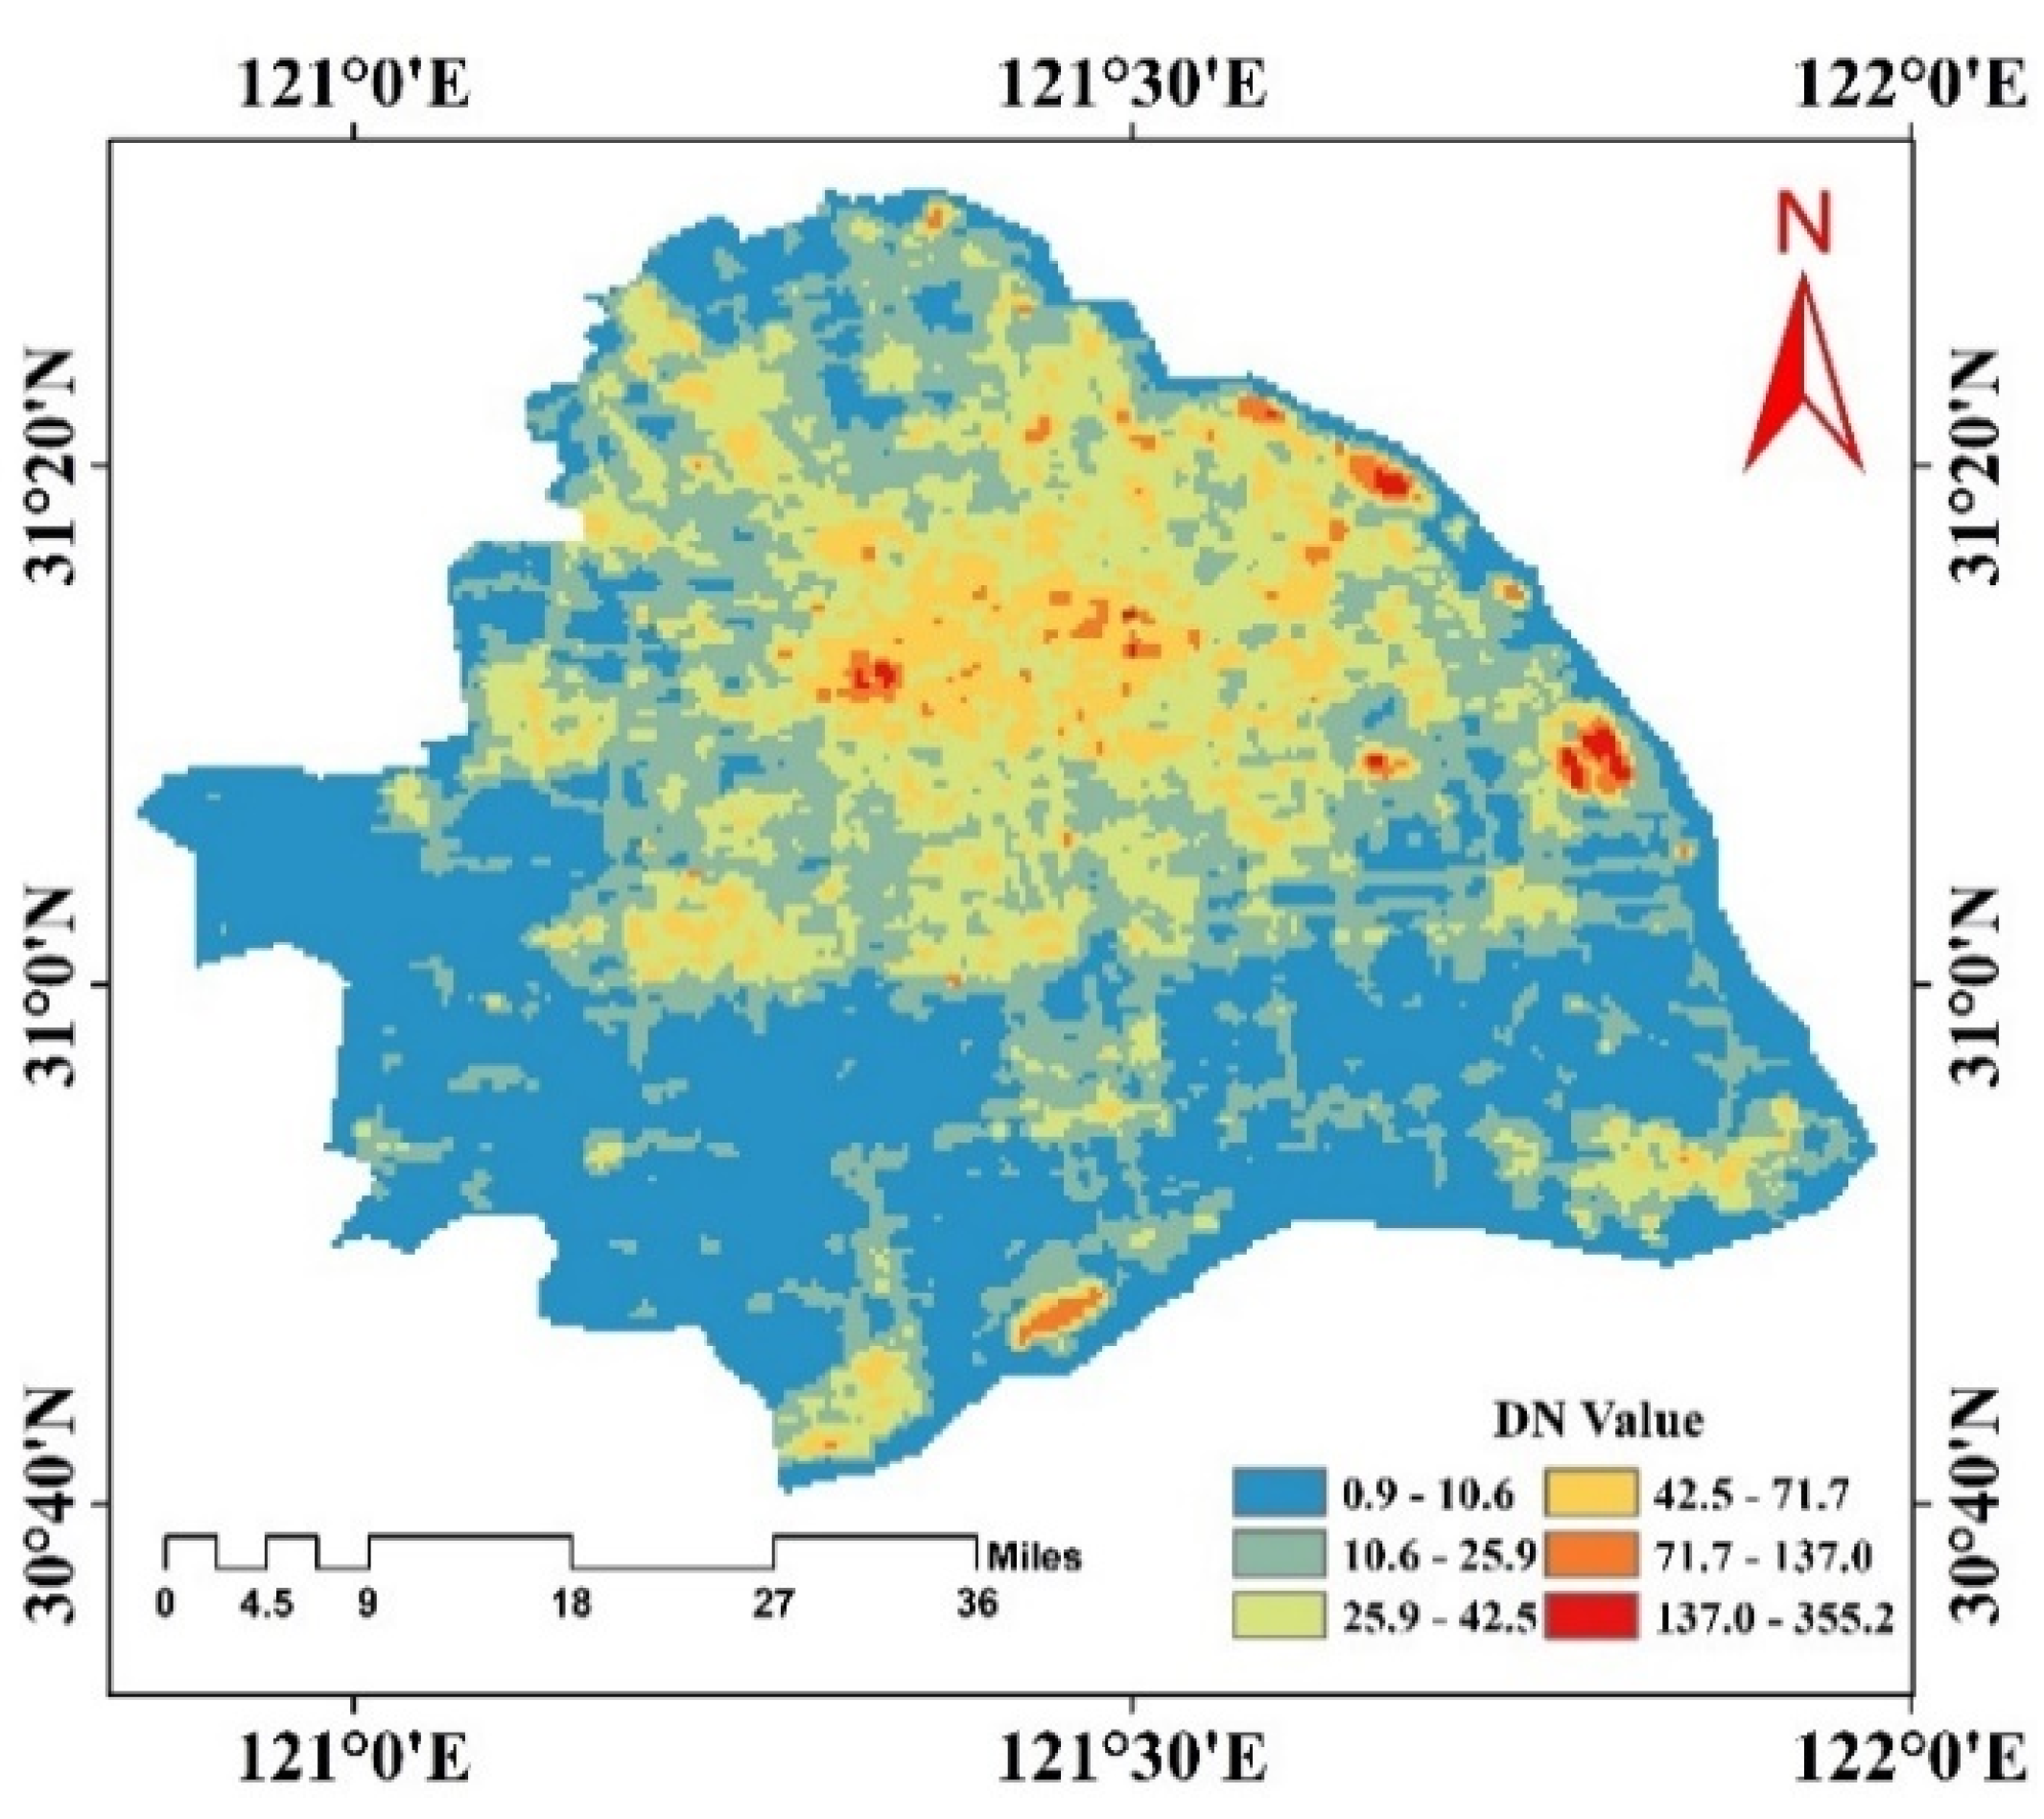
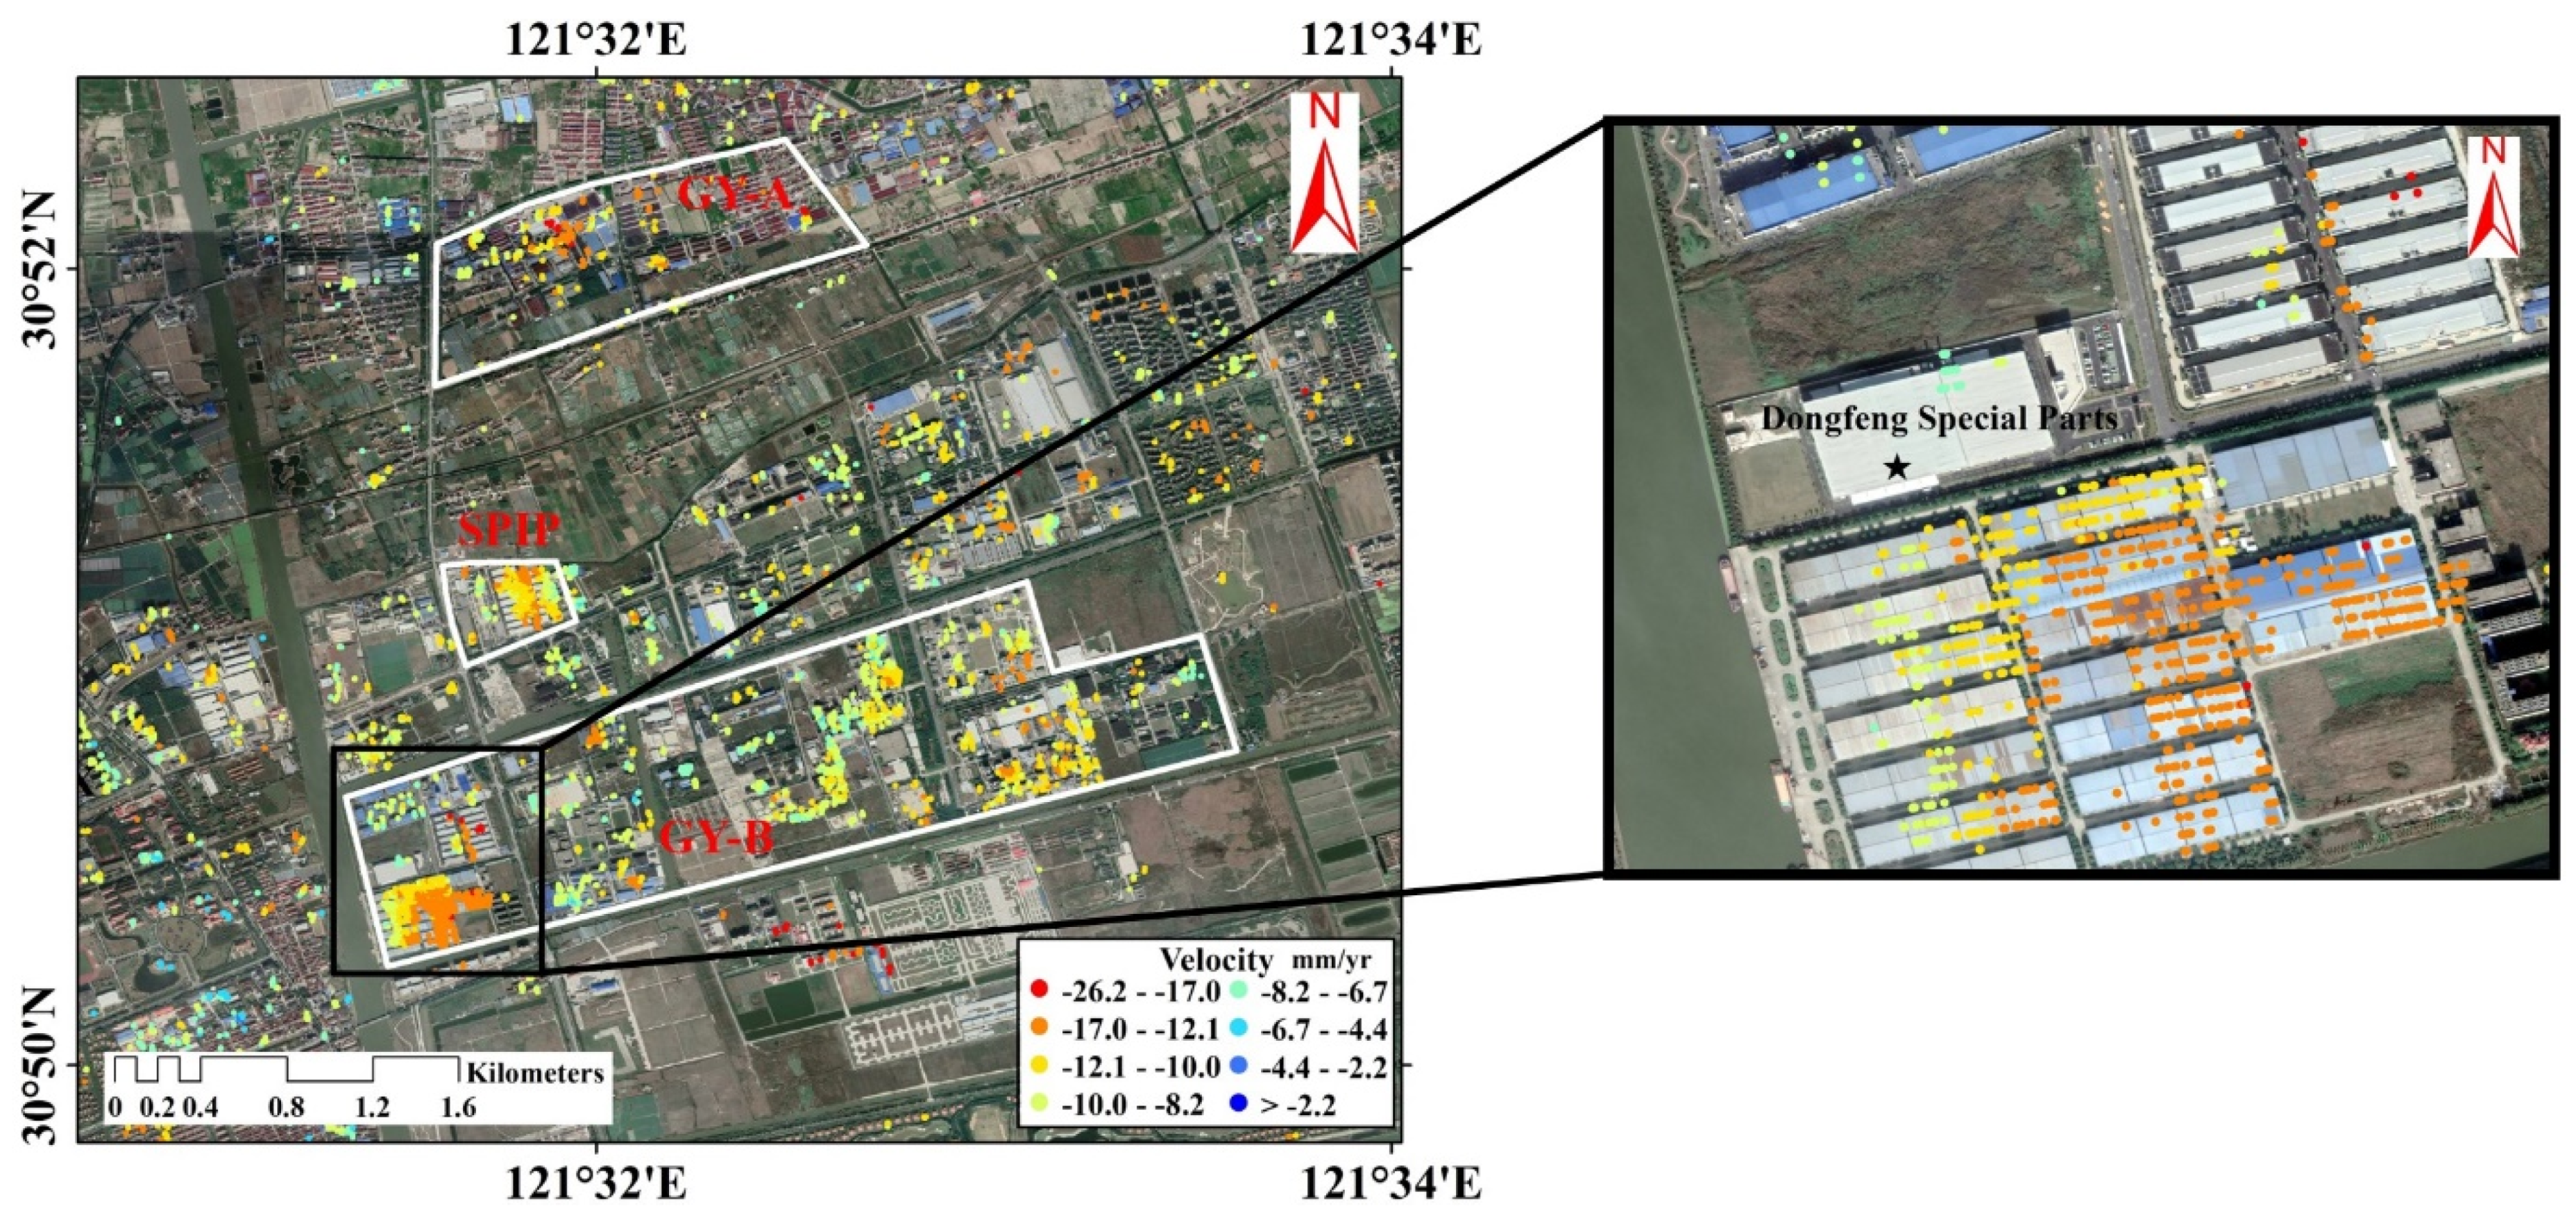
5.6. Influence of Industrialization Development on Land Surface Subsidence
5.7. Surface Subsidence and Urbanization Development
6. Conclusions
- (1)
- The internal coincidence accuracy of PSInSAR technique is analyzed. Most PS point standard deviations are less than 1 mm/year, which is relatively small. Therefore, the accuracy and stability of PSInSAR technique for surface subsidence monitoring in Shanghai area are relatively high.
- (2)
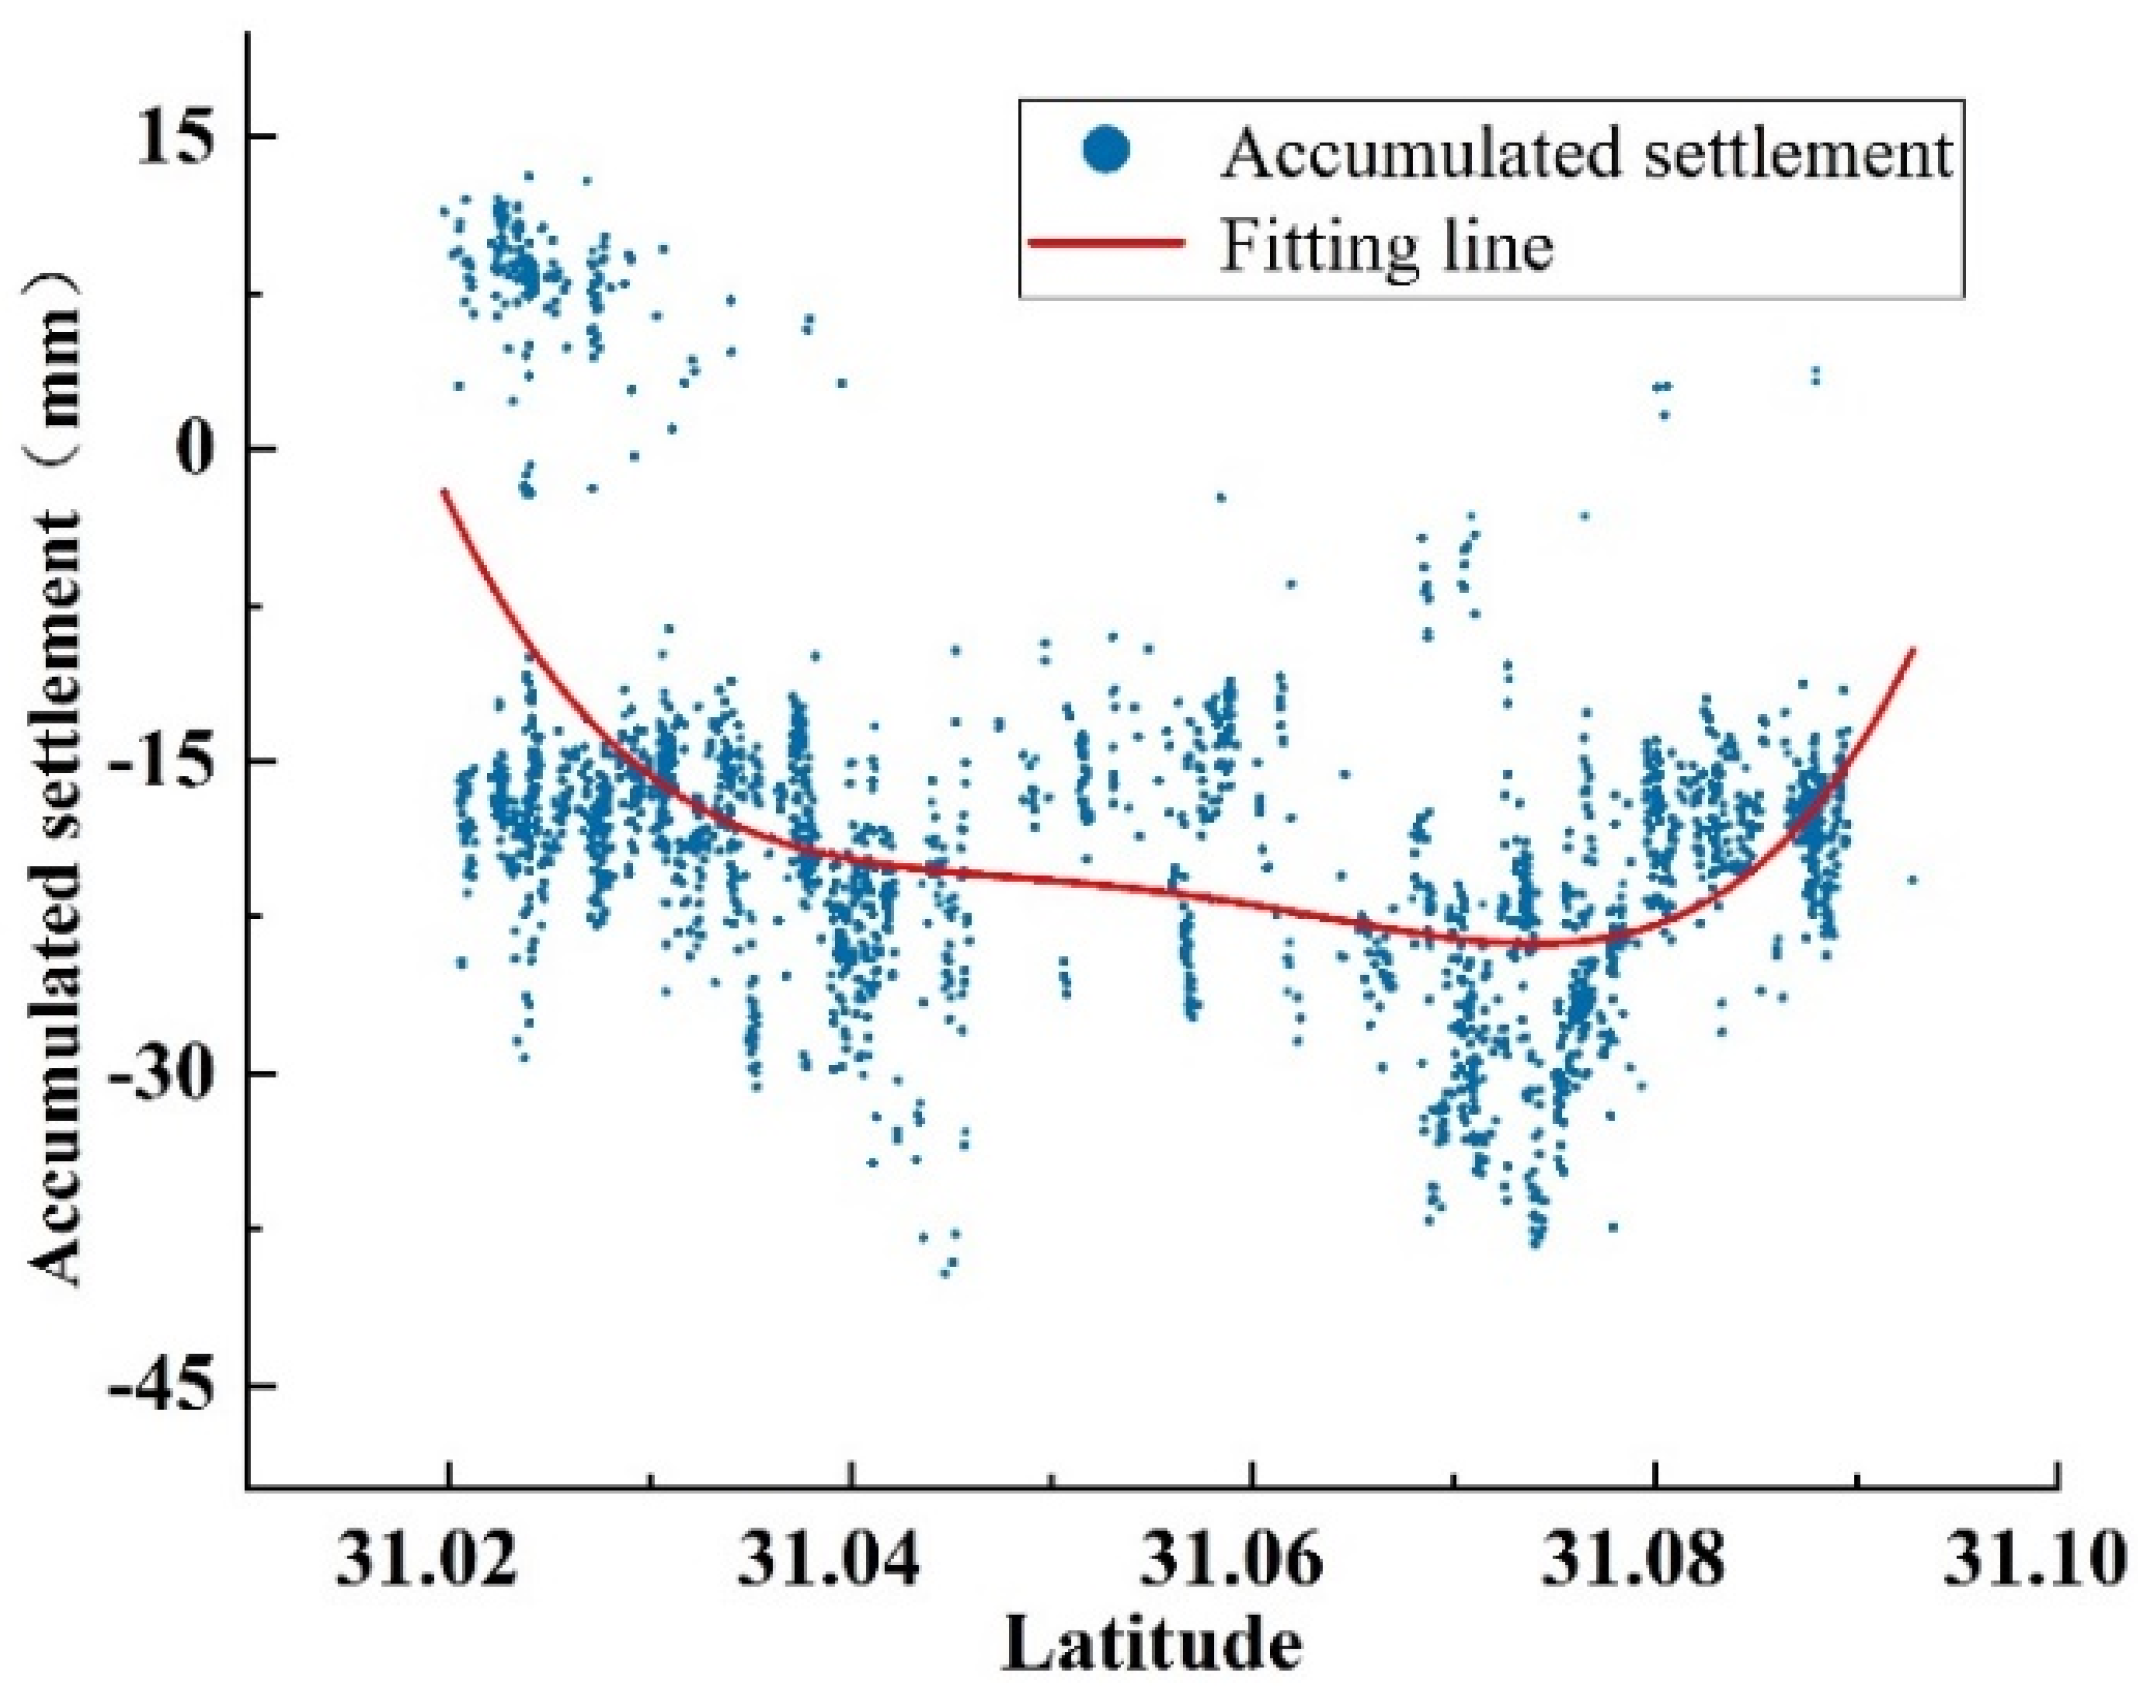
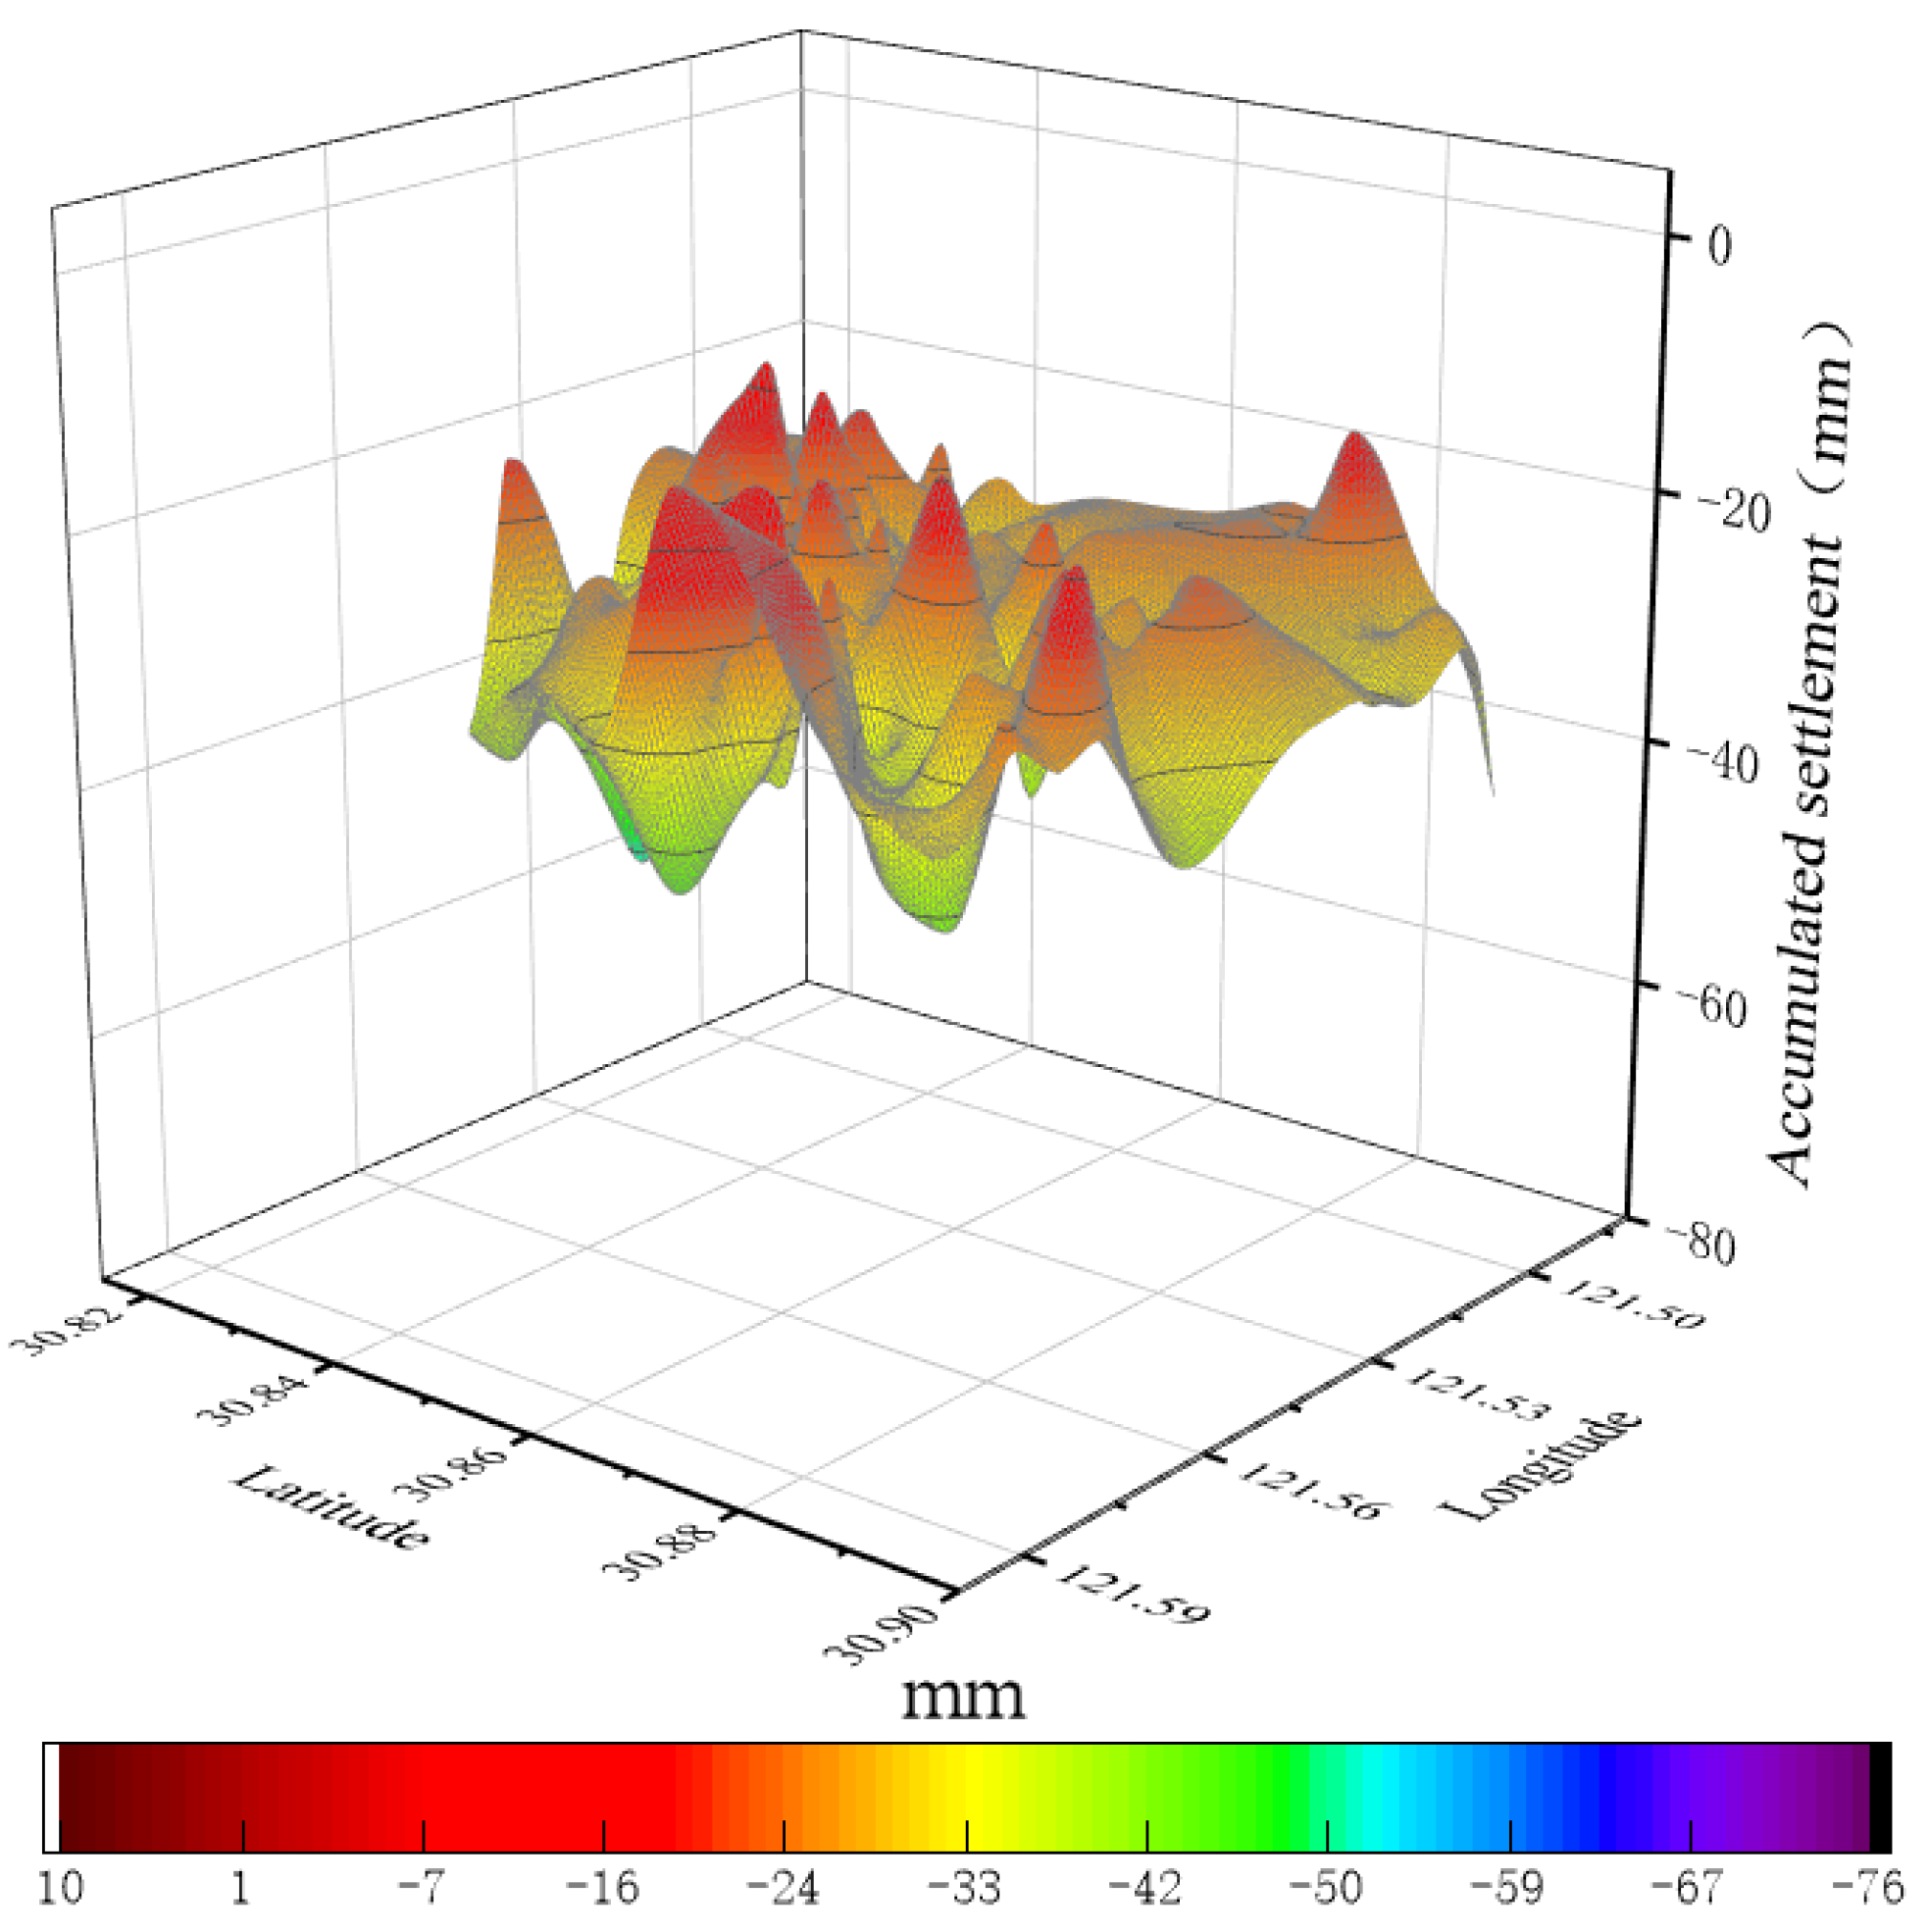
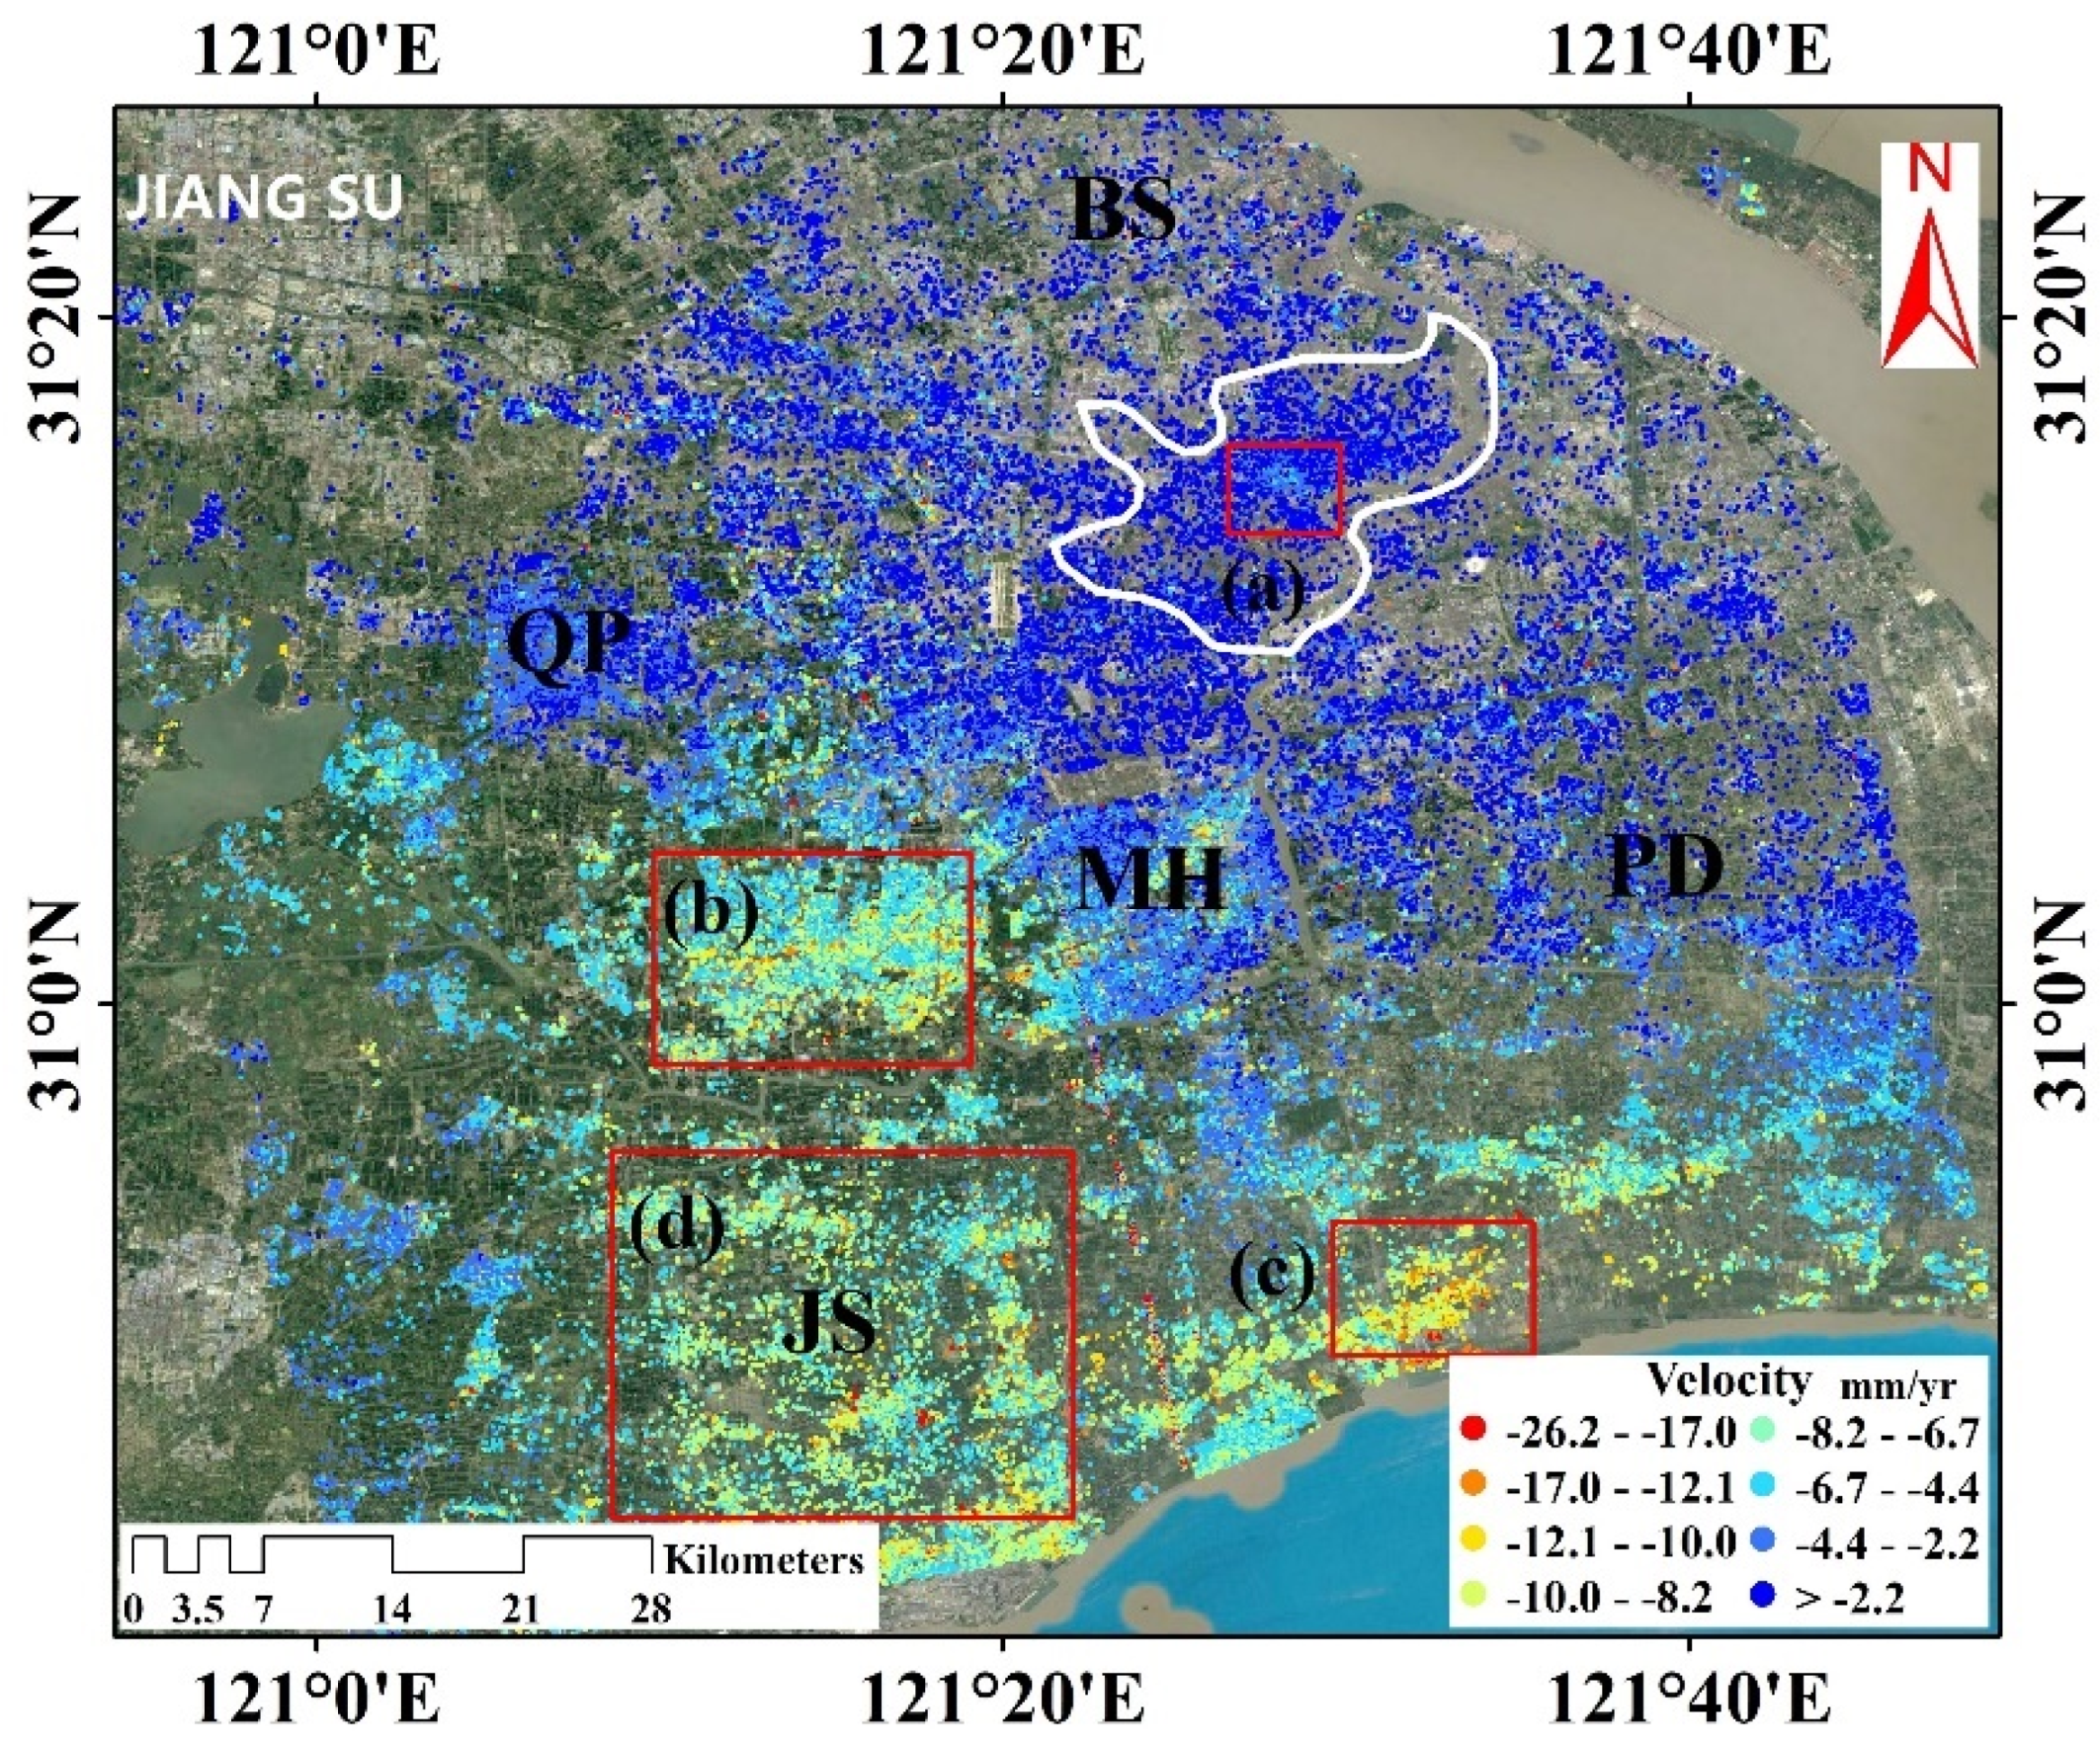
- The uneven subsidence in Shanghai is obvious. The surface subsidence in the north and east of Shanghai is stable, and the surface subsidence in some areas is uplifted. However, the subsidence in Songjiang District in the east, Jinshan District in the south and Fengxian District in Shanghai are more serious, with large area subsidence and outward expansion trend. The subsidence near Xinghuocun in Fengxian District is the most serious, with the maximum accumulated subsidence of −75 mm, which is related to the exploitation of groundwater caused by industrial water in this area.
- (3)
- The study area is mainly a soft soil geological area, and the water content of soft soil is relatively high, which has a relatively large impact on engineering construction. This reason is the main cause that Shanghai area is prone to subsidence. In addition, seasonal changes in surface subsidence may be closely related to rainfall, and timely replenishment of groundwater by rainfall can reduce the subsidence effectively and slow down the occurrence of excessive subsidence. The surface subsidence in the study area is highly correlated with the change in groundwater level. That is, when the groundwater level rises, the surface will be uplifted or stable, and when the water level drops, the surface will obviously sink.
- (4)
- Three subsidence areas were identified along the Shanghai Metro Line 15, which are the area of Yongde Road Station, the area between Yuanjiang Road Station and Shuangbai Road Station, and the area between Yaohong Road Station and Guilin Road Station. Among them, the subsidence of Yongde Road Station is the most serious with a maximum accumulated subsidence that reaches −40.2 mm. The main reason for the subsidence is the natural consolidation subsidence of the surface after the completion of the subway construction. Additionally, the industrial water in large industrial zones in Shanghai area increases the amount of underground water extraction, which is the main reason for the subsidence of industrial areas. Urbanization and infrastructure construction are also highly correlated with surface subsidence to a certain extent.
Author Contributions
Funding
Institutional Review Board Statement
Informed Consent Statement
Data Availability Statement
Acknowledgments
Conflicts of Interest
References
- Qin, W.; Huang, Q.Y.; Yu, L.; Hu, B.Q. Surface subsidence monitoring during the construction of Nanning subways. J. Geo-Inf. Sci. 2019, 21, 1467–1478. [Google Scholar]
- Bai, Z.C.; Jin, G.W.; Zhang, H.M.; Xu, Q.; Hu, J.B.; Wang, B.C. Subsidence monitoring of tianjin using PSInSAR technique with sentinel-1A. J. Geomat. Sci. Technol. 2017, 34, 283–288. [Google Scholar]
- Zhao, C.Y.; Zhang, Q.; Ding, X.L.; Lu, Z.; Yang, C.S.; Qi, X.M. Monitoring of land subsidence and ground fissures in Xi’an, China 2005–2006 mapped by SAR interferometry. Environ. Geol. 2009, 58, 147–150. [Google Scholar] [CrossRef]
- Zhou, L.; Guo, J.M.; Li, X.; Hu, J.Y. Monitoring and analyzing on ground subsidence in Beijing area based on SBAS-InSAR. J. Geod. Geodyn. 2016, 36, 793–797. [Google Scholar]
- Liu, Q.; Yue, G.S.; Ding, X.B.; Yuan, K.; Feng, G.C.; Xiong, Z.Q. Temporal and spatial characteristics analysis of Deformation along Foshan subway using time series InSAR. Geomat. Inf. Sci. Wuhan Univ. 2019, 44, 1099–1106. [Google Scholar]
- Poland, M.; Burgmann, R.; Dzurisin, D.; Lisowski, M.; Masterlark, T.; Owen, S.; Fink, J. Constraints on the mechanism of long-term, steady subsidence at Medicine Lake volcano, northern California, from GPS, leveling, and InSAR. J. Volcanol. Geotherm. Res. 2006, 150, 55–78. [Google Scholar] [CrossRef]
- Ruiz-Constán, A.; Ruiz-Armenteros, A.M.; Lamas-Fernández, F.; Martos-Rosillo, S.; Delgado, J.M.; Bekaer, D.P.S.; Sousa, J.J.; Gil, A.J.; Cuenca, M.C.; Hanssen, R.F.; et al. Multi-temporal InSAR evidence of ground subsidence induced by groundwater withdraw the Montellano aquifer. Environ. Earth Sci. 2016, 75, 242–258. [Google Scholar] [CrossRef]
- Gao, E.T.; Fan, D.L.; Fu, B.L.; Yong, Q.; Lan, Y.P. Land subsidence monitoring of Nanjing area based on PS-InSAR and SBAS technology. J. Geod. Geodyn. 2019, 39, 158–163. [Google Scholar]
- Wang, H.Q.; Feng, G.C.; Xu, B.; Yu, Y.P.; Li, Z.W.; Du, Y.A.; Zhu, J.J. Deriving spatio-temporal development of ground subsidence due to subway construction and operation in delta regions with PS-InSAR data: A case study in Guangzhou, China. Remote Sens. 2017, 9, 1004. [Google Scholar] [CrossRef] [Green Version]
- Dong, S.C.; Yin, H.W.; Yao, S.P.; Zhang, F. Detecting surface subsidence in coal mining area based on D-InSAR technique. J. Earth Sci. 2013, 24, 449–456. [Google Scholar] [CrossRef]
- Chang, H.C.; Ge, L.L.; Rizos, C. DInSAR for mine subsidence monitoring using multi-source satellite SAR images. Photogramm. Eng. Remote Sens. 2005, 3, 1742–1745. [Google Scholar]
- Du, Z.Y.; Ge, L.L.; Ng, A.H.M.; Li, X.J. Investigation on mining subsidence over Appin-West Cliff Colliery using time-series SAR interferometry. Int. J. Remote Sens. 2018, 39, 1528–1547. [Google Scholar] [CrossRef]
- Chen, Y.; Zhang, K.F.; Tan, K.; Feng, X.J.; Li, H.Z. Long-term subsidence in lava fields at piton de la Fournaise Volcano measured by InSAR: New insights for interpretation of the eastern flank motion. Remote Sens. 2018, 10, 597. [Google Scholar] [CrossRef] [Green Version]
- Bru, G.; Gonzalez, P.J.; Mateos, R.M.; Roldan, F.J.; Herrera, G.; Bejar-Pizarro, M.; Fernandez, J. A-DInSAR monitoring of landslide and subsidence activity: A case of urban damage in Arcos de la Frontera, Spain. Remote Sens. 2017, 9, 787. [Google Scholar] [CrossRef] [Green Version]
- Atzori, S.; Hunstad, I.; Chini, M.; Salvi, S.; Tolomei, C.; Bignami, C.; Stramondo, S.; Trasatti, E.; Antonioli, A.; Boschi, E. Finite fault inversion of DInSAR coseismic displacement of the 2009 L’Aquila earthquake (central Italy). Geophys. Res. Lett. 2009, 36, L15305. [Google Scholar] [CrossRef]
- Scaioni, M.; Marsella, M.; Crosetto, M.; Tornatore, V.; Wang, J. Geodetic and remote-sensing sensors for dam deformation monitoring. Sensors 2018, 18, 3682. [Google Scholar] [CrossRef] [PubMed] [Green Version]
- Gabriel, A.K.; Goldstein, R.M.; Zebker, H.A. Mapping small elevation changes over large areas: Differential radar interferometry. J. Geophys. Res. Solid Earth 1989, 94, 9183–9191. [Google Scholar] [CrossRef]
- Ferretti, A.; Prati, C.; Rocca, F. Permanent scatterers in SAR interferometry. IEEE Trans. Geosci. Remote Sens. 2001, 39, 8–20. [Google Scholar] [CrossRef]
- Beradino, P.; Fornaro, G.; Lanari, R.; Sansosti, E. A new algorithm for surface deformation monitoring based on small baseline differential SAR interferograms. IEEE Trans. Geosci. Remote Sens. 2002, 40, 2375–2383. [Google Scholar] [CrossRef] [Green Version]
- Zhu, X.X.; Chen, M.; Gong, H.L.; Li, X.J.; Yu, J.; Zhu, L.; Zhou, Y.Y.; Li, Y. The Subsidence Monitoring along Beijing Subway Network Based on MT-InSAR. J. Geo-Inf. Sci. 2018, 20, 1810–1819. [Google Scholar]
- Chen, H. Surface Subsidence Monitoring in Mining Area Based on TCP-InSAR Technology; China University of Mining and Technology: Xuzhou, China, 2016. [Google Scholar]
- Caló, F.; Notti, D.; Galve, J.P.; Abdikan, S.; Gorum, T.; Pepe, A.; Sanli, F.B. DInSAR-Based detection of land subsidence and correlation with groundwater depletion in Konya Plain, Turkey. Remote Sens. 2017, 9, 83. [Google Scholar] [CrossRef] [Green Version]
- Zhou, L.; Guo, J.M.; Hu, J.Y.; Li, J.W.; Xu, Y.F.; Pan, Y.J.; Shi, M. Wuhan surface subsidence analysis in 2015–2016 based on sentinel-1A data by SBAS-InSAR. Remote Sens. 2017, 9, 982. [Google Scholar] [CrossRef] [Green Version]
- Brunori, C.A.; Bignami, C.; Albano, M.; Zucca, F.; Samsonov, S.; Groppelli, G.; Norini, G.; Saroli, M.; Stramondo, S. Land subsidence, ground fissures and buried faults: InSAR monitoring of Ciudad Guzman (Jalisco, Mexico). Remote Sens. 2015, 7, 8610–8630. [Google Scholar] [CrossRef] [Green Version]
- Yang, M.S.; Yang, T.L.; Zhang, L.; Lin, J.X.; Qin, X.Q.; Liao, M.S. Spatio-temporal characterization of a reclamation subsidence in the Shanghai coastal area with time series analyses of X-, C-, and L-band SAR datasets. Remote Sens. 2018, 10, 329. [Google Scholar] [CrossRef] [Green Version]
- Wang, R.; Yang, T.L.; Yang, M.S.; Liao, M.S.; Lin, J.X. A safety analysis of elevated highways in Shanghai linked to dynamic load using long-term time-series of InSAR stacks. Remote Sens. Lett. 2019, 10, 1133–1142. [Google Scholar] [CrossRef]
- Zhang, L.N.; Wu, J.C.; Li, T.; Chen, J. Monitoring ground deformation based on small baseline approach in Shanghai. J. Tongji Univ. 2012, 40, 1564–1568. [Google Scholar]
- Antonio, P.; Manuela, B.; Zhao, Q.; Yang, T.; Wang, H. The use of C-/X-band time-gapped SAR data and geotechnical models for the study of Shanghai’s ocean-reclaimed lands through the SBAS-DInSAR technique. Remote Sens. 2016, 8, 911–929. [Google Scholar]
- Yu, L.; Yang, T.L.; Zhao, Q.; Liu, M.; Pepe, A. The 2015–2016 ground displacements of the shanghai coastal area inferred from a combined COSMO-SkyMed/Sentinel-1 DInSAR analysis. Remote Sens. 2017, 9, 1194. [Google Scholar] [CrossRef] [Green Version]
- Qin, X.Q.; Yang, T.L.; Yang, M.S.; Zhang, L.; Liao, M.S. Health diagnosis of major transportation infrastructures in Shanghai metropolis using high-resolution persistent scatterer interferometry. Sensors 2017, 17, 2770. [Google Scholar] [CrossRef] [Green Version]
- Zhao, J.W.; Wu, J.C.; Ding, X.L.; Wang, M.Z. Elevation extraction and deformation monitoring by multitemporal InSAR of Lupu Bridge in Shanghai. Remote Sens. 2017, 9, 897. [Google Scholar] [CrossRef] [Green Version]
- Zhou, C.D.; Gong, H.L.; Zhang, Y.Q.; Duan, G.Y. The influence of building load to land subsidence in Beijing plain based on PS-InSAR and GIS. J. Geo-Inf. Sci. 2016, 18, 1551–1562. [Google Scholar]
- Pan, C.; Jiang, L.M.; Sun, Q.S.; Jiang, Y.N. Monitoring and Analyzing Chengdu Ground Subsidence Based on InSAR Technology by Using Sentinel-1 Radar Image. J. Geod. Geodyn. 2020, 40, 198–203. [Google Scholar]
- Zhang, Z.J.; Wang, C.; Wang, M.M.; Wang, Z.W.; Zhang, H. Surface deformation monitoring in Zhengzhou city from 2014 to 2016 using time-series InSAR. Remote Sens. 2018, 10, 1731. [Google Scholar] [CrossRef] [Green Version]
- Li, D.R.; Liao, M.S.; Wang, Y. Progress of permanent scatterer interferometry. Geomat. Inf. Sci. Wuhan Univ. 2004, 29, 10–24. [Google Scholar]
- Liao, M.S. Subsidence monitoring in Shanghai using the PSInSAR technique. Shanghai Land Resour. 2012, 33, 5–10. [Google Scholar]
- Wu, H.W.; Li, Q.; Liu, G.B. Characteristics of one-dimensional compressibility of Shanghai clay. Chin. J. Geotech. Eng. 2011, 33, 630–636. [Google Scholar]
- He, P.; Wang, W.D.; Xu, Z.H. Empirical correlations of compression index and swelling index for Shanghai clay. Rock Soil Mech. 2018, 39, 3773–3782. [Google Scholar]
- Gao, G.Y.; Chen, Q.S.; He, J.F.; Zhang, X.L. Effect of rise of groundwater table on seismic ground response of soft soil in Shanghai. Chin. J. Geotech. Eng. 2011, 33, 989–995. [Google Scholar]
- Xu, S.; Chen, Y.L.; Zhao, C.X. One-dimensional consolidation tests of creep deformation and secondary consolidation charhcteristics of soft soils in Shanghai area. J. Eng. Geol. 2008, 16, 65–71. [Google Scholar]
- Shi, M.; Gong, H.L.; Gao, M.L.; Chen, B.B.; Zhang, S.K.; Zhou, C.F. Recent ground subsidence in the North China Plain, China, revealed by sentinel-1A datasets. Remote Sens. 2020, 12, 3579. [Google Scholar] [CrossRef]
- Rateb, A.; Hermas, E. The 2018 long rainy season in Kenya: Hydrological changes and correlated land subsidence. Remote Sens. 2020, 12, 1390. [Google Scholar] [CrossRef]
- Wasowski, J.; Pisano, L. Long-term InSAR, borehole inclinometer, and rainfall records provide insight into the mechanism and activity patterns of an extremely slow urbanized landslide. Landslides 2020, 17, 445–457. [Google Scholar] [CrossRef]
- Benetatos, C.; Codegone, G.; Ferraro, C.; Mantegazzi, A.; Rocca, V.; Tango, G.; Trillo, F. Multidisciplinary analysis of ground movements: An underground gas storage case study. Remote Sens. 2020, 12, 3487. [Google Scholar] [CrossRef]
- Settari, A.; Walters, D.A.; Stright, D.H.; Aziz, K. Numerical techniques used for predicting subsidence due to gas extraction in the North Adriatic Sea. Pet. Sci. Technol. 2008, 26, 1205–1223. [Google Scholar] [CrossRef]
- Rutqvist, J.; Vasco, D.W.; Myer, L.R. Coupled reservoir-geomechanical analysis of CO2 injection and ground deformations at In Salah, Algeria. Greenh. Gas Control 2010, 4, 225–230. [Google Scholar] [CrossRef] [Green Version]
- Du, J.C.; Kuo, M.F. Grey relational-regression analysis for hot mix asphalt design. Constr. Build. Mater. 2011, 25, 2627–2634. [Google Scholar] [CrossRef]
- Deng, J. To analyze the connotation and extension (C&E) of grey theory. J. Grey Syst. 2012, 24, 293–298. [Google Scholar]
- Ge, D.Q.; Yin, Y.P.; Wang, Y.; Zhang, L.; Guo, X.F.; Wang, Y. Seasonal subsidence-rebound and ground water level changes monitoring by using coherent target InSAR technique: A case study of Dezhou, Shandong. Remote Sens. Land Resour. 2014, 26, 103–109. [Google Scholar]
- Huang, Y.H.; Lv, Y.J.; Zhou, Y.; Zhao, J.T.; Shi, B.X. A method for estimating land subsidence induced by ground water extraction and its application to site evaluation of Yizhuang light railway in Beijing. Rock Soil Mech. 2009, 30, 2458–2460. [Google Scholar]
- Chen, B.B.; Gong, H.L.; Li, X.J.; Lei, K.C.; Wang, Y.B.; Wu, P.F. Relationship between load density and land subsidence of typical ground water funnel area of Beijing, China. J. Basic Sci. Eng. 2013, 21, 1046–1056. [Google Scholar]
- Zhang, Y.D.; Wu, H.G.; Li, M.J.; Kang, Y.H.; Zhong, L. Investigating ground subsidence and the causes over the whole Jiangsu Province, China using sentinel-1 SAR data. Remote Sens. 2021, 13, 179. [Google Scholar] [CrossRef]
- Aljammaz, A.; Sultan, M.; Izadi, M.; Abotalib, A.Z.; Elhebiry, M.S.; Emil, M.K.; Abdelmohsen, K.; Saleh, M.; Becker, R. Land subsidence induced by rapid urbanization in arid environments: A remote sensing-based investigation. Remote Sens. 2021, 13, 1109. [Google Scholar] [CrossRef]
- Ma, X.X. Monitor the Impact of Beijing Subway Development on Land Subsidence Based on InSAR Technology; Capital Normal University: Beijing, China, 2013. [Google Scholar]
- Ren, C.; Shi, X.J.; Zhou, L.; Huang, Y.L.; Liang, Y.J.; Zhu, Z.L. Land subsidence detection and analysis along subway based on sentinel-1A time series interferometry synthetic aperture radar. Sci. Technol. Eng. 2020, 20, 803–808. [Google Scholar]
- Ge, D.Q.; Zhang, L.; Wang, Y.; Li, M.; Liu, B. Monitoring subsidence on Shanghai Metro line 10 during construction and operation using high-resolution InSAR. Shanghai Land Resour. 2014, 35, 62–67. [Google Scholar]
- Meng, D.; Zang, X.G.; Yu, G.M.; Yuan, C.F. Comparative study of analytical methods for ground surface subsidence induced by subway station construction. Chin. J. Rock Mech. Eng. 2012, 31, 1169–1177. [Google Scholar]
- Yao, X.D.; Wang, M.S. Statistic analysis of guideposts for ground subsidence induced by shallow tunnel construction. Chin. J. Rock Mech. Eng. 2006, 25, 2030–2035. [Google Scholar]
- Yu, Q.; Yan, X.; Wang, Q.; Yang, T.; Lu, W.; Yao, M.; Dong, J.; Zhan, J.; Huang, X.; Niu, C.; et al. A spatial-scale evaluation of soil consolidation concerning land subsidence and integrated mechanism analysis at macro-, and micro-scale: A case study in Chongming East Shoal Reclamation Area, Shanghai, China. Remote Sens. 2021, 13, 2418. [Google Scholar] [CrossRef]
- Miao, L.C.; Wang, F.; Lv, W.H. Ground surface subsidence due to urban tunnel construction. J. Southeast Univer. 2008, 38, 293–297. [Google Scholar]
- Zhu, H.; Zhang, Q.L.; Zhang, S. Spatial and temporal characteristics of socio-economic development in central Asia based on a series of nighttime light images from 1992 to 2017. J. Geo-Inf. Sci. 2020, 22, 1449–1462. [Google Scholar]
- Li, X.; Ge, L.L.; Chen, X.L. Detecting Zimbabwe’s decadal economic decline using nighttime light imagery. Remote Sens. 2013, 5, 4551–4570. [Google Scholar] [CrossRef] [Green Version]
- Witmer, F.D.W.; O’Loughlin, J. Detecting the effects of wars in the Caucasus regions of Russia and Georgia using radiometrically normalized DMSP-OLS nighttime lights imagery. GISci. Remote Sens. 2011, 48, 478–500. [Google Scholar] [CrossRef]


| Serial Number | Image | Spatial Baseline/m | Temporal Baseline/d | Serial Number | Image | Spatial Baseline/m | Temporal Baseline/d |
|---|---|---|---|---|---|---|---|
| 1 | 17 January 2018 | 67.09 | −528 | 19 | 25 March 2019 | −63.73 | −96 |
| 2 | 10 February 2018 | 6.41 | −504 | 20 | 6 April 2019 | −14.19 | −84 |
| 3 | 6 March 2018 | 13.28 | −480 | 21 | 30 April 2019 | −89.44 | −60 |
| 4 | 30 March 2018 | 48.10 | −456 | 22 | 12 May 2019 | −19.04 | −48 |
| 5 | 23 April 2018 | −6.24 | −432 | 23 | 5 June 2019 | 28.04 | −24 |
| 6 | 17 May 2018 | 19.20 | −408 | 24 | 29 June 2019 | 0 | 0 |
| 7 | 29 May 2018 | 29.99 | −396 | 25 | 23 July 2019 | −52.51 | 24 |
| 8 | 22 June 2018 | −5.17 | −372 | 26 | 4 August 2019 | 14.74 | 36 |
| 9 | 16 July 2018 | 20.67 | −348 | 27 | 28 August 2019 | 18.82 | 60 |
| 10 | 21 August 2018 | −19.90 | −312 | 28 | 21 September 2019 | −65.90 | 84 |
| 11 | 14 September 2018 | 2.30 | −288 | 29 | 15 October 2019 | 73.27 | 108 |
| 12 | 8 October 2018 | 69.68 | −264 | 30 | 20 November 2019 | −54.98 | 144 |
| 13 | 1 November 2018 | −50.82 | −240 | 31 | 14 December 2019 | 31.26 | 168 |
| 14 | 25 November 2018 | 75.00 | −216 | 32 | 7 January 2020 | 68.47 | 192 |
| 15 | 19 December 2018 | 106.11 | −192 | 33 | 31 January 2020 | 25.88 | 216 |
| 16 | 12 January 2019 | −13.09 | −168 | 34 | 12 February 2020 | 10.44 | 228 |
| 17 | 5 February 2019 | 134.60 | −144 | 35 | 7 March 2020 | −7.76 | 252 |
| 18 | 1 March 2019 | −38.77 | −120 | 36 | 31 March 2020 | −41.35 | 276 |
| Parameters | Description |
|---|---|
| Imaging mode | IW |
| Data type | SLC |
| Band | C (5.63 cm) |
| Revisit cycle | 12 days |
| Polarization mode | VH |
| Time span | January 2018–March 2020 |
| Orbit direction | Ascending |
| Central incidence angle on the test site | 36.6° |
| Range resolution | 1.2 m |
| Azimuth resolution | 13.9 m |
| Parameters (m3) | 2018 | 2019 |
|---|---|---|
| per capita water consumption | 313 | 314 |
| Annual surface runoff | 76.17 × 10⁸ | 75.96 × 10⁸ |
| Groundwater withdrawals | 2 × 10⁶ | 1 × 10⁶ |
| Industrial water | 34.41 × 10⁸ | 34.02 × 10⁸ |
| Domestic water | 13.26 × 10⁸ | 13.5 × 10⁸ |
| Recharge groundwater | 21.07 × 10⁶ | 20.14 × 10⁶ |
Publisher’s Note: MDPI stays neutral with regard to jurisdictional claims in published maps and institutional affiliations. |
© 2021 by the authors. Licensee MDPI, Basel, Switzerland. This article is an open access article distributed under the terms and conditions of the Creative Commons Attribution (CC BY) license (https://creativecommons.org/licenses/by/4.0/).
Share and Cite
Li, J.; Zhou, L.; Ren, C.; Liu, L.; Zhang, D.; Ma, J.; Shi, Y. Spatiotemporal Inversion and Mechanism Analysis of Surface Subsidence in Shanghai Area Based on Time-Series InSAR. Appl. Sci. 2021, 11, 7460. https://doi.org/10.3390/app11167460
Li J, Zhou L, Ren C, Liu L, Zhang D, Ma J, Shi Y. Spatiotemporal Inversion and Mechanism Analysis of Surface Subsidence in Shanghai Area Based on Time-Series InSAR. Applied Sciences. 2021; 11(16):7460. https://doi.org/10.3390/app11167460
Chicago/Turabian StyleLi, Jiahao, Lv Zhou, Chao Ren, Lilong Liu, Di Zhang, Jun Ma, and Yujun Shi. 2021. "Spatiotemporal Inversion and Mechanism Analysis of Surface Subsidence in Shanghai Area Based on Time-Series InSAR" Applied Sciences 11, no. 16: 7460. https://doi.org/10.3390/app11167460
APA StyleLi, J., Zhou, L., Ren, C., Liu, L., Zhang, D., Ma, J., & Shi, Y. (2021). Spatiotemporal Inversion and Mechanism Analysis of Surface Subsidence in Shanghai Area Based on Time-Series InSAR. Applied Sciences, 11(16), 7460. https://doi.org/10.3390/app11167460