Abstract
Hospital emergency departments (EDs) are hubs for highly transmissible infectious diseases, posing the highest risk of viral infection transmission. With the current COVID-19 outbreak, it has become clear that the ED design needs to be altered in order to be successful in containing the pandemic. The purpose of this study is to use a computational fluid dynamics (CFD) simulation to evaluate the ventilation system design for an emergency department at a university hospital. The kinetic energy and velocity patterns of turbulence were analyzed to determine which areas of the ED were most susceptible to viral transmission. Additionally, the impact of pressure suction on COVID-19 dispersion has been investigated. Three critical areas of the ED, overnight patient beds, surgical rooms, and resuscitation rooms, all had much higher air velocity, dispersion, and mixing levels than the rest of the department’s spaces, according to the simulation findings. Air transmission from these sites to adjacent regions is a possibility in the scenario studied, increasing the likelihood of the virus spreading from these locations and infecting people in the surrounding areas. The results of these simulations may be utilized to provide recommendations to the hospital administration about the placement of inlets and outlets, the separation of areas, and the interior design of the spaces and corridors.
1. Introduction
By examining the most recent advances in science, it has been shown that the prevention of infectious diseases is not a novel area of study [1,2,3,4]. It is possible for microorganisms to be transferred via direct contact between an infected person and a contaminated item, as well as by droplets transmitted through the air. Droplets, which are usually larger than 5 microns in size, spread from an infected individual and travel considerable distances in the air before reaching another person [5]. Following a number of studies on the transmission of infectious disease particles and viruses, it has been shown that ventilation is one of the most important methods for reducing and controlling pathogen spread through the air in hospitals [6,7]. The World Health Organization (WHO), the American Society of Heating, Ventilation, Refrigeration, and Air-Conditioning Engineers (ASHRAE), and the Centers for Disease Control and Prevention (CDC) recommendations suggest that patient rooms have ventilation rates of at least 6 ACH and hospital isolation rooms have ventilation rates of at least 12 ACH [8,9,10]. However, even though raising the ventilation airflow rate helps to reduce concentrations in situations when the pollution source is stationary, doing so does not improve the efficiency of the ventilation system [7].
The function that ventilation systems have in the transmission of disease between individuals is discussed by Li [11]. They came to the conclusion that there is a tight connection between ventilation systems and disease transmission. The effects of physical factors, such as the location of supply and exhaust openings, as well as the influence of indoor environmental factors, such as temperature, humidity, light, building materials, surfaces, and products [3,12], are examples of risk factors. Studies on the spread of infectious particles in healthcare institutions are conducted especially for this purpose. Experimental testing and simulations utilizing sophisticated programs were used to explore the position of air inlet and outflow in previous studies [13,14,15,16,17,18]. Experiments like these resulted in a set of design rules and standards that legislated a set of minimum requirements for ventilation systems in healthcare settings. However, it is important to note and, according to a thorough assessment of the literature [19], that not every encounter with an infectious agent will result in the receiver being infected with the pathogen. It is possible to have individual risk factors that make a person more likely to acquire one illness than another. Risk factors for healthcare-associated infection are variables that do not seem to be a direct cause of illness, but do appear to be associated with the infection in some manner. The surrounding environment includes risk factors that should be taken into consideration in order to offer suitable air funnel locations and guarantee that transmission does not reach users of care spaces [20].
Air quality and ventilation research is concentrated on specific regions, such as isolation quadrants [16,17], hospital hallways [13], nursing stations [2], and operating rooms [18]. The emergency department has been the subject of few studies [14]. Emergency departments (EDs) are the first point of contact for patients suffering from illnesses or injuries, particularly those suffering from newly developing or recurring infectious infections. When comparing the same time period in the prior year to the COVID-19 epidemic, emergency departments observed a 20 percent reduction in patient counts [21,22]. As a result of this decrease, the incidence of cardiac arrest rose by more than 45 percent, suggesting that individuals experiencing medical problems avoided going to the emergency department for fear of acquiring COVID-19 [21,22,23]. In addition, the presence of healthcare workers (HCWs) in emergency departments increases their risk of acquiring COVID-19 infection since the majority of patients with infectious illnesses are not identified prior to admission [23], putting them at higher risk of contracting COVID-19 infection. Due to the layouts and inadequate spatial arrangements in EDs, there is a significant risk of viral transmission [24]. The ED is divided into several functional spaces, including a patient waiting area, triage, a recovery area, minor procedure rooms, a major operating room, medical services and consultation rooms, and monitoring units [25]. Patient mobility between these places increases the likelihood of the virus being transmitted to healthcare personnel and other patients in the surrounding area. As a result, the design of an ED contributes to the prevention or control of viral transmission inside it. Infection prevention is critical in every healthcare setting.
As a consequence, the purpose of this research is to evaluate the ventilation system design of an existing emergency department and to investigate intra-departmental airflow patterns and their relationship to the department layout in order to identify potential risk zones for staff and patients. It provides hospital managers with recommendations and suggestions for enhancing the architecture of emergency departments. In essence, this would result in a decrease in hospital burden, enabling them to retain the largest possible number of personnel without danger of disease transmission, allowing the hospital to operate at maximum capacity.
2. Material and Method
2.1. Case Description
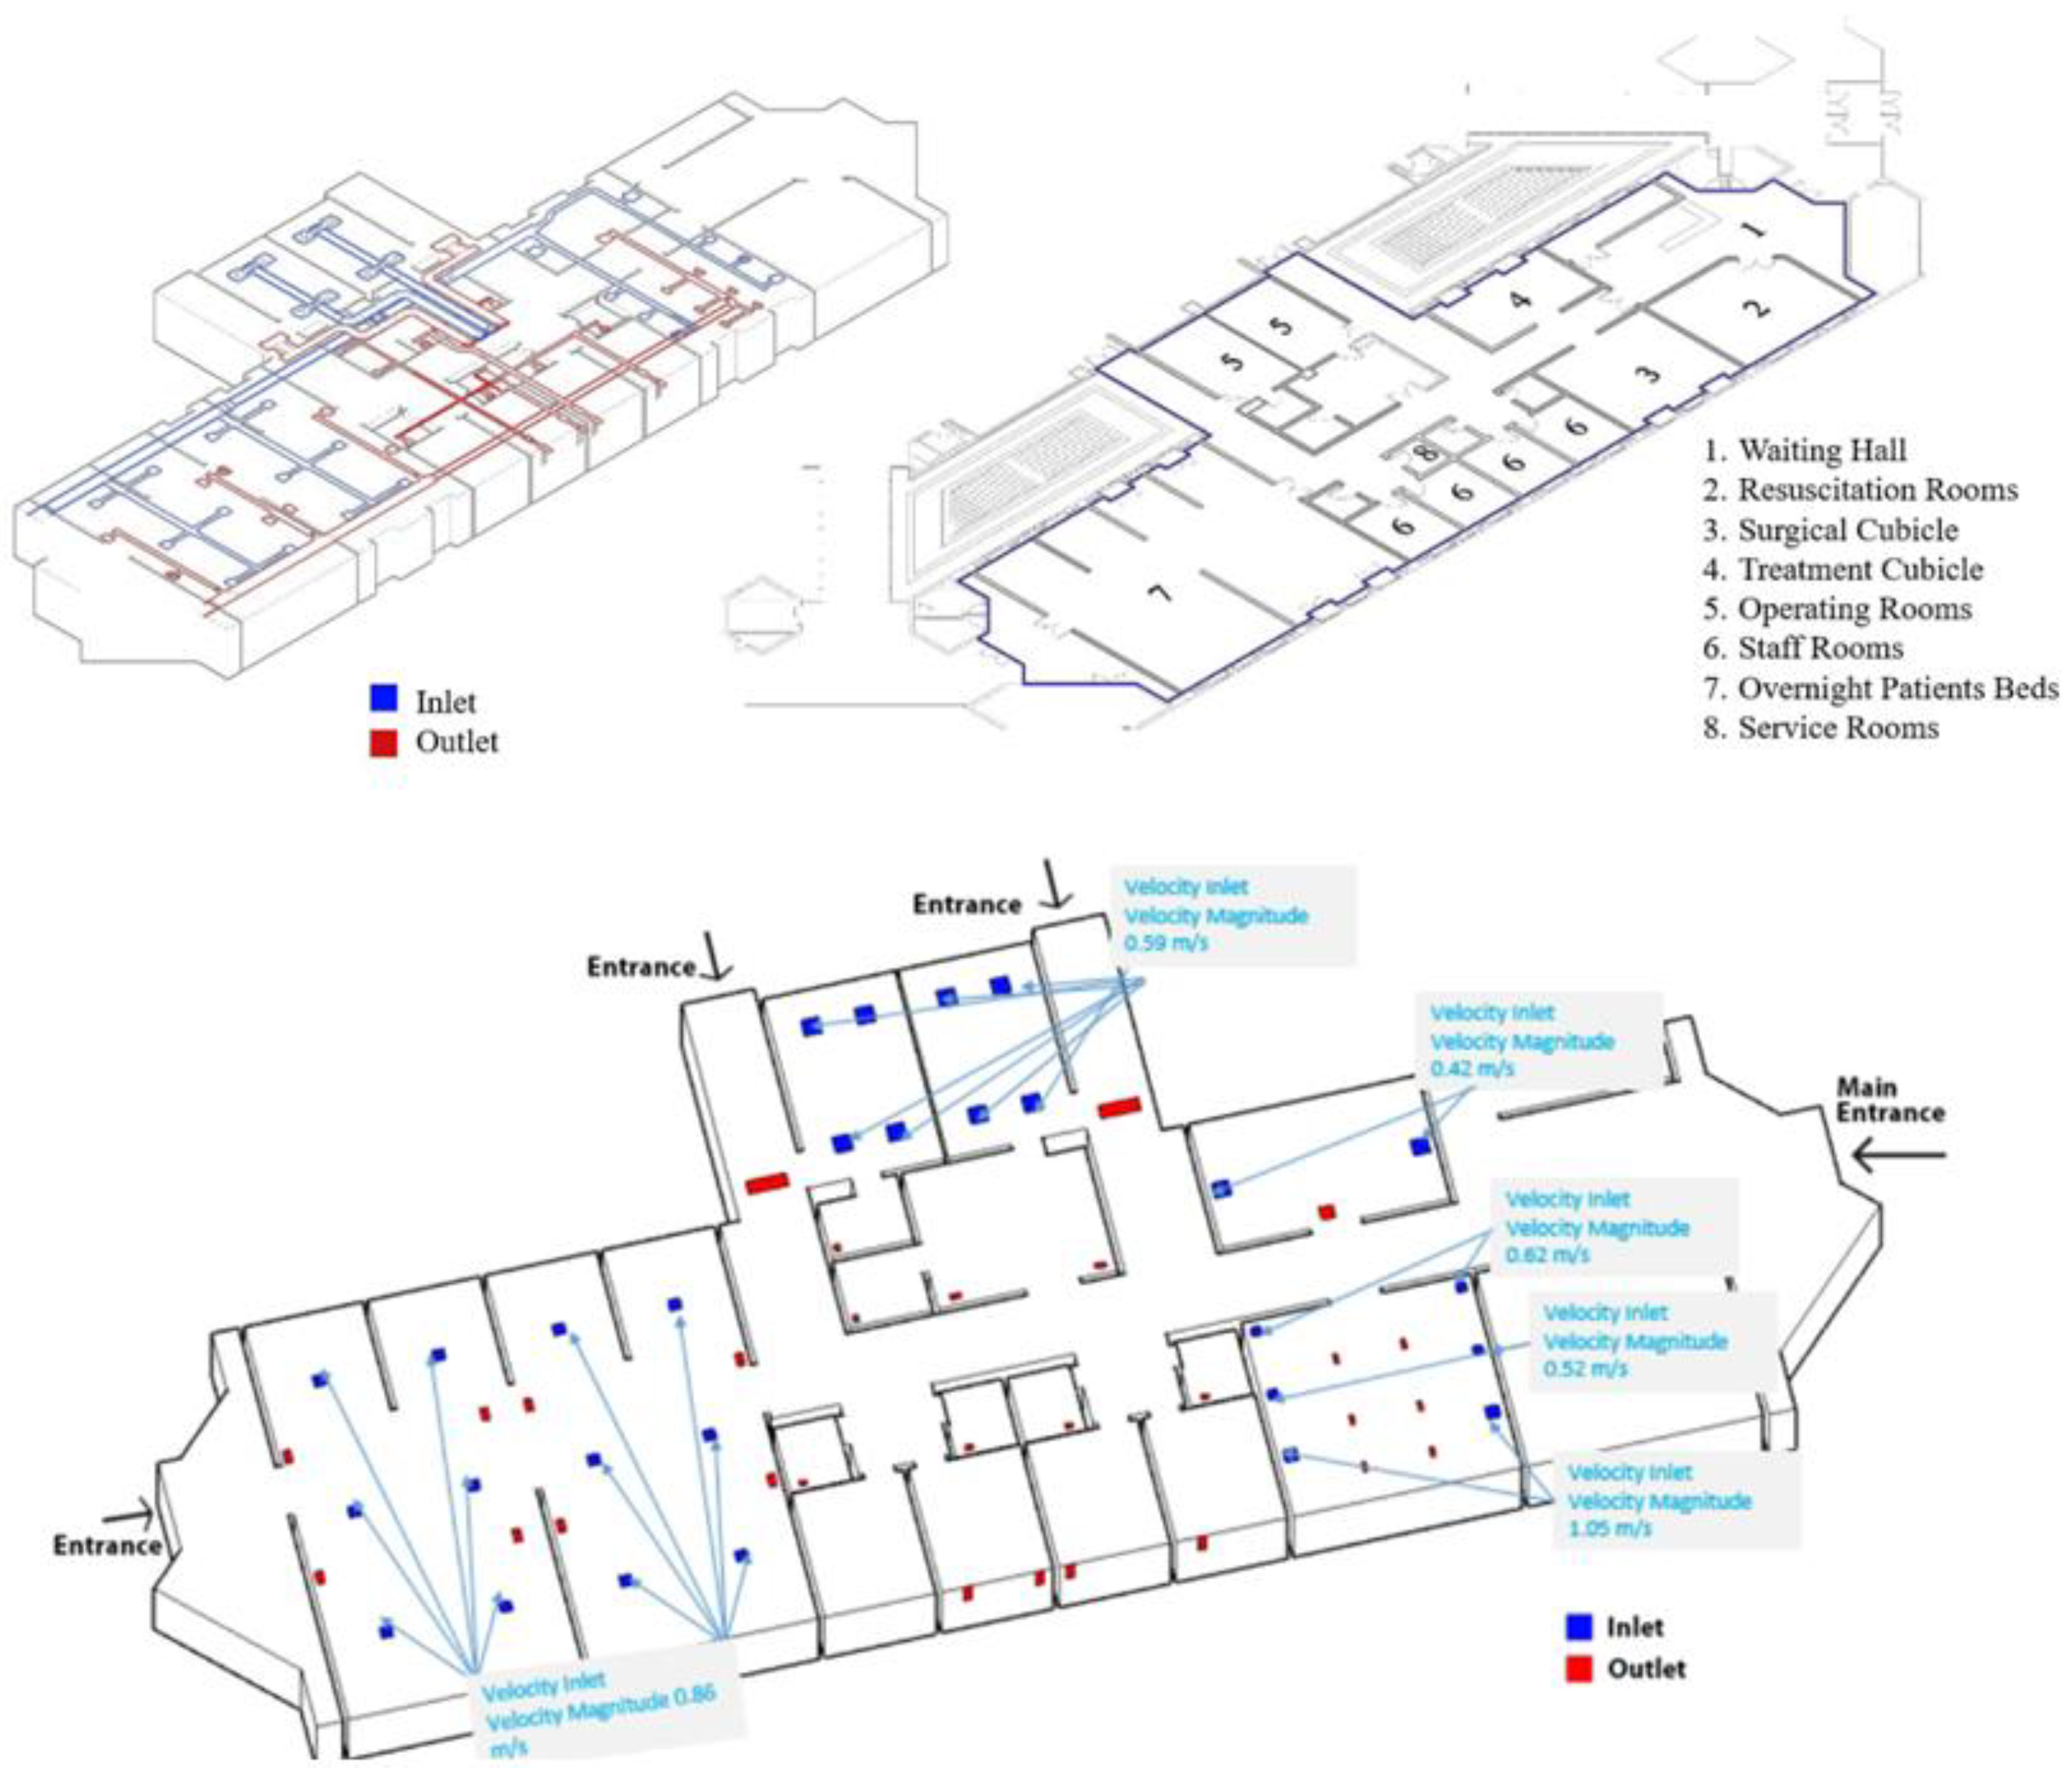
Figure 1 shows the layout and geometry of King Abdullah University Hospital’s (KAUH) emergency department. The department has a total floor space of roughly 740 m2 and a volume of around 2011 m3. A waiting area, resuscitation room, surgical cubicle, treatment cubicle, operating rooms, staff rooms, overnight patients’ beds, and service rooms make up the emergency department. The department is largely ventilated mechanically. Technical drawings from the university’s Engineering Projects Department were used to construct the 3D CAD model of the ED. The grid for the CFD simulation was derived from the fluid (in this example, air) volume obtained from the 2D drawings. The authors referred to the technical plans provided by the hospital and the engineering projects unit at the university and verified the actual data items with the results generated, then used them as setup inputs of the CFD analyses prior to conducting the simulation study. The provided data from the hospital and the engineering projects unit are shown in Figure 1.
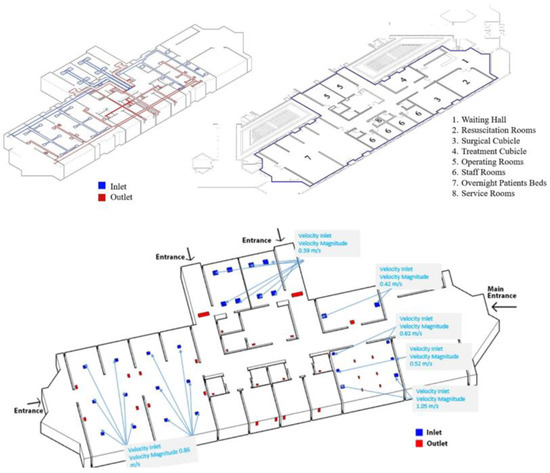
Figure 1.
The geometry and specifications of the emergency department.
As illustrated by the university’s Engineering Projects Department, the HVAC system consists of a series of inlet and output grilles positioned at heights of 2.70 m and 2.40 m in the room’s ceiling. The system operates with a 100% fresh air supply and has a total airflow rate of 11,500 m3/h. The HVAC system was tested in real-world circumstances at temperatures ranging from 24 to 26 degrees Celsius and relative humidity levels of 30 to 60 percent.
2.2. CFD Setup
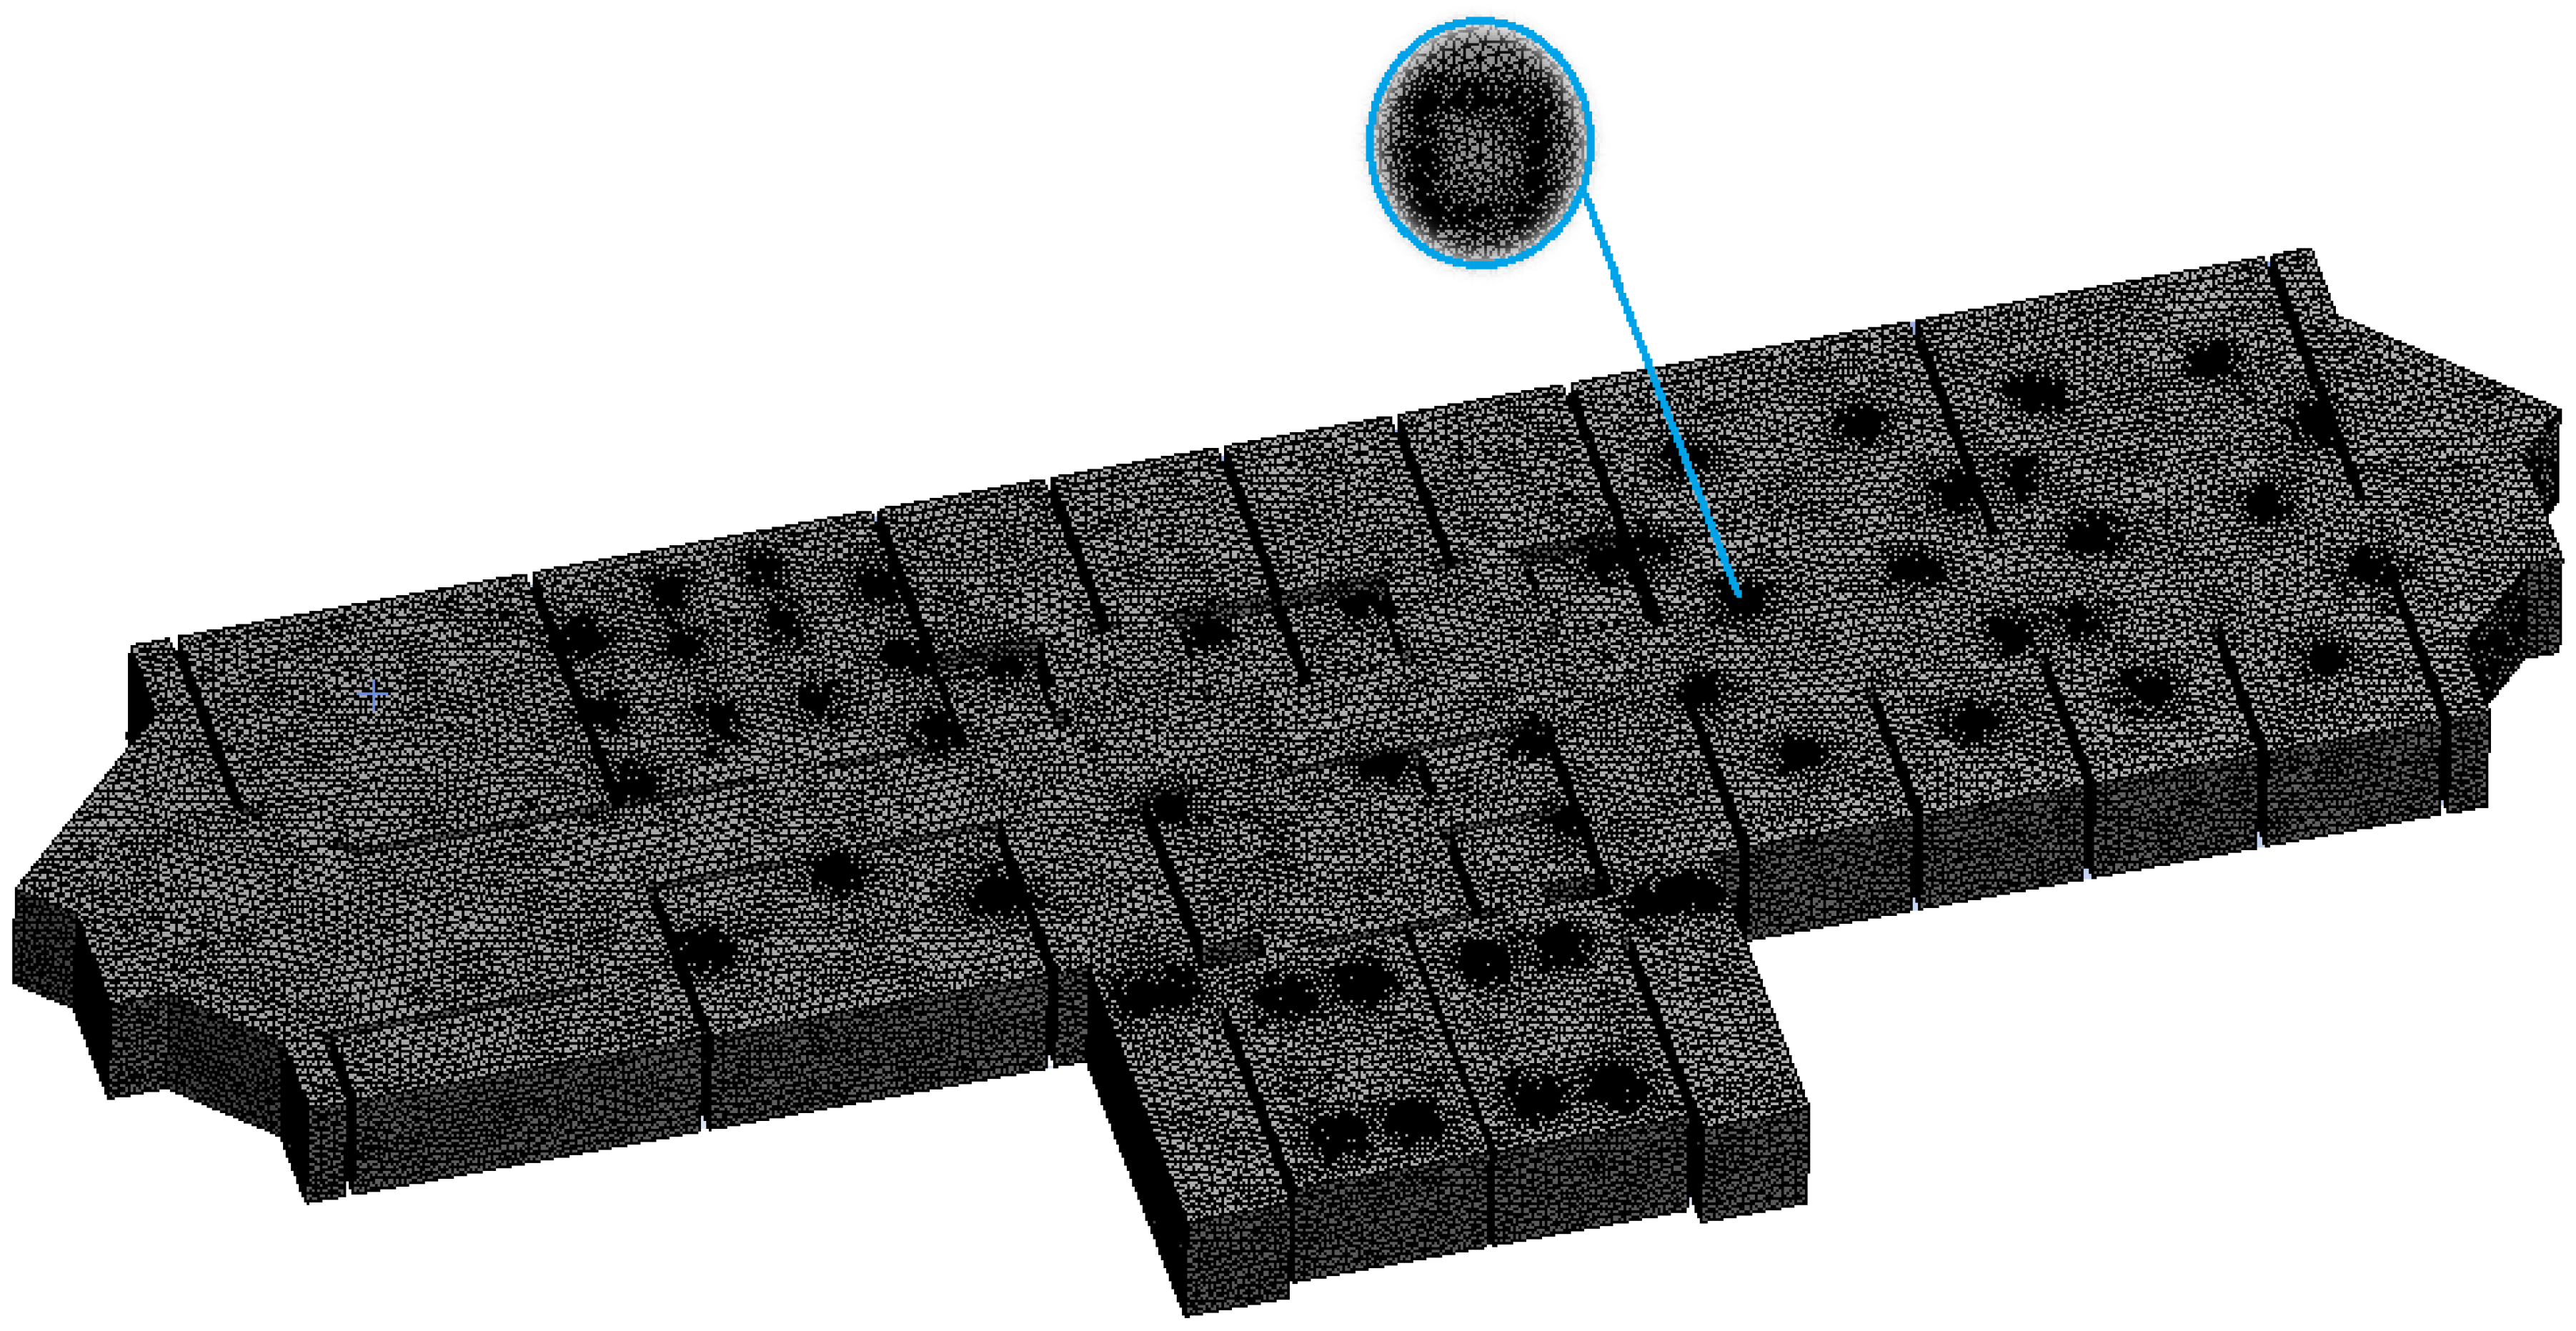
The CFD simulation was performed with the ANSYS 2020 CFX package [26] using a virtual machine with computational capabilities of Processor Intel® Core™i7-7700 CPU @ 3.6 Hz, installed memory: 32 GB, system type: 64-bit operating system. The corresponding computational time was approximately 12 h/case of study. The geometry of the building was modeled and then loaded into ANSYS. The model was created using the Boolean algorithm (i.e., the solid domain is subtracted from the fluid domain). The use of this approach is essentially warranted for aerodynamic or fluid dynamic studies [27]. Thus, it was used in our study. Figure 2 shows how the mesh of the model was created using about 16 × 106 components.

Figure 2.
CFX mesh of the model.
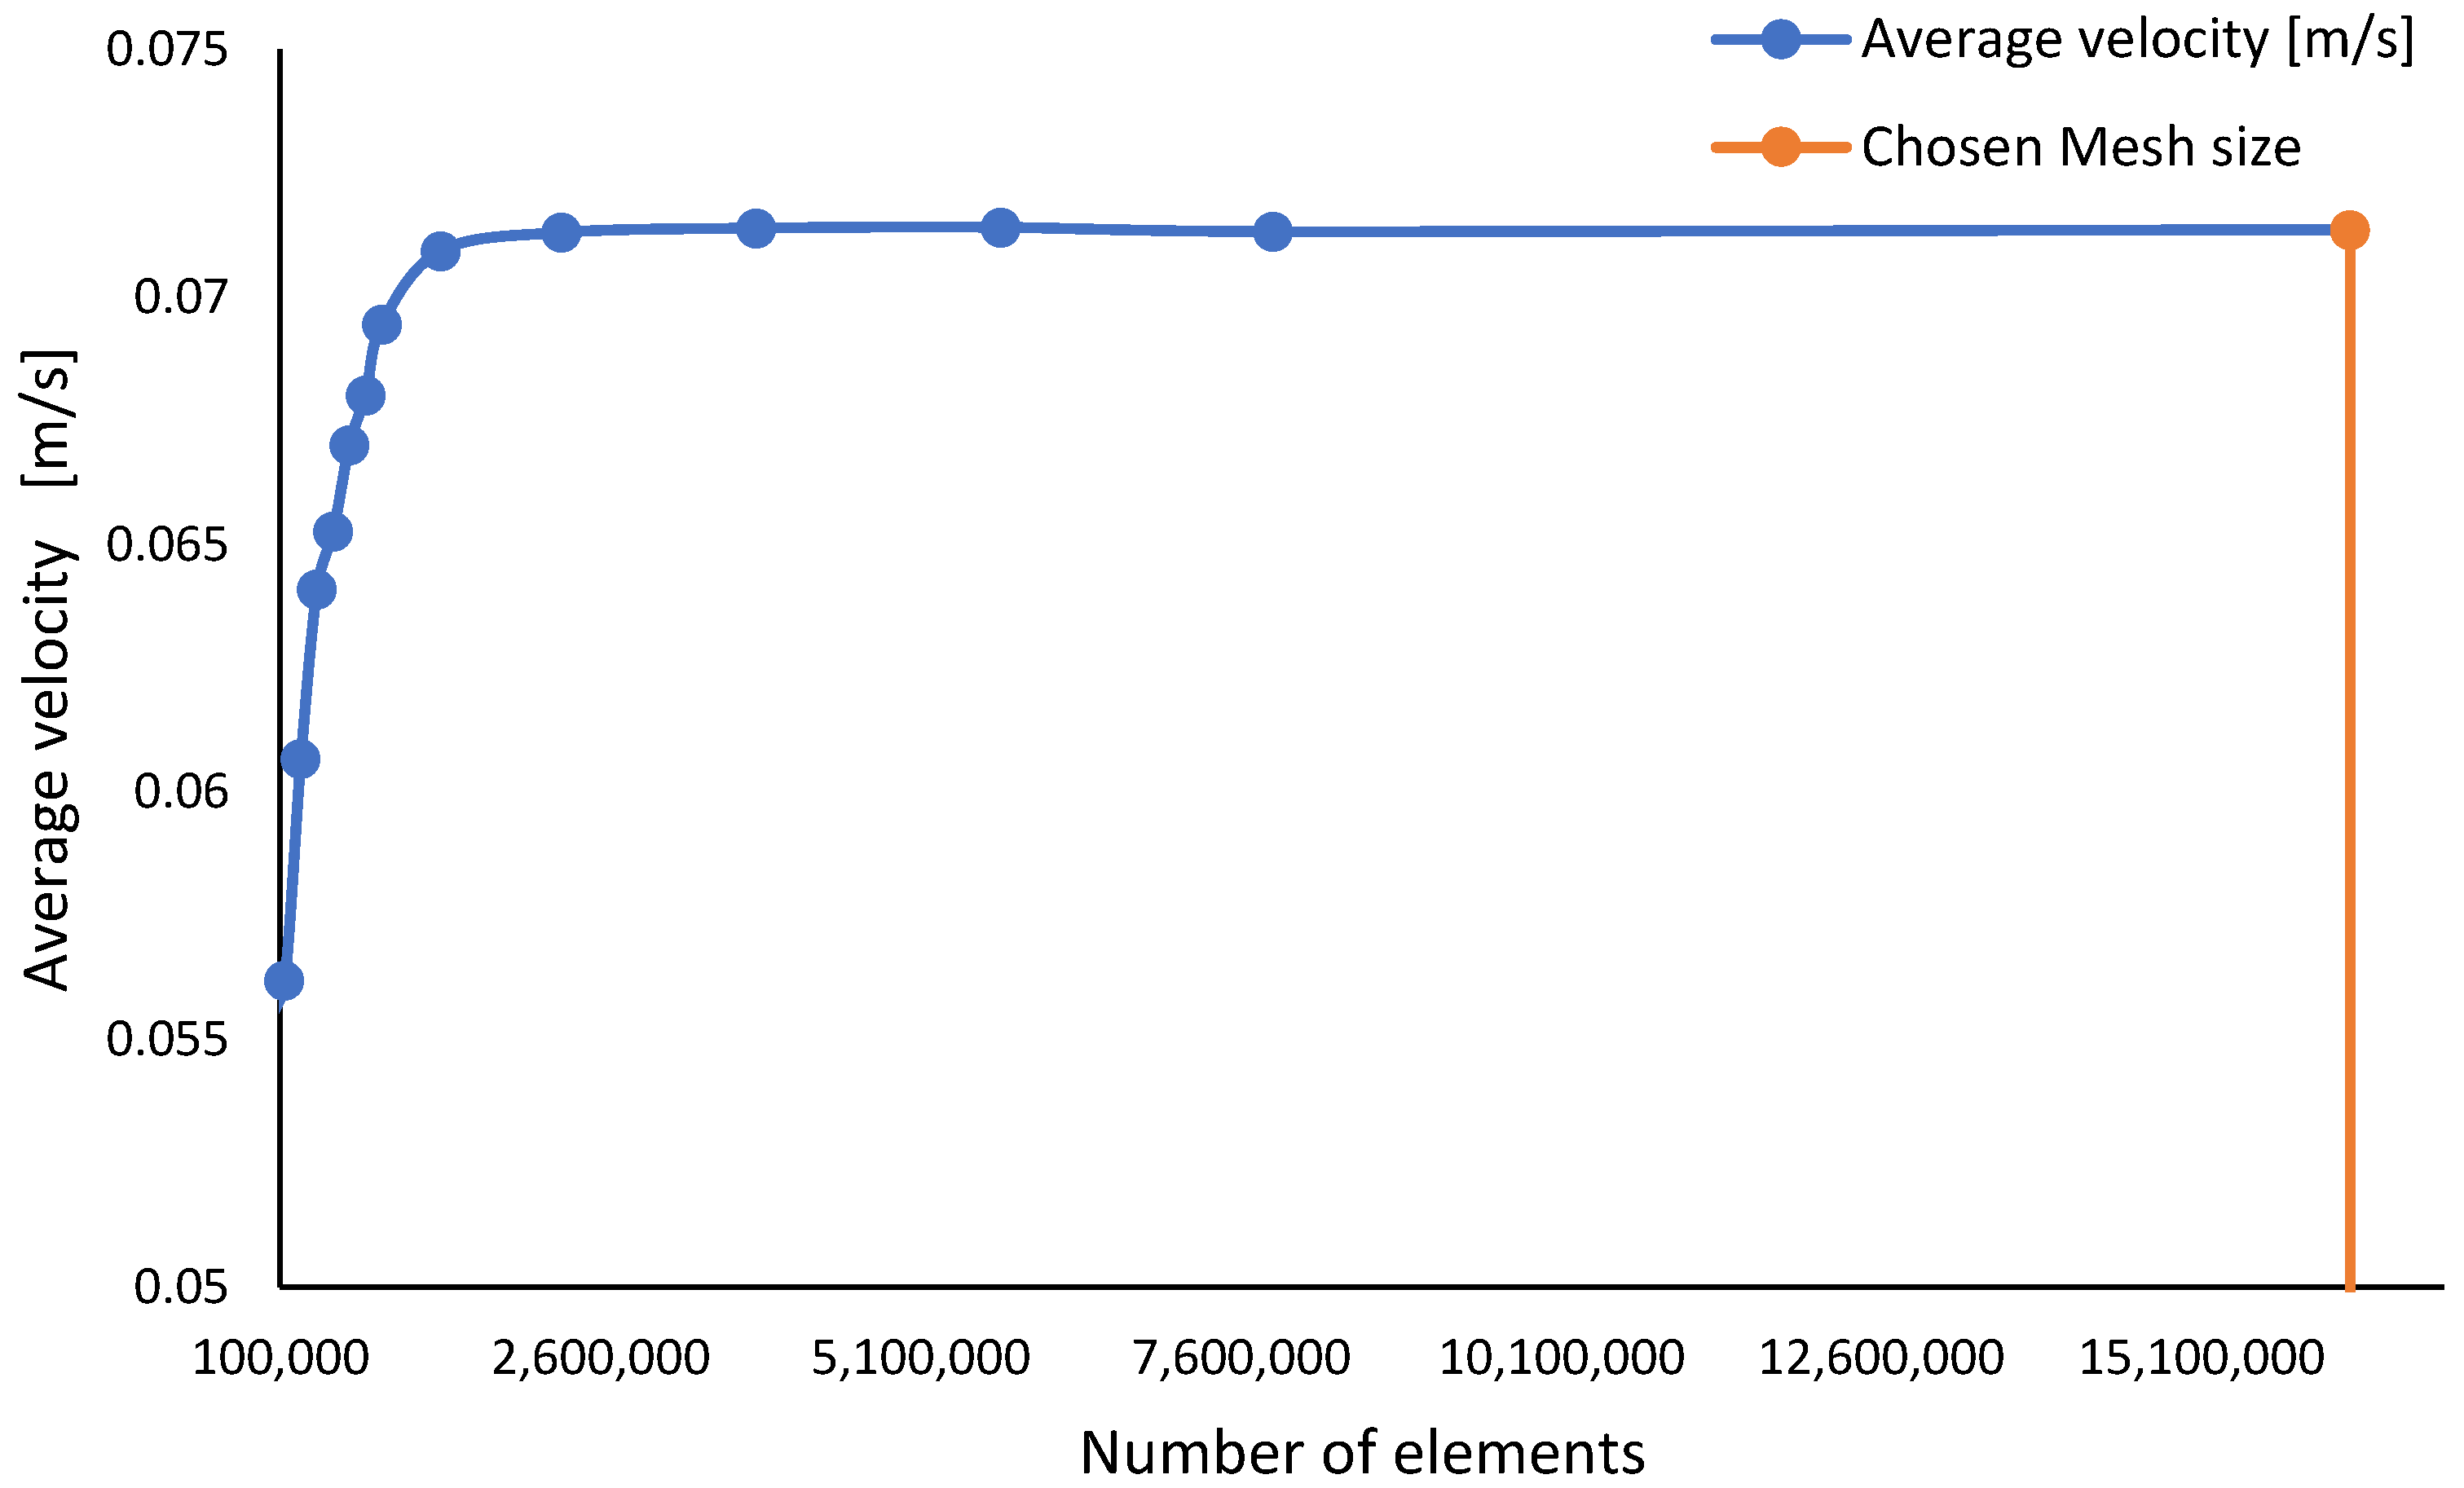
Figure 3 shows how the number of elements was determined following mesh sensitivity analysis to guarantee that the findings were independent of the mesh size. The mesh sensitivity study was carried out using average velocity across a plane with an offset of 1.7 m from the floor, which is around the height of an average person in the Middle East region [28]. At around elements, the findings become indifferent to mesh size, as seen in Figure 3. As a consequence, any mesh size larger than is justified in order to ensure that the findings are independent of the mesh size. A mesh size of elements was used for the simulation to give a better level of confidence.
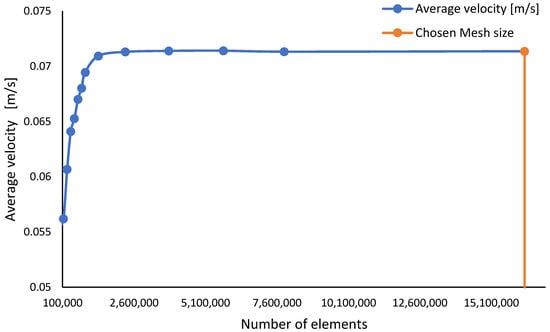
Figure 3.
Mesh sensitivity analyses with respect to the average velocity at 1.7 m offset.
Furthermore, the mesh quality (Table 1) is consistent with previous findings in similar studies [29,30,31,32]. The mesh was then exported to the CFX-PRE to specify the needed configuration, which corresponded to the study’s scenario.

Table 1.
Mesh properties.
The k-Epsilon model was used to designate the analysis type as steady state. The fluid domain was chosen from the ANSYS models library as ‘Air at 25 °C.’ The model’s solid domains were designated as ‘No Slip Walls.’ It should be noted that the goal of this study is to examine the worst-case scenario of COVID-19 dissemination, which, according to the World Health Organization (WHO), is fundamentally more severe in confined regions [8]. As a result, this simulation was run with the assumption that closed entrances were defined as ‘No Slip Walls’.
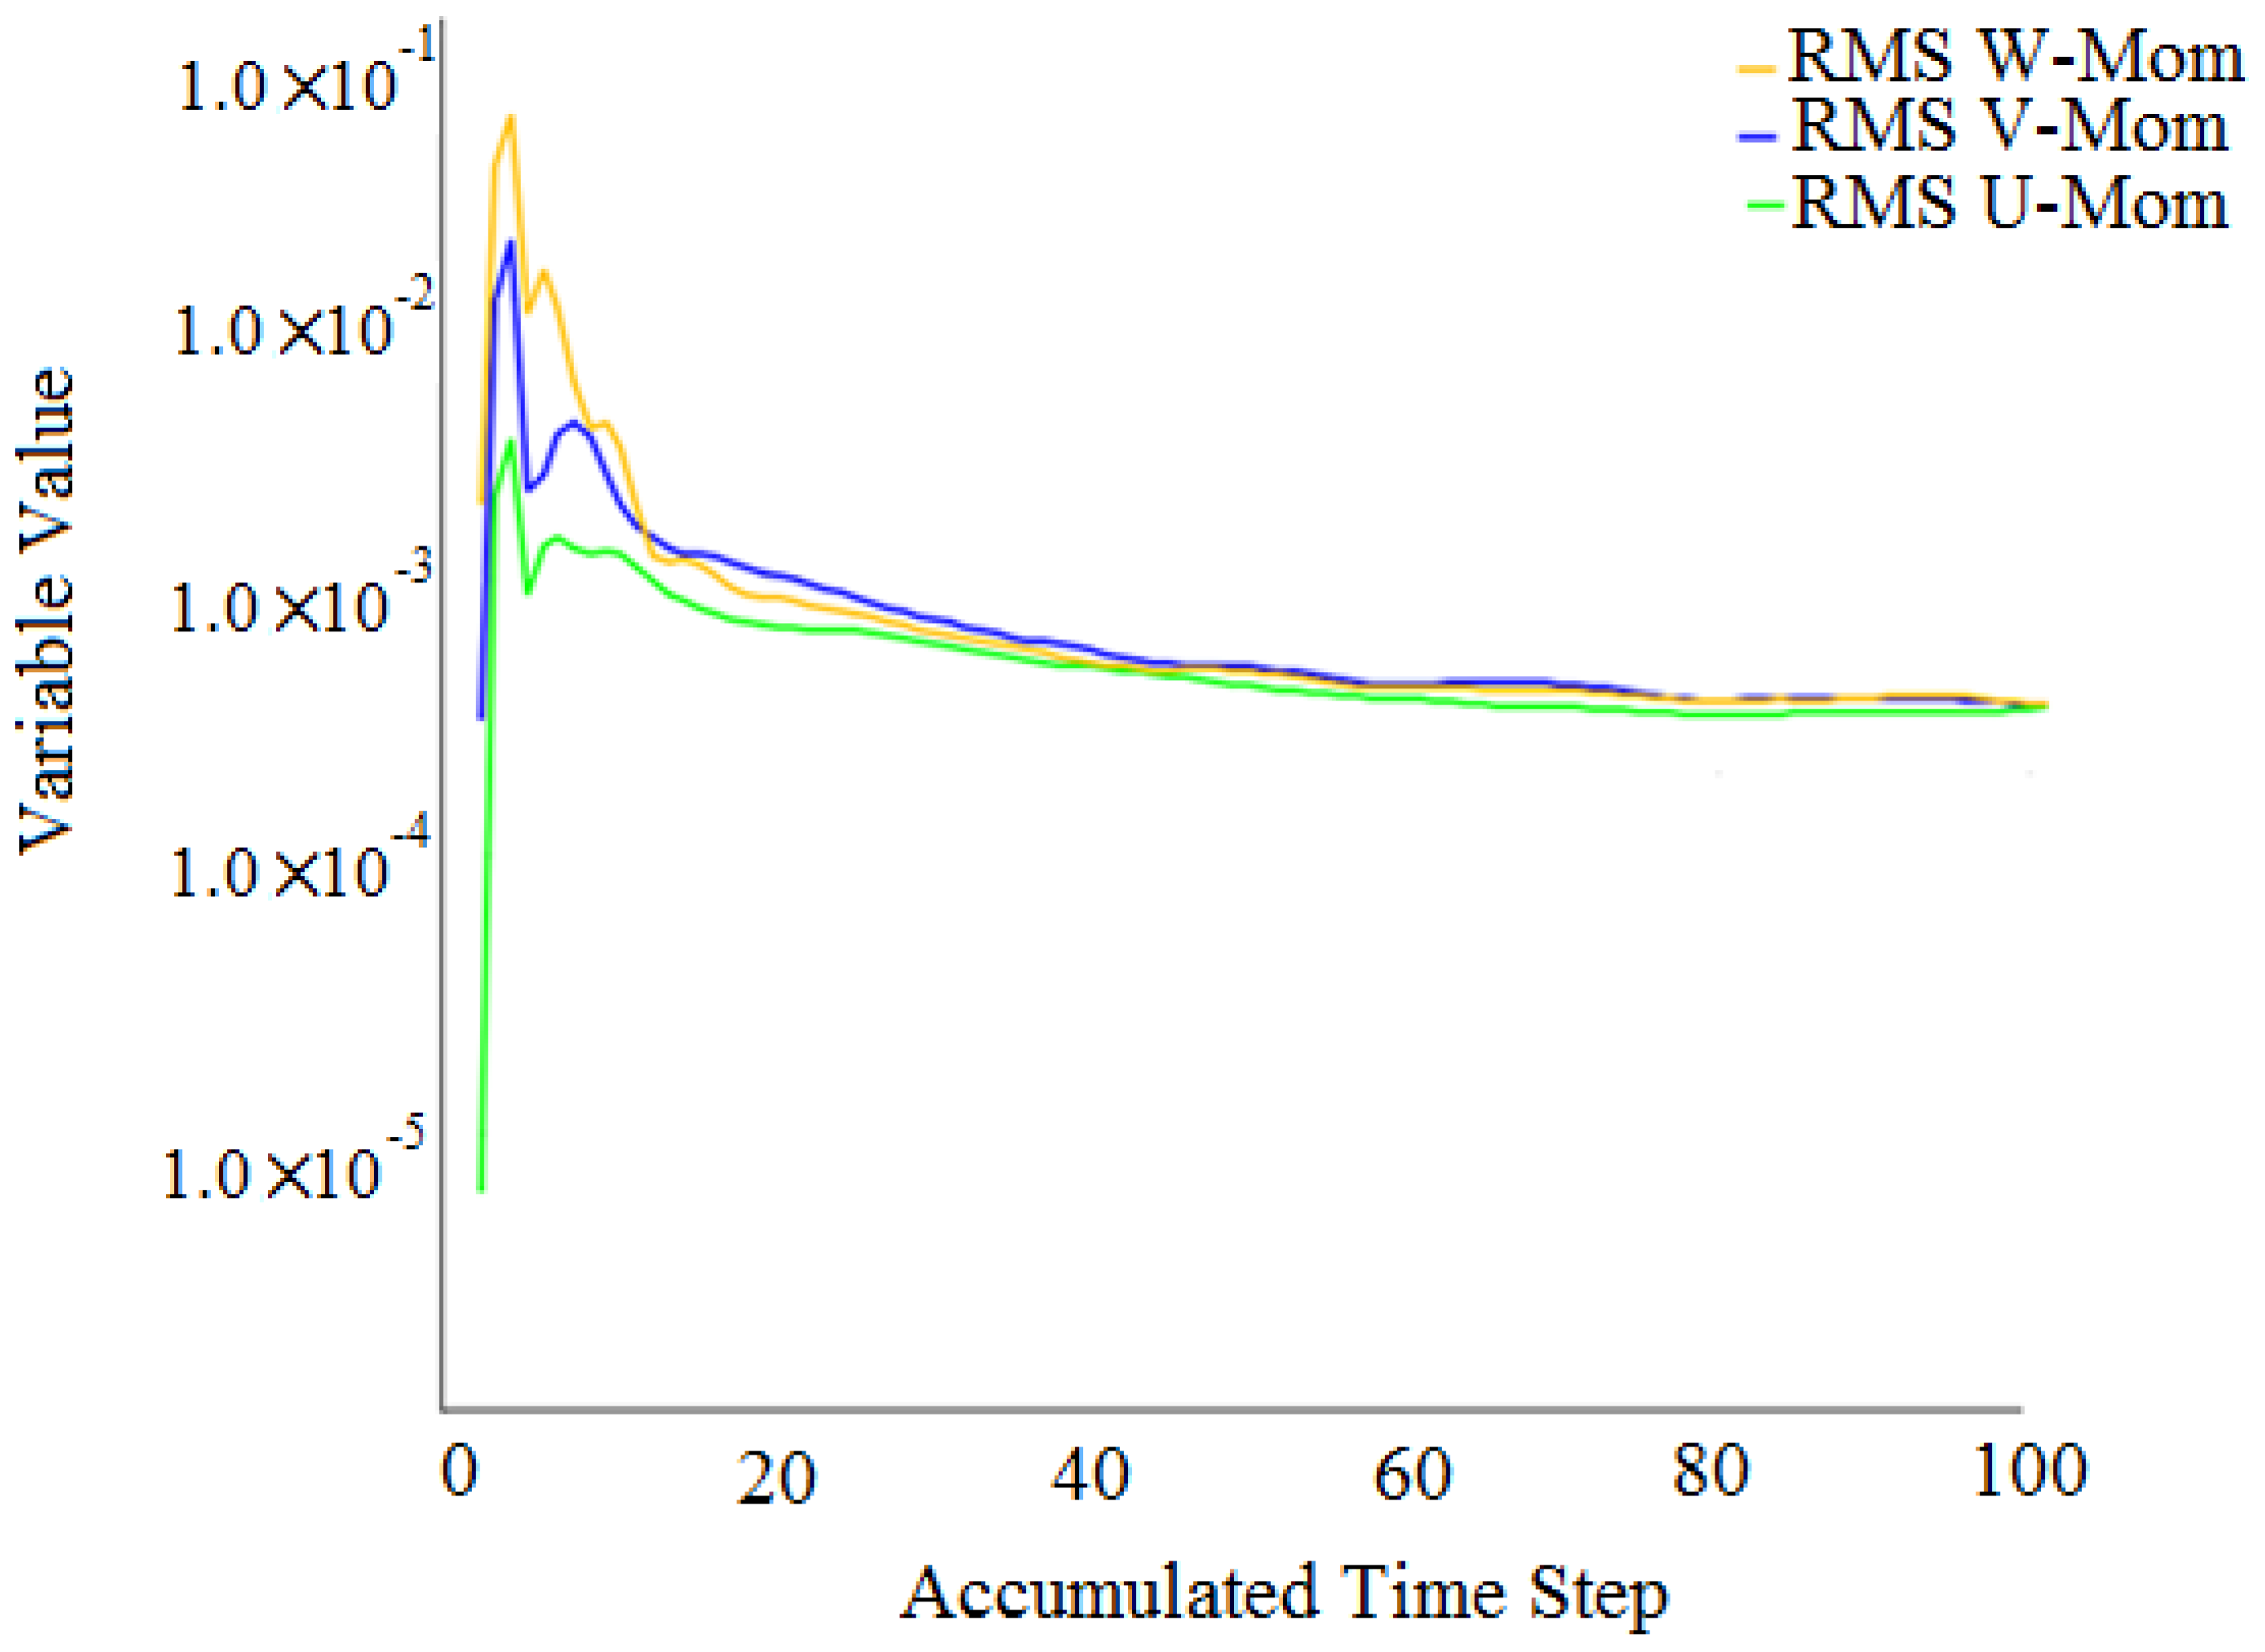
Finally, all of the inlet boundary conditions were set to velocity inlets with a turbulence intensity of 5% by default. The outlet boundary conditions, on the other hand, were all set to pressure outlets of 0.85 bar, which corresponds to the suction condition. As shown in Figure 4, the model converged with residual targets of .

Figure 4.
Convergence results.
The turbulence kinetic energy (k) was used to define the flow mixing level, according to the literature [33,34,35]. The turbulence kinetic energy (k) was chosen as a determinate parameter for this work since the degree of COVID-19 spread is strongly reliant on the level of flow mixing. Equations (1)–(4) [33,34,35] were used to plot the turbulence kinetic energy (k) in ANSYS CFX.
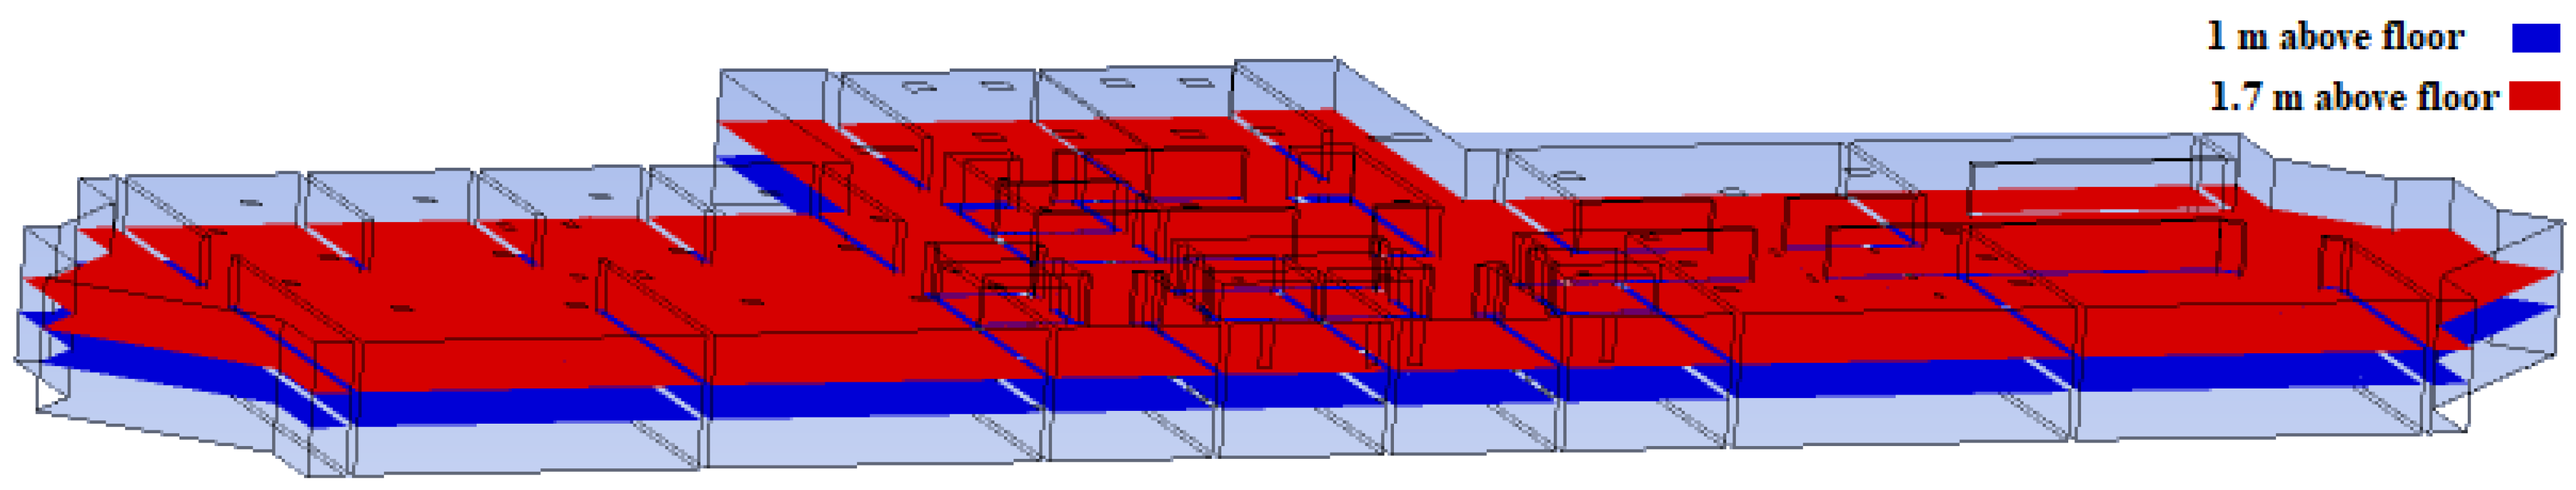
The results are displayed as 3D streamlines for the full fluid domain. In addition, as shown in Figure 5, data are displayed on two distinct planes: the first is at 1.7 m above the floor (i.e., the height of an average person in the Middle East region [28]). The second is a the height of 1 m above the ground, which is about the same as the height of medical benches.

Figure 5.
Results planes at 1 m and 1.7 m.
3. Results
3.1. Velocity Profiles
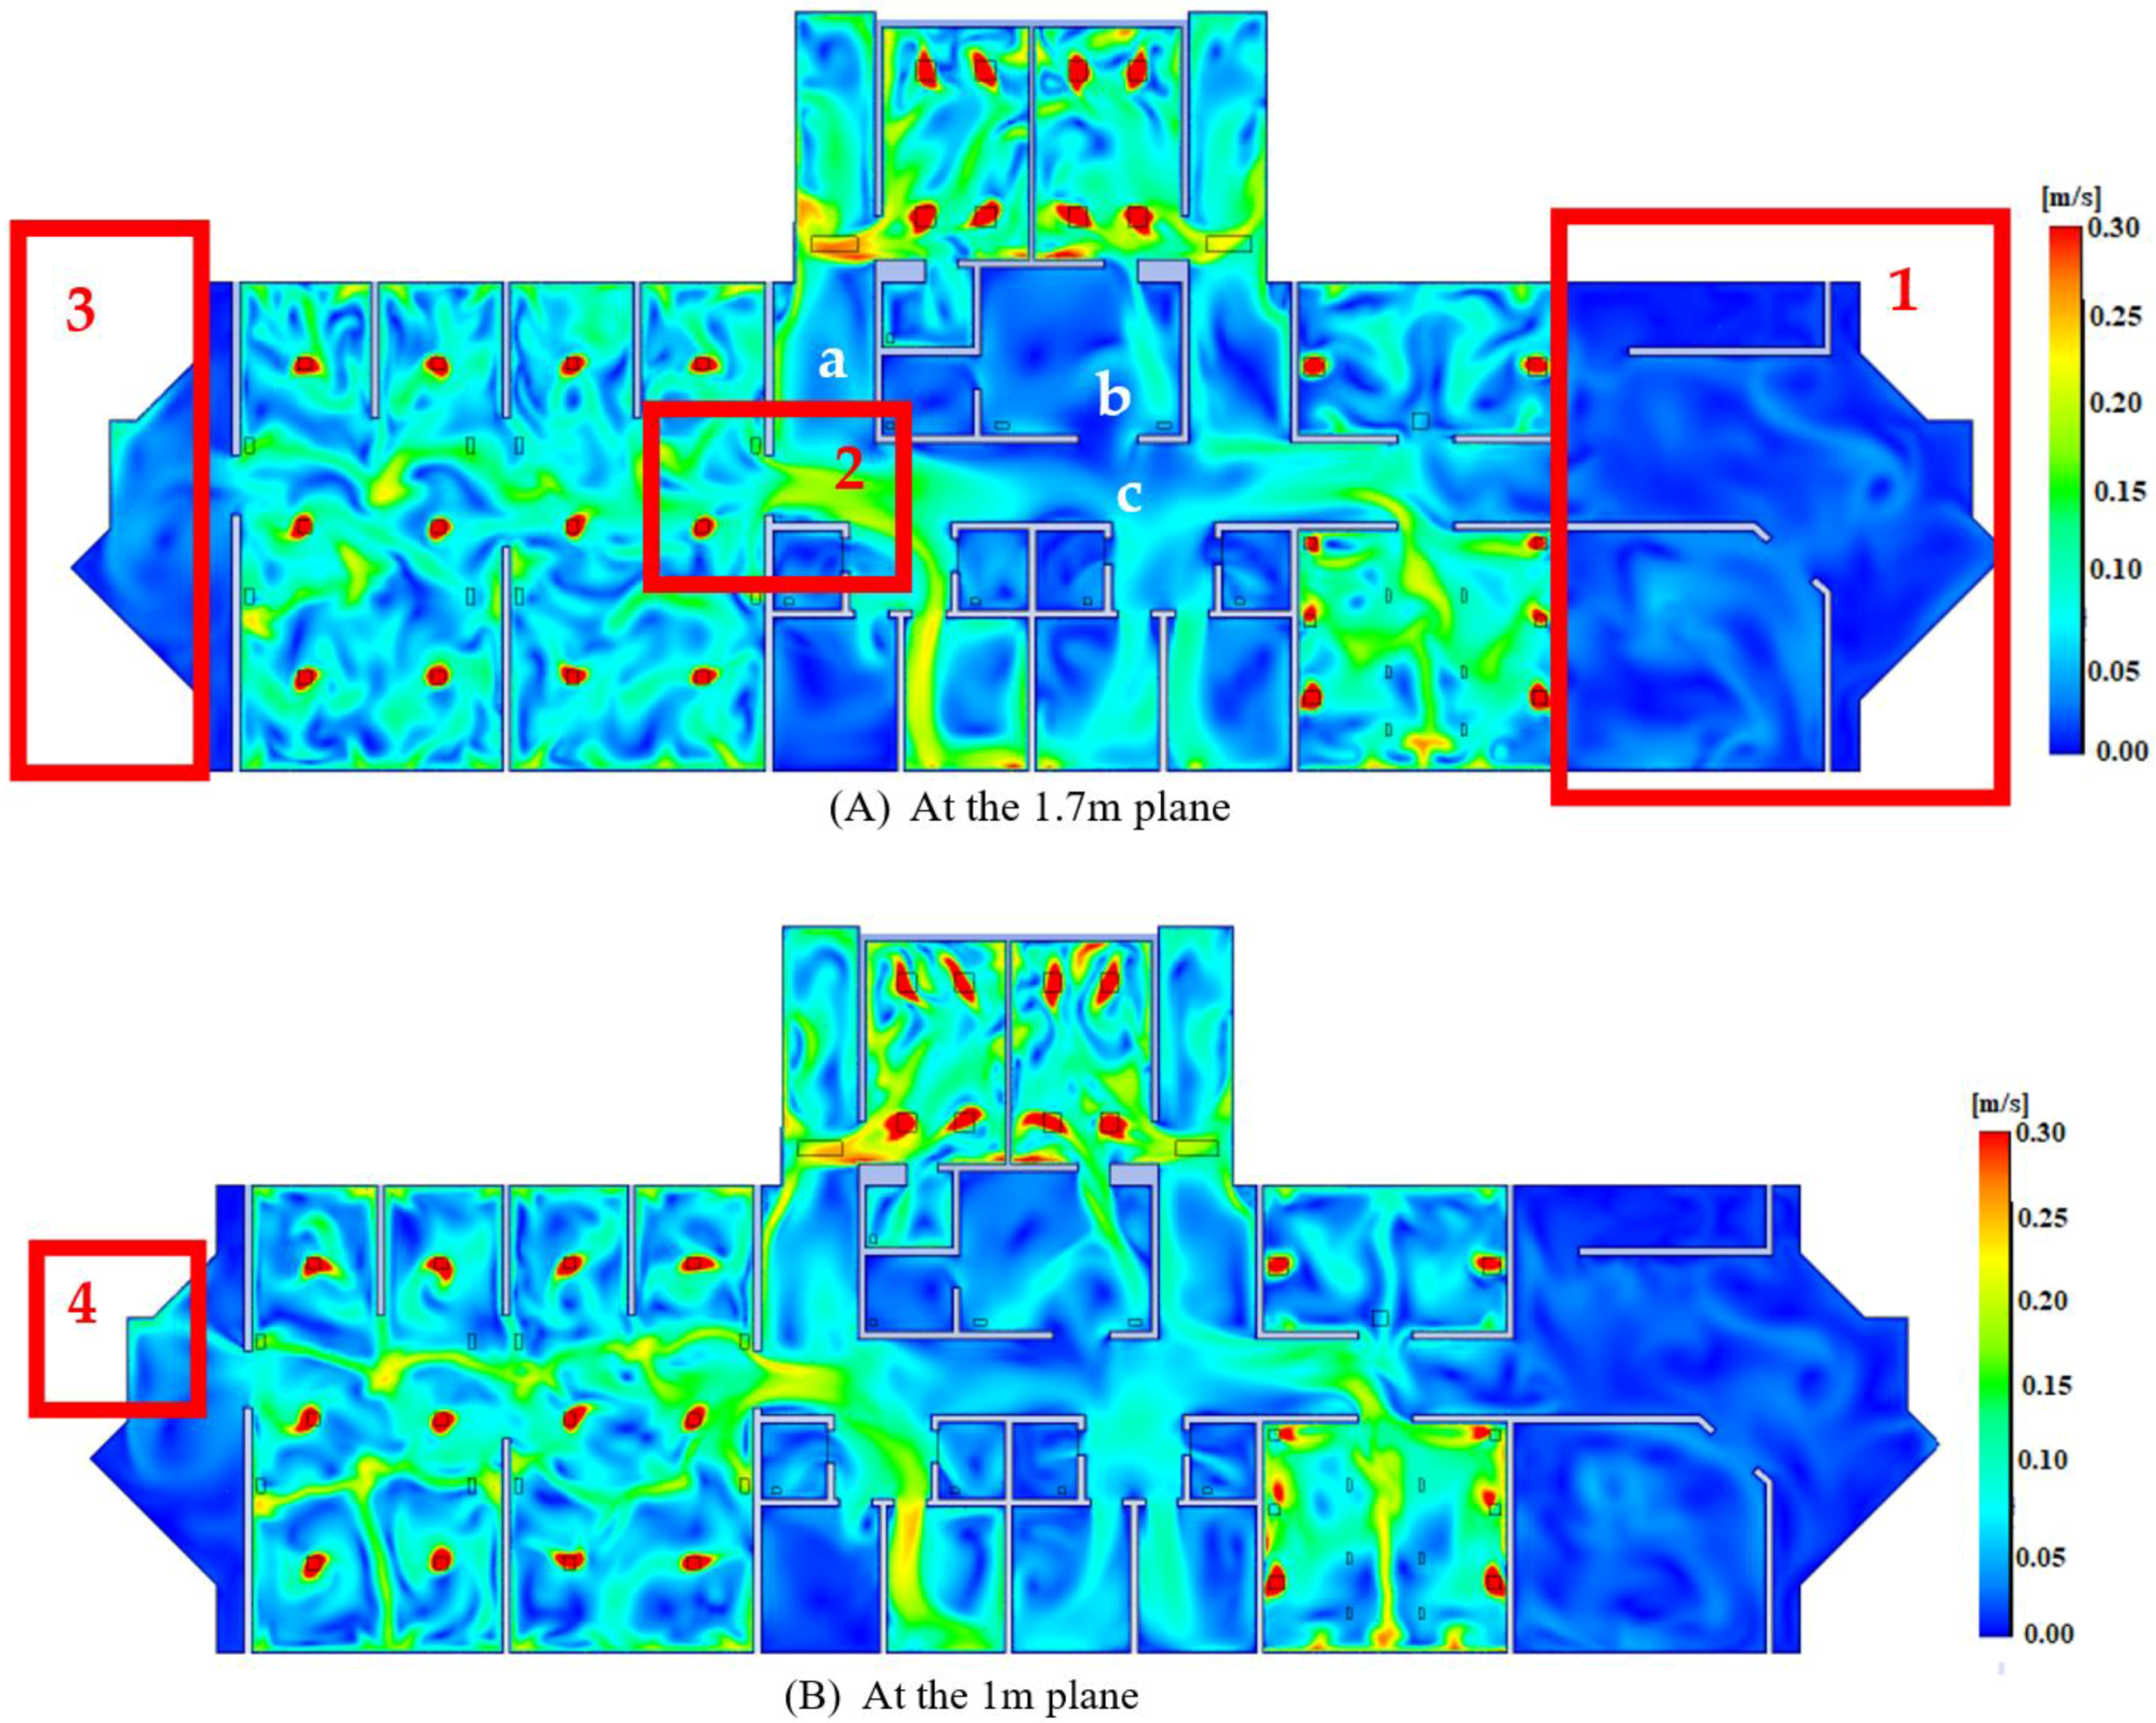
Figure 6 depicts the velocity profiles in both planes (1.7 m and 1 m above floor). The velocity magnitude at 1.7 m above the floor, as shown in Figure 6A, is roughly within the range of 0.1–0.25 m/s. However, at both entrances (Region 1 and Region 3), velocities are kept to a minimum, negating the effect of the velocity component in boosting COVID-19 distribution in those areas. It should also be noted that the flow through the aisles (a, b and c) did not gain significant additional kinetic energies () from the primary sections of the building (i.e., patient section, physician section, and operating section) because the velocities in those aisles maintained a fairly consistent profile and were not influenced by velocity profiles in the primary section. In Region 2, however, the same cannot be said for the aisle. The velocity streamlines from the patients’ portion to the physician section impacted the kinetic energy in this area. As kinetic energy is defined as the capacity of particles to travel from one location to another, the spread of COVID-19 in this region is more likely to occur. The low expectation for airflow being transmitted from one area to another (i.e., patient section, physician section) is the reason for identifying this location, which might enhance the danger of COVID-19 transmission.
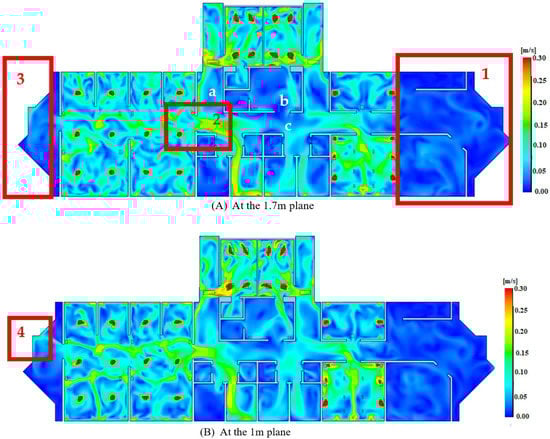
Figure 6.
Velocity profiles.
The velocity profile of the 1 m plane roughly followed the same pattern as the 1.7 m plane, as illustrated in Figure 6B. However, when comparing Region 4 of the 1 m plane to Region 3 of the 1.7 m plane, it can be observed that the velocity has increased somewhat as a result of the effect of the patients’ section. However, because this plane (1 m above the floor) corresponds to the height of medical benches (i.e., patients’ breathing level) or the height of children, any minor increase in velocity at this height could be potentially critical; thus, it is preferable to keep velocities at a minimum to reduce the airflow’s kinetic energy, which reduces airborne droplet dispersion.
3.2. Turbulence Kinetic Energy Profiles
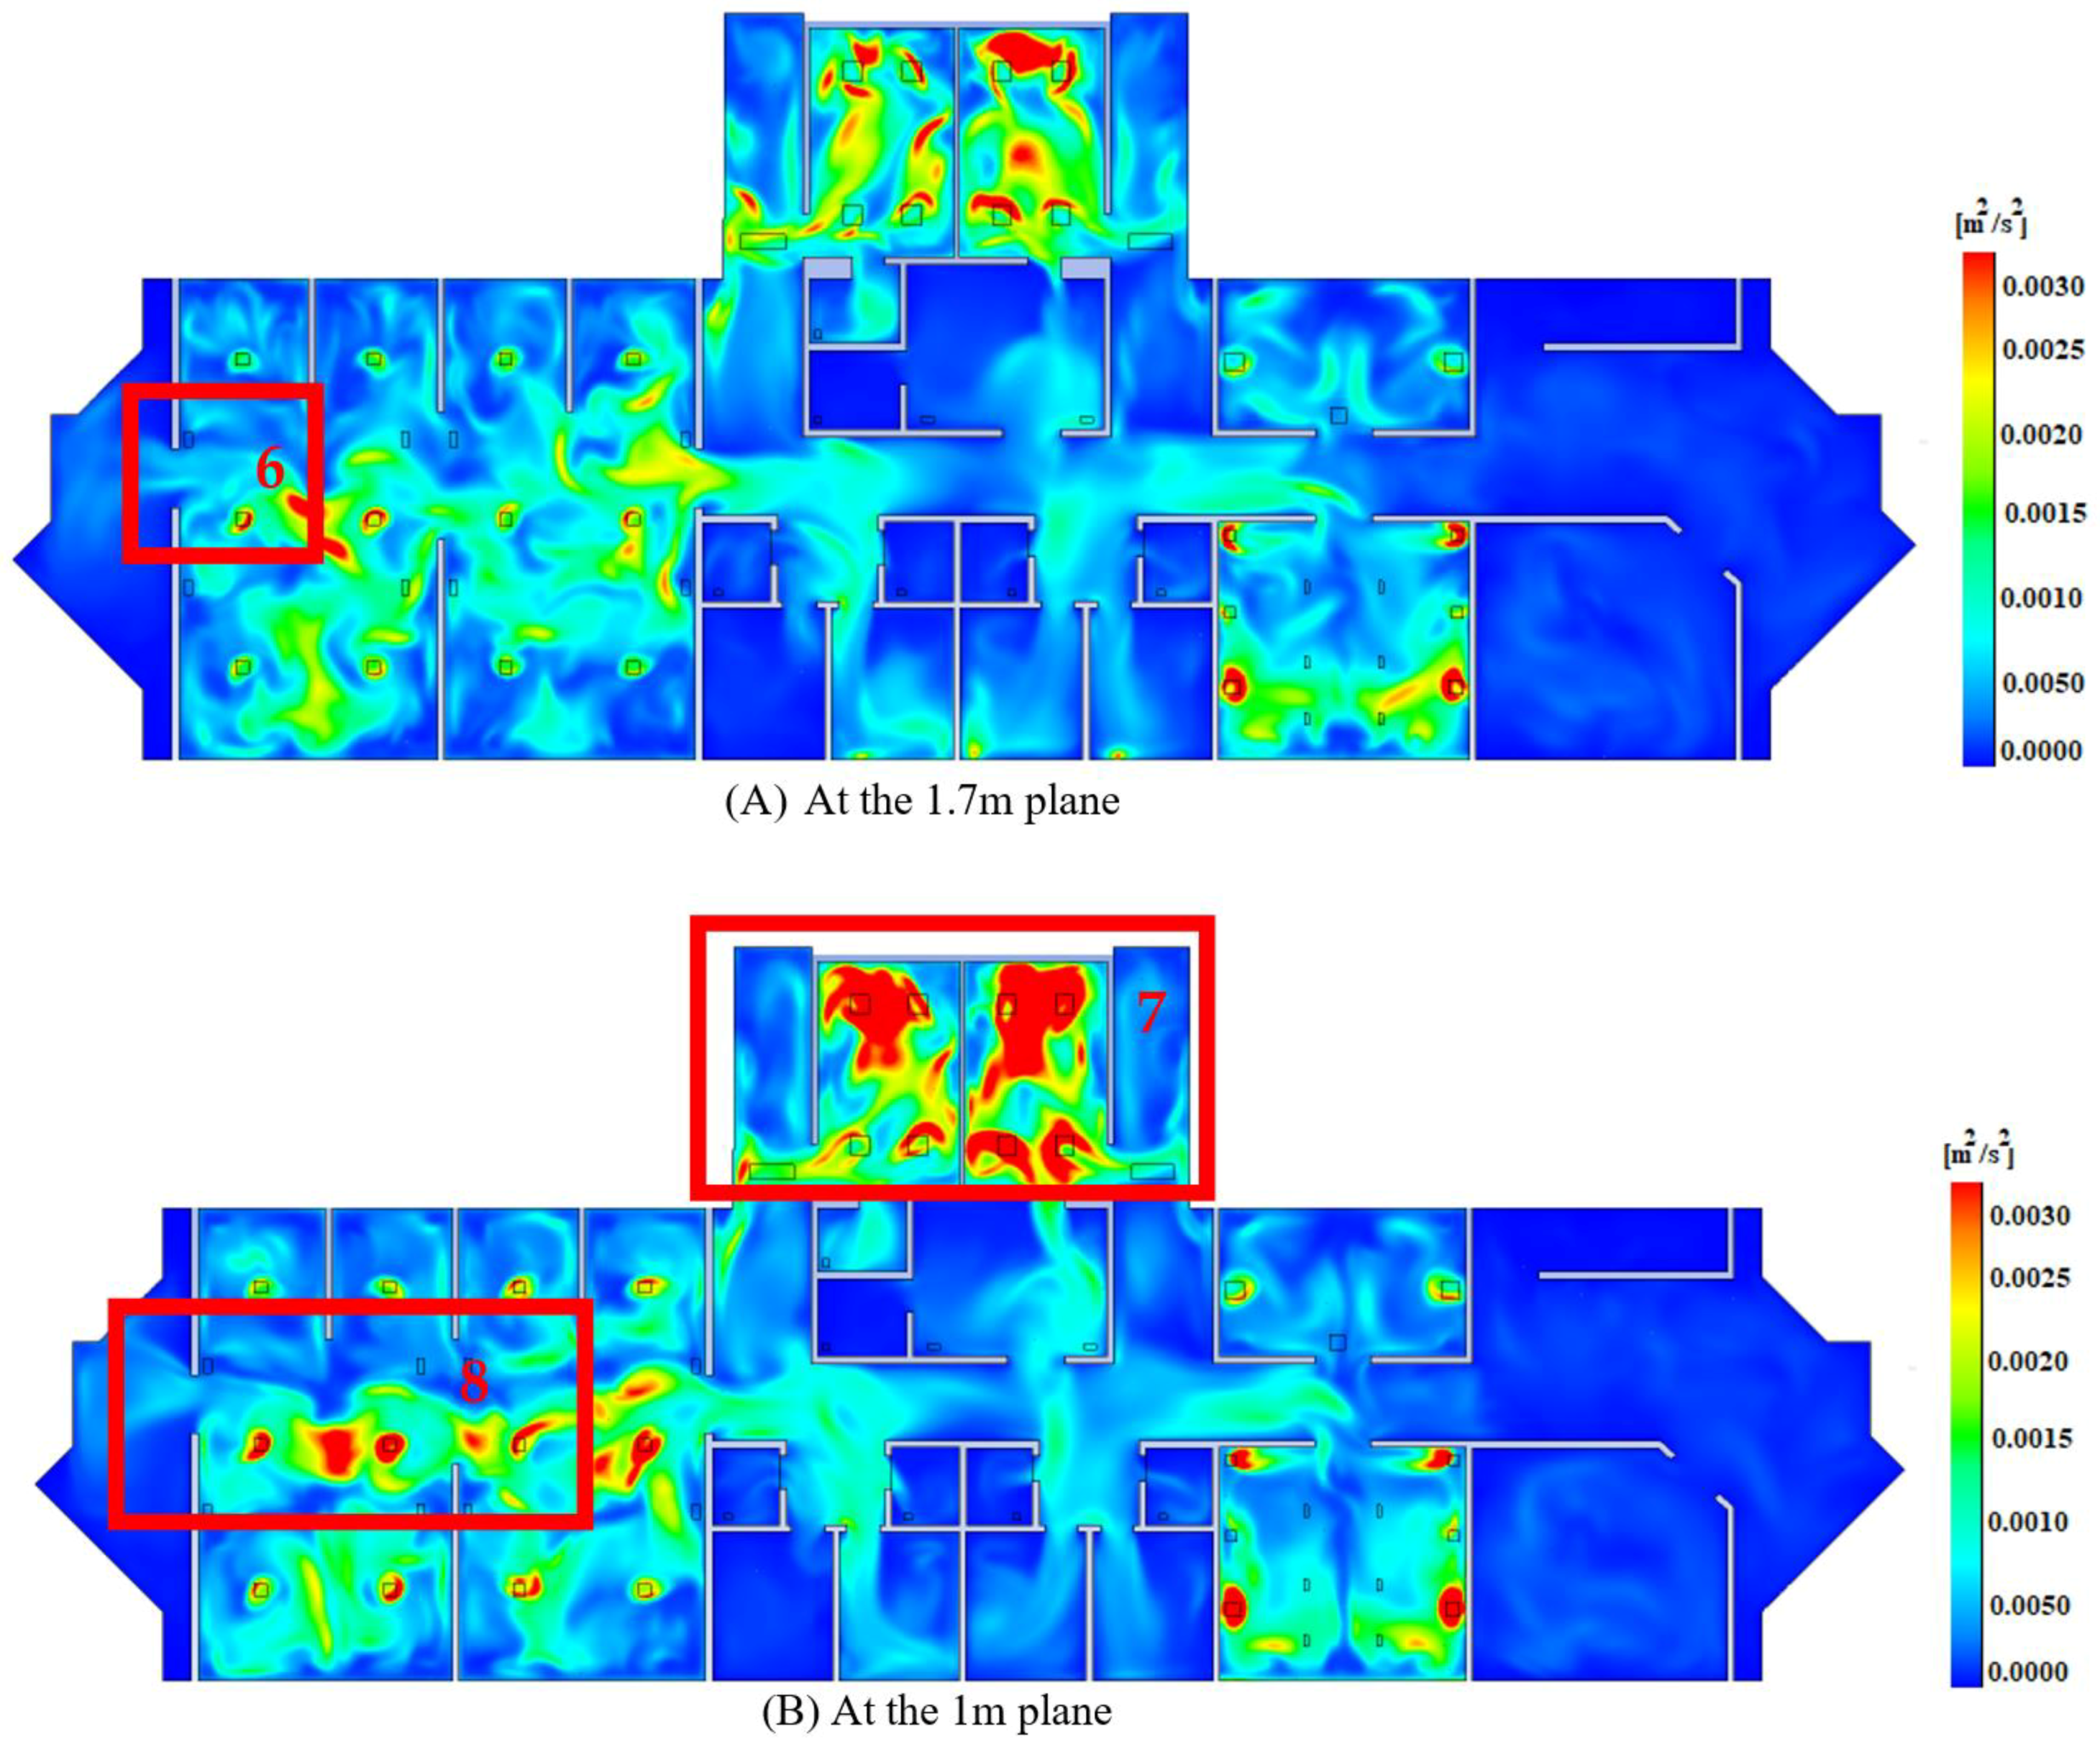
The relevance of displaying the turbulence kinetic energy emerges in emphasizing the zone with high dispersion and mixing levels, which correlate to the locations where COVID-19 is more likely to spread than other regions, as mentioned in Section 1. As shown in Figure 7, in comparison to other parts, the operation and patient sections have larger flow dispersion and mixing levels in Regions 5, 6, 7 and 8. However, it is worth noting that the dispersion and mixing profiles (i.e., turbulence kinetic energy profiles) are confined inside each section rather than being transmitted from one to the next, limiting the risk of COVID-19 spread. It is worth noting that the areas with relatively high turbulence kinetic energy profiles at the 1 m level (Regions 7 and 8) are larger than those at 1.7 m (Regions 5 and 6), indicating a higher chance of flow dispersion at the height of medical benches (i.e., patients’ breathing level). This also indicates that COVID-19 transmission is more frequent among patients lying down than among standing employees in the patients’ section. Walking employees, on the other hand, are exposed to a higher amount of danger in Regions 7 and 8 since they correspond to an aisle.

Figure 7.
Turbulence kinetic energy profiles.
3.3. Airflow Streamlines
The value of showing velocity streamlines is that it allows you to precisely identify the sources (flow inlets) and destinations (flow outlets) of air particles, illustrating how airflow may be transported from one region to another. It also determines whether airflow exits the building at its designated outlet (within the same section) or is pushed to exit through other outlets (at different sections), therefore improving flow transmission between sections. The velocity streamlines from the velocity inlets of 1.05 m/s, 0.62 m/s, 0.59 m/s, 0.52 m/s and 0.42 m/s are shown in Figure 8B,D–G, respectively. The airflow from the inlets, in general, exits the structure through its allocated outlets (i.e., within the same section as the inlet). At the same time, just a small quantity of air escapes at low velocities (about 0.05–0.001 m/s) to other regions. As a result, the velocity levels at those inlets (0.62 m/s, 0.59 m/s, 0.52 m/s and 0.42 m/s) could be regarded as well balanced with their prescribed suction levels.
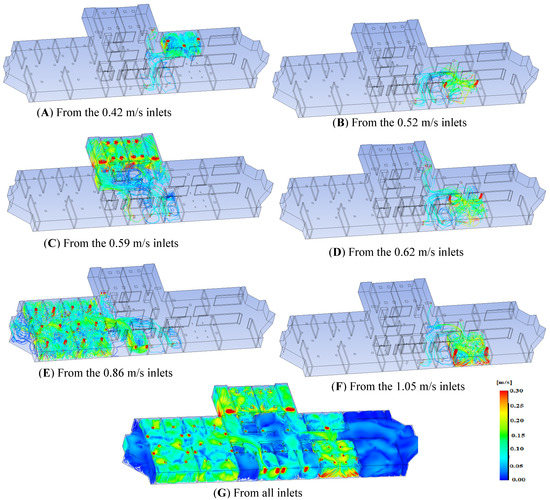
Figure 8.
Velocity streamlines from all inlets.
On the other hand, the suction level in the patients’ section (Figure 8C) is less than adequate in comparison to the rest of the structure. As a result, the flow is forced to exit through other channels (i.e., through the physician section). As a result, compared to other sections, there is a chance of transferring COVID-19 from the patients’ section to the physicians’ section. As a result, it is advised that the suction level in the physician section is reduced while the suction level in the patients’ area is increased. Alternatively, while keeping an adequate degree of air conditioning (cooling/heating), the airflow rates in the patients’ section should be decreased.
3.4. Velocity and Turbulence Results at Two Different Suction Levels (0.85 and 0.7 bar)
This section demonstrates the effects of increasing the suction levels (i.e., from 0.85 bar to 0.7 bar) on the velocity and turbulence profiles. As shown in Figure 9, the velocity at the 1.7 m plane was approximately unaffected by the change in the suction level. On the other hand, the velocity was decreased in the areas a, b and c in the 1 m plane at the suction level of 0.7 bar, in comparison to the suction level of 0.85 bar. However, as shown in Figure 9, the difference between the two velocity profiles of the chosen two suction levels is minor.
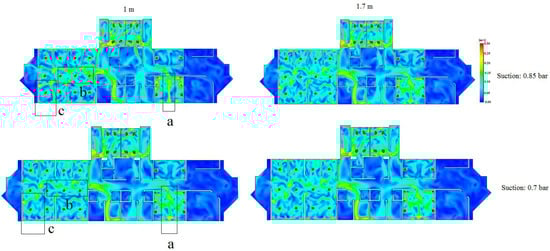
Figure 9.
Velocity profiles for the 1 m and 1.7 m planes at two suction levels (0.85 and 0.7 bar).
Remarkably, as shown in Figure 10, the turbulence kinetic energy profile for the 1.7 m plane increased (i.e., area a) at the suction level of 0.7 bar. On the other hand, the turbulence kinetic energy profile at the 1 m plane was not affected by varying the suction level from 0.85 bar to 0.7 bar.
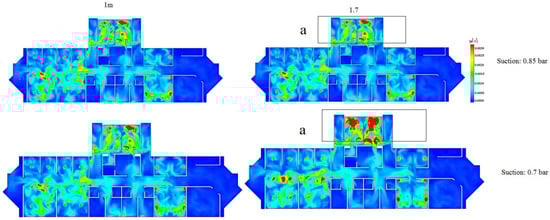
Figure 10.
Turbulence kinetic energy profile for the 1 m and 1.7 m planes at two suction levels (0.85 and 0.7 bar).
By correlating the velocity profiles to the turbulence profiles, it can be concluded that increasing the suction level failed to reduce the velocity at the 1.7 m plane. In fact, the turbulence kinetic energy was increased, thus demonstrating a negative effect on preventing the spread of COVID-19. On the other hand, increasing the suction level has shown a positive impact at the 1 m plane since the velocity has been reduced (i.e., areas a, b, and c as shown in Figure 9). This essentially highlights the dilemma of choosing a suction level while reducing the spread of COVID-19 for both planes at the same time. Therefore, one potential solution could be re-designing the ducts (i.e., the number of inlets and outlets and their vertical and horizontal positions).
4. Discussion
By evaluating the velocity profiles, it was discovered that the velocities of both entrances were recorded at their lowest levels, thereby removing the velocity component as a role in COVID-19 distribution in those areas. Furthermore, the flow through the aisles (a, b, and c) generally maintained a consistent profile and was unaffected by the velocity profiles of the primary sections, indicating that no additional kinetic energy was gained from the primary sections (patient section, operating section, and physician section), implying that COVID-19 is less likely to be transferred through those aisles. Other aisles, on the other hand, have higher levels of velocity.
The zone with high dispersion and mixing levels was identified by plotting the turbulence kinetic energy, which corresponds to the locations where COVID-19 is more likely to spread than other places. The operating and patients’ sections were identified as such. Surprisingly, the turbulence level was found to be higher at 1 m above the ground, which corresponds to the height of medical benches (i.e., the level of patients’ respiration). This also indicates that COVID-19 transmission is more frequent among patients lying down than among employees standing up in the patients’ area.
Airflow from the patients’ section exits into the physician section, according to velocity streamlines. As a result, it was suggested that the suction level in the physician section should be reduced while the suction level in the patients’ section is increased. Alternatively, the airflow velocity in the patients’ section might be lowered while other factors (such as temperature) are taken into account to maintain an appropriate degree of air conditioning.
Finally, it should be noted that the findings of this research are relative, not absolute, in the sense that the high/low-risk locations were found in relation to other sections of the building.
5. Conclusions
The objective in the case of COVID-19 should be to control and prevent the virus from spreading as much as possible. To safeguard patients and healthcare workers in the hospital emergency room, it is important to reduce the risk of airborne infection transmission to a low level while simultaneously flattening the COVID-19 curve.
The goal of this research was to learn more about the airflow patterns in the emergency department at King Abdullah University Hospital. The goal of this study was to see how well the mechanical ventilation system prevented the COVID-19 virus from spreading across the ED’s areas. A CFD study was used to evaluate the turbulent kinetic energy and flow dynamics. A steady state using the k-model was utilized to numerically simulate the airflows in this study. According to the findings, extremely turbulent fields created inside the patient recovery bed area and operating rooms may aid the transmission of the COVID-19 virus into surrounding areas. As a result of the test scenario, it is recommended that high-risk areas be isolated by doors or partitions and that inlets and outlets be repositioned. As there were only air outlets in the healthcare providers’ area, the air had to be extracted from the surrounding areas. Thus, inlets and outlets had to be shifted. The shape of the aisles also helps to keep viruses at bay. The aisles, as indicated by the research, helped to distribute air around the emergency department. Nearly all hospitals are striving to properly implement methods to meet growing demand in their facilities; as a result, this study offers hospitals administrators design recommendations to aid in the prevention of infection transmission. By minimizing the stress associated with an increased risk of infection when working in the emergency department, a hospital building designed to promote infection prevention makes healthcare workers’ duties easier and more effective. Employee comfort and activity will be substantially improved by providing a flexible arrangement. Successful infection prevention measures can also eradicate patient-to-patient infection transmission.
6. Future Work
A quantitative analysis of the grid- and time step-associated uncertainties following the methods from the ITTC-2017 guidelines (for uncertainty estimation in CFD simulations) will be performed to improve confidence in the simulation results.
Author Contributions
Conceptualization, B.O.; methodology, O.F.A.; software, O.F.A.; formal analysis, O.F.A. and B.O.; resources, E.F.D. and I.A.A.; writing—original draft preparation, B.O., I.A.A. and O.F.A.; writing—review and editing, B.O. and E.F.D.; visualization, O.F.A. and B.O.; supervision, A.A.; funding acquisition, A.A. All authors have read and agreed to the published version of the manuscript.
Funding
This publication was made possible by NPRP 13 grant # (NPRP13S-0203-200243) from the Qatar National Research Fund (a member of the Qatar Foundation). The findings herein reflect the work and are solely the responsibility of the authors.
Institutional Review Board Statement
Not applicable.
Informed Consent Statement
Not applicable.
Data Availability Statement
The data presented in this study are available within the article.
Acknowledgments
The authors would like to express their gratitude to the Engineering Projects Unit at Jordan University of Science and Technology and King Abdullah University Hospital for cooperating with us and supplying us with technical and architectural drawings of the KAUH Emergency Department. Our Profound gratitude goes to Mahmoud Hayajnh, Georgia Institute of Technology, USA, for reading the manuscript and providing valuable comments for revisions.
Conflicts of Interest
The authors declare no conflict of interest.
Nomenclature
| Turbulence kinetic energy | |
| Initial velocity magnitude | |
| Initial turbulence intensity | |
| Turbulence or eddy length scale | |
| k–ε model parameter | |
| Turbulence kinetic energy dissipation | |
| Reynolds number |
References
- Goodman, R.A.; Kocher, P.L.; O’Brien, D.J.; Alexander, F.S. The Structure of Law in Public Health Systems and Practice. Law Public Health Pract. 2007, 45–68. [Google Scholar] [CrossRef]
- Ramos, T.; Dedesko, S.; Siegel, J.A.; Gilbert, J.A.; Stephens, B. Spatial and Temporal Variations in Indoor Environmental Conditions, Human Occupancy, and Operational Characteristics in a New Hospital Building. PLoS ONE 2015, 10, e0118207. [Google Scholar] [CrossRef] [PubMed] [Green Version]
- Weber, D.J.; Anderson, D.; Rutala, W.A. The role of the surface environment in healthcare-associated infections. Curr. Opin. Infect. Dis. 2013, 26, 338–344. [Google Scholar] [CrossRef]
- WHO. Implementing the WHO Stop TB Strategy: A Handbook for National Tuberculosis Control Programmes; World Health Organization: Geneva, Switzerland, 2008. [Google Scholar]
- Huang, C.; Wang, Y.; Li, X.; Ren, L.; Zhao, J.; Hu, Y.; Zhang, L.; Fan, G.; Xu, J.; Gu, X. Clinical features of patients infected with 2019 novel coronavirus in Wuhan, China. Lancet 2020, 395, 497–506. [Google Scholar] [CrossRef] [Green Version]
- Beggs, C.B.; Kerr, K.G.; Noakes, C.J.; Hathway, E.A.; Sleigh, A. The ventilation of multiple-bed hospital wards: Review and analysis. Am. J. Infect. Control 2008, 36, 250–259. [Google Scholar] [CrossRef]
- Memarzadeh, F.; Xu, W. Role of air changes per hour (ACH) in possible transmission of airborne infections. Build. Simul. 2011, 5, 15–28. [Google Scholar] [CrossRef]
- WHO. Transmission of SARS-CoV-2: Implications for Infection Prevention Precautions; World Health Organization: Geneva, Switzerland, 2021. [Google Scholar]
- Paul Ninomura, P.E.; Richard Hermans, P.E. Ventilation standard for health care facilities. ASHRAE J. 2008, 50, 52–57. [Google Scholar]
- Sehulster, L.; Chinn, R.Y.W. Guidelines for environmental infection control in health-care facilities. Recommendations of CDC and the Healthcare Infection Control Practices Advisory Committee (HICPAC). MMWR Recomm. Rep. 2003, 52, 1–48. [Google Scholar] [PubMed]
- Li, Y.; Leung, G.; Tang, J.; Yang, X.; Chao, Y.H.C.; Lin, Z.; Lu, W.-Z.J.; Nielsen, P.V.; Niu, J.; Qian, H.; et al. Role of ventilation in airborne transmission of infectious agents in the built environment? A multidisciplinary systematic review. Indoor Air 2007, 17, 2–18. [Google Scholar] [CrossRef] [PubMed]
- Jacob, J.T.; Kasali, A.; Steinberg, J.P.; Zimring, C.; Denham, M.E. The Role of the Hospital Environment in Preventing Healthcare-Associated Infections Caused by Pathogens Transmitted through the Air. HERD Health Environ. Res. Des. J. 2013, 7, 74–98. [Google Scholar] [CrossRef]
- Mousavi, E. Airborne Infection in Healthcare Environments: Implications to Hospital Corridor Design; The University of Nebraska-Lincoln: Lincoln, Nebraska, 2015. [Google Scholar]
- Kudo, D.; Sasaki, J.; Ikeda, H.; Shiino, Y.; Shime, N.; Mochizuki, T.; Morita, M.; Soeda, H.; Ohge, H.; Lee, J.J.; et al. A survey on infection control in emergency departments in Japan. Acute Med. Surg. 2018, 5, 374–379. [Google Scholar] [CrossRef]
- Drees, K.H.; Wenger, J.D.; Janu, G. Ventilation air flow measurement for ASHRAE Standard 62-1989. ASHRAE J. 1992, 34. Available online: https://www.osti.gov/biblio/7184828 (accessed on 12 April 2021).
- Cho, J. Investigation on the contaminant distribution with improved ventilation system in hospital isolation rooms: Effect of supply and exhaust air diffuser configurations. Appl. Therm. Eng. 2019, 148, 208–218. [Google Scholar] [CrossRef]
- Bhattacharyya, S.; Dey, K.; Paul, A.R.; Biswas, R. A novel CFD analysis to minimize the spread of COVID-19 virus in hospital isolation room. Chaos Solitons Fractals 2020, 139, 110294. [Google Scholar] [CrossRef] [PubMed]
- Aganovic, A. Airflow Distribution for Minimizing Human Exposure to Airborne Contaminants in Healthcare Facilities; NTNU: Trondheim, Norway, 2019. [Google Scholar]
- Memarzadeh, F. Literature Review of the Effect of Temperature and Humidity on Viruses. ASHRAE Trans. 2012, 118, 1049–1060. [Google Scholar]
- Memarzadeh, F. The Environment of Care and Health Care-Associated Infections: An Engineering Perspective; American Society of Healthcare Engineering of the American Hospital Association: Washington, DC, USA, 2011. [Google Scholar]
- Lange, S.J.; Ritchey, M.D.; Goodman, A.B.; Dias, T.; Twentyman, E.; Fuld, J.; Schieve, L.A.; Imperatore, G.; Benoit, S.R.; Kite-Powell, A. Potential Indirect Effects of the COVID-19 Pandemic on Use of Emergency Departments for Acute Life-Threatening Conditions—United States, January–May 2020; Wiley: Hoboken, NJ, USA, 2020. [Google Scholar]
- Chua, W.L.T.; Quah, L.J.J.; Shen, Y.; Zakaria, D.; Wan, P.W.; Tan, K.; Wong, E. Emergency department ‘outbreak rostering’ to meet challenges of COVID-19. Emerg. Med. J. 2020, 37, 407–410. [Google Scholar] [CrossRef]
- Iversen, K.; Bundgaard, H.; Hasselbalch, R.B.; Kristensen, J.H.; Nielsen, P.B.; Pries-Heje, M.M.; Knudsen, A.D.; Christensen, C.E.; Fogh, K.; Norsk, J.B.; et al. Risk of COVID-19 in health-care workers in Denmark: An observational cohort study. Lancet Infect. Dis. 2020, 20, 1401–1408. [Google Scholar] [CrossRef]
- Nadarajan, G.D.; Omar, E.; Abella, B.S.; Hoe, P.S.; Shin, S.D.; Ma, M.H.-M.; Ong, M.E.H. A conceptual framework for Emergency department design in a pandemic. Scand. J. Trauma Resusc. Emerg. Med. 2020, 28, 1–13. [Google Scholar] [CrossRef] [PubMed]
- Woolard, R.H.; Borron, S.W.; Mackay, J.M. Emergency Department Design. Ciottone’s Dis. Med. 2016, 125–130. [Google Scholar] [CrossRef]
- Ansys. Ansys|Engineering Simulation Software. Available online: https://www.ansys.com (accessed on 22 April 2021).
- Stolarski, T.; Nakasone, Y.; Yoshimoto, S. Engineering Analysis with ANSYS Software; Butterworth-Heinemann: Oxford, UK, 2018. [Google Scholar]
- World Population Review. Average Height by Country 2021. Available online: https://worldpopulationreview.com/country-rankings/average-height-by-country (accessed on 20 April 2021).
- Yuan, F.-D.; You, S.-J. CFD simulation and optimization of the ventilation for subway side-platform. Tunn. Undergr. Space Technol. 2007, 22, 474–482. [Google Scholar] [CrossRef]
- Ramponi, R.; Blocken, B. CFD simulation of cross-ventilation for a generic isolated building: Impact of computational parameters. Build. Environ. 2012, 53, 34–48. [Google Scholar] [CrossRef]
- Li, Y.; Nielsen, P.V. CFD and ventilation research. Indoor Air 2011, 21, 442–453. [Google Scholar] [CrossRef] [PubMed]
- Cao, S.-J. Challenges of using CFD simulation for the design and online control of ventilation systems. Indoor Built Environ. 2019, 28, 3–6. [Google Scholar] [CrossRef] [Green Version]
- Lee, S.C.; Harsha, P.T. Use of turbulent kinetic energy in free mixing studies. AIAA J. 1970, 8, 1026–1032. [Google Scholar] [CrossRef]
- Dimotakis, P.E. Turbulent Mixing. Annu. Rev. Fluid Mech. 2005, 37, 329–356. [Google Scholar] [CrossRef]
- de Roode, S.R.; Jonker, H.J.; van de Wiel, B.J.; Vertregt, V.; Perrin, V. A diagnosis of excessive mixing in smagorinsky subfilter-scale turbulent kinetic energy models. J. Atmos. Sci. 2017, 74, 1495–1511. [Google Scholar] [CrossRef]


Publisher’s Note: MDPI stays neutral with regard to jurisdictional claims in published maps and institutional affiliations. |
© 2021 by the authors. Licensee MDPI, Basel, Switzerland. This article is an open access article distributed under the terms and conditions of the Creative Commons Attribution (CC BY) license (https://creativecommons.org/licenses/by/4.0/).