Article

The Association of Salivary Conductivity with Cardiomegaly in Hemodialysis Patients

1
Department of Anesthesiology, Chang Gung Memorial Hospital, Chiayi 61363, Taiwan
2
Taiwan Instrument Research Institute, National Applied Research Laboratories, Hsinchu 30261, Taiwan
3
Department of Orthopedic Surgery, Chang Gung Memorial Hospital, Chiayi 61363, Taiwan
4
Department of Nursing, Chiayi Campus, Chang Gung University of Science and Technology, Chiayi 61363, Taiwan
5
Department of Diagnostic Radiology, Chang Gung Memorial Hospital, Chiayi 61363, Taiwan
6
Department of Nephrology, Chang Gung Memorial Hospital, Chiayi 61363, Taiwan
7
Graduate Institute of Clinical Medical Sciences, Chang Gung University, Taoyuan 33302, Taiwan
8
Department of Neurosurgery, Chang Gung Memorial Hospital, Chiayi 61363, Taiwan
9
College of Medicine, Chang Gung University, Taoyuan 33302, Taiwan
*
Authors to whom correspondence should be addressed.
Both authors contributed equally to this work and are listed as co-first authors.
Appl. Sci. 2021, 11(16), 7405; https://doi.org/10.3390/app11167405
Submission received: 22 June 2021 / Revised: 7 August 2021 / Accepted: 9 August 2021 / Published: 12 August 2021
(This article belongs to the Special Issue Salivary Biomarkers: Future Diagnostic and Clinical Utilities)

Abstract

:
Patients on maintenance hemodialysis are at high risk for cardiovascular morbidity and mortality. Fluid overload is generally regarded as the main cause of cardiovascular death among them. Cardiothoracic ratio (CTR) by chest plain film is routinely performed to evaluate their volumetric states and cardiac conditions. We recently reported that salivary conductivity is a reliable marker for assessing fluid status in healthy adults. This cross-sectional study aims to explore the association between salivary conductivity and CTR. Cardiomegaly is defined as a CTR greater than 0.5. A total of 129 hemodialysis patients were enrolled, 42 of whom (32.6%) had cardiomegaly. Patients with cardiomegaly had significantly lower serum osmolality, lower serum sodium, and lower salivary conductivity, but a higher percentage of underlying atrial fibrillation. In the multiple linear regression analysis, CTR was negatively associated with salivary conductivity or to the serum sodium level and positively correlated with older age. We further divided patients into low, medium, and high salivary conductivity groups according to the tertials of conductivity levels. There was a significant trend for the increment of cardiomegaly from high to low salivary conductivity groups (p for trend: 0.021). The receiver operating characteristic curves for the diagnostic ability of salivary conductivity on cardiomegaly reported the area under the curve equal to 0.626 (95% CI: 0.521–0.730, p = 0.02). Moreover, older age and higher serum osmolality were independent determinants for salivary conductivity by multiple linear regression analysis. This work has presented that salivary conductivity is a novel approach to uncover fluid overload and cardiomegaly among chronic hemodialysis patients.

1. Introduction

Cardiovascular disease (CVD) is the leading cause of death among patients under maintenance hemodialysis (HD) [1,2]. Proposed etiologies include fluid overload, hypertensive stress, anemia, secondary hyperparathyroidism, uremic cardiomyopathy, altered lipid metabolism, and accumulation of uremic toxins [2]. Volume overload and poorly controlled hypertension ultimately lead to left ventricular hypertrophy, cardiomegaly, and heart failure [3]. In patients with chronic kidney disease, cardiomegaly was associated with increased cardiovascular mortality and rapid renal progression [4]. Moreover, similar results have been reported by Yotsueda et al. in their work on HD patients [5]. They concluded that HD patients with cardiomegaly were at higher risk for cardiovascular events and all-cause mortality.
Cardiomegaly refers to cardiac enlargement and is defined when the cardiothoracic ratio (CTR) is greater than or equal to 50% [6]. The CTR is the ratio of the transverse diameter of the heart outline to the transverse diameter of the chest. Among various clinical image studies, the measurement of CTR on a posterior-anterior projection of a chest X-ray is simple, cost-effective, and routinely applied in dialysis units for the assessment of cardiac size and volume status [7]. Undiagnosed or uncontrolled cardiomegaly eventually leads to decompensated heart failure, malignant ventricular arrhythmias, and sudden cardiac death [6,8]. A higher CTR is also related to an increased risk for cardiovascular death in patients with end-stage kidney disease (ESKD) [4,5,9,10,11]. Therefore, the regular follow-up of CTR in ESKD patients is important.
The increased serum osmolality is an independent risk factor for developing ESKD and is also accurate for assessing fluid status [12,13]. By detecting the sodium (chloride and bicarbonate), glucose, and blood urea nitrogen in the serum, serum osmolality is the main physiologic signal for regulating water balance in the body and is a gold standard for diagnosing dehydration [14,15,16,17,18]. A higher CTR is accompanied by hypoosmolality due to the fluid overload, which is related to decreased excretion of arginine vasopressin [19,20]. However, taking blood by venipuncture for osmolality detection should be decreased in the frequency in HD patients [12,21,22,23]. Therefore, the development of an easy-to-perform and non-invasive method is crucial for evaluating the volume status in dialysis patients.
Saliva, a kind of body fluid, can be obtained and assessed more easily. There is a growing interest in the application of salivary biomarkers for clinical diagnosis. Saliva contains a variety of organic and inorganic materials, such as hormones, cytokines, enzymes, antibodies, pathogens, metabolites, and electrolytes, etc. [24]. The complexity of salivary bio-components makes it possible to reflect the systemic conditions. Recent literature has demonstrated the diagnostic utility of saliva in varied systemic diseases, including insulin resistance and obesity [25], neuropsychiatric disorders [26], stroke [27], and chronic kidney disease [28], etc. Moreover, the composition of saliva is approximately 99.5 percent water. The osmolality of saliva is determined by the major ions like sodium, potassium, chloride, and bicarbonate, and is correlated with salivary conductivity [29,30]. Both salivary osmolality and conductivity increased during progressive dehydration which was reversed after rehydration [30,31,32,33]. We recently developed a portable, and non-invasive biodevice to measure salivary conductivity by electric signals of saliva samples [30]. We found there was a positive correlation between serum osmolality and salivary conductivity in normal populations. This biodevice can also effectively discriminate volumetric states among healthy adults, but its utility is unclear in ESKD patients. The aim of this investigation is to validate the correlation between salivary conductivity and serum osmolality in HD patients, and also to evaluate the association between salivary conductivity and fluid state, which was determined by CTR.

2. Materials and Methods

2.1. Study Subjects

Initially, this study recruited all 180 ESKD patients undergoing maintenance HD in the dialysis unit of Chang Gung Memorial Hospital at Chiayi, Taiwan. Among them, 6 participants were excluded due to receiving HD less than 3 months, and 9 patients were excluded owing to recent hospitalization for active infections, acute stroke, and myocardial infarction. All enrolled subjects denied histories of head and neck radiotherapy in the past. Among the 165 eligible patients, 36 patients could not complete the study (15 patients did not receive chest X-ray examination and another 21 patients could not cooperate with the saliva collection). This study was conducted in November 2018, and a total of 129 HD patients aged 18 and above were included in the final analysis (Figure 1). This cross-sectional study complied with the guidelines of the Declaration of Helsinki. This investigation was approved by the Medical Ethics Committee of Chang Gung Memorial Hospital (institutional review board number: 201801708B0). Before the entry of the study, all subjects agreed and completed an informed consent form.

2.2. Experimental Substance

We explained the study designs of this experiment to all participants before the study, including saliva collection, blood tests, chest radiographic examination, and thirst intensity scale evaluation. All serum and salivary data of this study were collected at the time before HD therapies.

2.3. Collection and Analysis of Saliva

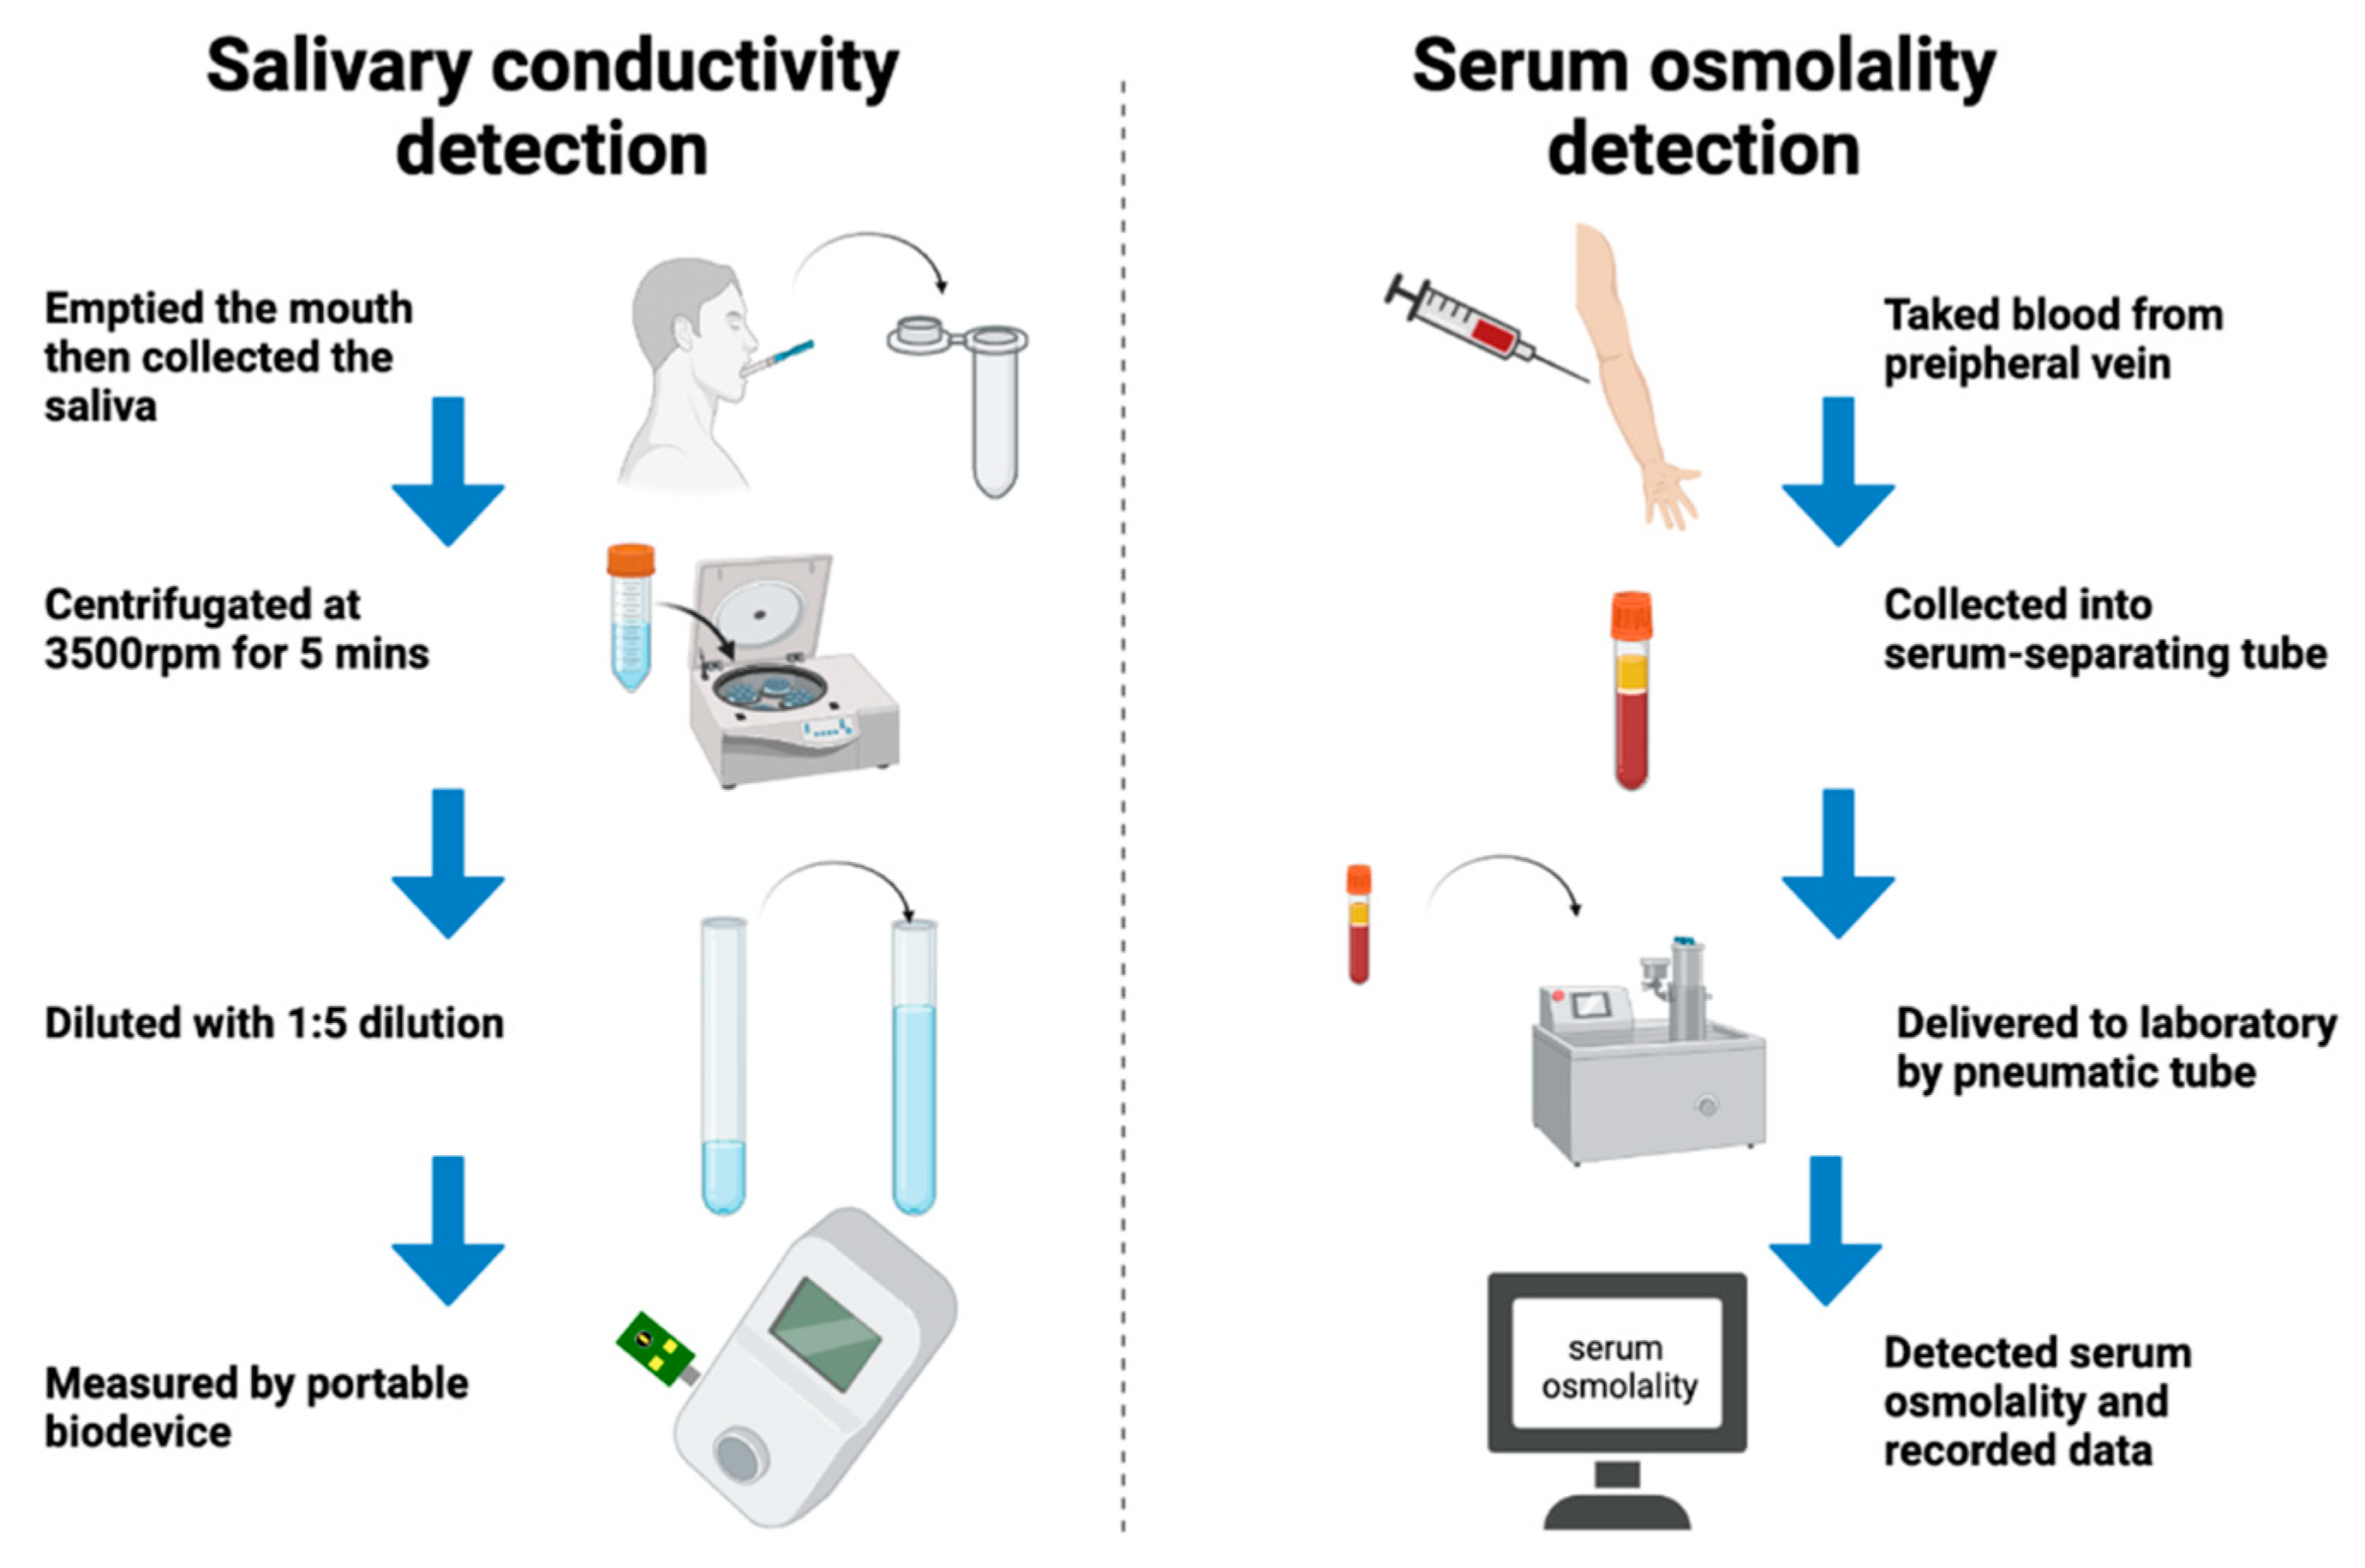
Saliva specimens were collected by the following steps (Figure 2):
  • Participant swallowed and emptied their mouth.
  • We collected saliva with a 1 mL dropper and placed the collected salivary sample into a 1.5 mL Eppendorf tube.
  • Saliva was centrifugated at 3500 rpm for 5 min and was collected from the bottom of the 1.5 mL Eppendorf tube for the storage of the samples.
  • Upon measurement, we took 100 μL of a saliva sample which was diluted with 400 μL ultrapure water. The conductivity is 0.055 µSiemens/cm of the water, while the resistivity is 18.2 MΩ × cm at 25 °C.
  • The salivary conductivity was analyzed through the developed portable monitor with a disposable printed-circuit board electrode.
  • The above steps were repeated 3 times, then we measured the averaged values, and recorded the data of the salivary conductivity (Table S1 in Supplemental Materials).

2.4. Detection of Serum Osmolality

The whole blood was obtained at room temperature (15~30 °C) and stored in the serum-separating tube. The tube was sent to the laboratory by pneumatic tube, and the freezing point depression method was applied to measure the serum osmolality [34] (Figure 2).

2.5. Assessment of Thirst Intensity Scales

Two thirst intensity scales were recorded in this study—Visual Analog Scale (VAS) and Categorical Scale (CS). The VAS reflected the thirst intensity of participants with a subjective description via 0–10 scores [35,36]. The CS reflected the thirst intensity with 7 degrees, categorized by a subjective description from participants [37]. The test-retest reliability was analyzed by the interclass correlation coefficient (ICC). The ICC for VAS scores and CS were equal to 0.913 and 0.927, respectively. Additionally, the Cronbach’s alpha coefficient of 0.812 for the VAS scores and 0.886 for the CS indicates an acceptable level of the instruments’ internal reliability.

2.6. Evaluation of CTR and the Definition of Cardiomegaly

The cardiothoracic ratio was calculated from a standing chest X-ray film. The fraction of the transverse diameter of the heart contour to the transverse diameter of the chest is defined as CTR [6]. The definition of cardiomegaly is a CTR greater than or equal to 0.5. The chest radiographs were reviewed by experienced radiologists blinded to the patients’ clinical data.

2.7. Statistical Analysis

The continuous variables are displayed as the means ± standard deviations. The categorical variables were presented as numbers or percentages. Numerical variables were examined for normality using the Kolmogorov–Smirnov method. An independent Student’s t-test was applied to compare the means of the continuous parameters of normal distribution, while the Mann–Whitney U test was used for continuous, but not normally distributed data. The Pearson chi-square test with Fisher’s exact test was utilized for categorical variables. Receiver operating characteristic (ROC) curve analysis was used to estimate the diagnostic ability of salivary conductivity on cardiomegaly. To improve the diagnostic performance, a multivariable logistic regression analysis with forward selection was performed using the combined variables. In the ROC analysis, the presence of CTR ≥ 50% was defined as events and the salivary conductivity or the predicted risk of combined variables was the explanatory parameter. The area under the ROC curve (AUROC) was calculated to evaluate the diagnostic power of the model. As a predictive analysis for cardiothoracic ratio or salivary conductivity, the multiple linear regression with backward selection was used to explain the correlation between one dependent variable and other independent variables. The 95% confidence interval was the criterion for significance to reject the null hypothesis. The IBM SPSS Statistics Version 25 was performed to do the statistical analyses.

3. Results

3.1. Demographics of the 129 Hemodialysis Patients

This cross-sectional study included 129 ESKD patients under chronic HD, 42 (32.6%) of whom had cardiomegaly. These patients were aged 61.36 ± 11.30 years and most of them suffered from hypertension (93.0%) and diabetes mellitus (62.8%) (Table 1). It was found that patients with cardiomegaly had lower serum osmolality (307.83 ± 11.28 vs. 311.56 ± 9.72 mOsm/kg H2O, p = 0.05), lower serum sodium level (135.88 ± 4.01 vs. 137.25 ± 3.27 mEq/L, p = 0.04), lower salivary conductivity (6999.71 ± 2221.09 vs. 7833.52 ± 2372.98 μs/cm, p = 0.05) and a higher percentage of underlying atrial fibrillation (14.3 versus 4.6%, p = 0.05). There were no significant differences in the thirst intensity scales between groups. To avoid selection bias induced by an unequal sample size, we further conducted a sensitivity analysis using age- and sex-matched controls. The results were similar to the original analysis (Table S2 in Supplemental Materials).

3.2. The Prediction of Cardiothoracic Ratio

A multiple linear regression analysis was conducted to predict the CTR from clinical parameters. Adjusted variables in regression model 1 included age, blood urea nitrogen, creatinine, salivary conductivity, glucose, and serum sodium and potassium levels. Only older age (β = 0.200 ± 0.000, p = 0.036) and lower salivary conductivity (β = −0.203 ± 0.000, p = 0.028) were notably associated with a higher CTR (R2 = 0.30, model 1 in Table 2). Previous results have shown the close interaction between salivary conductivity and sodium level [25], and we noticed serum sodium was a significantly negative predictor (β = −0.178 ± 0.001, p = 0.028) for CTR by removing salivary conductivity from the analysis (R2 = 0.18, model 2 in Table 2).

3.3. Association between Salivary Conductivity and Cardiomegaly

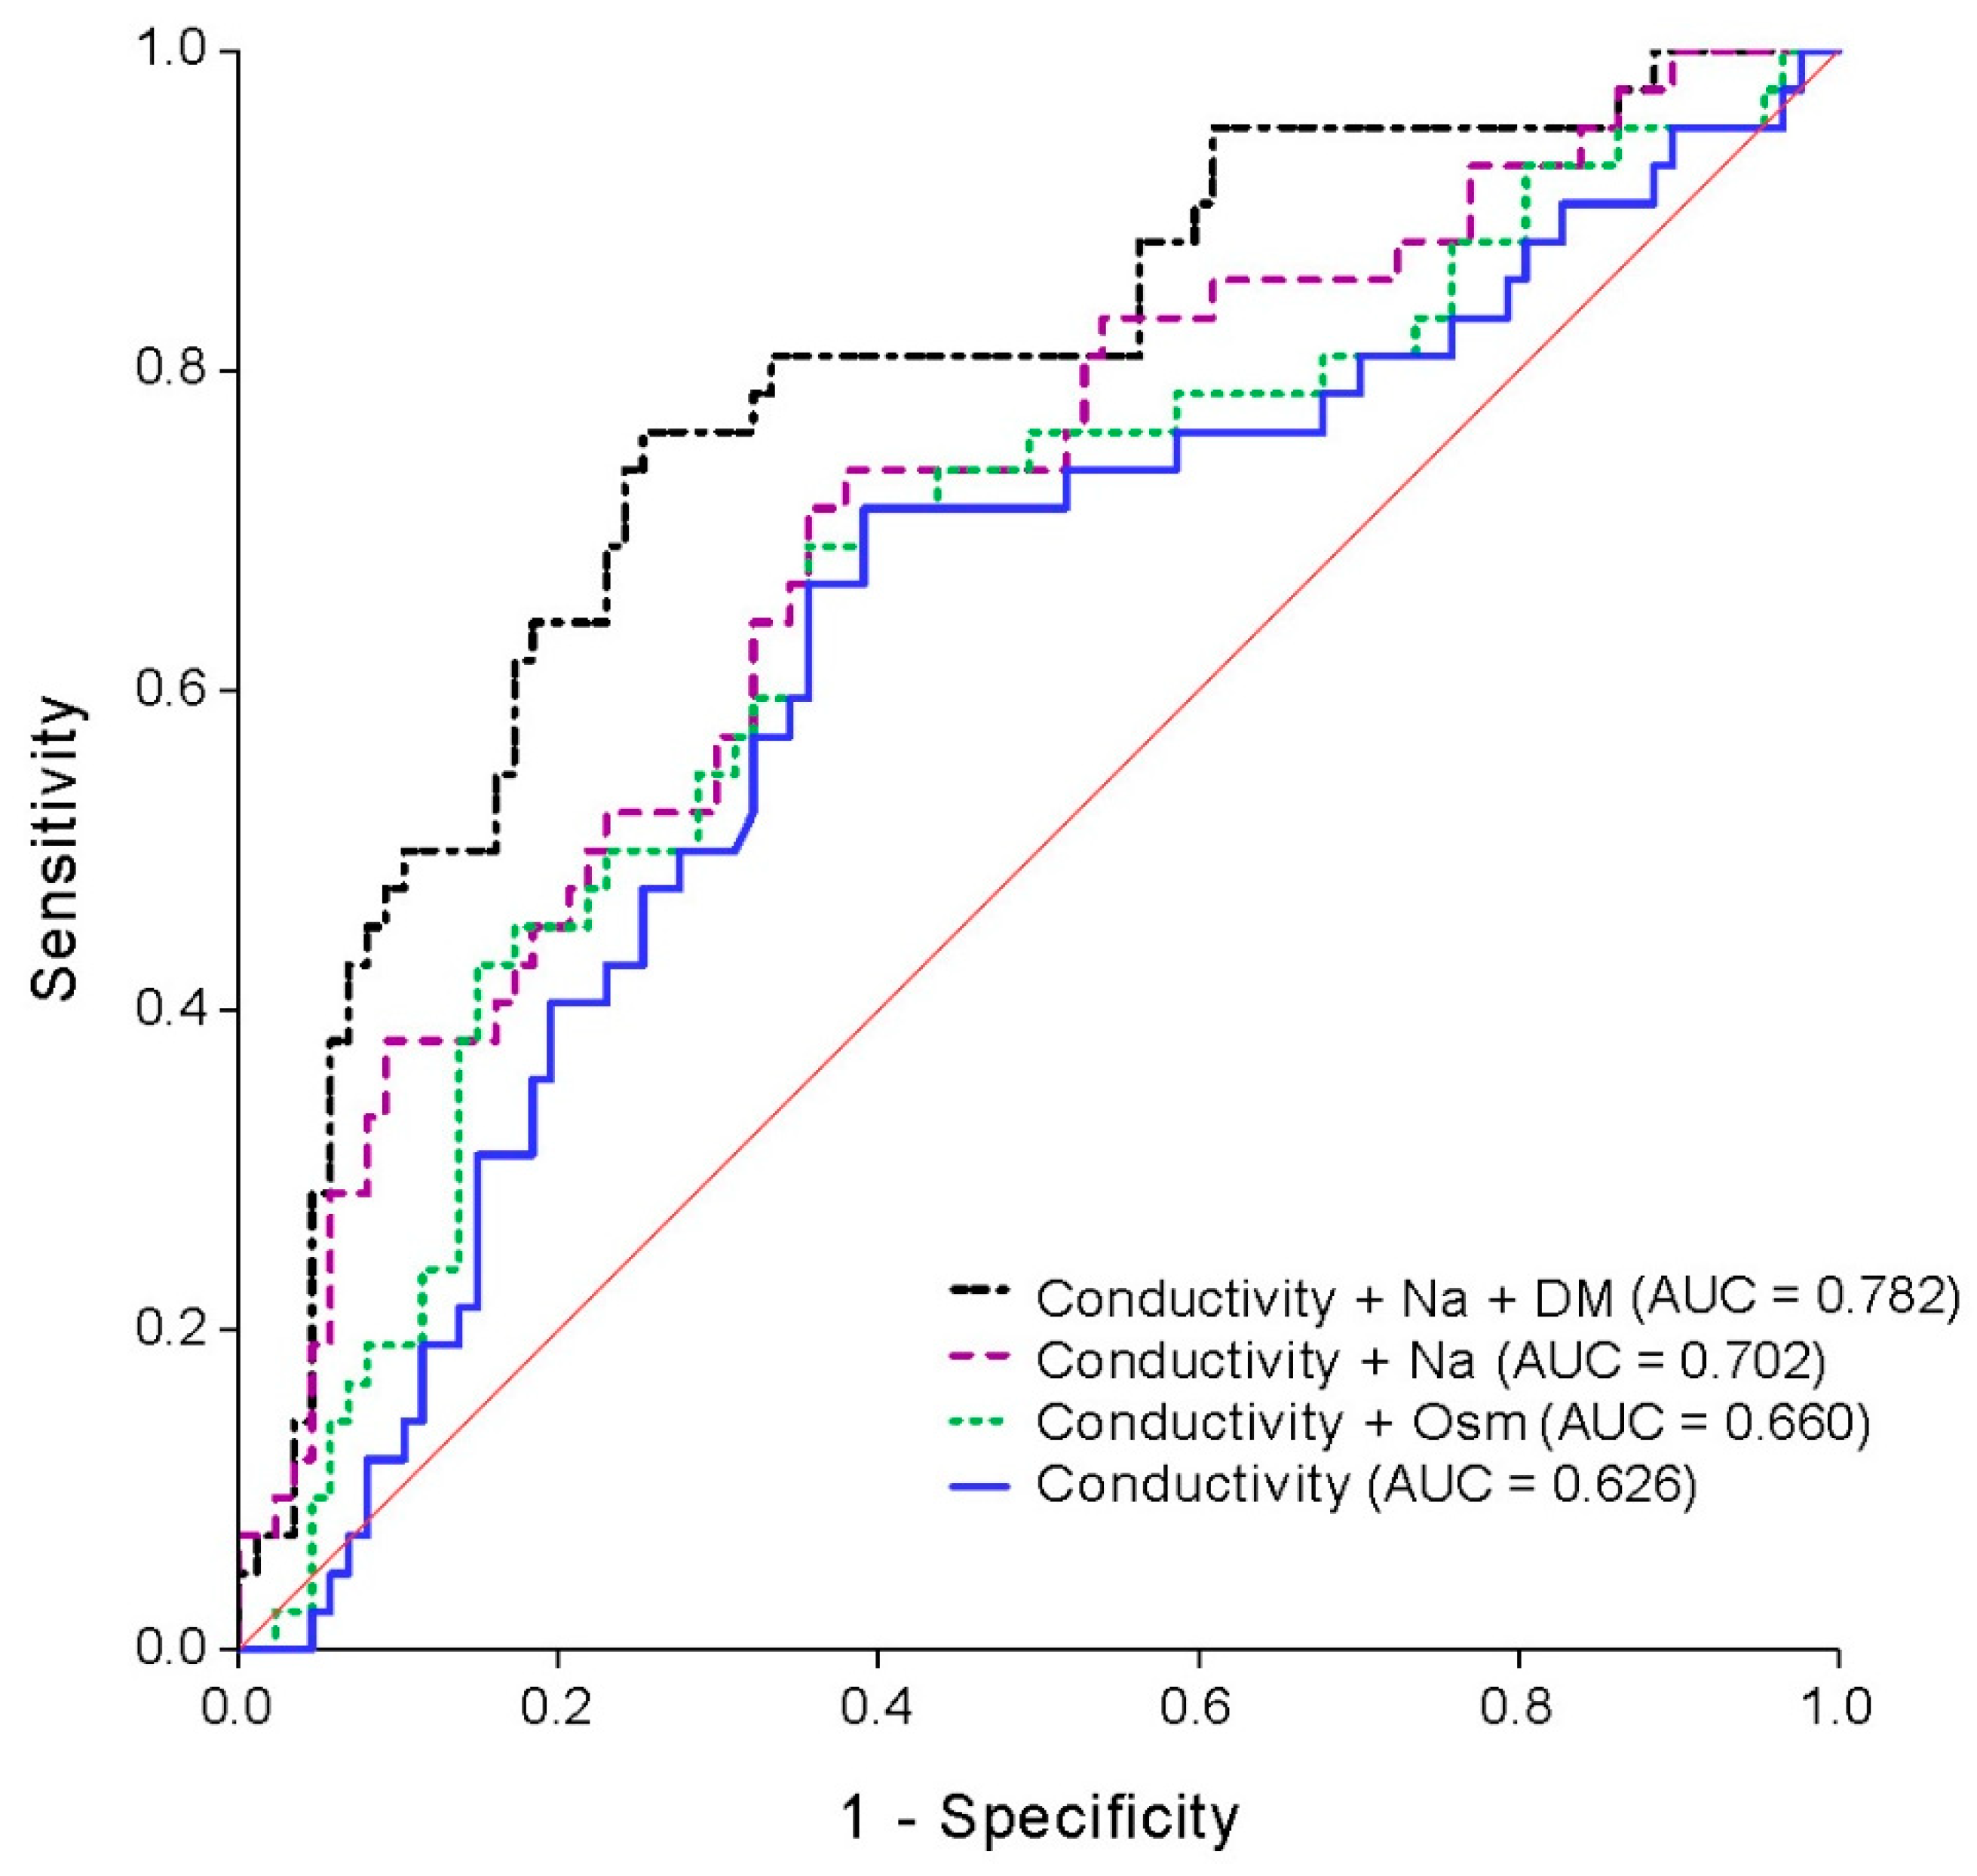
To further clarify the association between salivary conductivity and the prevalence of cardiomegaly, we divided patients into low, medium, and high salivary conductivity groups according to the tertial of conductivity levels (Figure 3). There was a significant trend for an increment of cardiomegaly from high to low salivary conductivity levels (23.8% in high vs. 28.6% in medium vs. 47.6% in low conductivity group, p for trend: 0.021). To test the diagnostic ability of salivary conductivity on cardiomegaly among dialysis patients, the receiver operating characteristic curve analysis was performed. The AUROC was equal to 0.626 (95% CI: 0.521–0.730, p = 0.02). To improve the diagnostic performance, we further combined salivary conductivity with serum osmolality, sodium, and history of diabetes mellitus in the prediction model. The combination of salivary conductivity, serum sodium, and history of diabetes mellitus showed a significant increase of AUROC (0.782, 95% CI: 0.696–0.868) (Figure 4).

3.4. Determinant of Salivary Conductivity from Clinical Parameters

We further used multiple linear regression analysis to determine the correlations between salivary conductivity and continuous parameters. Because osmolality is composed of serum sodium, glucose, and blood urea nitrogen, we only input age, serum creatinine, osmolality, potassium, and the Thirst intensity scale (VAS) into the analysis model. We found older age (β = 0.309 ± 0.000, p < 0.001) and higher serum osmolality (β = 0.192 ± 0.000, p = 0.023) were positively correlated with salivary conductivity values (R2 = 0.35, Table 3). Figure 5 is a three-dimensional scatter plot, prepared for salivary conductivity, serum osmolality, and age, to identify the data behavior. The z-axis was salivary conductivity, and the x- and y-axis were age and serum osmolality, respectively. The positive trend between salivary conductivity and serum osmolality was more obvious especially in older age (>60 years old), which explained that age was the most significant independent variable (Table 3).

4. Discussion

The most important aspect of the data was that salivary conductivity was significantly correlated with the CTR in chronic HD patients. Patients with a lower salivary conductivity were at high risk for cardiomegaly. Other than traditional cardiovascular risks, the fluid overload in the body increases the afterload of the heart, aggravates myocardial stress, and therefore, eventually leads to an increased CTR and heart failure [38,39]. Previous results have confirmed CTR as an important and independent predictor of CVD in patients under HD. In an 18-year Q-cohort study, Yotsueda et al. [5] found that a higher CTR was related to higher mortality and CVD events in HD patients. The body fluid accumulation can lead to an increased CTR in the chest X-ray due to high fluid overload [40,41]. Ogata et al. [9] reported that age, sex, and CTR correlated with CVD death when NT-proBNP, a diagnostic biomarker for cardiac dysfunction and heart failure, was not available. CTR could be a reliable tool for CVD risk stratification in chronic dialysis patients [10,42]. The finding of a negative correlation between salivary conductivity and CTR has implicated lower salivary conductivity as a marker of volume overload and also a risk for cardiovascular events or deaths (Table 1 and Table 2 and Figure 3).
In our study, Table 1 showed patients with cardiomegaly also had a higher percentage of underlying atrial fibrillation. Patients on HD have been reported to have a higher incidence of atrial fibrillation [43]. Chronic atrial fibrillation may cause decompensated heart failure. Furthermore, atrial fibrillation could attribute to increased CTR which correlated with a longer duration of hospitalization [44]. In support of our finding, a recent cohort study in patients under maintenance HD showed atrial fibrillation was associated with ventricular hypertrophy and cardiovascular death. A significantly negative correlation was also found between predialysis serum sodium and CTR (Table 1 and Table 2). Excessive accumulation of extracellular volume is the main pathophysiological factor of hyponatremia in the dialysis population [45]. A recently large-scale cohort study reported that a low pre-dialysis serum sodium level was associated with a greater risk of mortality in HD patients. Since there is a close correlation between serum sodium and salivary conductivity [30], we removed salivary conductivity from the multiple linear regression analysis for the prediction of CTR. In addition to the relative pre-dialysis hyponatremia in HD patients showing cardiomegaly, we also demonstrated that serum sodium levels were independently associated with CTR.
Both the thirst intensity scale and serum osmolality were used for assessing fluid status in this study. The thirst intensity scale VAS and CS measures subjective feelings about thirst. Our study revealed no difference in VAS and CS between normal and abnormal CTR patients (Table 1). The prevalence of thirst is strikingly high in HD patients, 94.1% of whom had never complained of thirst [46]. Xerostomia and blunted autoregulation of blood osmolality may partly explain that the thirst intensity scales are invalid in assessing fluid state among ESKD patients [47]. On the other hand, serum osmolality is an objective indicator for the evaluation of hydration [12,13]. In HD patients, the change in serum osmolality is related to cerebral perfusion, oxygenation, and an increased risk of death. Plasma osmolality is higher in ESKD patients in the range of 291–339 mOsm/kg than that in the general population (275–290 mOsm/kg) [48,49,50]. In our study, the mean serum osmolality is 310.27 ± 9.97 mOsm/kgH2O, which was compatible with the range in ESKD patients. We stratified the patients into two groups by the definition of cardiomegaly, and the serum osmolality was significantly lower in patients with cardiomegaly. Previous studies had found hypoosmolality to be a risk for mortality in patients with heart failure not undergoing dialysis [51,52]. More recently, a prospective cohort study of 1240 HD patients from the Japanese Dialysis Outcomes and Practice Patterns Study (J-DOPPS phase 5, 2012–2015) had displayed that a low predialysis osmolality was associated with intra-dialytic instability and was also an independent risk factor for all-cause mortality. Our research has also validated the significant linear correlation between salivary conductivity and blood osmolality in HD patients (Table 3). As the serum osmolality detection is inconvenient and cannot immediately reflect real-time changes of intravascular volume, it would be difficult for us to correct cerebral hypoperfusion or hypoxia during dialysis in time [48]. Moreover, frequent venipuncture is an invasive procedure that often causes the risks of vascular access-related complications, procedural pain, venous stenosis, infections, and increases morbidity and hospitalization, especially in ESKD patients [12,21,22,23,53,54]. Moreover, ESKD is a disease of kidney damage, with little urine amount, which is difficult for further examination [55]. Thus, the salivary examination may provide an opportunity for rapid and real-time monitoring of fluid or cardiac states in ESKD patients during dialysis therapies.
There are several limitations to be mentioned in this study. First, this is a cross-sectional design, thus we could not confirm a true cause and effect relationship between salivary conductivity and CTR. Second, we measured salivary data once in prevalent HD patients, thus there was no tangible baseline data and we could not evaluate the effect of serial changes of salivary conductivity on heart size. Third, we only used the CTR by chest radiography to define cardiomegaly. The misclassification of study patients into the wrong category may occur. Further studies with echocardiographic parameters and biomarkers for heart failure or hypervolemia are warranted to solve this weakness. Fourth, the relatively low AUROC value indicated a poor diagnostic performance of using the single parameter of salivary conductivity on cardiomegaly. Notably, when combined with serum sodium and a history of diabetes mellitus, the diagnostic accuracy is significantly increased. In addition, there was a lack of stomatological examination in our patients. Local pathological conditions of dental or periodontological tissues may affect the biocomponents in saliva, thereby interfering with the stability of the conductivity measurement. Finally, we did not consider the effects of anti-hypertensive or anti-arrhythmic medications on cardiac size.

5. Conclusions

In summary, we have demonstrated the significant association between salivary conductivity and CTR and the validity of salivary conductivity on the diagnosis of cardiomegaly. Although CTR is routinely used to define cardiomegaly, it is usually measured by chest X-ray, computed tomography, or echocardiography. These diagnostic tools are ionizing radiation or relatively expensive and inconvenient when compared with the salivary examination. The real-time, radiation-free, and non-invasive properties of salivary measurement make it a promising tool for monitoring fluid status and cardiac sizes among dialysis patients. However, the current results are not enough to confirm that salivary conductivity is a good biomarker of cardiovascular prognosis. Therefore, we nonetheless need to conduct a well-designed prospective cohort study to further clarify the ability of salivary conductivity for predicting cardiovascular risk.

Supplementary Materials

The following are available online at https://www.mdpi.com/article/10.3390/app11167405/s1, A-T Lee, Y-P Lu, and C-H Chen, et al. The Association of Salivary Conductivity with Cardiomegaly in Hemodialysis Patients. Table S1: Values of all three measurements of salivary conductivity, Table S2: Baseline demographics of cardiomegaly patients, and age- and sex-matched controls (n = 84).

Author Contributions

Conceptualization, A.-T.L., Y.-H.T., C.-H.C. (Chun-Hao Chen), and C.-W.T.; methodology, A.-T.L., C.-H.C. (Chun-Hao Chen), C.-W.T., and J.-T.Y.; software, Y.-P.L. and Y.-H.T.; validation, A.-T.L. and J.-T.Y.; formal analysis, A.-T.L., C.-H.C. (Chun-Hao Chen) and C.-W.T.; investigation, A.-T.L., Y.-P.L. and J.-T.Y.; resources, A.-T.L., Y.-P.L., C.-H.C. (Chun-Hao Chen), C.-H.C. (Chia-Hao Chang), Y.-H.T., C.-W.T. and J.-T.Y.; data curation, A.-T.L., Y.-P.L., C.-H.C. (Chun-Hao Chen), C.-H.C.(Chia-Hao Chang), C.-W.T. and J.-T.Y.; writing—original draft preparation, A.-T.L. and C.-H.C. (Chun-Hao Chen); writing—review and editing, J.-T.Y.; visualization, J.-T.Y.; supervision, C.-W.T.; project administration, C.-W.T.; funding acquisition, J.-T.Y. All authors have read and agreed to the published version of the manuscript.

Funding

This research was supported by grants from the Chang Gung Medical Research Project to Yuan-Hsiung Tsai and Jen-Tsung Yang (CORPG6G0183, CORPG6G0211, CORPG6G0212, CORPG6G0213 and CORPG6G0233).

Institutional Review Board Statement

The study was conducted according to the guidelines of the Declaration of Helsinki and approved by the Ethics Committee of Chang Gung Memorial Hospital (institutional review board number: 201801708B0).

Informed Consent Statement

Written informed consent has been obtained from the patient(s) to publish this paper.

Data Availability Statement

Datasets in this study are available from the corresponding author upon reasonable request.

Acknowledgments

The authors would like to thank Yuan-Hsiung Tsai (the Department of Diagnostic Radiology, Chang Gung Memorial Hospital,) for the image consultation.

Conflicts of Interest

All authors declare no conflict of interest. The funders had no role in the design of the study; in the collection, analyses, or interpretation of data; in the writing of the manuscript, or in the decision to publish the results.

References

  1. Klinger, M.; Madziarska, K. Mortality predictor pattern in hemodialysis and peritoneal dialysis in diabetic patients. Adv. Clin. Exp. Med. 2019, 28, 133–135. [Google Scholar] [CrossRef] [PubMed]
  2. Ahmadmehrabi, S.; Tang, W.H.W. Hemodialysis-induced cardiovascular disease. Semin. Dial. 2018, 31, 258–267. [Google Scholar] [CrossRef]
  3. Bansal, N. Evolution of Cardiovascular Disease During the Transition to End-Stage Renal Disease. Semin. Nephrol. 2017, 37, 120–131. [Google Scholar] [CrossRef] [Green Version]
  4. Chen, S.C.; Teh, M.; Huang, J.C.; Wu, P.Y.; Chen, C.Y.; Tsai, Y.C.; Chiu, Y.W.; Chang, J.M.; Chen, H.C. Increased Aortic Arch Calcification and Cardiomegaly is Associated with Rapid Renal Progression and Increased Cardiovascular Mortality in Chronic Kidney Disease. Sci. Rep. 2019, 9, 5354. [Google Scholar] [CrossRef] [PubMed]
  5. Yotsueda, R.; Taniguchi, M.; Tanaka, S.; Eriguchi, M.; Fujisaki, K.; Torisu, K.; Masutani, K.; Hirakata, H.; Kitazono, T.; Tsuruya, K. Cardiothoracic Ratio and All-Cause Mortality and Cardiovascular Disease Events in Hemodialysis Patients: The Q-Cohort Study. Am. J. Kidney Dis. 2017, 70, 84–92. [Google Scholar] [CrossRef]
  6. Amin, H.; Siddiqui, W.J. Cardiomegaly; StatPearls Publishing: Treasure Island, FL, USA, 2021. [Google Scholar]
  7. Gunal, A.I. How to determine ‘dry weight’? Kidney Int. Suppl. 2013, 3, 377–379. [Google Scholar] [CrossRef] [Green Version]
  8. Dasgupta, S.; Kelleman, M.; Slesnick, T.; Oster, M.E. Cardiomegaly on chest radiographs as a predictor of heart disease in the pediatric population. Am. J. Emerg. Med. 2020, 38, 855–859. [Google Scholar] [CrossRef]
  9. Ogata, H.; Kumasawa, J.; Fukuma, S.; Mizobuchi, M.; Kinugasa, E.; Fukagawa, M.; Fukuhara, S.; Akizawa, T. The cardiothoracic ratio and all-cause and cardiovascular disease mortality in patients undergoing maintenance hemodialysis: Results of the MBD-5D study. Clin. Exp. Nephrol. 2017, 21, 797–806. [Google Scholar] [CrossRef]
  10. Okute, Y.; Shoji, T.; Hayashi, T.; Kuwamura, Y.; Sonoda, M.; Mori, K.; Shioi, A.; Tsujimoto, Y.; Tabata, T.; Emoto, M.; et al. Cardiothoracic Ratio as a Predictor of Cardiovascular Events in a Cohort of Hemodialysis Patients. J. Atheroscler. Thromb. 2017, 24, 412–421. [Google Scholar] [CrossRef] [PubMed] [Green Version]
  11. Jotterand, M.; Faouzi, M.; Dedouit, F.; Michaud, K. New formula for cardiothoracic ratio for the diagnosis of cardiomegaly on post-mortem CT. Int. J. Legal. Med. 2020, 134, 663–667. [Google Scholar] [CrossRef]
  12. Wittbrodt, M.T.; Espinoza, S.; Millard-Stafford, M.L. Biological variation of plasma osmolality obtained with capillary versus venous blood. Clin. Chem. Lab. Med. 2015, 53, 1613–1619. [Google Scholar] [CrossRef]
  13. Tanaka, S.; Nakano, T.; Tokumoto, M.; Masutani, K.; Tsuchimoto, A.; Ooboshi, H.; Kitazono, T. Estimated plasma osmolarity and risk of end-stage kidney disease in patients with IgA nephropathy. Clin. Exp. Nephrol. 2020, 24, 910–918. [Google Scholar] [CrossRef]
  14. Gennari, F.J. Serum osmolality. N. Engl. J. Med. 1984, 310, 1608–1610. [Google Scholar] [CrossRef]
  15. Morley, J.E. Dehydration, Hypernatremia, and Hyponatremia. Clin. Geriatr. Med. 2015, 31, 389–399. [Google Scholar] [CrossRef] [PubMed]
  16. Thomas, D.R.; Cote, T.R.; Lawhorne, L.; Levenson, S.A.; Rubenstein, L.Z.; Smith, D.A.; Stefanacci, R.G.; Tangalos, E.G.; Morley, J.E.; Dehydration, C. Understanding clinical dehydration and its treatment. J. Am. Med. Dir. Assoc. 2008, 9, 292–301. [Google Scholar] [CrossRef] [PubMed]
  17. Hooper, L.; Bunn, D.; Jimoh, F.O.; Fairweather-Tait, S.J. Water-loss dehydration and aging. Mech. Ageing Dev. 2014, 136, 50–58. [Google Scholar] [CrossRef] [Green Version]
  18. Andreoli, T.E. Water: Normal balance, hyponatremia, and hypernatremia. Ren. Fail. 2000, 22, 711–735. [Google Scholar] [CrossRef] [PubMed]
  19. Kanbay, M.; Yilmaz, S.; Dincer, N.; Ortiz, A.; Sag, A.A.; Covic, A.; Sanchez-Lozada, L.G.; Lanaspa, M.A.; Cherney, D.Z.I.; Johnson, R.J.; et al. Antidiuretic Hormone and Serum Osmolarity Physiology and Related Outcomes: What Is Old, What Is New, and What Is Unknown? J. Clin. Endocrinol. Metab. 2019, 104, 5406–5420. [Google Scholar] [CrossRef]
  20. Fasanella d’Amore, T.; Wauters, J.P.; Waeber, B.; Nussberger, J.; Brunner, H.R. Response of plasma vasopressin to changes in extracellular volume and/or plasma osmolality in patients on maintenance hemodialysis. Clin. Nephrol. 1985, 23, 299–302. [Google Scholar]
  21. Wallace, H.A.; Perera, T.B. Necrotizing Fasciitis; StatPearls Publishing: Treasure Island, FL, USA, 2021. [Google Scholar]
  22. Aykanat Girgin, B.; Gol, I. Reducing Pain and Fear in Children During Venipuncture: A Randomized Controlled Study. Pain Manag. Nurs. 2020, 21, 276–282. [Google Scholar] [CrossRef] [PubMed]
  23. Tummalapalli, S.L.; Chu, C.D.; Tuot, D.S. Avoiding Overuse of Venipuncture and Laboratory Testing in Hospitalized Patients on Hemodialysis. J. Patient Saf. 2020. [Google Scholar] [CrossRef]
  24. Chojnowska, S.; Baran, T.; Wilinska, I.; Sienicka, P.; Cabaj-Wiater, I.; Knas, M. Human saliva as a diagnostic material. Adv. Med. Sci. 2018, 63, 185–191. [Google Scholar] [CrossRef] [PubMed]
  25. Matczuk, J.; Zalewska, A.; Lukaszuk, B.; Knas, M.; Maciejczyk, M.; Garbowska, M.; Ziembicka, D.M.; Waszkiel, D.; Chabowski, A.; Zendzian-Piotrowska, M.; et al. Insulin Resistance and Obesity Affect Lipid Profile in the Salivary Glands. J. Diabetes Res. 2016, 2016, 8163474. [Google Scholar] [CrossRef] [Green Version]
  26. Kulak-Bejda, A.; Waszkiewicz, N.; Bejda, G.; Zalewska, A.; Maciejczyk, M. Diagnostic Value of Salivary Markers in Neuropsychiatric Disorders. Dis. Markers 2019, 2019, 4360612. [Google Scholar] [CrossRef] [PubMed] [Green Version]
  27. Maciejczyk, M.; Bielas, M.; Zalewska, A.; Gerreth, K. Salivary Biomarkers of Oxidative Stress and Inflammation in Stroke Patients: From Basic Research to Clinical Practice. Oxid Med. Cell. Longev. 2021, 2021, 5545330. [Google Scholar] [CrossRef]
  28. Maciejczyk, M.; Szulimowska, J.; Skutnik, A.; Taranta-Janusz, K.; Wasilewska, A.; Wisniewska, N.; Zalewska, A. Salivary Biomarkers of Oxidative Stress in Children with Chronic Kidney Disease. J. Clin. Med. 2018, 7, 209. [Google Scholar] [CrossRef] [PubMed] [Green Version]
  29. Flint, P.W.; Haughey, B.H.; Robbins, K.T.; Thomas, J.R.; Niparko, J.K.; Lund, V.J.; Lesperance, M.M. Cummings Otolaryngology: Head and Neck Surgery; Elsevier Health Sciences: Amsterdam, The Netherlands, 2021; pp. 1139–1148. [Google Scholar]
  30. Lu, Y.P.; Huang, J.W.; Lee, I.N.; Weng, R.C.; Lin, M.Y.; Yang, J.T.; Lin, C.T. A Portable System to Monitor Saliva Conductivity for Dehydration Diagnosis and Kidney Healthcare. Sci. Rep. 2019, 9, 14771. [Google Scholar] [CrossRef] [Green Version]
  31. Munoz, C.X.; Johnson, E.C.; Demartini, J.K.; Huggins, R.A.; McKenzie, A.L.; Casa, D.J.; Maresh, C.M.; Armstrong, L.E. Assessment of hydration biomarkers including salivary osmolality during passive and active dehydration. Eur. J. Clin. Nutr. 2013, 67, 1257–1263. [Google Scholar] [CrossRef]
  32. Smith, D.L.; Shalmiyeva, I.; Deblois, J.; Winke, M. Use of salivary osmolality to assess dehydration. Prehosp. Emerg. Care 2012, 16, 128–135. [Google Scholar] [CrossRef]
  33. Villiger, M.; Stoop, R.; Vetsch, T.; Hohenauer, E.; Pini, M.; Clarys, P.; Pereira, F.; Clijsen, R. Evaluation and review of body fluids saliva, sweat and tear compared to biochemical hydration assessment markers within blood and urine. Eur. J. Clin. Nutr. 2018, 72, 69–76. [Google Scholar] [CrossRef] [Green Version]
  34. Prager, D.J.; Bowman, R.L. Freezing-Point Depression: New Method for Measuring Ultramicro Quantities of Fluids. Science 1963, 142, 237–239. [Google Scholar] [CrossRef]
  35. Wang, Y.; Zhu, Z.; Li, H.; Sun, Y.; Xie, G.; Cheng, B.; Ji, F.; Fang, X. Effects of preoperative oral carbohydrates on patients undergoing ESD surgery under general anesthesia: A randomized control study. Medicine 2019, 98, e15669. [Google Scholar] [CrossRef] [PubMed]
  36. Rolls, B.J.; Wood, R.J.; Rolls, E.T.; Lind, H.; Lind, W.; Ledingham, J.G. Thirst following water deprivation in humans. Am. J. Physiol. 1980, 239, R476–R482. [Google Scholar] [CrossRef] [PubMed]
  37. Thompson, D.A.; Campbell, R.G. Hunger in humans induced by 2-deoxy-D-glucose: Glucoprivic control of taste preference and food intake. Science 1977, 198, 1065–1068. [Google Scholar] [CrossRef] [PubMed]
  38. Scott, M.C.; Winters, M.E. Congestive Heart Failure. Emerg. Med. Clin. N. Am. 2015, 33, 553–562. [Google Scholar] [CrossRef] [Green Version]
  39. Shotan, A.; Dacca, S.; Shochat, M.; Kazatsker, M.; Blondheim, D.S.; Meisel, S. Fluid overload contributing to heart failure. Nephrol. Dial. Transpl. 2005, 20 (Suppl. 7), vii24–vii27. [Google Scholar] [CrossRef] [Green Version]
  40. Ueki, R.; Okutani, R.; Saga, T.; Wada, T.; Tashiro, C. Fluid management after off-pump CABG in a patient receiving preoperative continuous ambulatory peritoneal dialysis. Masui Jpn. J. Anesthesiol. 2000, 49, 292–294. [Google Scholar]
  41. Buffington, M.A.; Abreo, K. Hyponatremia: A Review. J. Intensive Care Med. 2016, 31, 223–236. [Google Scholar] [CrossRef]
  42. Cao, Z.; Jia, Y.; Zhu, B. BNP and NT-proBNP as Diagnostic Biomarkers for Cardiac Dysfunction in Both Clinical and Forensic Medicine. Int. J. Mol. Sci. 2019, 20, 1820. [Google Scholar] [CrossRef] [PubMed] [Green Version]
  43. Konigsbrugge, O.; Lorenz, M.; Auinger, M.; Schmaldienst, S.; Klauser-Braun, R.; Kletzmayr, J.; Grilz, E.; Posch, F.; Antlanger, M.; Pabinger, I.; et al. Venous thromboembolism and vascular access thrombosis in patients with end-stage renal disease on maintenance hemodialysis: Cross-sectional results of the Vienna InVestigation of AtriaL fibrillation and thromboembolism in patients on hemoDIalysis (VIVALDI). Thromb. Res. 2017, 158, 59–64. [Google Scholar] [CrossRef] [PubMed]
  44. Gao, N.; Kwan, B.C.; Chow, K.M.; Chung, K.Y.; Leung, C.B.; Li, P.K.; Szeto, C.C. Measurements on the routine chest radiograph as prognostic markers in Chinese peritoneal dialysis patients. Clin. Nephrol. 2011, 76, 16–22. [Google Scholar] [CrossRef] [PubMed]
  45. Rhee, C.M.; Ayus, J.C.; Kalantar-Zadeh, K. Hyponatremia in the Dialysis Population. Kidney Int. Rep. 2019, 4, 769–780. [Google Scholar] [CrossRef] [PubMed] [Green Version]
  46. Kara, B. Determinants of thirst distress in patients on hemodialysis. Int. Urol. Nephrol. 2016, 48, 1525–1532. [Google Scholar] [CrossRef]
  47. Bossola, M.; Calvani, R.; Marzetti, E.; Picca, A.; Antocicco, E. Thirst in patients on chronic hemodialysis: What do we know so far? Int. Urol. Nephrol. 2020, 52, 697–711. [Google Scholar] [CrossRef]
  48. Sprick, J.D.; Nocera, J.R.; Hajjar, I.; O’Neill, W.C.; Bailey, J.; Park, J. Cerebral blood flow regulation in end-stage kidney disease. Am. J. Physiol. Renal. Physiol. 2020, 319, F782–F791. [Google Scholar] [CrossRef]
  49. Voroneanu, L.; Gavrilovici, C.; Covic, A. Overhydration, underhydration, and total body sodium: A tricky “menage a trois” in dialysis patients. Semin. Dial. 2018, 31, 21–25. [Google Scholar] [CrossRef] [Green Version]
  50. Singh, A.T.; Mc Causland, F.R. Osmolality and blood pressure stability during hemodialysis. Semin. Dial. 2017, 30, 509–517. [Google Scholar] [CrossRef]
  51. Vaduganathan, M.; Marti, C.N.; Mentz, R.J.; Greene, S.J.; Ambrosy, A.P.; Subacius, H.P.; Fonarow, G.C.; Chioncel, O.; Bazari, H.; Maggioni, A.P.; et al. Serum Osmolality and Postdischarge Outcomes After Hospitalization for Heart Failure. Am. J. Cardiol. 2016, 117, 1144–1150. [Google Scholar] [CrossRef] [PubMed]
  52. Shen, Y.; Du, K. Hyposmolarity may be also associated with worse outcomes in patients with heart failure. Int. J. Cardiol. 2017, 229, 53. [Google Scholar] [CrossRef]
  53. Bergomi, P.; Scudeller, L.; Pintaldi, S.; Dal Molin, A. Efficacy of Non-pharmacological Methods of Pain Management in Children Undergoing Venipuncture in a Pediatric Outpatient Clinic: A Randomized Controlled Trial of Audiovisual Distraction and External Cold and Vibration. J. Pediatric Nurs. 2018, 42, e66–e72. [Google Scholar] [CrossRef]
  54. Mima, A. Hemodialysis vascular access dysfunction: Molecular mechanisms and treatment. Ther. Apher. Dial. 2012, 16, 321–327. [Google Scholar] [CrossRef] [PubMed]
  55. Bindroo, S.; Quintanilla Rodriguez, B.S.; Challa, H.J. Renal Failure; StatPearls Publishing: Treasure Island, FL, USA, 2021. [Google Scholar]
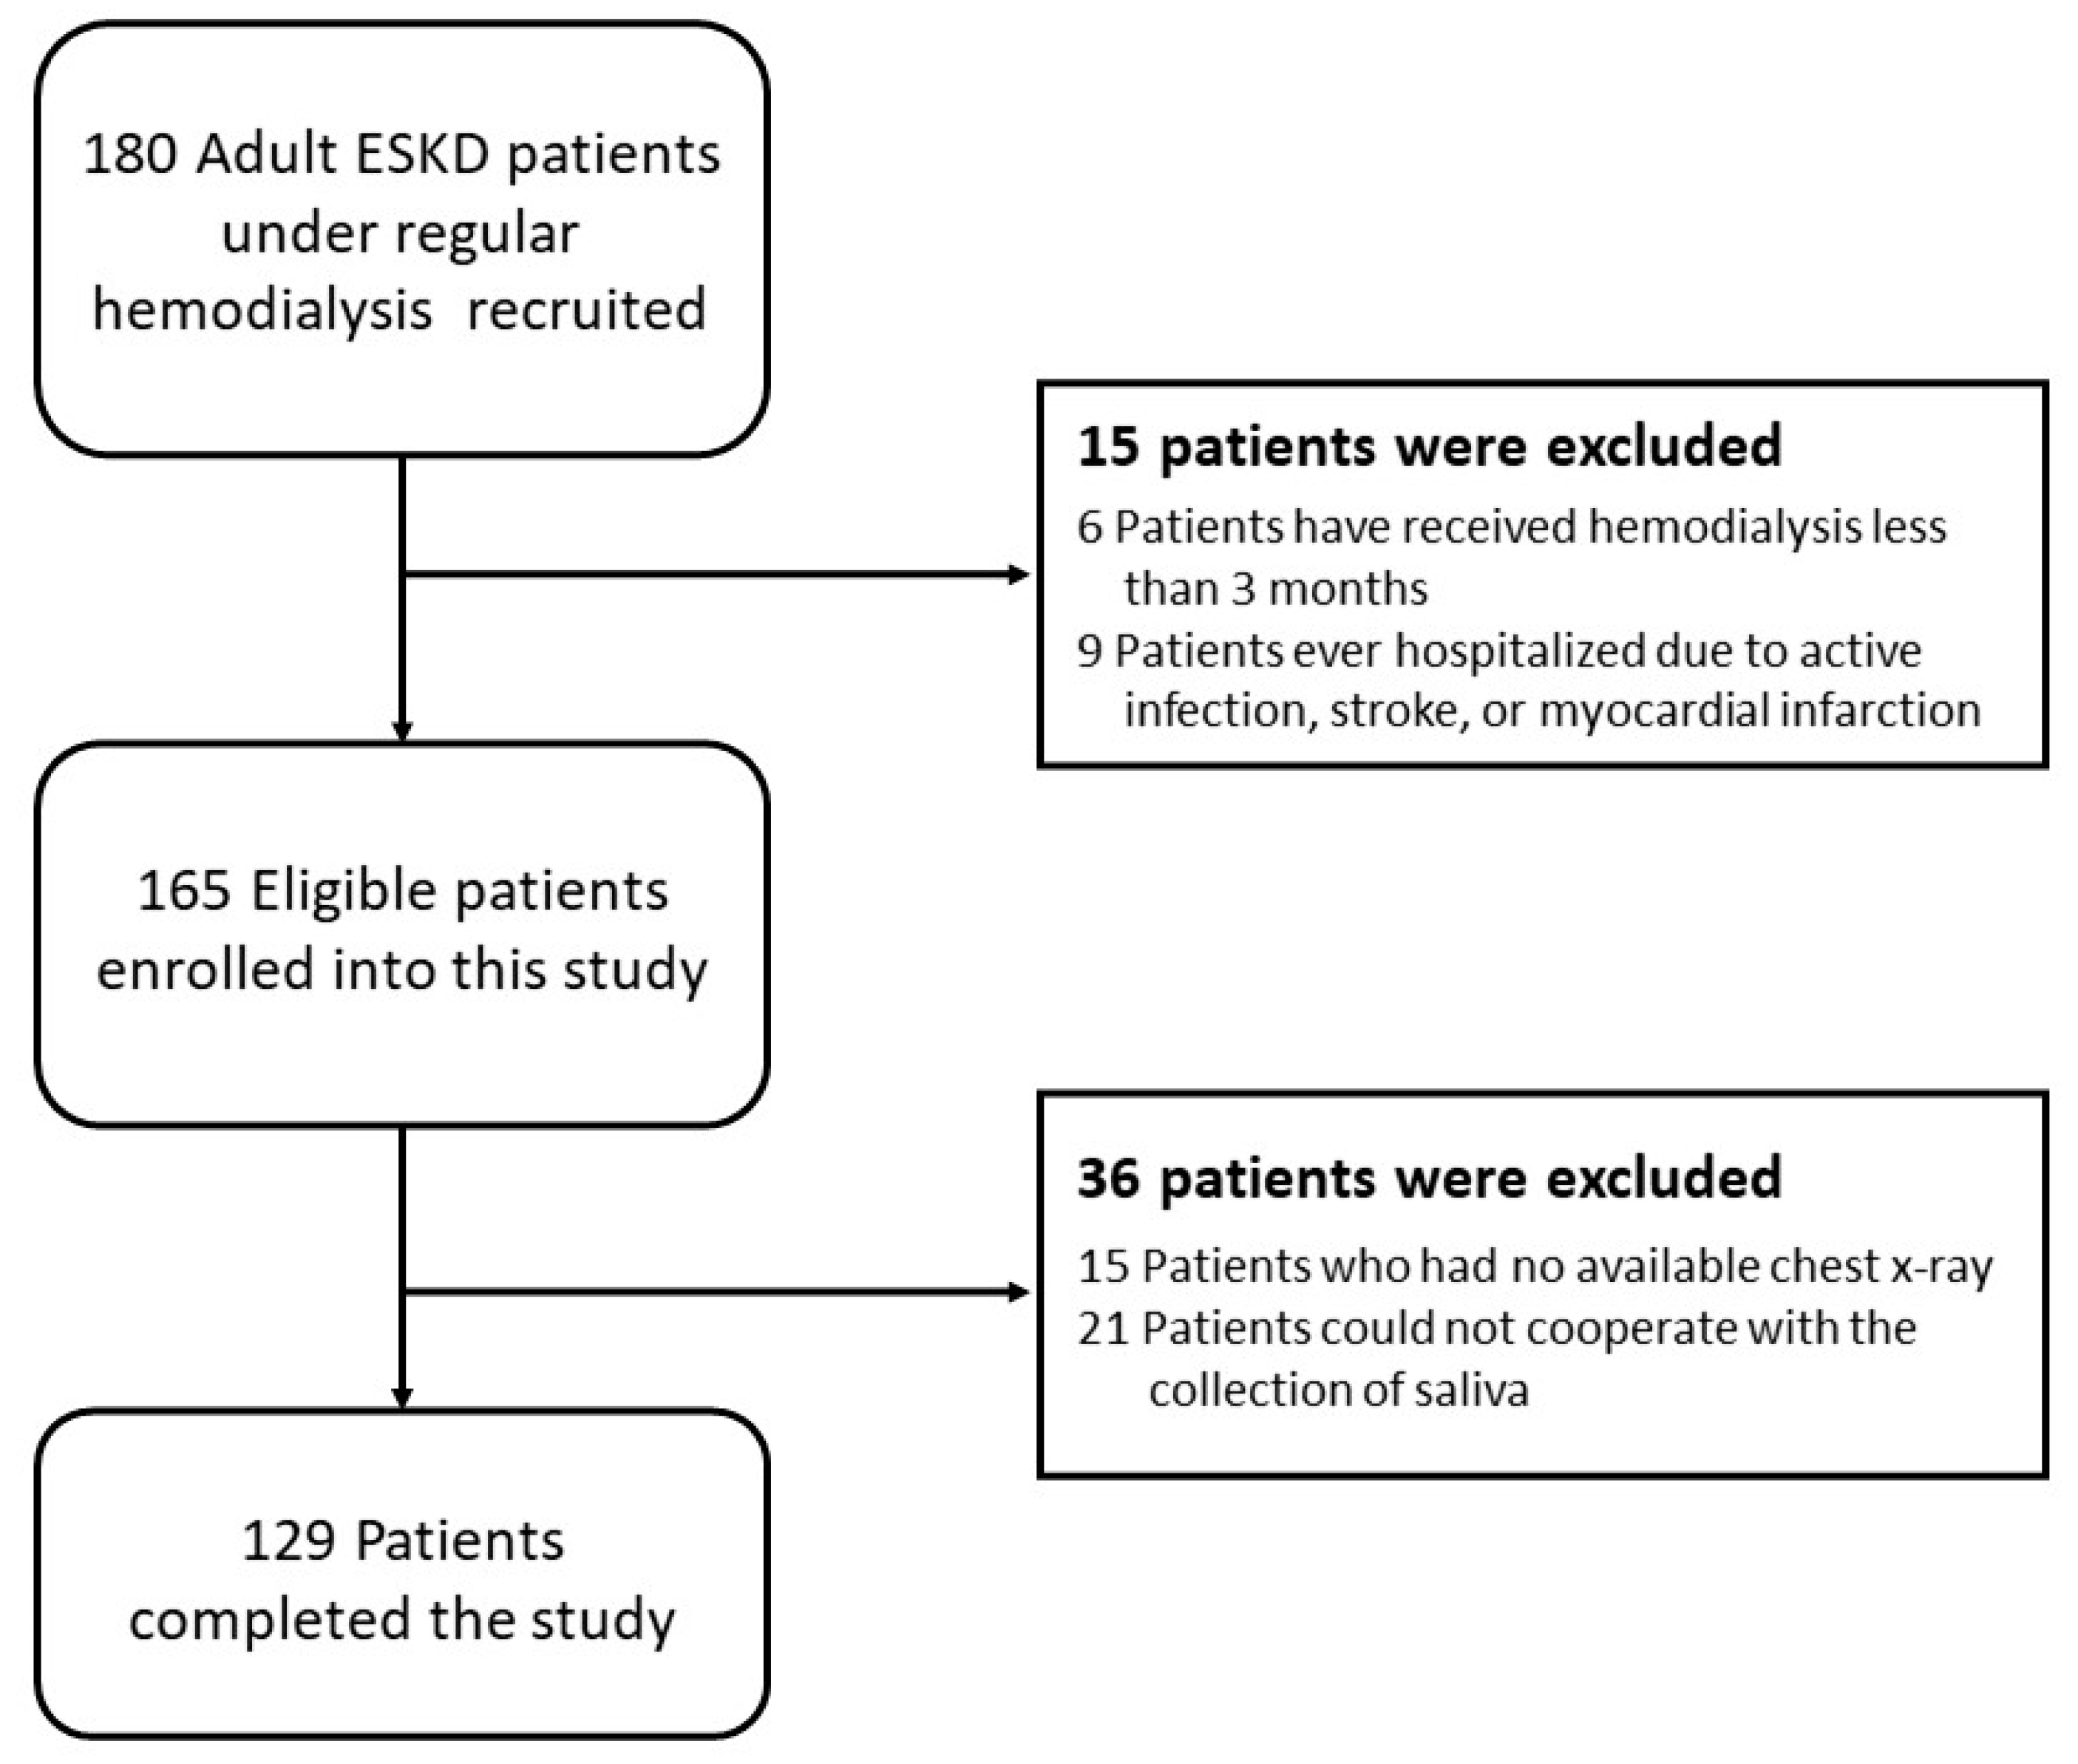
Figure 1. Flow chart of patient enrolment. The diagram shows the enrolment and status of patients. Abbreviations: ESKD, end-stage kidney disease.
Applsci 11 07405 g001
Figure 2. Protocol of the detection of salivary conductivity and serum osmolality.
Applsci 11 07405 g002
Figure 3. Distribution of cardiomegaly from low to high salivary conductivity groups. Patients were divided into low, middle, and high salivary conductivity groups according to the tertials of conductivity levels (range values: Low ≤ 6273.23 μs/cm; 6273.23 < Middle ≤ 8131.59 μs/cm; High > 8131.59 μs/cm). The number and percentage of patients with cardiomegaly were demonstrated in the bar chart (Chi-square = 5.296, p for trend: 0.021 *). Note: * p ≤ 0.05.
Applsci 11 07405 g003
Figure 4. The receiver operating characteristic curve analysis. The receiver operating characteristic curves were built from four prediction models for the diagnosis of cardiomegaly. The area under the ROC curve (AUROC) was equal to 0.626 (95% CI: 0.521–0.730, p = 0.02) when salivary conductivity was the predicting factor. The combination of salivary conductivity, serum sodium, and history of diabetes mellitus showed a significant increase in AUROC (0.782, 95% CI: 0.696–0.868). Abbreviations: AUC, area under the curve; DM, diabetes mellitus; Na, serum sodium; Osm, serum osmolality.
Applsci 11 07405 g004
Figure 5. The 3D scatter plot graph of the correlation among age, blood osmolality, and salivary conductivity.
Applsci 11 07405 g005
Table 1. Baseline characteristics of hemodialysis patients stratified by heart size (n = 129).
VariableAll Patient
(n = 129)
Non-Cardiomegaly
(n = 87)
Cardiomegaly
(n = 42)
p Value
Demographics
Age, years61.36 ± 11.3060.99 ± 11.7462.12 ± 10.430.60
Female sex, n (%)49 (38.0)30 (34.5)19 (45.2)0.24
Height, cm161.33 ± 8.30162.25 ± 7.91159.41 ± 8.830.07
Weight, kg66.49 ± 13.4167.38 ± 13.5364.65 ± 13.130.28
Underlying disease
Hypertension, n (%)120 (93.0)81 (93.1)39 (92.9)0.96
Diabetes mellitus, n (%)81 (62.8)54 (62.1)27 (64.3)0.81
Hyperlipidemia, n (%)63 (48.8)44 (50.6)19 (45.2)0.57
Gouty arthritis, n (%)37 (28.7)22 (25.3)15 (35.7)0.22
Coronary arterial disease, n (%)23 (17.8)16 (18.4)7 (16.7)0.81
Atrial fibrillation, n (%)10 (7.8)4 (4.6)6 (14.3)0.05 *
Liver disease, n (%)44 (34.1)29 (33.3)15 (35.7)0.79
Old stroke, n (%)12 (9.3)6 (6.9)6(14.3)0.18
Laboratory parameters
BUN, mg/dL68.25 ± 17.6768.94 ± 18.5366.83 ± 15.850.77
Creatinine, mg/dL10.44 ± 2.1610.60 ± 2.2410.10 ± 1.960.22
BUN/Cr ratio6.69 ± 1.746.63 ± 1.666.82 ± 1.900.66
eGFR, mL/min/1.73 m24.80 ± 1.264.80 ± 1.364.80 ± 1.050.43
Serum osmolality, mOsm/kgH2O310.35 ± 10.36311.56 ± 9.72307.83 ± 11.280.05 *
Glucose, mg/dL136.33 ± 73.49137.77 ± 78.24133.33 ± 63.280.85
Sodium, mEq/L136.80 ± 3.58137.25 ± 3.27135.88 ± 4.010.04 *
Potassium, mEq/L4.43 ± 0.784.39 ± 0.814.51 ± 0.740.41
Cardiothoracic ratio0.48 ± 0.060.45 ± 0.030.55 ± 0.04<0.01 *
Salivary conductivity, μs/cm7562.05 ± 2348.917833.52 ± 2372.986999.71 ± 2221.090.02 *
Thirst intensity scale scores
Thirst scale (VAS)3.26 ± 2.443.29 ± 2.353.19 ± 2.650.70
Thirst scale (CS)3.02 ± 1.463.07 ± 1.442.90 ± 1.530.50
Values are expressed as the mean ± standard deviation or number (percentage). Abbreviations: BUN, blood urea nitrogen; BUN/Cr ratio, blood urea nitrogen to creatinine ratio; eGFR, estimated glomerular filtration rate. Note: * p ≤ 0.05.
Table 2. Prediction of the cardiothoracic ratio from clinical data and salivary conductivity by multiple linear regression analysis.
Model 1Cardiothoracic Ratio
Standardized Beta Coefficient (Standard Error)tSignificance
Age, per year0.200 (0.000)2.1210.036 *
Salivary conductivity, μs/cm−0.203 (0.000)−2.2300.028 *
Serum sodium, mEq/L−0.130 (0.001)−1.4860.140
Serum potassium, mEq/L0.122 (0.007)1.3680.174
R2 = 0.30
Model 2Cardiothoracic Ratio
Standardized Beta Coefficient (Standard Error)tSignificance
Serum sodium, mEq/L−0.178 (0.001)−1.4860.044 *
R2 = 0.18
Parameters included in model 1: age, blood urea nitrogen, creatinine, salivary conductivity, glucose, and serum sodium and potassium levels. Parameters included in model 2: age, blood urea nitrogen, creatinine, glucose, and serum sodium and potassium levels. Abbreviations: BUN/Cr ratio, blood urea nitrogen to creatinine ratio. Note: * p ≤ 0.05.
Table 3. The relationship between salivary conductivity and clinical parameters by multiple linear regression.
Salivary Conductivity
Standardized Beta Coefficient (Standard Error)tSignificance
Age, per year0.309 (0.000)3.694<0.001 *
Serum osmolality, mOsm/kgH2O0.192 (0.000)2.3000.023 *
R2 = 0.35
Parameters included in the regression model: age, creatinine, serum osmolality, serum potassium level, and Thirst scale (VAS). Note: * p ≤ 0.05.
Publisher’s Note: MDPI stays neutral with regard to jurisdictional claims in published maps and institutional affiliations.