Article

Effects of Organic Additives on Chemical, Microbiological and Plant Pathogen Suppressive Properties of Aerated Municipal Waste Compost Teas

1
Ages s.r.l. s, Spin-Off Accademico, Università degli Studi della Basilicata, Viale dell’Ateneo Lucano, 10, 85100 Potenza, Italy
2
Consiglio per la Ricerca in Agricoltura e l’Analisi dell’Economia Agraria, Centro di Ricerca Orticoltura e Florovivaismo, via Cavalleggeri, 25, 84098 Pontecagnano Faiano, Italy
3
Degree Course of Agriculture, Dipartimento di Farmacia, Università degli Studi di Salerno, DIFARMA-UNISA, Via Giovanni Paolo II, 132, 84084 Fisciano, Italy
*
Author to whom correspondence should be addressed.
Appl. Sci. 2021, 11(16), 7402; https://doi.org/10.3390/app11167402
Submission received: 1 July 2021 / Revised: 5 August 2021 / Accepted: 5 August 2021 / Published: 12 August 2021
(This article belongs to the Special Issue Composts and Organic Wastes: Analytical Methods and Applications)

Abstract

:
The aim of the present study was to characterize the physical-chemical and microbiological features of aerated compost teas (CTs) extracted with dechlorinated tap water and with two different additives, molasses and whey, in increasing doses. Plant pathogen suppression properties of CTs were also taken into account. Total nitrogen in CTs increased with rising doses of the additives used. In spite of this, nitrogen and mineral element contributions were limited but complementary for plant mineral nutrition. Although total heavy metal contents in CTs were low, an increase of their bioavailable forms (ionic and chelated forms, presence in microorganisms) should be taken into account. In addition, the distribution on soil of acid and/or chelating products by CTs could increase the bioavailability of heavy metals, especially in the case of several annual distribution cycles and of medium–long term treatments. Additives modulated the structure and composition of microbial communities and CTs, exhibiting a broad spectrum of suppressive properties against plant pathogens, especially when they were used in a raw form.

1. Introduction

The need for a reduction in the environmental impacts of synthetic pesticides and the new trends dictated by the market for organically managed cropping systems, has renewed interest in agricultural practices of the past, based on natural products, such as compost teas (CTs), which have been found to be effective in the control of many plant diseases [1]. CT is defined as an organic liquid formulate, obtained by water extraction of a quality compost, continuative for a defined period, under aerated (aerated CT, ACT) or not aerated (non-aerated CT, NCT) conditions, with or without nutritional additives [2]. CT has been proposed to be applied to soil and/or to plants through irrigation systems, soil drenching, or foliar spray with different aims, including control of leaf and/or soil crop diseases; microbial augmentation for restoring or increasing beneficial telluric microflora able to promote soil health; stimulation of the general plant physiological performances; and nutrients supply [3,4,5,6,7,8,9].
This agro-technique has been used under organic and biodynamic farming since 1920 [10]. It is stated that CTs exert positive actions due to the presence of soluble organic molecules, such as humic substances (humic and fulvic acids). These molecules may have a direct effect on plant metabolic processes (i.e., radical bio-stimulation, photosynthesis, respiration, activation of enzymes, mineral nutrition) due to their hormone-like molecular structures [11,12,13]. In addition, the great amount and diversity of beneficial Prokarya and Eukarya microorganisms contained in bioactive CTs generally play a crucial role in crop protection, as well as in biostimulation and/or biofertilization [3,4,14,15,16]. Nutritional additives, such as rock dust, humic and fulvic acids, molasses, yeast extracts, fish and dairy byproducts, green algae and plant extracts, glucose, surcrose, starch, chitin, cellulose, wheat straw, etc., can be added into the extracting volume with the aim of significantly affecting the major microbial CT component by enriching population levels and conditioning their compositions and structures. In addition, the promotion of microorganism survival, as well as the improvement of plant pathogen suppression properties, occur when the additives are distributed on soil and/or plant surfaces [17,18]. Doubts have arisen on the use of CTs with nutritional additives for the treatment of crops to be destined for fresh markets. Several Authors [17,19,20,21] have highlighted the risks of this practice in favoring the regrowth of human pathogenic bacteria, such as Salmonella and Escherichia coli, causing problems for public health. On the other hand, this circumstance can be totally avoided by controlling the starting compost quality and the overall hygienic conditions occurring during the tea preparation process.
Available literature surveys revealed the necessity to further examine the effects of source materials (e.g., compost from livestock matrices), extracting media, and environmental conditions during the extraction process, on the quality of CT and, then, on its functionality [19,21].
This study is designed to assess the hypothesis that the use of additives will modulate CT quality, influencing their agronomical and crop defence properties. Thus, the present research aims to characterize the chemical-physical and microbiological quality of a set of aerated CTs, obtained through water-mediated extraction of a green/municipal waste compost, with two different additives, whey and molasses, at increasing concentrations. In detail, the content of mineral elements and total heavy metals, pH and EC during the extraction process, the main microbial population, the functional biodiversity and pathogen suppression capacity, were assessed. This information can be useful to fill the gaps in the literature and provide scientific value to a practice that usually shows an empirical and extemporaneous character.

2. Materials and Methods

2.1. Extraction Procedure: Technical and Operative Details

CTs were produced at the laboratory of Basilicata University (Italy). The extraction process lasted 48 h and was realized in an extracting system by assembling the following components (Scheme 1): 50-L plastic containers (a); jute bags; a 24 L compressor (b); a 5 L compressor (c); a solenoid valve supplied with 24 V (d); 15 m of Ø 16 mm irrigation tube with T-shaped end (e); 20 m of Ø 6 mm micro-irrigation tube; a digital timer (220 V). The Ø 16- and 6-mm aeration tubes were pierced to obtain high air pressure to assure mixing and oxygenation of the extracting liquid during the process. The 24-L compressor was connected with the solenoid valve and provided air flow to the largest diameter tubes (turbulence effect) (Scheme 1f). The planned turning on of the solenoid valve by the digital timer allowed air injection for 5 min every three hours. The 5-L compressor was connected to an air distributor (Scheme 1g) made up of a 16-mm pipe, on which 6-mm pipes were connected using adapters. During the extraction process the 5-L compressor provided air to the smallest diameter tubes which, placed in the container according to a spiral arrangement, generated a “sparkling” effect (Scheme 1h). Each jute bag with filter function was filled with 7 L of compost, sealed at the top and immersed in a container filled with additives and dechlorinated tap water. Dechlorination (removal of chlorine used to disinfect tap water) was carried out by bubbling water for at least 20 min. This caused the chlorine to be released as a gas.

2.2. CTs in Comparison

CTs were obtained using a commercial municipal waste compost (COMPOSTA, Gesenu S.p.A. Perugia, Italy) authorized for the use in organic agriculture and finely screened (at 1 cm) in order to make it homogeneous. Compost came from composting of the humid fraction of urban wastes, and ligninic and cellulosic materials from maintenance of green urban areas. As requested by Italian law concerning fertilizers [22], the used compost was free from pathogenic bacteria (specifically Salmonella and Escherichia coli). Compost was extracted in a 1:5 ratio solution (v:v) with the addition of whey or molasses, as follows:
  • CT-Wa = 7 L of compost + 35 L of dechlorinated tap water
  • CT-Wh1 = 7 L of compost + 3 L of whey + 32 L of dechlorinated tap water
  • CT-Wh2 = 7 L of compost + 5 L of whey + 30 L of dechlorinated tap water
  • CT-M1 = 7 L of compost + 105 g of molasses + 35 L of dechlorinated tap water
  • CT-M2 = 7 L of compost + 175 g of molasses + 35 L of dechlorinated tap water
  • CT-M3 = 7 L of compost + 350 g of molasses + 35 L of dechlorinated tap water
Whey (Wh) is a waste product of the dairy industry from the process of ricotta production and was provided from a local cheese factory. Molasses (M) is a discarded by-product obtained from the sugar beet transformation process: a fluid commercial product, allowed in organic farming, was used in this research. The major chemical characteristics of the starting materials used to produce the different CTs are reported in Table 1.

2.3. Chemical Analyses

2.3.1. Electrical Conductivity and pH

Electrical conductivity (EC) and pH were measured using a Crison 525 conductivimeter (Crison, Barcelona) and a Hanna Instruments HI 223 pH meter, respectively. Measurements were performed by immersing the probes in the CTs at the beginning of the extraction period (t0) and, then every 30 min for the first five time points, and each hour for the remaining part of the experiment, which lasted 48 h (except at night). In particular, measurements were carried out immediately after air insufflation, which produced a turbulence effect, in order to guarantee correct homogenization of the extract.
EC and pH were also measured in the final CTs diluted at different ratios (1:2; 1:4; 1:6; 1:8 vol.) with dechlorinated tap water, in order to evaluate CTs non-harmful use for crop fertigation under open field conditions.

2.3.2. Total Organic Carbon, Humic and Fulvic Acids

Total organic carbon (TOC), as well as humic and fulvic acids (HA and FA, respectively), were determined in the CTs sampled after 24 and 48 h of extraction, according to the official Italian method for compost analyses [23]. Particularly, for TOC measurements, potassium dichromate (K2Cr2O2) and concentrated H2SO4 were added to 10 mL of extract. After 10 min, distilled water was added to the solution to halt the digestion process. An indicator solution (barium diphenylamine sulfonate) was added to the digestate and then the excess Cr2O72− was titrated with ferrous ammonium sulfate (Möhr salt).
HA and FA were separated from 100 mL of the extract added with 1 mL of 50% sulphuric acid; the solution was stirred and left to stand for 30 min. Then, the sample was centrifuged at 3000 rpm for 20 min. After the centrifugation, the solid pellet, including insoluble HA under acid conditions, was suspended with 100 mL of distilled water and stored at 4 °C for subsequent analyses. The supernatant was poured into a polyvinylpyrrolidone column that was previously prepared. The column was washed five times with aliquots of 20 mL of 0.005 M H2SO4. The yellowish eluate coming out to the column was removed (the non-humified fraction). After these washings, the FA adsorbed on the resin at the upper end of the column were removed by slowly eluting aliquots of NaOH 0.5 M and collected in a 100-mL flask.
Humified organic carbon was determined in the two collected fractions (HA and FA). In particular, 10 mL was added with 5 mL of K2Cr2O7 2N and 20 mL of concentrated H2SO4. The mixture was kept at 160 °C for 10 min. Then, distilled water was added to stop the reaction. The excess potassium dichromate was measured out by Möhr salt titration in the presence of a diphenylamine indicator.

2.3.3. Total and Ammonia Nitrogen

Total (Total-N) and ammonia nitrogen (N-NH4) were analyzed in the CTs sampled at the end of the extraction procedure (48 h) by means of Kjeldahl method.
For Total-N determination, concentrated sulfuric acid and catalysts were added to 10 mL of extract. The solution was subjected to a gradual heating, up to a temperature of 360 °C, and maintained at this temperature for 3 h (until the sample became clear and colorless). Then, solution was alkalized with sodium hydroxide (40%) and distilled in a vapor stream. The distillate was collected in a solution of boric acid (1%) and titrated with HCl 0.05 N with few drops of bromocresol green–methyl red mixture.
Ammonia nitrogen was determined directly with 10 mL of non-mineralized extract.

2.3.4. Heavy Metals, Alkali Metals and Alkaline Earth Metals

Heavy metals, alkali metals, and alkaline earth metals (Cd, Cr, Cu, Fe, Ni, Pb, Zn, Na, K, Mg, Ca) were analyzed on the starting materials (tap water, whey, and molasses) (Table 1) and the resulting CTs were sampled at the end of the extraction procedure. Ten milliliters of such material was previously subjected to an acid digestion at rising temperature steps, using a microwave oven (Milestone). Metal concentrations were determined in the extracts using an ICP-OES spectrometer (iCAP 6000 Series, Thermo Scientific, Waltham, MA, USA).
The enrichment factor was calculated as the ratio between the individual metal content in each final CT and the content in the correspondent extracting solution (tap water or tap water with the addition of additives, molasses and whey, in different quantities):
Enrichment   factor   = Metal   content   in   the   final   CT Metal   content   in   the   extracting   solution
The sodium adsorption ratio (SAR), as a salinity indicator, was calculated for the final CTs, according to the following formula:
S . A . R . = Na + 1 2 ( Ca 2 + + Mg 2 + )
where Na, Ca and Mg are expressed in meq L−1.

2.4. Microbiological Analyses

2.4.1. Counting of Microbial Populations in CTs

The abundance of culturable filamentous fungi, yeast, total bacteria, spore-forming bacteria, and pseudomonads in CTs was determined by the serial ten-fold dilution method [24]. Fungi were counted on PDA (Oxoid, Wesel, Germany) pH 6.0, amended with 150 mg L−1 of nalidixic acid and 150 mg L−1 of streptomycin. Yeast was counted on rosebengal medium (Oxoid) amended with 0.1 g L−1 of chloramphenicol (Oxoid). Total bacteria were counted on selective medium (glucose 1 g L−1, proteose peptone 3 g L−1, yeast extract 1 g L−1, K2PO4 1 g L−1, agar 15 g L−1) with actidione (cycloheximide) 100 mg L−1. Pseudomonads were counted on selective agar medium without iron, with added actidione [25]. Finally, spore-forming bacteria were counted by plating ten-fold dilution of CTs suspensions on nutrient agar [26], previously heated at 90 °C for 10 min. Population densities are reported as c.f.u. mL−1 (colony-forming unit) of CT.

2.4.2. Biolog Analyses and Bacterial Community Levels of Physiological Profiles

Bacterial community levels of physiological profiles (CLPPs) were assessed by using the Biolog® ECO microplatesTM system (Biolog Inc., Hayward, CA, USA). Aliquots (100 μL) of each CT (sampled at the end of the extraction process) diluted at 10−3 were inoculated in each well. The plates were incubated at 25 °C for 4 days and color development in each well was recorded daily as optical density at 590 nm using a Bio-Rad Microplate Reader 550 (Biorad, Hercules, CA, USA). Measures were carried out in triplicate. Average well color development (AWCD) and Shannon index (H’) were determined, as described by Pane et al. [27]:
AWCD = Σ   ( Ai Ac ) 31
where Ai is the absorbance value in the ith well and Ac is the absorbance in the control (blank).
  H = Σ Pi   LnPi
where Pi is the ratio between the absorbance value in the ith well and the total absorbance values of all the wells.
The AWCD data were used to develop the Boltzmann function.
The variability coefficient (VC) was calculated as follow:
VC = SD mean   ×   100  
where SD is the standard deviation.

2.4.3. In Vitro Suppression Assay of CTs

Fungi used in this assay were: Alternaria sp., Botrytis cinerea, Colletotrichum lindemuthianum, Fusarium oxysporum f. sp. lycopersici, Fusarium semitectum, Fusarium solani, Pyrenochaeta lycopersici, Rhizoctonia solani and Verticillium dahlie, which were maintained on potato dextrose agar (PDA) medium at 20 °C. In vitro suppression by CTs was evaluated on samples recovered after 48 h from the start of the extraction process, and was carried out using the well-cut diffusion technique [27] with modifications. Twenty milliliters of sterile PDA medium were poured into 90 mm plates and, after solidification, four wells were then punched out using a 0.5 cm sterile cork borer, orthogonally, on the edge of each plate. Each of the well bottoms was sealed with two drops of sterile water agar. One hundred microliters of different diluted teas were transferred into each well, and sterile water was placed in the wells of the control plates. One disc (0.5 cm) of mycelium of each fungus was inverted and placed centrally between the wells on PDA medium. All plates were incubated at 25 °C, until the mycelium reached the wells in water-amended control plates. After incubation, the radius of the clear zone around each well was measured linearly.

2.4.4. Rhizoctonia Disease Suppressiveness Assay by CTs

One-month-old kohlrabi (Brassica oleracea var. gongylodes) nursery seedlings, were used to screen the in vivo CT suppressive ability. Pots (20 cm diam.) filled with sterile peat were inoculated with R. solani-infected common millet seeds prepared, as described by Pane et al. [28], at 0.5% (w/w, dry weight). Non-inoculated common millet was added to healthy control pots. Five pots per treatments were used and five plants/pot were transplanted and drenched with 100 mL of 1:10 water diluted CT each. The treatments included the six CTs sampled at 48 h from the start of extraction, one healthy control and one non-treated infected control. The pots were then placed in a growth chamber (25 °C) in a completely randomized experimental design. After three weeks, the number of symptomatic plants per pot was measured to calculate disease incidence as percentage of diseased plants. The total fresh and dry weight of plants per pot (g pot−1) was also recorded. The assay was repeated.

2.5. Phytotoxicity Assays

Assays on seed germination and root growth inhibition [29] were carried out to determine the phytotoxicity effects of the six CTs sampled after 24 and 48 h from the start of extraction. Seeds of three dicotyledonous plants, Cucumis sativus L., Lepidium sativum L. and Solanum lycopersicum L., were used. Five replicates for each CT were tested. For each species, ten seeds were placed in 10 cm Petri dishes, containing 10 mL of CT diluted with water in a 1:3 ratio (v:v; CT: water) and a paper filter. The control was performed in five replicates, using ultrapure water. The seeds were incubated for 72 h in a dark environment at 25 °C. At the end of the test, the germinated seeds were counted and their root extensions were measured using standard procedures. The germination index (GI) was then calculated by multiplying the average of the germinated seeds and the average of root elongation at the end of the test. The percentage of GI (GI%) was determined as the percentage of the ratio between the GI of the sample and the GI of the control:
GI % = GI   sample GI   control   ×   100  

2.6. Statistical Analyses

Statistical analysis of the data (ANOVA) was carried out using Sigmastat 3.1 SPSS Inc. software. Means that were statistically different were separated according to Duncan’s multiple range test at p < 0.05.

3. Results

3.1. Substrates and Additives Characteristics

Chemical and physical features of the compost and the additives used to produce CTs are reported in Table 1. Whey showed acid pH values, low N content and TOC content higher than that shown by molasses (33 g kg−1 versus 10 g kg−1). Differently, molasses had an alkaline reaction and showed a N concentration equal to 3%. Differences among additives were observed, even in metal concentrations. Molasses showed higher metal contents than whey, except for Fe. On the other hand, considering the total amounts of constituents used to produce the different CTs, whey supplied higher amounts of metals than molasses with the exception for Mn and Zn (Table 2).

3.2. Evolution of the Measured Parameters during the Production Process of CTs

3.2.1. Electrical Conductivity and pH

During the extraction process, the temperature of all CTs was around 19 °C (as the room temperature). EC and pH during the extraction process (0 h, 24 h and 48 h from the start of the process) are reported in Table 3.
From the start to the end of CTs extraction, pH values showed a slight increasing trend in both CT-Wa and in all the CTs obtained with molasses addition (Table 3). CT-Wh1 and CT-Wh2 pH decreased from 0 to 24 h to then reach values close to the starting ones.
Marked differences were observed for EC from 0 h to 48 h (Table 3). A more detailed description of the EC pattern is displayed in Figure 1. Particularly, it evolved according an exponential model (sigmoidal) for all the CTs, even if it showed (just after 24 h) growing values according to the following sequence CT-Wh2 > CT-M3 > CT-Wh1 > CT-M2 > CT-M1 > TC-Wa. The same sequence was also observed after 48 h (Figure 1).

3.2.2. Total Organic Carbon, Humic and Fulvic Acids

The organic components measured after 24 and 48 h from the start of the extraction process, are reported in Table 3. By comparing the two sampling points, CT-Wa, CT-Wh1 and CT-Wh2 showed similar TOC values, while TOC decreased in molasses-added CTs after 48 h of extraction. Different behavior was followed by the humic-like substances, which decreased along with time in CT-Wa and CT-M1, whereas it increased in CT-Wh1, CT-M2 and CT-M3. In these cases, the humic fraction showed a greater weight on the value of TOC. CT-Wh2 had the highest content of humic-like substances (Table 3).

3.3. Final Characteristics of the Obtained CTs

3.3.1. Chemical Features of the Final CTs and Their Dilutions

The chemical characteristics of the final CTs are reported in Table 4. With respect to the pH values, Wh-CTs could be classified as acid to sub-acid. The pH of the remaining CTs showed an alkaline reaction. EC of the final CTs ranged from 4.45 to 8.20 mS cm−1, resulting particularly high and not suitable for a direct agronomical application of CTs.
SAR, as a salinity index, ranged from a minimum of 2.4, measured for CT-Wh2, to 8.1 for CT-M3 (Table 4).
In all CTs, total N content showed an increasing trend with respect to the concentration measured in CT-Wa. Such increases were proportional to the applied doses of additives. Total N concentrations ranged from 97 mg L−1 measured in CT-Wa to 288 mg L−1 found in CT-M3 (Table 4). On average, N-NH4+ represented 22% of the total N, ranging from a minimum of 15% and a maximum of 26%.
Whey CTs showed the highest TOC contents followed by the molasses ones and finally CT-Wa (Table 4). The lowest HA + FA value was observed for the CT-Wa which accounted for a low TOC to HA + FA ratio (1.66%). The humified fraction ranged from 0.25 to 0.66 g L−1 for the other CTs (Table 4) which showed decreasing TOC to HA + FA ratios, according to the following sequence CT-M1 < CT-Wh2 < CT-Wh1 < CT-M2 < CT-M3.
A general increase in the metals concentration was observed in all CTs with additives compared to the CT obtained only with water addition (Table 4). Such evidence was confirmed by the enrichment factors of the CTs, calculated as the ratio between the heavy metal concentration in CT and the concentration in the corresponding extracting solution (Table 5). Such findings underline the high extractive capacity of metals from the compost.
Figure 2 shows pH and EC values measured in the CT diluted with tap water. The CTs seemed well buffered at all the dilutions examined. All the extracts at dilution ratio 1:4 (CT to water) showed EC ranging from 1 and 2 mS cm−1. Such EC values are opportune for agronomical purposes (CT distribution by means of an irrigation system).

3.3.2. Microbiological Features

Microbial counting revealed the effects of additives in changing the levels of the culturable populations, as shown in Table 6. Whey CTs showed the highest level of fungi Log CFU, while yeast population were higher in CT-M1, followed by CT-W2, than the others. Total bacteria population levels were significantly increased by both additives compared to CT-Wa, with a pattern that only for whey was increasing in a dose-dependent manner. Microbial population consistency revealed that fungi-to-bacteria and fungi-to-yeast ratios were higher in whey CTs, while yeast-to-bacteria ratio was fluctuating around the control value (Table 6). Bacillus spp. were not affected by additives, contrary to what happened for the others, which showed significant increases. For example, Pseudomonas spp. were higher in whey-amended CTs.
Additives significantly influenced the assessed community levels of physiological profiles (Table 7). The indexes describing the metabolic diversity, such as H’ and VC, increased by the addition of additives: molasses, in particular, induced highest increments that were directly linked to the dose that was applied. The general metabolic activity, described by Boltzmann transformation of BIOLOG AWCD, indicated a similar behavior (Table 7).

3.4. CTs Fungal Pathogen Suppressiveness

All raw CTs exhibited in the plate diffusion assays, variable levels of fungal growth inhibition (Table 8). Plate experiments showed a reduction of mycelial development that ranged between 61 and 21%, with a global value that are, on average, around 45%. Although, additive type and dose and dilution interact significantly (MANOVA) with in vitro CTs suppression, all these factors did not give univocal effects. Therefore, no consistent characterizing trend could be deducted. Sterilized teas, on the contrary, has not produced any inhibition hole; therefore, they proved to be ineffective in fungal growth reduction (data not shown).
In vivo assay showed that CTs significantly reduced the detrimental effects of the fungal pathogen Rhizoctonia solani on cabbage (Figure 3). Although CT-Wh1 treatment proved higher control activity, there were no differences among CTs.

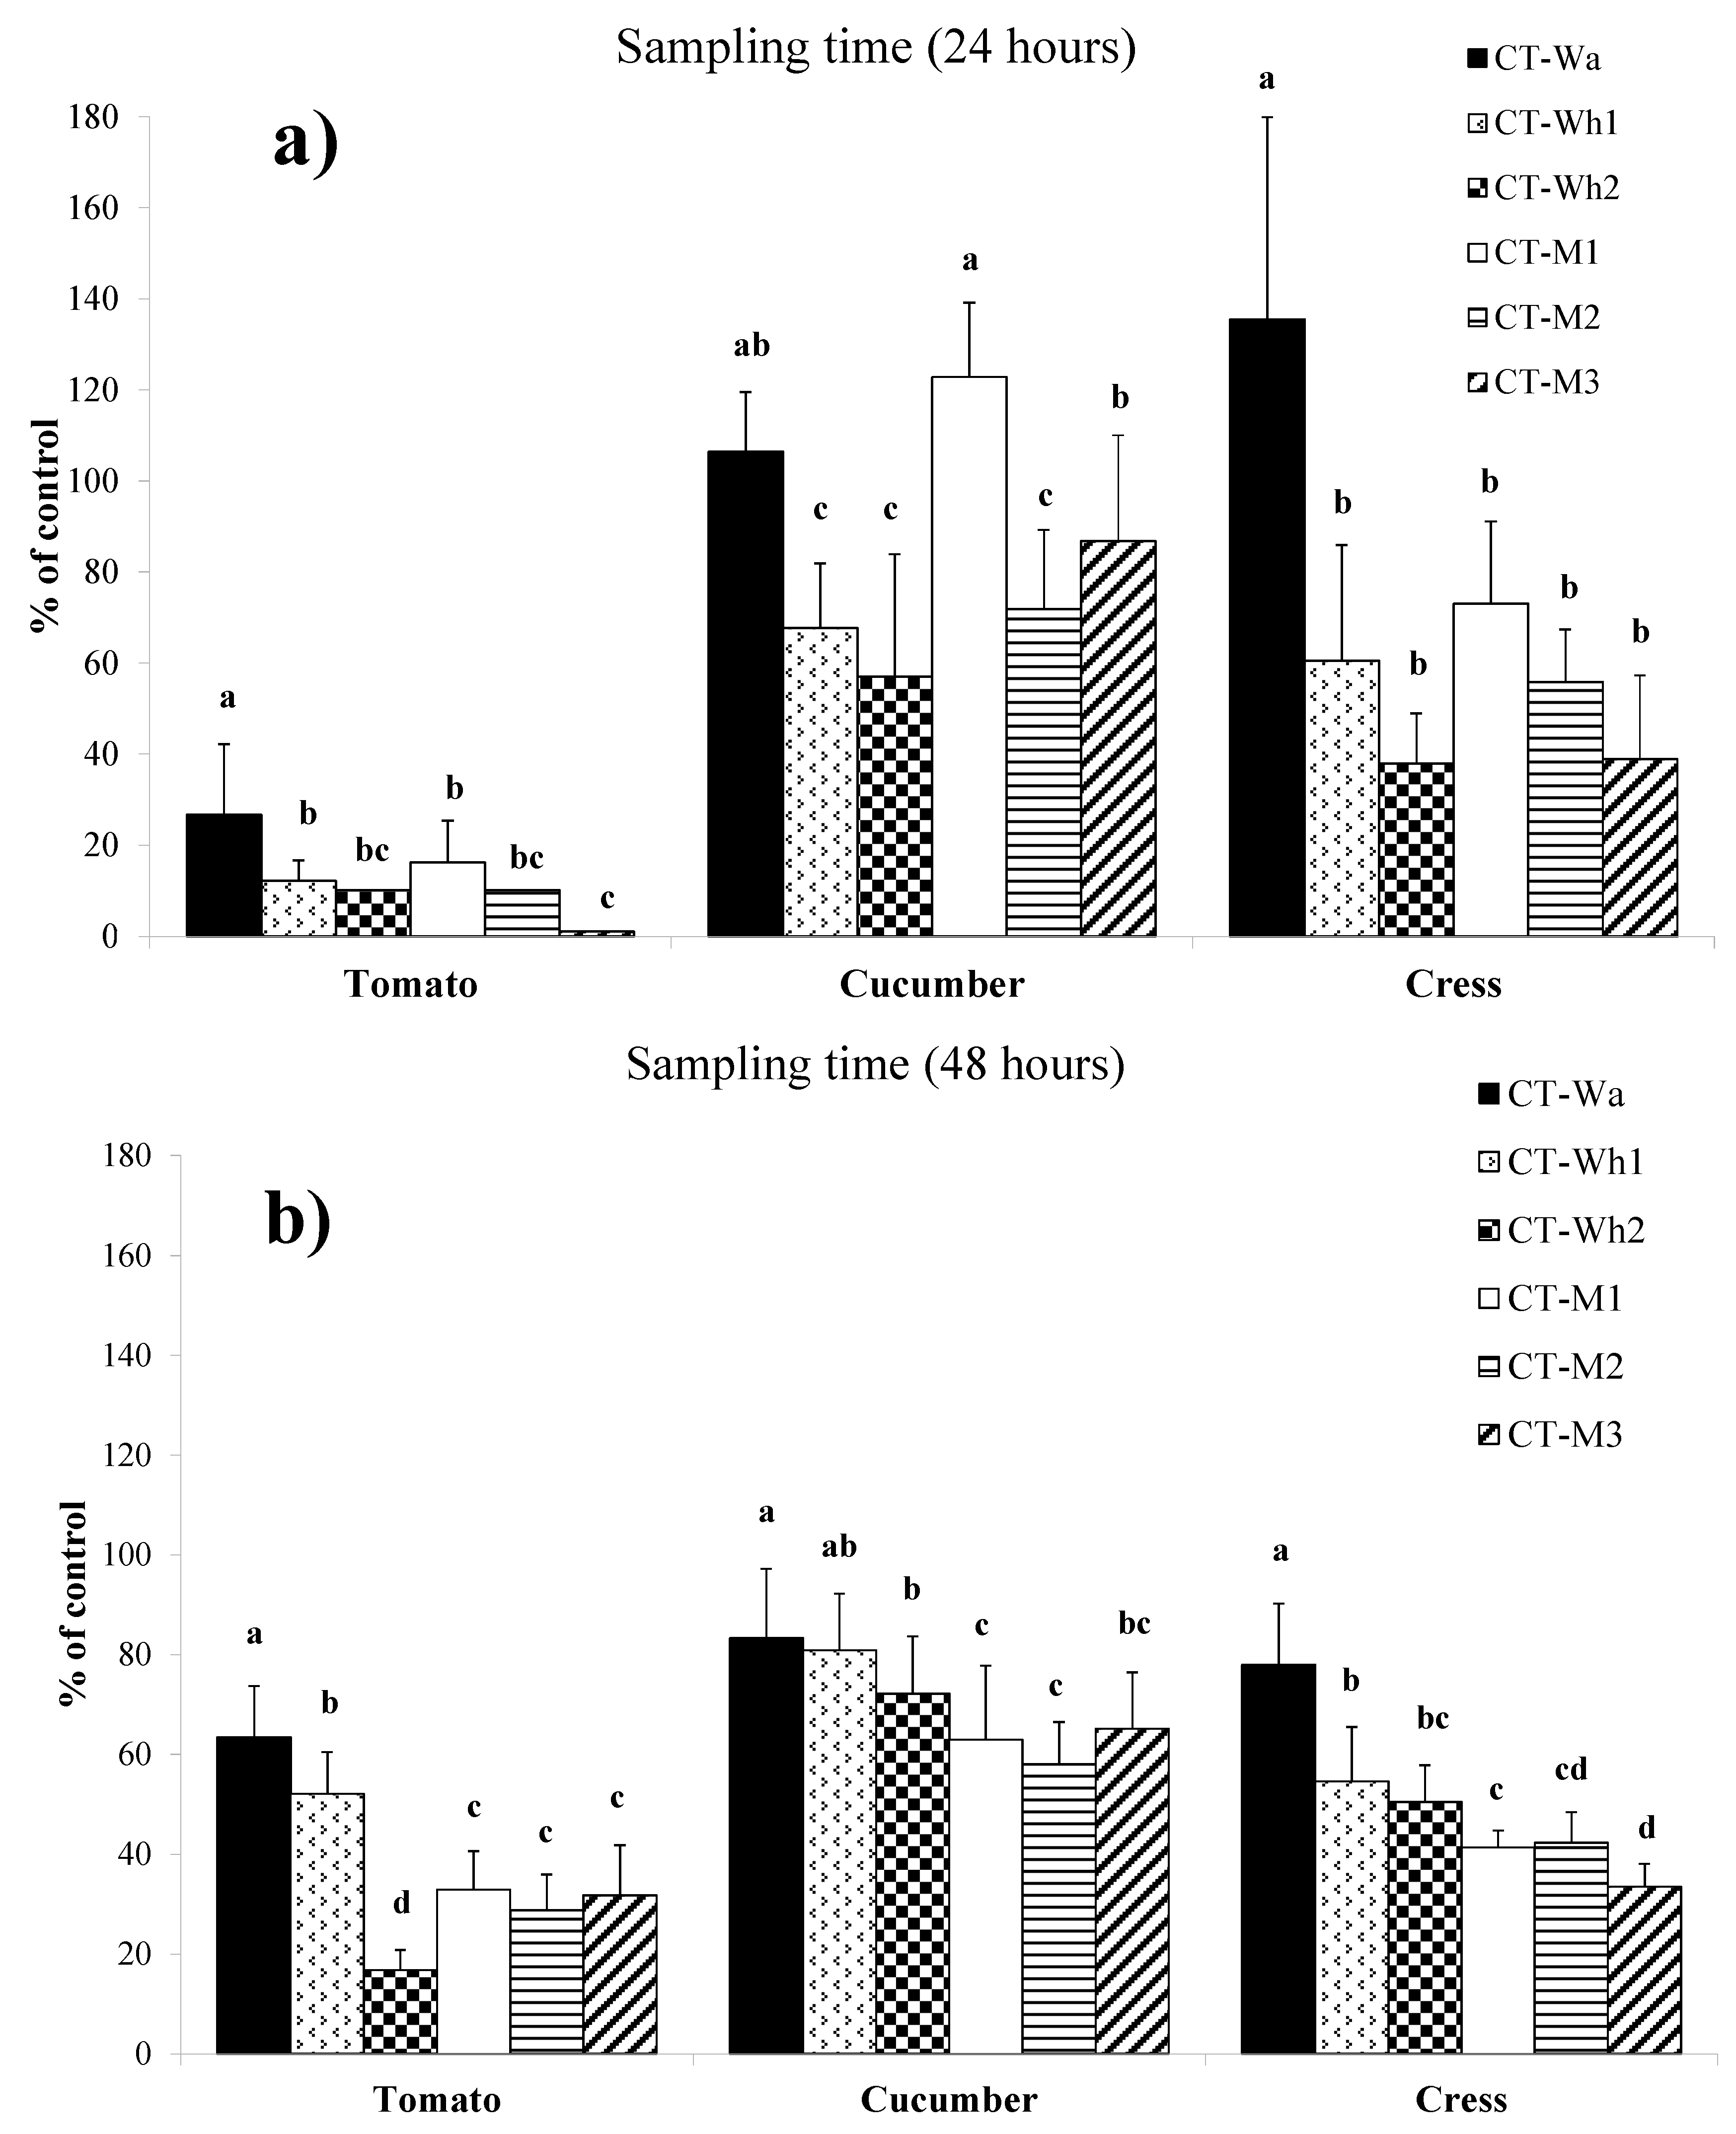
3.5. Phytotoxicity Assays on Seeds

Figure 4 shows the effects of the application of the different CTs, sampled after 24 and 48 h from the beginning of the extraction, on the GI% of seeds of cucumber, cress, and tomato. Such an index allowed to synthetically evaluate the action of CTs on seed germination and root extension, which are physiological processes particularly sensitive to phytotoxic agents. Generally, CT-Wa was the least phytotoxic among the extracts: all species treated with CT-Wa showed the highest GI values, except in the case of cucumber treated with CT-M1 (Figure 4). In most cases, GI% decreased in treatments with higher additives concentrations in both sampling moments (24 and 48 h) even if these differences were not always statistically significant (Figure 4). With respect to the control, species responses to CTs applications were more evident in 24 h samples (Figure 4). A particular behavior was observed for tomato seeds, which showed a higher GI% values when they were treated with CTs after 48 h of extraction (Figure 4).

4. Discussion

In this study a quality commercial compost, suitable for use in organic agriculture as an amendment, was used to obtain CTs brewed with the addition of whey and molasses. These two by-products of the food transforming chain were used as additives, at different concentrations, to provide feeding sources for CT microbial populations.
The chosen additives showed different chemical characteristics (i.e., molasses had higher pH values, N and heavy metal concentrations than the whey, which had greater TOC content), which supposedly affected the quality of the produced CTs, together with the applied doses and the duration of the extraction process. In particular, a 48 h-extraction duration was chosen with an intermediate sampling at 24 h, with the aim to cover the optimal brew time range and to observe maximum microbial activity in CTs [17].
The combination of the different starting feedstock (compost and additives) influenced pH and EC of CTs during the extraction process. This in accordance with what found by Kim et al. [30] after 2-day incubation of four types of aerated CTs. The low pH values showed by the whey CTs, especially after 24 h, could have an acidifying and potentially toxic effect on crops and increase the availability for absorption of heavy metals into the soil. Furthermore, the low pH of the whey CTs could accelerate irrigation system corrosion in fertigation applications. Conversely, a gradual increase of pH was shown by the CTs made using molasses, evidently due to its alkaline pH values. As reported by Schlegel [31], pH can strongly affect development of the microbial population. Acid pH measured in whey CTs probably favored growth of the fungal populations with respect to the bacterial groups. Caballero et al. [32] assessed the biostimulating properties of a fermented whey putatively associated to lactic acid, peptides, and free amino acids, with the further effect to lead microbial changes towards biocontrol active populations.
EC values in the experimental CTs, ranging from 4.45 to 8.20 mS cm−1 (Table 4), were well over the maximum threshold indicated for an irrigation water acceptable and usable without restriction [33], suggesting the need of the CT’s dilution. Kim et al. [30] recorded significantly increased EC values of aerated CTs sampled after 1-day incubation, resulting in phytotoxic effects on cress seed germination, a species known to be highly sensitive to salt stress. In the current work, cress GI was negatively correlated to CTs electrical conductivity in both sampling points. An inverse behavior was observed on tomato seeds, which showed increased germination when treated with the CTs sampled after 48 h. This finding suggests further investigations on such a germination response.
With respect to the CTs dilutions, it seems that the best compost-to-water ratio for agronomical utilization was 1:4 for all the CTs produced. Such ratio assured EC values ranging from 1 to 2 mS cm−1, which can be suitable for crop fertigation.
The suitability of CTs for soil treatment can be evaluated by means of both salt amounts and salt quality (especially the ratio among cations, Na+, Ca2+, Mg2+, in solution). SAR indicates sodium activity in CTs and how it can participate in the exchange process, which occurs in the soil in antagonism with calcium and magnesium. SAR showed by the CTs in comparison falls within the usual range in irrigation water [33]. As recommended by many Authors [5,17,34,35], a volume that is adequate enough to reach the root area should be applied to protect roots from potential colonization of pathogens and promote the growth of healthy plants. In addition, repeated applications are necessary in order to constantly supply the soil system with nutrients and beneficial microorganisms [17,34,35]. On the other hand, the repeated distribution of CT with a sodium imbalance could cause sodium accumulation into the soil (sodicity phenomenon), which has negative impacts on soil structure (swelling and dispersion of clays, soil surface crusting with consequent soil pore sealing). Therefore, sodicity can significantly affect water infiltration into the soil causing runoff and soil erosion especially on steep lands. In case of CT dilution, such detrimental agronomic/environmental effects can be reduced.
A certain increase in N content was observed in CTs produced with the addition of both whey and molasses. Such concentrations, although they are not exhaustive to fully satisfy nutritional requirements of horticultural or fruit crops to be treated, has to be considered complementary for nitrogenous nutrition of crops. By simulating the soil distribution of 300 L year−1, as suggested by Ingham [17], the experimental CTs could apply total nitrogen inputs ranging from 29.1 to 86.4 g ha−1. These amounts should be increased by fertilizers, taking into account other agronomical principles, such as the real nutrient needs of crops along the different stages of plant life cycle; soil nutrient availability and crop nutritional status; synchronization between nutrient requirements by the crops and their availability in soil volume where roots are present; fertilization techniques and their efficiency; soil management techniques and water availability linked to natural conditions (rainfall) or irrigation practice. Probably, a longer brewing period could allow a greater amount of nutrients to be extracted from the compost [36].
Generally, additives combined to the starting compost allowed to increase TOC and humic and fulvic acid concentrations within the final CTs. These organic matter forms, distributed in the soil by means of frequent CT applications, have important agronomic implications: they improve soil fertility, provide for labile nutrients and create an environment useful for microbial proliferation and activity, increase soil water retention [37,38]. The latter is a positive effect, especially in arid climates where irrigation water may be limited and high air temperatures quickens soil mineralization processes. In addition, humic substances can incite plant biostimulations by affecting both nutrient uptake and plant metabolism [39]. All such conditions create balanced and high-performance crop systems, able to cut plant chemical needs and reduce external inputs (pesticides, fertilizers).
The high capacity to extract metals from compost by the used additives suggests to take them into account in CT field application scheduling. The amount of elements with nutritional functions for crops, such as Ca, Mg and K, applied by means of CTs are low (data not shown) and, therefore, should be integrated according to the rules of sustainable fertilization. Monitoring of Ca/Mg and K/Mg rations in compost extracts is recommended to avoid possible equilibrium changes of these elements into the soil, which could affect crop nutrition. In order to determine whether heavy metal concentrations were of concern in terms of negative impacts on the soil system, they were compared with the chemical limits, where available, imposed by Italian legislation, which regulates the reuse of wastewater for irrigation purposes (Decree No. 185, 12/06/2003) [40]. With the exception of Cu, Fe and Mn, the contents were found to be below the limits permitted by law (Table 4). By assuming a CT-Wa, CT-Wh2 and CT-M3 distribution at a dose of 300 L year−1 for a medium period of 10 years, the total heavy metals applied to the soil are extremely low and well below the maximum annual quantities allowed by Legislative Decree No. 99, 27/01/1992 concerning the disposal on land of sewage sludge (application of 5 t ha−1 year−1 of sewage sludge—on a dry matter basis) [41] (Table 9). Although total heavy metal contents in the experimental CTs were low, an increase of their bioavailable forms (ionic and chelated forms, presence in microorganisms) should be taken into account. In addition, the distribution on soil of acid or/and chelating products by CTs, could increase the bioavailability of heavy metals, especially in the case of several annual distribution cycles and of medium-long term treatments.
Here, CTs exhibited a broad-spectrum of suppressive properties against the tested plant pathogens, interestingly, only when, independently from the concentration, they are used as raw. This means that pathogen containment was mainly due to the microbial components, probably responsible of antagonistic functions [42]. Actually, plate counts retrieved microbial populations, such as Pseudomonas spp. and Bacillus spp., associated to the biological control of plant pathogens [43,44]. As expected, additives modulated both the structure and composition of CT communities: molasses stimulated microbial shifts more than whey, likely due to sugar content. Nevertheless, the kind of additive did not univocally affect Rhizoctonia disease control efficacy, likely due to the high suppressive levels just showed by the non-amended tea. Interestingly, additive used at the higher dosage, reduced the suppressivity performances of the formulate suggesting strong effects on the microbial community composition. A literature survey showed how additives might have a role in suppressive functionalities and have a potential to help the definition of the systematic production of CTs suitable for plant disease management [5]. Mohd Din et al. [45] pointed up as an aerated CT added with molasses sourced from oil palm, was able to suppress Grammothele lineata on the Malaysian plant Melicope ptelefolia. CTs have a great potential to suppress both air and soil-borne pathogens [46], as also indicated here by the in vitro and in vivo experiments. In a previous assay, whey CTs significantly reduced disease symptoms of Alternaria alternata, Botrytis cinerea and Pyrenochaeta lycopersici on tomato, suggesting a suitability of the extracting solution for suppressive CTs production [42]. CTs may explicate the biocontrol action against plant diseases through the typical antagonistic mechanisms operated by the resident microflora, including antibiosis, competition for the space and/or for the nutrients, hyperparasitisms and induction of systemic resistance in the plants. Microbial biodiversity in the compost is crucial for the suppressive properties [47] that can be transferred into CT. In this regard, the additives may further affect the architecture of the microbial community, by favoring general growth or some populations over others (i.e., molasses) and/or by providing new microbial groups (i.e., whey) by establishing new equilibriums. Thus, the biocontrol mechanisms, on the base of the complexity of the resident communities, in the CT may synergize. The role of the specific antagonistic structure of microbial groups for the biological control activity has highlighted in CTs able at reducing disease symptoms caused by R. solani on savoy cabbage, Sclerotinia minor on lettuce and Sclerotium rolfsii on pepper in drenching applications [48].

5. Conclusions

CT is a multifunctional product, especially usable in organically managed agricultural systems and achievable on-farm at sustainable costs with easily available materials, for example biowaste from agro-food processing industries. CTs with additives have proven to be an important supplementary source in crop nutrition, to be taken into due consideration in drawing up fertilization plans. On the other hand, it is necessary to pay particular attention to the quality of the starting ingredients (compost, water, nutritional additives) to ensure the production of “safe” CT. Without prejudice to the use of quality CT, it is however advisable, for precautionary purposes, to monitor the system (soil–plant) treated with CT to avoid long-term undesirable effects (accumulation of heavy metals, salinization, phytotoxicity, etc.). The additives used in this research seem to have an interesting function of being a microbial starter and exert a significant restraint of the plant pathogen activities, probably by influencing and modulating CTs communities’ compositions. The features of this sustainable technique (low costs, ease of application, waste recycling action, etc.), together with several agronomical benefits coming from its application, should justify a political and economic effort by competent bodies to spread it as much as possible to potential stakeholders (agro-food industries and operators, agricultural experts, farmers, etc.).

Author Contributions

Conceptualization, G.C.; methodology, G.C., A.M.P., C.P. and M.Z.; validation, G.C., A.M.P., C.P. and M.Z.; formal analysis, G.C., A.M.P. and C.P.; investigation, G.C., A.M.P., C.P., D.V. and G.A.; resources, G.C. and M.Z.; data curation, A.M.P., C.P., D.V. and G.A.; writing—original draft preparation, A.M.P. and C.P.; writing—review and editing, G.C., A.M.P., C.P. and M.Z.; visualization, A.M.P. and C.P.; supervision, G.C. and M.Z.; project administration, G.C. and M.Z.; funding acquisition, G.C. and M.Z. All authors have read and agreed to the published version of the manuscript.

Funding

This research was supported by the “Biocompost” Project, funded by PSR 2007/2013 European funding programme (F.E.A.S.R., Measure 124).

Conflicts of Interest

The authors declare no conflict of interest.

References

  1. Diver, S. Compost Tea for Plant Disease Control. ATTRA, Publ. 2002. Available online: http://www.attra.org/attra-pub/comptea.htm (accessed on 30 October 2020).
  2. Scheuerell, S.J.; Mahaffee, W.F. Variability Associated with Suppression of Gray Mold (Botrytis cinerea) on Geranium by Foliar Applications of Non aerated and Aerated Compost Teas. Plant Dis. 2006, 90, 1201–1208. [Google Scholar] [CrossRef] [PubMed] [Green Version]
  3. Weltzien, H.C. Some effects of composted organic materials on plant health. Agric. Ecosyst. Environ. 1989, 27, 439–446. [Google Scholar] [CrossRef]
  4. Weltzien, H.C. The use of composted materials for leaf disease suppression in field crops. Monogr. Br. Crop. Prot. Counc. 1990, 45, 115–120. [Google Scholar]
  5. Scheuerell, S.J.; Mahaffee, W.F. Compost tea: Principles and prospects for plant disease control. Compos. Sci. Util. 2002, 10, 313–338. [Google Scholar] [CrossRef]
  6. Hargreaves, J.C.; Adl, M.S.; Warman, P.R. The effects of municipal solid waste compost and compost tea on mineral element uptake and fruit quality of strawberries. Compos. Sci. Util. 2009, 17, 85–94. [Google Scholar] [CrossRef]
  7. Naidu, Y.; Meon, S.; Siddiqui, Y. Foliar application of microbial-enriched compost tea enhances growth: Yield and quality of muskmelon (Cucumis melo L.) cultivated under fertigation system. Sci. Hortic. 2013, 159, 33–40. [Google Scholar] [CrossRef]
  8. Pane, C.; Palese, A.M.; Spaccini, R.; Piccolo, A.; Celano, G.; Zaccardelli, M. Enhancing sustainability of a processing tomato cultivation system by using bioactive compost teas. Sci. Hortic. 2016, 202, 117–124. [Google Scholar] [CrossRef]
  9. Zaccardelli, M.; Pane, C.; Villecco, D.; Palese, A.M.; Celano, G. Compost tea spraying increases yield performance of pepper (Capsicum annuum L.) grown in greenhouse under organic farming system. Ital. J. Agron. 2018, 13, 229–234. [Google Scholar] [CrossRef]
  10. Koepf, H.H. Research in Biodynamic Agriculture: Methods and Results; Bio-Dynamic Farming and Gardening Association: Kimberton, PA, USA, 1993; p. 78. [Google Scholar]
  11. Diver, S.; Greer, L. Sustainable Small-Scale Nursery Production. ATTRA, Publ. 2001. Available online: http://www.microfarms.com/technical/greenhousecd/greenhouse/nursery/nursery.pdf (accessed on 30 October 2020).
  12. Morard, P.; Eyheraguibel, B.; Morard, M.; Silvestre, J. Direct effects of humic-like substance on growth, water, and mineral nutrition of various species. J. Plant Nutr. 2011, 34, 46–59. [Google Scholar] [CrossRef]
  13. Nardi, S.; Pizzeghello, D.; Muscolo, A.; Vianello, A. Physiological effects of humic substances on higer plants. Soil Biol. Biochem. 2002, 34, 1527–1536. [Google Scholar] [CrossRef]
  14. Mengesha, W.K.; Powel, S.M.; Evans, K.J.; Barry, K.M. Diverse microbial communities in non-aerated compost teas suppress bacterial wilt. World J. Microb. Biot. 2017, 33, 49. [Google Scholar] [CrossRef]
  15. Scheuerell, S.J.; Mahaffee, W.F. Compost tea as a container medium drench for suppressing seedling damping—Off by Pythium ultimum. Phytopathology 2004, 94, 1156–1163. [Google Scholar] [CrossRef] [PubMed] [Green Version]
  16. Weltzien, H.C. Biocontrol of foliar fungal disease with compost extracts. In Microbial Ecology of Leaves; Andrews, J.H., Hirano, S.S., Eds.; Springer: New York, NY, USA, 1991; pp. 430–450. [Google Scholar]
  17. Ingham, E.R. The Compost Tea Brewing Manual, 5th ed.; Soil Foodweb: Corvallis, OR, USA, 2005. [Google Scholar]
  18. Wang, H.; Ding, J.; Liu, S.; Bai, X.; Xue, L. Different carbonic supplements induced changes of microflora in two types of compost teas and biocontrol efficiency against Pythium aphanidermatum. Biocontrol Sci. Technol. 2019, 29, 924–939. [Google Scholar] [CrossRef]
  19. Brinton, W.; Storms, P.; Evans, E.; Hill, J. Compost teas: Microbial hygiene and quality in relation to method of preparation. Biodynamics 2004, 2, 36–45. [Google Scholar]
  20. Duffy, B.; Sarreal, C.; Ravva, S.; Stanker, L. Effect of molasses on regrowth of E. coli O157:H7 and Salmonella in compost teas. Compos. Sci. Util. 2004, 12, 93–96. [Google Scholar] [CrossRef]
  21. Ingram, D.T.; Millner, P.D. Factors affecting compost tea as a potential source of Escherichia coli and Salmonella on fresh produce. J. Food Prot. 2007, 70, 828–834. [Google Scholar] [CrossRef] [Green Version]
  22. Legislative Decree, No. 75, 29 April 2010, Gazzetta Ufficiale No.121, Rome, Italy, 26 May 2010. Riordino e Revisione Della Disciplina in Materia di Fertilizzanti, a Norma Dell’articolo 13 Della Legge 7 Luglio 2009, n. 88. Available online: https://www.gazzettaufficiale.it/eli/id/2010/05/26/010G0096/sg (accessed on 2 March 2021).
  23. ANPA. Metodi di Analisi del compost. In Manuali e Linee Guida; ANPA: Roma, Italy, 2001; ISBN 88-448-0258-9. [Google Scholar]
  24. Pane, C.; Spaccini, R.; Piccolo, A.; Celano, G.; Zaccardelli, M. Disease suppressiveness of agricultural greenwaste composts as related to chemical and bio-based properties shaped by different on-farm composting methods. Biol. Control 2019, 137, 104026. [Google Scholar] [CrossRef]
  25. Scher, F.M.; Baker, R. Effect of Pseudomonas putida and a synthetic iron chelator on induction of soil suppressiveness to Fusarium Wilt pathogens. Phytopathology 1982, 72, 1567–1573. [Google Scholar] [CrossRef]
  26. Sadfi, N.; Cherif, M.; Fliss, I.; Boudabbous, A.; Antoun, H. Evaluation of bacterial isolates from salty soils and Bacillus thurigiensis strains for the biocontrol of Fusarium dry rot of potato tubers. J. Plant Pathol. 2001, 83, 101–118. [Google Scholar]
  27. Pane, C.; Piccolo, A.; Spaccini, R.; Celano, G.; Villecco, D.; Zaccardelli, M. Agricultural waste-based composts exhibiting suppressivity to diseases caused by the phytopathogenic soil-borne fungi Rhizoctonia solani and Sclerotinia minor. Appl. Soil Ecol. 2013, 65, 43–51. [Google Scholar] [CrossRef]
  28. Pane, C.; Spaccini, R.; Piccolo, A.; Scala, F.; Bonanomi, G. Compost amendments enhance peat suppressiveness to Pythium ultimum, Rhizoctonia solani and Sclerotinia minor. Biol. Control 2011, 56, 115–124. [Google Scholar] [CrossRef]
  29. APAT & CTN TES. Proposta di guida tecnica su metodi di analisi per il suolo e i siti contaminati; utilizzo di indicatori biologici ed ecotossicologici. RTI CTN_TES 1/2004. p. 160. Available online: http://www.isprambiente.gov.it/files/biodiversita/APAT_Guida_tecnica_indicatori_2004.pdf (accessed on 7 January 2020).
  30. Kim, M.J.; Shim, C.K.; Kim, Y.K.; Hong, S.J.; Park, J.H.; Han, E.J.; Kim, J.H.; Kim, S.C. Effect of aerated compost tea on the growth promotion of lettuce, soybean, and sweet corn in organic cultivation. Plant Pathol. J. 2015, 31, 259–268. [Google Scholar] [CrossRef] [PubMed] [Green Version]
  31. Schlegel, H.G. General Microbiology, 7th ed.; Cambridge University Press: New York, NY, USA, 1993. [Google Scholar]
  32. Caballero, P.; Rodríguez-Morgado, B.; Macías, S.; Tejada, M.; Parrado, J. Obtaining plant and soil biostimulants by waste whey fermentation. Waste Biomass Valor. 2020, 11, 3281–3292. [Google Scholar] [CrossRef]
  33. Ayers, R.S.; Westcot, D.W. Water Quality for Agriculture. FAO Irrigation and Drainage Paper 29 Rev. 1; FAO: Rome, Italy, 1985. [Google Scholar]
  34. Brinton, W.; Droffner, M. The control of plant pathogenic fungi by use of compost teas. Biodynamics 1995, 197, 12–15. [Google Scholar]
  35. Brodeur, C. Actively Aerated Compost Tea and Trees. Ecological Landscape Alliance. 2011. Available online: https://www.ecolandscaping.org/05/developing-healthy-landscapes/composting-compost-tea/actively-aerated-compost-tea-and-trees/ (accessed on 1 August 2021).
  36. Scheuerell, S.J. Understanding how compost tea can control disease. BioCycle 2003, 44, 20–25. [Google Scholar]
  37. Dearborn, Y. Compost Tea-Literature Review on Production, Application and Plant Disease Management; San Francisco Department of Environment Toxic Reduction Program: IPM Task Order, 3–18; College of Agriculture, University of Arizona: Tucson, AZ, USA, 2011. [Google Scholar]
  38. Eudoxie, G.; Martin, M. Compost Tea Quality and Fertility, Organic Fertilizers—History, Production and Applications, Marcelo Larramendy and Sonia Soloneski; IntechOpen: London, UK, 2019; Available online: https://www.intechopen.com/chapters/68380 (accessed on 23 June 2021). [CrossRef] [Green Version]
  39. Canellas, L.P.; Olivares, F.L.; Aguiar, N.O.; Jones, D.L.; Nebbioso, A.; Mazzei, P.; Piccolo, A. Humic and fulvic acids as biostimulants in horticulture. Sci. Hortic. 2015, 96, 15–27. [Google Scholar] [CrossRef]
  40. Decree of Ministry for Environment, No. 185, 12 June 2003, Gazzetta Ufficiale No.169, Rome, Italy, 23 July 2003. Italian Technical Guidelines for Wastewater Reuse. Available online: https://www.gazzettaufficiale.it/eli/id/2003/07/23/003G0210/sg (accessed on 23 January 2021).
  41. Legislative Decree, No. 99, 27 January 1992, Gazzetta Ufficiale No. 38, Rome, Italy, 15 February 1992, Implementation of the Directive 86/278/EC Concerning the Protection of the Environment and in Particular of Soil, for the Use of Sewage Sludge in Agriculture. Available online: https://www.gazzettaufficiale.it/eli/id/1992/02/15/092G0139/sg (accessed on 23 January 2021).
  42. Pane, C.; Celano, G.; Villecco, D.; Zaccardelli, M. Control of Botrytis cinerea, Alternaria alternata and Pyrenochaeta lycopersici on tomato with whey compost-tea application. Crop. Prot. 2012, 38, 80–86. [Google Scholar] [CrossRef]
  43. Naidu, Y.; Meon, S.; Kadir, J.; Siddiqui, Y. Microbial starter for the enhancement of biological activity of compost tea. Int. J. Agric. Biol. 2010, 12, 51–56. [Google Scholar]
  44. Zaccardelli, M.; Sorrentino, R.; Caputo, M.; Scotti, R.; De Falco, E.; Pane, C. Stepwise-Selected Bacillus amyloliquefaciens and B. subtilis Strains from Composted Aromatic Plant Waste Able to Control Soil-Borne Diseases. Agriculture 2020, 10, 30. [Google Scholar] [CrossRef] [Green Version]
  45. Mohd Din, A.R.J.; Hanapi, S.Z.; Futamata, H.; Sarmidi, M.R. Utilization of compost tea for biochemical response assessment associated with resistance to phytopathogen causing leaf spot in Melicope ptelefolia. Org. Agric. 2019, 9, 445–456. [Google Scholar] [CrossRef]
  46. Pane, C.; Zaccardelli, M. Principles of Compost-based Plant Diseases Control and Innovative New Developments. In Composting for Sustainable Agriculture. Sustainable Development and Biodiversity; Maheshwari, D., Ed.; Springer: Cham, Switzerland, 2014; Volume 3. [Google Scholar]
  47. Scotti, R.; Mitchell, A.L.; Pane, C.; Finn, R.D.; Zaccardelli, M. Microbiota Characterization of Agricultural Green Waste-Based Suppressive Composts Using Omics and Classic Approaches. Agriculture 2020, 10, 61. [Google Scholar] [CrossRef] [Green Version]
  48. Pane, C.; Celano, G.; Zaccardelli, M. Metabolic patterns of bacterial communities in aerobic compost teas associated with potential biocontrol of soilborne plant diseases. Phytopathol. Mediterr. 2014, 53, 277–286. [Google Scholar]
Scheme 1. Technical and operative details of the CT extraction process. (a) 50 L-plastic containers; (b) 24 L compressor; (c) 5 L compressor; (d) solenoid valve supplied with 24 V; (e) T-shaped end; (f) turbulence effect; (g) air-distributor made up of 6-mm pipes connected to a main 16-mm pipe by adapters; (h) spiral arrangement of the smaller tubes (Ø 6 mm) in the container and sparkling effect.
Applsci 11 07402 sch001
Figure 1. Electrical conductivity (EC) measured in the different CTs during the extraction procedure. Measurements were performed at the beginning of the extraction and then every 30 min for the first five surveys, and each hour for the remaining part of the experiment (except at night).
Applsci 11 07402 g001
Figure 2. pH values (a) and electrical conductivity (EC) (b) measured in CTs diluted with tap water at different ratios (1:2; 1:4; 1:6; 1:8).
Applsci 11 07402 g002
Figure 3. Effects of CT treatments on kohlrabi plants grown in infected pots (fresh weight—f.w.; dry weight—d.w.) and damping off incidence (%) due to Rhizoctonia solani infection. Bars indicate value ±SE; different lowercase letters indicate statistically significant differences among treatments at p ≤ 0.05. NI: Non-inoculated; I: inoculated. *: measurement equal to 0.
Applsci 11 07402 g003
Figure 4. Phytotoxicity assays on seeds of Solanum lycopersicum L. (tomato), Cucumis sativus L. (cucumber) and Lepidium sativum L. (cress) treated with the different CTs (1:3 v:v, CT: water) sampled after 24 (a) and 48 h (b) from the start of the extraction process. Lowercase letters indicate statistically significant differences (p ≤ 0.05) within the same sampling time.
Applsci 11 07402 g004
Table 1. Chemical and physical characteristics of the source materials used to produce the different CTs. Legend: C = compost; Wa = water; Wh = whey; M = molasses.
ParameterCWa WhM
pH 8.07.86.08.5
EC mS cm−12.960.75--
Total-N% d.w. or L−1 Z1.4-0.613.0
N-NH4+Ppm959019.
N-NH4+/Total-N 0.070.000.03.
TOCg kg−131303310
HA + FA% d.m.11---
Camg kg−1 or mg L−1 Y65,80021137835
Mg’’4000439304
K’’11,80025921150
Na’’270039423400
Fe’’11,4000.090.260.09
Cu’’45.980.020.040.61
Zn’’247.430.460.275.00
Mn’’427.300.010.017.39
Cr’’16.0500.0150.0120.069
Cd’’0.3000.0000.0000.005
Ni’’13.30.0130.0111.731
Pb’’28.1500.0240.0270.250
Z % d.w. for C, and L−1 for Wa, Wh, and M; Y mg kg−1 for C, and mg L−1 for Wa, Wh, and M.
Table 2. Amounts of metals added to the CTs by means of the source materials.
MetalCT-Wh1CT-Wh2CT-M1CT-M2CT-M3
g Supplied
Ca41168588146292
Mg1171953253106
K17762960121201403
Na282647103575951190
Fe0.7801.3000.0090.0160.032
Cu0.1200.2000.0640.1070.214
Zn0.8101.3500.5250.8751.750
Mn0.0300.0500.7761.2932.587
Cr0.0360.0600.0070.0120.024
Cd0.0000.0000.0010.0010.002
Ni0.0330.0550.1820.3030.606
Pb0.0810.1350.0260.0440.088
Table 3. pH and electrical conductivity (EC) measured in the CTs during the extraction process (at 0 h, after 24 h, after 48 h). Comparison between total organic carbon (TOC, g L−1), humic and fulvic acids (HA + FA, g L−1), and humic and fulvic acids to TOC ratio [(HA + FA)/TOC] × 100, measured after 24 and 48 h from the start of the extraction process.
CTpHECTOC(HA + FA)[(HA + FA)/TOC] × 100
mS cm−1g L−1g L−1
0 h24 h48 h0 h24 h48 h24 h48 h24 h48 h24 h48 h
CT-Wa8.008.478.600.924.414.451.671.530.190.0311.411.66
CT-Wh16.464.905.002.185.926.872.142.180.300.5213.9923.91
CT-Wh26.054.816.022.346.608.202.732.890.610.6622.3322.64
CT-M18.048.548.722.355.515.822.491.970.430.2517.3512.90
CT-M28.248.608.772.345.666.032.401.610.180.417.4325.30
CT-M38.328.628.994.367.107.452.141.760.310.5314.5430.32
Table 4. Chemical and physical features of the final CTs and concentration limits of total heavy metals imposed by the Italian law for wastewater reuse (Decree No. 185, 12/06/2003, Ministry for Environment).
Parameter CT-WaCT-Wh1CT-Wh2CT-M1CT-M2CT-M3Limits Imposed by the Italian Law
pHU pH8.605.006.028.728.778.99-
ECmS cm−14.456.878.205.826.037.45-
SAR 3.63.42.45.67.18.1-
Total-Nmg L−197138197151194288-
N-NH4+/’’242150394750-
N-NH4+/Total-N 0.250.150.250.260.240.17-
TOCg L−11.532.182.891.971.611.76-
HA + FAg L−10.030.520.660.250.410.53-
Camg L−151226416595974-
Mg’’123360141617-
K’’373545731524567615-
Na’’103199187170218275-
Fe’’1.861.63.372.622.192.432.0
Cu’’0.200.151.160.230.250.201.0
Zn’’0.320.370.430.530.440.450.5
Mn’’0.181.071.910.300.280.280.2
Cr’’0.2440.0290.0340.0270.0210.0450.1
Cd’’0.0000.0040.0010.0020.0000.0000.005
Ni’’0.0370.0290.0540.0640.0710.1050.2
Pb’’0.040.050.070.050.060.050.1
Table 5. Enrichment factors (Bi/Ai ratio) of the final CTs referred to the metal content of tap water and the used additives (molasses and whey).
MetalA1A2A3A4A5A6B1B2B2B4B5B6 Bi/Ai
Wa+Wh1+Wh2+M1+M2+M3CT-WaCT-Wh1CT-Wh2CT-M1CT-M2CT-M3I = 123456
Ca213138242529512264165959742.47.311.12.52.32.5
Mg4795671233601416173.04.76.72.92.92.4
K253865814373545731524567615186.510.48.596.173.245.6
Na38313713203710319918717021827534.32.41.412.910.97.4
Fe0.090.100.110.0900.0900.0911.861.603.372.622.192.4320.715.329.529.024.226.7
Cu0.020.020.020.0220.0230.0260.20.151.160.230.250.210.06.950.810.510.87.7
Zn0.460.440.430.4750.4850.5100.320.370.430.530.440.450.70.81.01.10.90.9
Mn0.010.010.010.0320.0470.0840.181.071.910.30.280.2818.0107.0191.09.36.03.3
Cr0.0150.010.010.0150.0150.0160.2440.030.030.0270.0210.04516.32.02.31.81.42.9
Cd00.000.000.0000.0000.00000.0040.0010.00200---133.30.00.0
Ni0.0130.010.010.0180.0220.0300.0370.030.050.0640.0710.1052.82.34.23.53.33.5
Pb0.0240.020.020.0250.0250.0270.040.050.070.050.060.051.72.12.92.02.41.9
Table 6. Microbiological features of the final CTs. Values followed by different lowercase letters were significantly (p ≤ 0.05) different.
COMPOST TEASFungi
(LogCFU ml−1)
Yeast
(LogCFU ml−1)
Bacteria
(LogCFU ml−1)
Fungi/Bacteria
Ratio
Fungi/Yeast
Ratio
Yeast/Bacteria
Ratio
Pseudomonas spp.
(LogCFU ml−1)
Bacillus spp.
(LogCFU ml−1)
CT-Wa3.1c4.4 c5.6 c0.5620.7110.7893.8 d4.1 a
CT-Wh16.3 a5.0 c7.2 bc0.8681.2640.6875.1 d4.0 a
CT-Wh26.1 b5.9 b8.3 a0.7411.0440.7106.8 b4.3 a
CT-M14.4 c6.3 a7.4 bc0.6010.6990.8597.2 a4.4 a
CT-M23.6 c5.3 c7.8 b0.4620.6830.6766.3 cd3.7 a
CT-M33.4 c5.5 c7.6 bc0.4530.6230.7276.8 bc3.6 a
Table 7. Microbial population and levels of physiological profiles of CT communities detected by Biolog Eco Plate system. In each group, values followed by different lowercase letters were significantly (p ≤ 0.05) different.
CTs Biolog CLPPs
FungiYeastBacteriaFungi/BacteriaFungi/YeastYeast/BacteriaPseudomonas spp.Bacillus spp.Boltzmann Function of AWCDMetabolic Biodiversity
LogCFU ml−1 LogCFU ml−1 A2x0dxR2VCH′
CT-Wa3.1c4.4 c5.6 c0.5620.7110.7893.8 d4.1 a1.4745.2111.010.9962.013 d3.32 d
CT-Wh16.3 a5.0 c7.2 bc0.8681.2640.6875.1 d4.0 a1.1143.2613.400.9961.362 d3.32 d
CT-Wh26.1 b5.9 b8.3 a0.7411.0440.7106.8 b4.3 a1.2236.7114.260.9911.869 d3.37 c
CT-M14.4 c6.3 a7.4 bc0.6010.6990.8597.2 a4.4 a1.7141.3613.740.9963.128 c3.40 b
CT-M23.6 c5.3 c7.8 b0.4620.6830.6766.3 cd3.7 a1.8037.8414.190.9934.500 b3.41 a
CT-M33.4 c5.5 c7.6 bc0.4530.6230.7276.8 bc3.6 a1.7037.9615.120.9905.180 a3.41 a
Table 8. In vitro fungal growth inhibition of the final CTs. For each fungus, values followed by different lowercase letters were significantly (p ≤ 0.05) different.
Compost TeasMycelial Inhibition Zone (%)
Fusarium
solani
Fusarium oxysporumFusarium sambucinumFusarium semitectumAlternaria alternataBotrytis
cinerea
Verticillium dahliaeColletotrichum lindemutianumPyrenochaeta lycopersiciRhizoctonia solani
1:51:101:51:101:51:101:51:101:51:101:51:101:51:101:51:101:51:101:51:10
CT-Wa42 bc41 ab42 b41 ab54 a61 a45 a45 ab41 ab39 b46 ab47 a58 a40 b35 a33 a44 bc67 a25 b24 bc
CT-S135 c43 ab38 b33 b31 b35 b37 b40 c50 a38 b45 ab44 ab47 c34 c29 a28 ab21 d41 b27 b26 b
CT-S235 c30 c37 b49 a41 ab38 b43 ab49 a55 a39 b44 ab44 ab47 c42 b23 b22 b33 cd28 c33 a32 a
CT-M149 ab46 a52 a22 c42 ab43 b45 a47 ab36 bc53 a56 a45 ab54 ab61 a27 ab35 a23 d27 c24 b22 bc
CT-M254 a41 ab44 b38 b41 ab39 b44 ab42 bc28 c32 b28 c41 ab51 bc44 b28 ab27 ba64 a25 c26 b21 c
CT-M354 a33 bc40 b49 a38 ab36 b39 ab40 c43 ab43 b38 b34 b49 c42 b30 ab35 a55 ab20 d29 ab26 b
Table 9. Total heavy metals applicable to the soil in the medium period (10 years) by means of CT-Wa, CT-Wh2 and CT-M3 (300 L year−1). Comparison with the maximum annua1 amounts allowed by the Italian law (Legislative Decree, No. 99, 27/01/1992) through the application of 5 t ha−1 year−1 of sewage sludge—on a dry matter basis.
ElementCT-WaCT-Wh2CT-M3Maximum Annual Amounts Allowed by the ltalian Law
g ha−1
Fe5.610.17.3-
Cu0.63.50.65000
Zn1.01.31.412,500
Mn0.55.70.8-
Cr0.70.10.1-
Cd0.00.00.0100
Ni0.10.20.31500
Pb0.10.20.23750
Publisher’s Note: MDPI stays neutral with regard to jurisdictional claims in published maps and institutional affiliations.

