Article

Establishment of a Geographic Information System-Based Algorithm to Analyze Suitable Locations for Green Roofs and Roadside Trees

1
Department of Urban Planning and Design Research, The Seoul Institute, Seoul 06756, Korea
2
Department of Urban Planning and Engineering, Hanyang University, Seoul 04763, Korea
3
Research Institute of Spatial Planning & Policy, Hanyang University, Seoul 04763, Korea
*
Author to whom correspondence should be addressed.
Appl. Sci. 2021, 11(16), 7368; https://doi.org/10.3390/app11167368
Submission received: 9 July 2021 / Revised: 6 August 2021 / Accepted: 9 August 2021 / Published: 10 August 2021

Abstract

:
Urban green spaces offer various ecosystem services such as those for controlling the urban microclimate, improving water circulation, and providing leisure and recreation opportunities. However, it is almost impossible to create new, large green spaces in cities where urbanization has been long underway. Consequently, small-scale green spaces such as green roofs and roadside trees are gaining attention as features that can increase the effects of ecosystem services. Although the area of individual buildings in urban areas is relatively small, the sum of building rooftop areas account for a large portion of urban areas. Moreover, there are areas widely available throughout cities where street trees could be planted. However, this requires large amounts of accurate databases (DBs) and long-term spatial analyses to identify specific locations suitable for small-scale green facilities on a citywide scale using a geographic information system (GIS). Consequently, in-depth research on this topic has been insufficient. Thus, this study presents an algorithm to analyze locations where green roofs and roadside trees could be introduced based on GIS spatial analysis and verifies the effectiveness of the algorithm built for the city of Seoul. In addition, computational fluid dynamics (CFD) modeling is performed to analyze the temperature reduction effect, the representative function of ecosystem control services that can be brought about by the potential green spaces. The results show that rooftop greening in study areas is possible in 311,793 of 742,770 buildings. The rooftop floor area of buildings that can apply rooftop greening is 33,288,745 m2, which is about 50% of the total area of the rooftop in Seoul. It was found that roadside trees could be planted on a sidewalk with an extension length of 872,725 m and an area of 838,864 m2. A total of 145,366 trees can be planted in the study area. In addition, it was shown that the introduction of green roofs reduced temperatures by 0.13 °C to 0.14 °C and roadside trees reduced temperatures by 0.14 °C to 0.6 °C. With the growing need to improve urban ecosystem services as a result of rapid climate change, the algorithm developed in this study can be utilized to create spatial policies that expand and manage urban green spaces and thereby contribute to the improvement of urban ecosystem services.

1. Introduction

Various environmental problems caused by climate change are directly threatening the ecological stability of cities, and urban ecosystem services are becoming vulnerable due to population growth and reductions in green spaces. As a result, demand to improve the health of urban ecosystems is constantly growing. In major cities worldwide, efforts are being made to restore damaged urban ecosystems and secure additional urban ecological spaces. For example, healthy city development projects are being implemented in more than 3000 cities globally, led by the World Health Organization (WHO), to improve urban residents’ health and environments. In particular, because green spaces in cities offer a various benefits that include providing habitats for organisms, controlling the urban microclimate, reducing air pollution, preventing floods, providing leisure and recreation opportunities, and saving energy [1,2,3], the expansion and utilization of parks and green areas are widely considered as a representative means to achieve this objective [4,5,6].
In a city where urbanization has already considerably progressed however, it is almost impossible to create new large green space due to high development demand and land prices. As a result, small green spaces such as green roofs and roadside trees are gaining attention as key features that can increase ecosystem services in cities. In urban areas, the area of individual buildings tends to be small, but the sum of all buildings’ rooftops accounts for a large area. For example, in New York City, the sum of building rooftops is known to be 20 to 30 times the size of Central Park [7]. Rose, Akbari, and Taha [8] reported that 20–25% of the total area of major U.S. cities such as Salt Lake City, Sacramento, Houston, and Chicago is rooftop area. Notably, rooftops can be a good alternative for increasing green spaces in cities where additional space is difficult to secure owing to high land prices and various conflicts of interest [9,10]. As a result, several studies [11,12,13,14] were conducted to effectively create rooftop greening and roadside trees in cities. Meyer [11] proposed a conceptual description of the individual effects of trees and offers a guideline for tree planting to increase such effects. Peper et al. [10] and Yumagulova and Vertinsky [11] presented a species of trees that can effectively adapt to climate change, and the authors provide their respective planting methods and management measures. Yeh and Chow [14] established a geographic information system (GIS)-based location analysis algorithm in Hong Kong’s Open Space Plan to calculate the amount of additional green spaces needed, plus potential locations and areas according to the population. Wu et al. [15] assessed possible locations for greening and the possible total amount of greening in Los Angeles using GIS spatial analysis and considering the features of roadside trees.
However, for rooftop greening, in most cases, the possible areas are indirectly estimated with a certain ratio of the total area of rooftops. In addition, even though relatively clear installation standards exist for planting soil, drinking water density (per square meter), and maintenance measures for rooftop greening, there is still insufficient research on the characteristics of buildings suitable for rooftop greening and the available rooftops [16,17]. Although it is possible to analyze the possibility of greening with regard to the type, size, and delivery method of trees, roadside trees have been planted by mainly relying on the subjective judgment of planners in terms of landscape improvement. Unlike large-scale urban planning facilities, small-scale projects like rooftop greening and roadside tree planting require the acquisition of detailed and extensive spatial-attribute data and various spatial analysis functions including queries, overlapping, and buffers. Therefore, because of the difficulties in data acquisition and limitations in computer performance, it takes a lot of time and effort to analyze the potential locations for rooftop greening and roadside tree planting for the entire metropolitan area. In the case of South Korea, relatively detailed data on entire cities can be secured and is being updated regularly through national GIS projects that have occurred six times. Furthermore, recent advances in CPU and GPU technology have enabled detailed location analyses of small facilities across cities.
Meanwhile, with the increasing occurrence of abnormal weather and changing climates, the importance of temperature reduction among ecosystem control services is growing. As a result, various studies [18,19,20,21,22] analyzed the temperature reduction effects of rooftop greening and roadside tree planting. Wang and Akbari [18] and Park et al. [19] emphasize that a lack of green areas in a city exacerbates the urban heat island phenomenon, while roadside trees can reduce temperatures by increasing latent heat during evaporation by blocking solar energy and creating shade. Susca et al. [20] found that air temperatures could be decreased by introducing rooftop green areas based on monitored temperatures in four neighborhoods in New York City where urban heat island phenomena occur. Wang, Beradi and Akbari [21] measured the temperature of rooftop green spaces and found that temperatures decreased after sunset and that the surrounding air cooled down during nighttime. Feng et al. [22] confirmed through an energy balance model that rooftop greening in China during the summer months could result in a loss of solar energy of up to 58% due to evaporation and a 30.9% exchange of longwave radiation, thereby reducing temperatures.
With recent advances in computer technology, mathematical climate simulation models (MCSM) have been actively introduced and utilized in urban thermal environment analysis, showing reliable results with relatively accurate performance [23,24,25,26]. Among the MCSM, CFD models like Envi-met have been widely applied in the research field to analyze air temperature differences due to rooftop greening and roadside tree planting. Applying Envi-met, Ng et al. (2012) identified 0.5–1.7 °C air temperature reduction effects due to additional rooftop greening. Wang, Beradi, and Akbari [21] applied a weather simulation to observe temperature-reducing effects according to the height of trees and the size of tree crowns and found a temperature difference of 1.2 to 3.3 °C depending on the shading effects during the day. Rui et al. [27] analyzed air temperature variations in residential areas according to vegetation type, method, and planting density, and found that increasing planting density is most advantageous for reducing temperature and improving thermal comfort.
As such, several experimental studies were conducted on the effects of reducing temperatures through rooftop greening and roadside planting, but there has been a lack of research analyzing this effect in consideration of the locations and quantities that are available for possible greening [28]. To support decision-making involved with solving problems arising in complex urban spaces, it is necessary to build a data analysis model based on a conceptual framework to achieve set goals [5,29]. To ensure the effectiveness of urban greening, a detailed analysis is needed of how much greenery can be additionally introduced into urban spaces. In addition, the spatial characteristics of suitable locations of green roofs and roadside trees should be identified [30,31]. The scientific credibility of urban greening plans would increase if the positive effects of rooftop greening and roadside tree planting introduced could be proved where possible in a city.
This study (1) identifies the locational characteristics for rooftop greening and roadside tree planting in urban spaces and to prepare an analytical DB, (2) establishes an analytical algorithm to determine suitable locations and amounts of green roofs and roadside tree based on GIS spatial analysis; (3) it also applies a location analysis algorithm to Seoul Metropolitan City, a representative heat island city in South Korea; and (4) analyzes the air temperature reduction effect from the additional green roofs and roadside trees using the CFD model. The results of this study based on logical decision-making systems can increase the efficiency and scientific feasibility of spatial planning for expansion of green spaces in cities.

2. Materials and Methods

2.1. Identification of Locational Characteristics for Rooftop Greening and Roadside Tree Planting and Preparation of Analytical Data

As rooftop greening takes place on the top floor of existing or new buildings, it is crucial to consider the structural stability and morphological potential of buildings that can withstand the weight of vegetation and aquaculture [32]. This study selected building age, roof shape, and roof facilities among others, as the main variables of location analysis to measure the structural stability of buildings. In addition, the sidewalks on which street trees are to be planted must be sufficiently wide, excluding the area occupied by street trees and on-road facilities, to ensure the safety of pedestrians [33]. Thus, this study conducted roadside tree planting location analysis by focusing on two features: width of tree crown and effective walking space (Figure 1).
Furthermore, the quality of decision making can be improved with various data and information sharing, and one can expect the accuracy of the analysis outcomes to depend on the accuracy and precision of the input data [34]. In addition, to ensure the general applicability of the data analysis model, the use of standardized and verified DB in the model is required. Therefore, this study utilized national spatial information data, which is standardized and verified, in establishing the location analysis algorithm. Input variables and DBs to be included in the algorithm were selected as shown in Table 1 so that the locational characteristics presented earlier could be reflected in the analysis. The data presented in Table 1 were prepared, updated, and serviced based on regulation for national spatial information of Korea. Accordingly, only data that have passed data integrity verification can be released. The presented data also have high accuracy because they are prepared to support urban planning, design, and management.

2.2. Establishment of an Analytical Algorithmn to Determine Suitable Locations and Amounts of Rooftop Greening and Roadside Tree Planting

Spatial decision-making for the deployment of public facilities requires the consideration of interests between groups, requiring the processing and analysis of a large amount of information. Furthermore, GIS spatial analysis is mainly utilized because accurate positioning and area calculation are essential for location analysis. Location analysis with GIS spatial analysis involves input, storage, search, and analysis of data on an iterative basis. A data analysis model is essential for location analysis to proceed effectively. Moreover, most data analysis models require repetition to effectively select rational solutions to problems and optimal alternatives. This study represents the flow chart of the location analysis algorithm such that spatial analysis functions are linked logically and sequentially and implements an analytical algorithm with the GIS Model Builder (ArcGIS 10.5 developed by ESRI) for iterative analysis to be performed effectively.
The rooftop greening and roadside tree planting location analysis model can provide (1) an analysis of suitable spaces (buildings and sidewalks) and (2) a calculation of suitable areas and quantities. National spatial information collected through GIS spatial analysis is processed to derive buildings capable of rooftop greening and sidewalks capable of accommodating roadside trees. Next, the characteristics of the suitable spaces (buildings and sidewalks) are identified, and the suitable area and quantity are calculated. The detailed location analysis process is as follows.

2.2.1. Rooftop Greening

Building data were processed utilizing spatial analysis functions such as a query for linking spatial data and attribute data, overlay for selecting buildings that satisfy locational characteristics, a measurement function for calculating building area, and geocoding for building current data. In the analysis of locations for rooftop greening, structural safety must be considered to ensure buildings can withstand the weight of vegetation and soil after greening. According to the Act on the Improvement of Urban Areas and Residential Environments in Korea and the related ordinance of the Seoul Metropolitan Government (SMG), buildings over 30 years old are classified into high-risk buildings because they cannot ensure structural safety. Therefore, buildings’ special data and unit information were utilized to select buildings under 30 years old. In addition, in the case of slope roofs, rooftop greening is impossible because the soil, grass, and trees cannot be safely secured. The rooftop areas occupied by heliports also cannot introduce active greening to ensure the safe take-off and landing of helicopters. From among the selected buildings, those with flat roofs were selected again using roof type information and building unit information was used to exclude buildings with heliports and those that have green rooftops already. The suitable areas of rooftop greening were calculated using data on the area of the rooftop and the area of existing facilities on the roofs drawn from the building floor information of the selected buildings (Figure 2).

2.2.2. Roadside Trees

The Korean Ministry of Land, Infrastructure and Transport (MOLIT) [33] recommends securing at least a 2 m width, excluding roadside facilities, to ensure safe and comfortable walking for pedestrians. In addition, the SMG recommends securing at least a 1 m width from the edge of driveways to the center of roadside trees. To secure a minimum pedestrian space, sidewalks with a width of more than three meters were selected through spatial queries using digital data on sidewalks and roads. Then, proximity analysis was applied to the selected sidewalks so that trees would be planted within a meter from the boundary area. In addition, current data on existing roadside trees were utilized to spatialize attribute information, and those with existing roadside trees among the selected sidewalks were excluded. Finally, the measurement function was used to calculate the length of the selected planting space and the planting capacity. The SMG recommends planting 6 to 8 m apart in parallel with the road. In addition, according to statistics of the SMG (https://data.seoul.go.kr, accessed date: 9 August 2020), it is reported that the tree crown of almost all roadside trees in Seoul is six meters. Therefore, the planting capacity was calculated under the assumption that all planted trees would be six meters apart (Figure 3).

2.3. Case Study 1: Application of the Location Analysis Model

This study applied a data analysis model to Seoul, a representative heat island city in South Korea. To this end, the study area analysis DB and GIS S/W were utilized to identify rooftop greening and roadside tree planting locations and to calculate their area. Seoul has an area of 605 square kilometers and a population of 9.7 million people, and is a basin-type city surrounded by mountains. Due to its highly concentrated development, heat island phenomena occur frequently in Seoul (Figure 4a). According to the Korea Centers for Disease Control and Prevention (KCDCP), the temperature has been increasing yearly, and the number of heat patients in Seoul also grew from 27 in 2011 to 116 in 2019; the damage is expected to continue. In response, the city government has been making efforts to reduce heat islands through various pilot projects such as the introduction of green roofs and the planting of roadside trees. There are a total of 742,770 buildings that were included in the study area; if rooftop greening is actively introduced, the effect is expected to be considerable. The city government established a plan to utilize rooftop greening in 2007 to create an institutional framework for expanding rooftop greening across the city, but the pilot project was only partially implemented because the space needed was not clearly identified. In addition, the study area is a mixture of old and new regions, and the age of buildings, roof forms, and walking widths vary depending on the region, making it a city suitable to apply the location analysis model developed in this study.
Figure 4b maps out the average daily temperature using spatial interpolation based on the results of 280 automatic weather observation stations in operation within the study area. It can be confirmed that heat island phenomena are occurring frequently around the interiors where urbanization has long been underway. The heat island areas in the study area are relatively large, accounting for 23.88% of the total area, and strong heat island phenomena are evident in the east-west direction. Moreover, large-scale heat island areas are distributed in the eastern part of the study area.

2.4. Case Study 2: Analysis of Air Temperature Reduction Effect by Rooftop Greening and Roadside Tree Planting

It is important to first consider areas where rooftop greening and roadside tree planting require high financial costs and where temperature reduction effects can be maximized even if the area is small. This study selected three of the heat island areas presented in Figure 4b with different urban climate zone types of Lee, Oh, and Jung [35] as the targets of case study 2 (Table 2 and Figure 5).
This study analyzed the effectiveness of temperature reduction by rooftop greening and roadside tree planting by applying Envi-met (ver. 4.0), which is a CFD model. The simulation day (one day) was selected in the summer period of 2015 (June–August) when there is no precipitation, the wind is calm, and there are few clouds, to minimize the impact of weather side effects. Running the Envi-met modeling requires data from the main configuration file and area input file. The main configuration file contains weather-related information such as the simulation date, time, temperature, humidity, wind direction, wind speed, and roughness. The location, placement, height, floor pavement, location and type of trees and vegetation, and soil information of each building are input. Most urban areas are covered with asphalt: it is known that asphalt albedo has a value between 0.1 and 0.15 [36], arboreal albedo is between 0.12 and 0.18, and grassland albedo is between 0.16 and 0.26 [37]. This study set the albedo of rooftop greening to 0.26, assuming a plant species that can maximize solar reflection would be planted. A default value of Envi-met was applied as the albedo of other roofs, walls, and asphalt. Meanwhile, the leaf area index (LAI) was set at 3.0 considering that the study areas for case study 2 were urban areas. The diameters of tree crown and tree height were set to a value close to the study area’s current vegetation (Table 3). In addition, the study analyzed the effect of temperature reduction through a simulation of the temperature at two meters above the ground as felt by a pedestrian and a comparison of temperatures before and after greening.

3. Results

3.1. Application Outcomes of Spaces for Rooftop Greening and Roadside Tree Planting

The application of the developed algorithm to identify locations suitable for rooftop greening and roadside tree planting within the study area are shown in Figure 6 and Figure 7. The satellite imageries of the study area were compared with the analysis results, and accuracy of acceptable levels were identified. Excluding buildings that are over 30 years old and that have sloped roofs or have already applied green planting, rooftop greening is possible in 311,793 of 742,770 buildings. This is about 42% of all buildings in the study area, and it means that green roofs can be applied to a considerable number of buildings. Among the 25 districts in Seoul, the administrative district that is most applicable for rooftop greening is district A. This is because compared with other areas, the buildings recently constructed in the area mostly have flat roofs. The total rooftop floor area of Seoul is 67,128,199 m2, and the rooftop floor area of buildings that can apply rooftop greening is 35,230,926 m2. Excluding the total area of 1,942,179 m2 of auxiliary facilities installed on rooftops, the area suitable for rooftop greening is 33,288,745 m2, which is 50% of the total rooftop area of Seoul. District B was found to have the most rooftop green areas. The results are different from those in areas where many rooftop-green buildings are suitable. That is because buildings in district B tend to be older than those in district A, but the area of an individual building tends to be greater (Figure 6).
The results determined that roadside trees could be planted on a sidewalk with an extension length of 872,725 m and an area of 838,864 m2. A total of 145,366 trees can be planted in the study area if one tree has a diameter of 6 m. This excludes the sidewalk section around the site of the urban development project, which is currently underway, and more roadside planting is expected in the future if the section is included. The areas where the most street trees can be planted is District C. This is because the municipal maintenance project in District C has secured more sidewalk space than other areas (Figure 7).
Meanwhile the area and quantity of greening and tree planting in the location of case study 2 are shown in Figure 8 and Table 4. According to the locational criteria of the developed algorithm, study area B is 1.5 times larger than study area A in terms of the area suitable for rooftop greening. Moreover, 107 more roadside trees can be planted in study area A than in study area B. Study area C does not have buildings that are suitable for rooftop greening due to the age of the buildings and because most regions, excluding buildings and roads, are already greened, so only boundary areas are suitable for planting roadside trees.

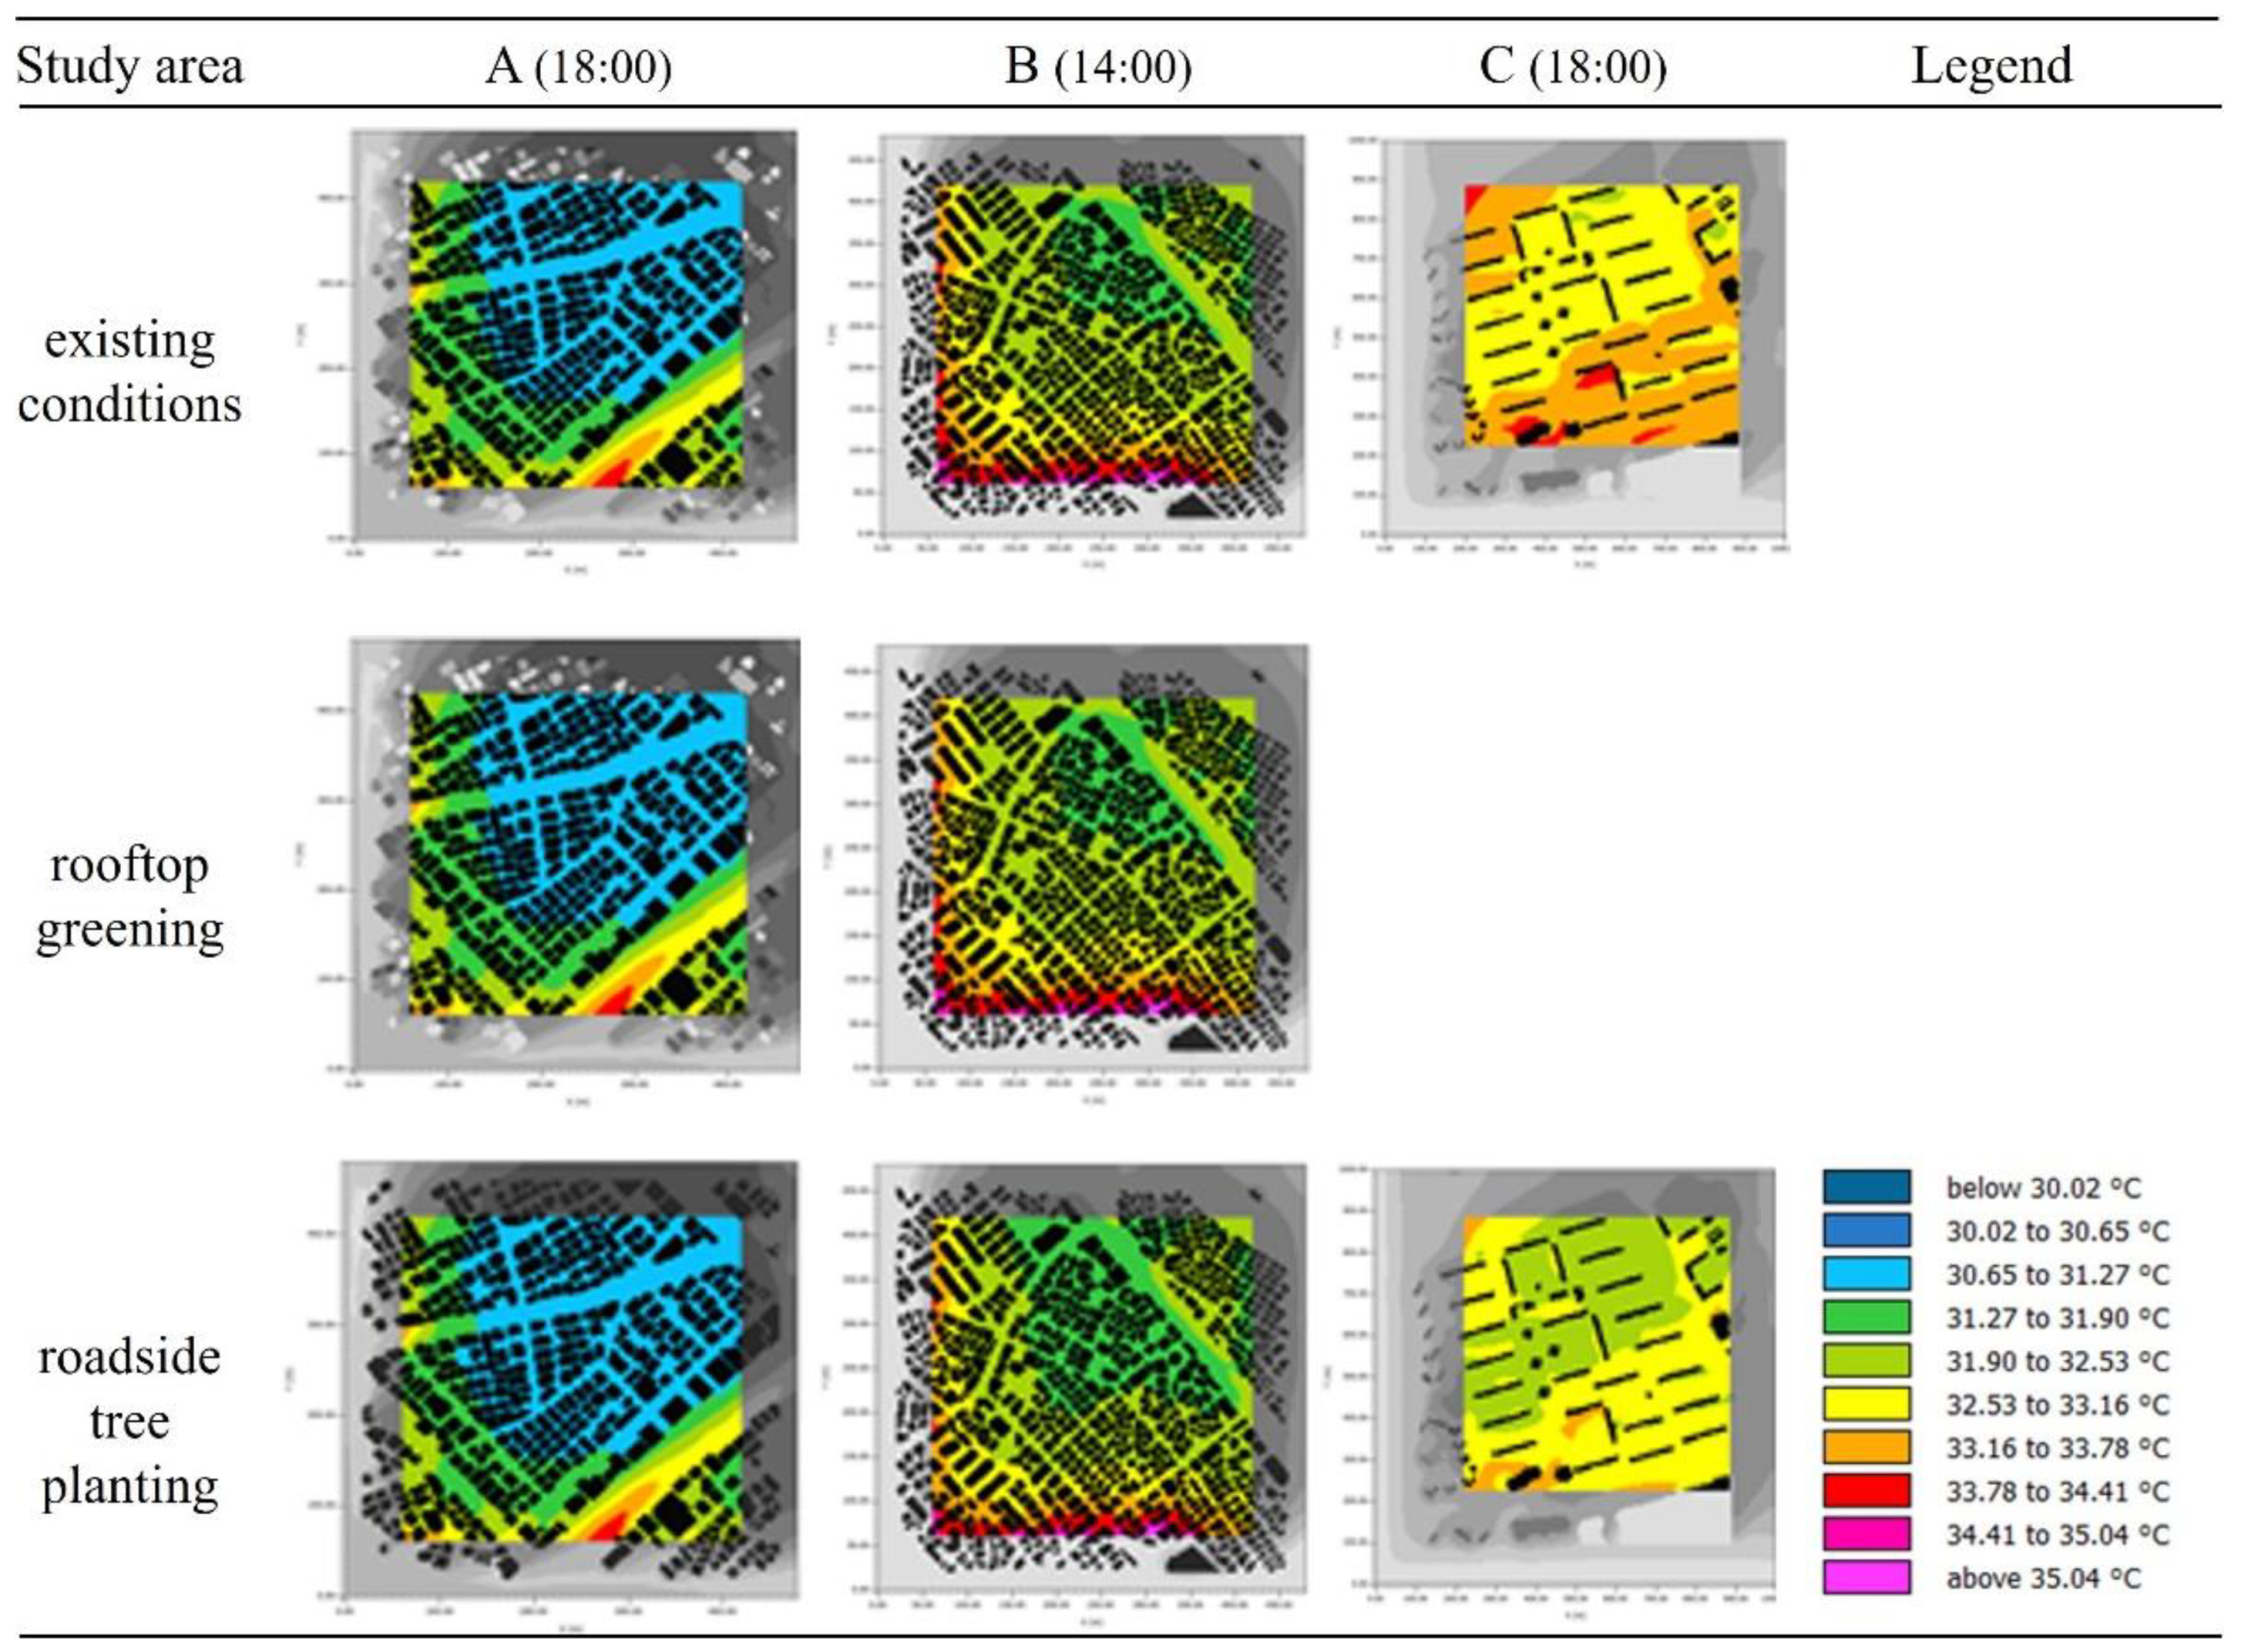
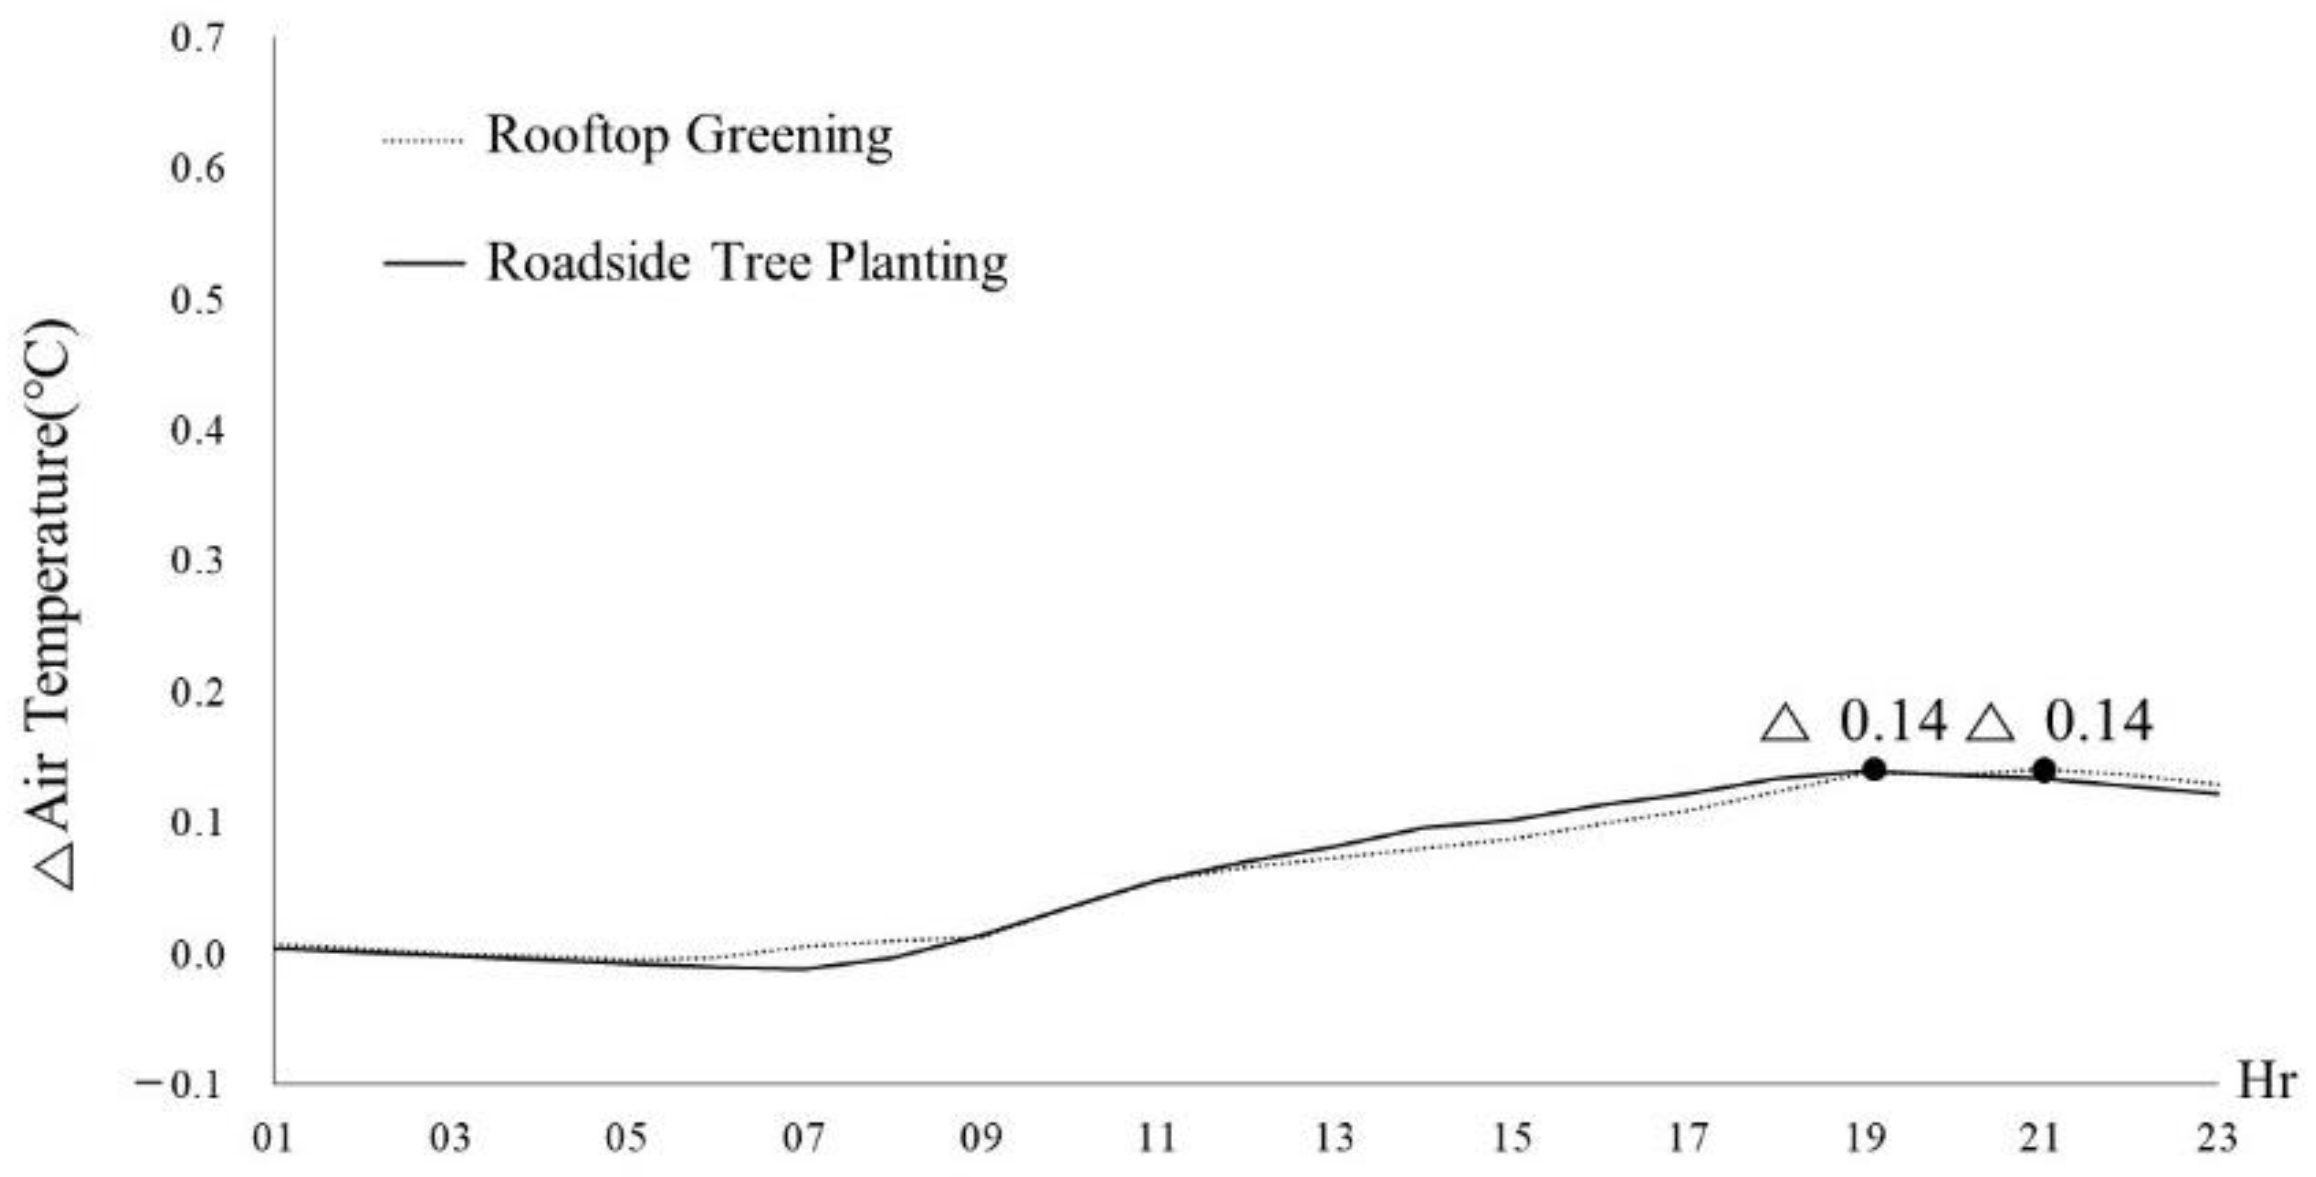
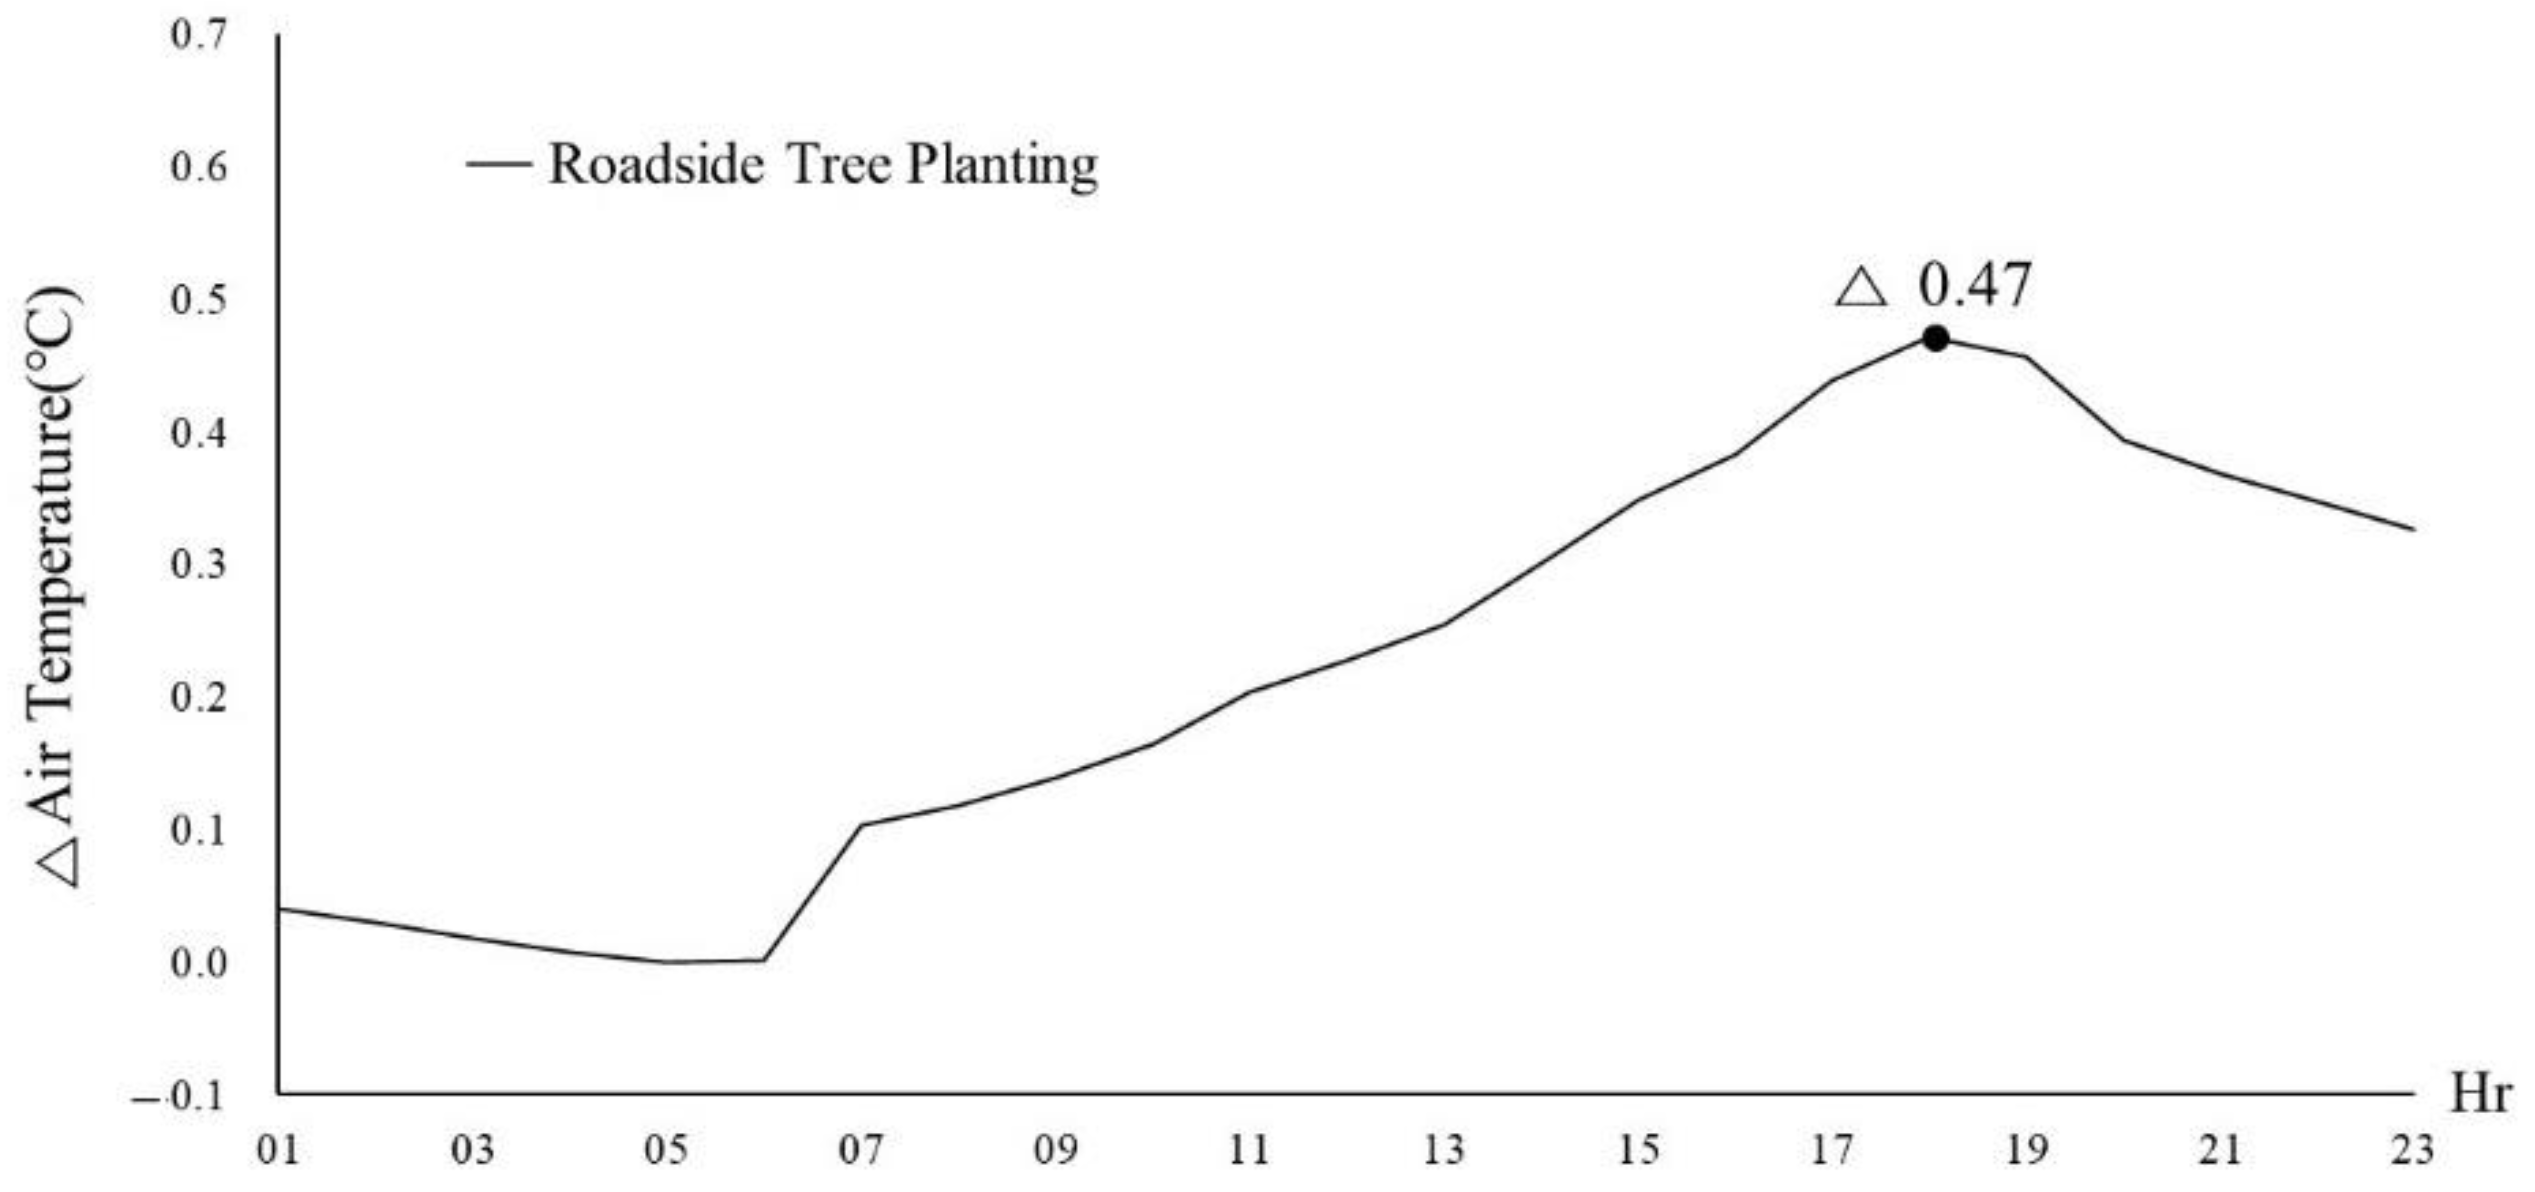
3.2. Temperature Reduction Effect Due to Additional Rooftop Greening and Roadside Tree Planting

The analysis outcomes of rooftop greening and roadside tree planting were transformed into entry materials for weather simulation (Figure 9), and an analysis was conducted for 24 h for temperatures at 2 m above ground level by scenario. Figure 10 presents the temperature analysis of the time zone with the largest temperature difference by study area. It can be confirmed that the temperature inside the study areas was reduced due to rooftop greening and roadside tree planting. Furthermore, roadside tree planting produced a better temperature reduction effect than rooftop greening.
The average daily temperature of study area A was 26.67, with a range of 21.17 °C to 31.93 °C. By scenario, both rooftop greening and roadside tree planting scenarios had the highest average temperature at 18:00. Compared with the existing condition, rooftop greening was 0.13 °C at 21:00 and street tree planting was 0.6 °C at 20:00 (Figure 11). The daily average temperature of the study area B was 27.17 °C, ranging from 21.16 °C to 33.08 °C and exceeding 30 °C from 14 h. Compared with the existing condition, rooftop greening was 0.14 °C at 19 h and roadside tree planting was 0.14 °C at 21:00, showing maximum temperature reduction during nighttime (Figure 12). On the other hand, the study area C, which mostly consists of old apartments, had a daily average temperature of 28.3 °C, with a range of 22.1 °C to 34.1 °C. The minimum temperature was 22.10 °C at 01:00 and the maximum temperature was 34.12 °C at 16:00. The maximum temperature reduction effect from street tree planting was 0.47 °C at 18:00 (Figure 13).
The temperature reduction effect of study area B was 0.1 °C, higher than study area A, although study area B has 1.8 times more rooftop green areas than study area A. The temperature reduction effect was very small compared with the area of rooftop greening, which is believed to be the result of the temperature reduction effect in the rooftop layer failing to reach the ground level. Prior studies [28,29] have shown that the effect of temperature reduction from rooftop greening diminishes as it gets closer to the ground. On the other hand, the effects of roadside tree planting have been shown to increase and are related to the number of planting possibilities. The number of roadside trees that can be planted was 290 in study area A, 83 in study area B, and 173 in study area C, respectively, with maximum effects of 0.59 °C, 0.47 °C, and 0.14 °C. This is because unlike rooftop greening, the effect of temperature reduction brought by roadside trees directly affects the change in temperature at ground level. Unlike areas B and C, area A allows for the internal planting of roadside trees and is able to produce a greater effect (Table 5).

4. Discussion

The main findings from this study are as follows. It was found that rooftop greening is possible for 311,793 buildings (42% of all buildings). The total suitable area for rooftop greening is 33,288,745 m2, which is 50% of the total rooftop area of Seoul. The total park area of Seoul is about 168,890,000 m2. Thus, about 20% of total green areas could be increased, once suitable rooftop areas are completely changed to green roofs. In addition, 145,366 additional plantings are possible in the study area. Such results show that even if many roadside trees (about 403,161) are already planted in the study area, additional roadside trees can be planted in many other spaces.
This study analyzed the effects of temperature reduction resulting from rooftop greening and roadside tree planting through Envi-met simulations. It was shown that the introduction of green roofs reduced temperatures by 0.13 °C to 0.14 °C and roadside trees reduced temperatures by 0.14 °C to 0.6 °C. Both greening and tree planting showed maximum temperature reduction after sunset, when latent heat effects begin to increase. The maximum temperature reduction effect did not differ much from prior research, but the temperature reduction effect was measured at a somewhat lower value. This is because unlike prior studies [38,39], this study applied only the actual applicable rooftop green locations. The effect of roadside trees has also been reported to reduce temperatures by up to 1.2–3.3 °C [18], but in this study, it was found that the effects were not as strong because roadside tree planting was mainly possible around the sites. This means that the physical form of urban spaces not only determines the planting areas and locations, but also the effects.
Meanwhile, the results of this study are expected to be useful for establishing greenery planning of local governments. Rooftop greening and roadside tree planting are classified as public goods that are publicly supplied. The local government should first identify what areas and how much room is available for the effective supply and management of rooftop greening and roadside trees. However, green roofs and roadside trees are very small compared with other urban facilities, and suitable spaces are widely distributed throughout cities. In addition, there is no specific analysis of where the facilities could be introduced due to the lack of analysis data and the vastness of the data. This study specifically analyzed suitable locations, areas, and quantities of rooftop greening and roadside tree planting in a metropolitan city. In addition, the entire processes were developed by using an automated data analysis model, and thus the speed and convenience of planning the introduction and expansion of green areas was increased. Based on the study results, the local government can determine the priority of greening by considering factors such as frequently effected urban heat island areas, heat vulnerable dense areas, areas where temperature reduction effects can be greatly shown, and the willingness of building and landowners to participate.
Meanwhile, this study has the following limitations: this study mainly focused on physical factors such as building stability, building shape, rooftop shape and facilities, walking spaces, and tree crown in the analysis of suitable areas for rooftop greening and roadside planting. In reality, rooftop greening and roadside tree planting are not possible in all areas identified by the analysis results. In fact, the actual feasibility of green space projects is often determined by the policies and efforts of local governments, available budgets, and the willingness of building or landowners to participate. Above all, social welfare considerations that should involve many benefits for urban residents in vulnerable situations are also needed. In addition, the effects of promoting ecosystem service including microclimate control, flood control, and carbon storage can be determined by the greening methods (species, scale, planting method, etc.), so it is necessary to study the landscape planning and design that can improve this effect in total. Thus, in order to increase the usefulness of this study, further research on the integrated analysis for the greening priority should be followed to consider the physical (spatial and locational) and non-physical (economic and social) factors.

5. Conclusions

Small green spaces such as green roofs and roadside trees are attracting attention as planning factors that can increase the effectiveness of ecosystem services. This study built an automated data analysis model to determine suitable areas for rooftop greening and roadside tree planting. A case study specifically maps the location, area, and quantity of green roofs and roadside trees in large cities and verifies the usefulness of the developed analytical algorithm by analyzing the expected temperature reduction effects of planting in potential spaces. Through such a case study, the effects of rooftop greening and expanding roadside tree planting in an actual location is analyzed in detail. In addition, by establishing a data analysis model to specifically analyze the location, area, and quantity of each greening technique, the speed and convenience of planning the introduction and expansion of green areas in cities was increased. Once the priority of greening is comprehensively analyzed by considering the physical (spatial and locational) and non-physical (economic and social) factors, the usefulness of this study will increase more. Nevertheless, a reliable national spatial DB and GIS spatial analysis-based small green facility location analysis algorithm can be useful as a planning tool to expand green areas and improve ecosystem services in cities.

Author Contributions

This article is the result of the joint work by all the authors. K.O. supervised and coordinated work on the paper. All the authors conceived, designed, and carried out the methods selection and analyzed the data. All the authors prepared the data visualization and contributed to the writing of this paper. All the authors discussed and agreed to submit the manuscript. All authors have read and agreed to the published version of the manuscript.

Funding

This research was funded by the Korea Ministry of Environment (MOE) grant number 2020002780001.

Institutional Review Board Statement

Not applicable.

Informed Consent Statement

Not applicable.

Data Availability Statement

Not applicable.

Acknowledgments

This work was conducted with support of the Korea Environment Industry and Technology Institute (KEITI) through its Urban Ecological Health Promotion Technology Development Project, and funded by the Korea Ministry of Environment (MOE) (2020102780001).

Conflicts of Interest

The authors declare no conflict of interest.

References

  1. Hsieh, C.-M.; Huang, H.-C. Mitigating urban heat islands: A method to identify potential wind corridor for cooling and ventilation. Comput. Environ. Urban Syst. 2016, 57, 130–143. [Google Scholar] [CrossRef]
  2. Shafique, M.; Kim, R.; Rafiq, M. Green roof benefits, opportunities and challenges—A review. Renew. Sustain. Energy Rev. 2018, 90, 757–773. [Google Scholar] [CrossRef]
  3. Santamouris, M. Cooling the cities—A review of reflective and green roof mitigation technologies to fight heat island and improve comfort in urban environments. Sol. Energy 2012, 103, 682–703. [Google Scholar] [CrossRef]
  4. Hancock, T.; Duhl, L. Promoting Health in the Urban Context; WHO Healthy Cities Papers No. 1; World Health Organization: Geneva, Switzerland, 1988. [Google Scholar]
  5. Lee, D.; Oh, K. The Green Infrastructure Assessment System (GIAS) and Its Applications for Urban Development and Management. Sustainability 2019, 11, 3798. [Google Scholar] [CrossRef] [Green Version]
  6. Turner, M.G.; Gardner, R.H.; O’neill, R.V. Landscape Ecology in Theory and Practice: Pattern and Process; Springer: New York, NY, USA, 2015. [Google Scholar]
  7. Gaffin, S.R.; Khanbilvardi, R.; Rosenzweig, C. Development of a Green Roof Environmental Monitoring and Meteorological Network in New York City. Sensors 2009, 9, 2647–2660. [Google Scholar] [CrossRef]
  8. Rose, L.S.; Akbari, H.; Taha, H. Characterizing the Fabric of the Urban Environment: A Case Study of Greater Houston, Texas; Lawrence Berkeley National Lab. (LBNL): Berkeley, CA, USA, 2003. [Google Scholar]
  9. Gago, E.; Roldan, J.; Pacheco-Torres, R.; Ordóñez, J. The city and urban heat islands: A review of strategies to mitigate adverse effects. Renew. Sustain. Energy Rev. 2013, 25, 749–758. [Google Scholar] [CrossRef]
  10. Park, E.J.; Kang, K.I.; Nam, M.A. Green roof strategy for mitigating the urban heat island effect. Policy Res. 2010, 25, 1–168. [Google Scholar]
  11. Meyer, M.H. The Master Gardener Program 1972–2005. Hortic. Rev. 2007, 393–420. [Google Scholar] [CrossRef]
  12. Peper, P.J.; McPherson, E.G.; Simpson, J.R.; Albers, S.N.; Xiao, Q. Central Florida community tree guide: Benefits, costs, and strategic planting. Gen. Tech. Rep. PSW 2010, 230. [Google Scholar] [CrossRef] [Green Version]
  13. Yumagulova, L.; Vertinsky, I. Climate Change Adaptation and Flood Management in Metro Vancouver Regional Area: Can an Exercise in Herding Cats be Successful? J. Sustain. Dev. Energy Water Environ. Syst. 2017, 5, 273–288. [Google Scholar] [CrossRef] [Green Version]
  14. Yeh, A.G.-O.; Chow, M.H. An integrated GIS and location-allocation approach to public facilities planning—An example of open space planning. Comput. Environ. Urban Syst. 1996, 20, 339–350. [Google Scholar] [CrossRef]
  15. Wu, C.; Xiao, Q.; McPherson, E.G. A method for locating potential tree-planting sites in urban areas: A case study of Los Angeles, USA. Urban For. Urban Green. 2008, 7, 65–76. [Google Scholar] [CrossRef]
  16. Park, E.-J.; Nam, M.; Kang, G. Estimation of the Potential Area for Roof Greening in Gyeonggi-do and Its Implications. J. Korea Soc. Environ. Restor. Technol. 2012, 15, 107–117. [Google Scholar] [CrossRef]
  17. Ahn, J.-Y.; Jung, T.-W.; Koo, J.-H. Estimation of the Available Green Roof Area using Geo-Spatial Data. J. Korea Soc. Environ. Restor. Technol. 2016, 19, 11–17. [Google Scholar] [CrossRef] [Green Version]
  18. Wang, Y.; Akbari, H. The effects of street tree planting on Urban Heat Island mitigation in Montreal. Sustain. Cities Soc. 2016, 27, 122–128. [Google Scholar] [CrossRef]
  19. Park, C.Y.; Lee, D.K.; Krayenhoff, E.S.; Heo, H.K.; Hyun, J.H.; Oh, K.; Park, T.Y. Variations in pedestrian mean radiant temperature based on the spacing and size of street trees. Sustain. Cities Soc. 2019, 48, 101521. [Google Scholar] [CrossRef]
  20. Susca, T.; Gaffin, S.; Dell’Osso, G. Positive effects of vegetation: Urban heat island and green roofs. Environ. Pollut. 2011, 159, 2119–2126. [Google Scholar] [CrossRef]
  21. Wang, Y.; Berardi, U.; Akbari, H. Comparing the effects of urban heat island mitigation strategies for Toronto, Canada. Energy Build. 2016, 114, 2–19. [Google Scholar] [CrossRef]
  22. Feng, C.; Meng, Q.; Zhang, Y. Theoretical and experimental analysis of the energy balance of extensive green roofs. Energy Build. 2010, 42, 959–965. [Google Scholar] [CrossRef]
  23. Moonen, P.; Defraeye, T.; Dorer, V.; Blocken, B.; Carmeliet, J. Urban Physics: Effect of the micro-climate on comfort, health and energy demand. Front. Arch. Res. 2012, 1, 197–228. [Google Scholar] [CrossRef] [Green Version]
  24. Mirzaei, P.A.; Haghighat, F. Approaches to study Urban Heat Island—Abilities and limitations. Build. Environ. 2010, 45, 2192–2201. [Google Scholar] [CrossRef]
  25. Myrup, L.O. A Numerical Model of the Urban Heat Island. J. Appl. Meteorol. Climatol. 1969, 8, 908–918. [Google Scholar] [CrossRef]
  26. Lee, D.; Oh, K. Developing the Urban Thermal Environment Management and Planning (UTEMP) System to Support Urban Planning and Design. Sustainability 2019, 11, 2224. [Google Scholar] [CrossRef] [Green Version]
  27. Rui, L.; Buccolieri, R.; Gao, Z.; Ding, W.; Shen, J. The Impact of Green Space Layouts on Microclimate and Air Quality in Residential Districts of Nanjing, China. Forests 2018, 9, 224. [Google Scholar] [CrossRef] [Green Version]
  28. Grant, E.J.; Jones, J.R. A Decision-making Framework for Vegetated Roofing System Selection. J. Green Build. 2008, 3, 138–153. [Google Scholar] [CrossRef] [Green Version]
  29. Naveh, Z. What is holistic landscape ecology? A conceptual introduction. Landsc. Urban Plan. 2000, 50, 7–26. [Google Scholar] [CrossRef]
  30. Haaland, C.; Bosch, C.K.V.D. Challenges and strategies for urban green-space planning in cities undergoing densification: A review. Urban For. Urban Green. 2015, 14, 760–771. [Google Scholar] [CrossRef]
  31. Kong, F.; Yin, H.; Nakagoshi, N. Using GIS and landscape metrics in the hedonic price modeling of the amenity value of urban green space: A case study in Jinan City, China. Landsc. Urban Plan. 2007, 79, 240–252. [Google Scholar] [CrossRef]
  32. Kim, H.; Oh, K.; Lee, S.-J. The effects of green and cool roofs on temperature reduction in Seoul using a mesoscale meteorological model (WRF-ARW). Seoul Stud. 2018, 19, 39–57. [Google Scholar]
  33. MOLIT (Korean Ministry of Land, Infrastructure and Transport). Establishment and Management of Sidewalk Guideline; MOLIT: Sejong, Korea, 2018. [Google Scholar]
  34. Aziz, H.A.; Ismail, Z. Design guideline for sustainable green roof system. In Proceedings of the 2011 IEEE Symposium on Business, Engineering and Industrial Applications, Langkawi, Malaysia, 25–28 September 2011. [Google Scholar]
  35. Lee, D.; Oh, K.; Jung, S. Classifying Urban Climate Zones (UCZs) Based on Spatial Statistical Analyses. Sustainability 2019, 11, 1915. [Google Scholar] [CrossRef] [Green Version]
  36. Stempihar, J.J.; Pourshams-Manzouri, T.; Kaloush, K.E.; Rodezno, M.C. Porous Asphalt Pavement Temperature Effects for Urban Heat Island Analysis. Transp. Res. Rec. J. Transp. Res. Board 2012, 2293, 123–130. [Google Scholar] [CrossRef]
  37. Van Wijk, W.R.; Ubing, D.W.S. Radiation. In Physics of Plant Environment; North-Holland Pub. Co.: Amsterdam, The Netherlands, 1963; pp. 62–101. [Google Scholar]
  38. Feyisa, G.L.; Dons, K.; Meilby, H. Efficiency of parks in mitigating urban heat island effect: An example from Addis Ababa. Landsc. Urban Plan. 2014, 123, 87–95. [Google Scholar] [CrossRef]
  39. Tan, P.Y.; Sia, A. A pilot green roof research project in Singapore. In Proceedings of the Third Annual Greening Rooftops for Sustainable Communities Conference, Awards and Trade Show, Washington, DC, USA, 4–6 May 2005. [Google Scholar]
Figure 1. Conditions of suitable locations for rooftop greening and roadside planting. (a) Simplified 3D model for rooftop greening. (b) Simplified 2D model for roadside planting.
Applsci 11 07368 g001
Figure 2. Algorithm for analyzing suitable locations for green roofs.
Applsci 11 07368 g002
Figure 3. Algorithm for analyzing suitable locations for roadside tree planting.
Applsci 11 07368 g003
Figure 4. The study area (Seoul, South Korea). (a) Satellite image (Source: http://maps.kakao.com, accessed date: 20 August 2020) and administrative boundary. (b) Distribution of daily average temperatures of the study Area. (Source: Observation Data from Korea Meteorological Administration (public) and SK teckX (private) Automated Weather Systems; no precipitation in 2017; average daily cloud amount below 3; the average air temperature of the nine days when the average wind speed is below 5.4 m/s).
Applsci 11 07368 g004
Figure 5. The study areas of case study 2. (Source: Satellite imagery, http://maps.kakao.com, accessed date: 20 August 2020).
Applsci 11 07368 g005
Figure 6. Analysis results of locations suitable for rooftop greening.
Applsci 11 07368 g006
Figure 7. Analysis results of locations suitable for roadside tree planting.
Applsci 11 07368 g007
Figure 8. Analysis results of locations suitable for roadside tree planting in case study areas A, B and C.
Applsci 11 07368 g008
Figure 9. Scenarios for analysis of temperature reduction effects.
Applsci 11 07368 g009
Figure 10. Results of the Envi-met simulation.
Applsci 11 07368 g010
Figure 11. Temperature reduction effect of area A.
Applsci 11 07368 g011
Figure 12. Temperature reduction effect of area B.
Applsci 11 07368 g012
Figure 13. Temperature reduction effect of area C.
Applsci 11 07368 g013
Table 1. Analytical data for the study.
MeasuresData NameFieldTypePrecision
(Scale, Unit)
Source
green roofsbuilding spatial data-.shp1:1000http://www.nsdi.go.kr
(accessed date: 1 June 2020)
building unit informationyear, roof type (flat or slope), number of floors.txtbuildinghttp://www.nsdi.go.kr
(accessed date: 1 June 2020)
building floor informationarea of rooftop, area of existing facilities on the roof.txtbuilding floorhttp://www.nsdi.go.kr
(accessed date: 1 June 2020)
existing green roof dataarea, x-y coordinate.txt-https://data.seoul.go.kr
(accessed date: 9 August 2020)
heliport datax-y coordinate.txtbuildinghttps://data.seoul.go.kr
(accessed date: 9 August 2020)
roadside treessidewalkwidth (m).shp1:1000http://www.nsdi.go.kr
(accessed date: 1 June 2020)
Road-.shp1:1000http://www.nsdi.go.kr
(accessed date: 1 June 2020)
existing tree datax-y coordinate, amount.txt-https://data.seoul.go.kr
(accessed date: 9 August 2020)
Table 2. Urban spatial characteristics for study areas A, B and C.
Study Area AStudy Area BStudy Area C
land usageresidential and commercialresidentialresidential
building coverage ratio (%)657040
floor area ratio (%)190200138
impervious surface ratio (%)90.510065
building floormean3215
standard deviation2.3800
Table 3. Main Configuration File for Envi-met.
CategoriesInput Condition
integration period10 June 2015. (24 h)
resolution (m)stud area A and B: 2 m × 2 m × 3 m
study area C: 5 m × 5 m × 4 m
initial temperature (°C)24.9 °C
wind speed (m/s)2.0
wind direction215.3
roughness0.1
relate humidity in 2 m (%)40
Experimentsbuildingalbedo of roofs and walls: 0.3
soilasphalt (Albedo: 0.2)
green roof (a)grass (Albedo: 0.26)
roadside tree (c)height: 23 m, width: 30 m, LAI: 3.0
Table 4. Suitable areas for rooftop greening and roadside tree planting in study areas A, B, and C.
Study AreaTotal Number of BuildingsGreen Roof BuildingsRoadside Tree Planting
CountArea (m2)CountArea (m2)Amount
A46569,599.5211718,192.64290
B71849,110.4337232,058.6883
C5942,214.21--173
Table 5. Temperature reduction effect of rooftop greening and roadside tree planting.
SimulationAir Temperature (°C)
ABC
existing conditionmean (day)26.6727.1728.33
max (hr)31.93 (18:00)33.08 (18:00)34.12 (16:00)
rooftop greeningmean (day)26.6427.11-
max (hr)31.82 (18:00)32.96 (18:00)-
reduction effect (hr)▼0.12 (21:00)▼0.14 (21:00)-
roadside tree plantingmean (day)26.4327.1128.11
max (hr)31.36 (18:00)32.95 (18:00)33.74 (16:00)
reduction effect (hr)▼0.59 (20:00)▼0.14 (19:00)▼0.47 (18:00)
Publisher’s Note: MDPI stays neutral with regard to jurisdictional claims in published maps and institutional affiliations.

