Abstract
Three activated carbons from lignocellulosic residues and a commercial carbon have been tested for the removal of the herbicide metolachlor and its two degradation transformation products, named ESA and OXA, in aqueous solutions. The kinetics and equilibrium adsorption were studied for the four materials, showing higher adsorption capacities for the three molecules on the carbon materials chemically activated by potassium carbonate, mainly associated with its greater porous development, especially in the range of microporosity. Additionally, the chemical composition of the adsorbents also highlighted their important influence on the ESA and OXA adsorption process. The efficient adsorption of both compounds—even at low initial concentrations—allows a removal efficiency of up to 80% to be reached, revealing promising perspectives for the use of biomass-derived carbon materials for the elimination of not only the herbicide metolachlor, but also its degradation compounds from contaminated wastewater.
1. Introduction
Pesticides have become indispensable for intensive agricultural areas around the world, since they increase the production and improve the quality of agricultural production. However, when they are sprayed on crop plants, a fraction of pesticides is transferred through the soil and can reach aquifers, affecting the groundwater quality, making it unsuitable for human and agricultural uses [1,2,3]. Additionally, pesticides’ transformation products (TPs) have also emerged as an area of concern due to their high mobility and their less degradation compared to the parent molecule [4]. For this reason, the protection of water resources is an essential issue to be treated at worldwide scale. There are different methods to remove the presence of contaminants in surface water and groundwater, including electrochemical processes, photocatalysis and adsorption [5,6,7,8], as most representatives.
Metolachlor—belonging to the acetamide class of herbicides—is applied as a mixture enriched in S isomer (S-metolachlor), widely used for selective weed control, and it represents one of the most common organic compounds found in groundwater [1,9,10]. Its degradation in water is promoted by microbial decomposition, provoking the formation of metolachlor oxanilic acid (OXA) and metolachlor ethane sulfonic acid (ESA) which are commonly quantified in groundwater at concentrations over that of metolachlor, which can reach up to 5 µg/L [11,12,13,14,15]. Concerning the water intended for human consumption, the EU (Drinking Water Directive 98/83/EC [16]) established a maximum legal concentration of 0.1 µg/L for individual pesticides and their relevant TPs, and 0.5 µg/L for total pesticides and total relevant TPs. Hence, it seems clear that there is a need for an efficient methodology to remove the excess of pesticides and their TPs from water.
Several works have reported on water remediation by the adsorption of metolachlor on different porous materials. Otero and co-workers reported the adsorption of S-metolachlor on two mesoporous materials, a phenolic resin and a mesoporous carbon, revealing a high adsorption capacity due to their porous structure [17]. Similarly, Etcheverry et al. employed porous alginate-montmorillonite beads for the adsorption of metolachlor for water purification, showing the adsorption of the herbicide on the montmorillonite component [18]. More recently, activated carbons and biochar have been employed as efficient adsorbents for this herbicide [19,20]. However, the differences in physicochemical properties between the metabolites ESA and OXA and their parent molecule may cause different adsorption mechanisms, since the parent pesticide is electrically neutral, whereas its two metabolites are anionic in aqueous environment.
To the best of the authors’ knowledge, the OXA and ESA metolachlor metabolites’ adsorption, applied to environmental remediation, has not been studied. Accordingly, the purpose of this work is to analyze the TPs adsorption on four different highly porous activated carbons (commercially available and synthetized from biomass). For comparison, the parent compound (metolachlor) was also tested. The adsorbents were exhaustively characterized, and the relationship between the adsorbent’s physicochemical properties and the yield of adsorption of the different organic compounds was studied.
2. Materials and Methods
2.1. Materials
Metolachlor (MET) (racemic mixture), ESA and OXA were purchased from LGC Standards. Potassium carbonate (purity > 98%) and H3PO4 (85%) were obtained from Across Organics and Alfa Aesar, respectively. The chemicals were used without further purification. For clarity, the physico-chemical properties of the adsorbates including the molecular structures are shown in Table S1. All solutions were prepared with ultra-pure water obtained from Milli-Q water purification systems.
A commercial activated carbon (AQ630) was supplied by JACOBI Carbons (Vierzon, France). The rest of the activated carbons were obtained by chemical activation of two lignocellulosic precursors, rape straw and sunflower seed shell, supplied by Region Centre-Val de Loire. Two different activation protocols were employed. Firstly, the precursors were activated with K2CO3 following the activation process described in [19], briefly, a mass of 1 g of precursor was impregnated with a mass of 1 g of K2CO3 (1:1), then the activation was performed at 800 °C for 1 h under N2 flow of 160 mL/min (heating rate 10 °C/min) in a horizontal furnace. Two impregnation procedures were followed as a function of the used precursor. For the impregnation of the rape straw, which was received as fine powder (10–100 µm), a physical impregnation in a mortar was made at room temperature. On the other hand, the sunflower seed shells were used as flakes (due to the nature of the shells) and the activating agent impregnation was made by means of a wet process. The impregnation consisted in stirring the precursor and activating agent (1:1) with ca. 10 mL of water overnight, then the mixture was dried in an oven at 80 °C up to constant weight to ensure the well contact between the precursor flakes and K2CO3. Secondly, the rape straw was also activated by H3PO4; in this case, a mass of 1 g of residue was impregnated with phosphoric acid 85% (ratio 1:1 w/w) and heated to 80 °C under manual shaking for 30 min. It was then dried in an oven at 110 °C for 15 h, then the activation was performed at 500 °C for 1 h, applying a heating rate of 20 °C/min under N2 flow of 160 mL/min. The activated carbon obtained was immersed in a hydrochloric acid solution (37%) for 20 min to eliminate the inorganic residues. All the materials were washed with distilled water until constant pH to remove any water-soluble species and the excess of activating agent, dried at 60 °C overnight and stored in a desiccator.
The nomenclature of samples was as follows: X-YY, with X being related to the precursor (R for rape and S for sunflower) and YY being the activating agent (KC and PO for K2CO3 and H3PO4, respectively). For example, R-PO is rape straw activated by phosphoric acid.
2.2. Physico-Chemical Characterization
The lignocellulosic composition (cellulose, hemicelluloses and lignin) of the employed precursors was analyzed following a procedure described in detail elsewhere [21]. In brief, the precursors were soxhlet extracted with ethanol for 1 h followed by water for 1 h. For these extracted samples, Klason and acid-soluble lignins were determined by using 72% sulfuric acid solution. Holocellulose was quantified with sodium chlorite treatment and α-cellulose content was determined by extraction with 17.5% aqueous sodium hydroxide of the holocellulose powder. Cellulose content was evaluated by the sum of α-cellulose content and ashes, and hemicellulose amount was obtained by the difference between holocellulose and cellulose. The ashes were obtained by weight after the incineration of samples at 600 °C for 4 h. All of the analyses were made in duplicate.
The porosity of the materials was characterized by measuring the N2 adsorption/desorption isotherms at −196 °C (ASAP 2020, Micromeritics). The materials were previously outgassed under vacuum (ca. 10−4 Pa) at 120 °C for 17 h. The isotherms were used to determine several textural parameters such as specific surface area (SBET), total pore volume (Vtotal), micro- and mesopore volumes (W0, Vmeso).
Elemental analysis was carried out using the THERMO SCIENTIFIC FLASH2000 automatic analyzer. Thermogravimetric experiments were conducted using a thermobalance (STA 449 F5 Jupiter, NETZSCH). The superficial pH was determined measuring the pH of an equilibrated aqueous suspension (ca. 1 g/L) of the adsorbent. Surface chemical functionalities were measured by potentiometric titration according to the pKa distribution method based on titration with NaOH (0.1 M). Briefly, a mass of 50 mg of material was dispersed in a volume of 75 mL of NaNO3 (0.01 M) and degassed by nitrogen bubbling overnight; then, the pH was adjusted to ca. 3 using an HCl solution (0.1 M) and titrated by NaOH using a Titrino Plus system, Methrom. The functionalities were determined using the SAIEUS software applied on the proton affinity versus pH curves [22].
2.3. Adsorption Experiments
In order to determine the equilibrium time, 100 mL of a solution of the compound—with an initial concentration of 25 mg/L for MET and 8 mg/L for OXA and ESA—was mixed with a certain amount of adsorbent (5 mg for MET and 4 mg for OXA and ESA, corresponding to 0.5 and 0.2 g compound/g adsorbent, respectively) in glass flasks and continuously stirred (400 rpm) on a multi stirring plate (IKA brand) at 25 °C in a thermostatic water bath. Aliquots were measured at specific time intervals until equilibrium was reached. The solution volume was great enough to consider the volume changes negligible after aliquot withdrawal. The samples were filtered through a Nylon syringe filter (0.45 µm) and the concentration was measured on a Cary 60 UV-Vis spectrophotometer (Agilent Technologies) at the corresponding wavelength (230 nm). The composition of solutions with a low concentration was also determined by reverse phase HPLC in an apparatus equipped with a photodiode array detector (Shimadzu Nexera XR). The separation was conducting using a C18 column (Restek) with a particle size of 2.7 µm (3 mm × 100 mm). For the quantification of OXA and ESA, a binary mixture was employed, consisting of a 25 mM dipotassium hydrogen phosphate solution at pH 7 and acetonitrile (80:20 v/v) as the mobile phase. The column was thermostated at 60 °C and OXA and ESA were detected at a wavelength of 210 nm after ca. 1.7 and 2.2 min, respectively. For detection of MET, the mobile phase employed was water:acetonitrile (40:60 v/v) and the column was thermostated at 30 °C. The compound was detected at 230 nm after 5.5 min. In both cases, the mobile phase flow was set at 0.8 mL/min and the sample injection volume was 50 µL. LabSolutions software from Shimadzu was used for the identification and quantification of the molecules. The concentration of the compounds was calculated based on the relative peak areas using standards of known concentrations. Equilibrium adsorption isotherms were also carried out in 25 mL of solutions—with an initial concentration ranging from ca. 5 to 150 mg/L—containing 2.5 mg of adsorbent to obtain a range of 0.05–1.5 g compound/g adsorbent. The isotherms were carried out over the course of 3 h (equilibrium time based on the kinetic study).
Regarding the determination of the adsorption capacity at lower concentrations (imposed by the EU legislation [16]), 500 mL of ESA and OXA aqueous solutions (0.001 and 0.01 mg/L) were stirred at 400 rpm in glass flasks with a mass of 1 mg of adsorbent. After 3 h, an aliquot was taken and filtered with a Nylon syringe filter (0.45 µm). The concentration of OXA and ESA was analyzed with an SPE on-line ultra-high-performance liquid chromatograph with a tandem mass spectrometer (UPLC-MS-MS, Waters Quattro-Premier XE/Q). More details on the analytical method developed for off-line extraction were described in detail in [11].
All adsorption assays were performed in duplicate and a blank solution (without adsorbent) was used to check the adsorption of the sorbate on the walls.
The amount of compound adsorbed was determined by the equation:
where qt is the amount adsorbed in mg/g at time t, C0 and Ct are the concentrations of the compound in mg/mL in the initial solution and at t time, respectively, W is the weight of adsorbent in g, and V is the volume of the solution in mL.
2.4. Isotherms and Kinetics Models
Ho’s pseudo-second order [23,24] model was applied to describe the kinetics adsorption:
where k2 is the rate constant of pseudo-second order adsorption in g/mg h and qe is the amount adsorbed at the equilibrium in mg/g. The values of the rate constants and the amounts of adsorption at equilibrium were determined by the non-linear method using Origin software.
The equilibrium experimental adsorption data were fitted to Langmuir and Freundlich models. The Langmuir equation describes the monolayer adsorption and allows the calculation of the maximum amount adsorbed to complete the monolayer (qmax) in mg/g [25]:
where Ce is the liquid phase solute equilibrium concentration in mg/L and b is the Langmuir adsorption constant in L/mg.
The Freundlich model is an empirical model which assumes that the adsorption occurs on a heterogeneous surface. The expression is [26]:
where kf in (mg/g)(L/mg)1/nf and nf are Freundlich constants that depend on the solute–adsorbent interaction.
3. Results
3.1. Characterization of Precursors and Activated Carbons
3.1.1. Composition of the Lignocellulosic Precursors
It has been demonstrated that the microporous properties of the activated carbons depend not only on the experimental conditions of the carbonization and activation steps, but also preponderantly on the original nature and structure of the involved precursors. The lignocellulosic wastes used in this work had a high carbon content (ca. 45% and 50% for rape straw and sunflower seed, respectively) being appropriated to be used as precursors for obtaining activated carbons. The content of ashes was higher for the rape straw, which is related to the higher amount of P, K, S and Ca (Table 1); these differences are expected to show variations in the properties of the final activated carbons obtained from the precursors. Additionally, different percentages of cellulose, hemicellulose and lignin were obtained, with the lignin amount being the main difference between both compositions, with a four times higher value obtained for the rape straw.

Table 1.
Chemical composition of both lignocellulosic precursors.
3.1.2. Physico-Chemical Characterization of Activated Carbons
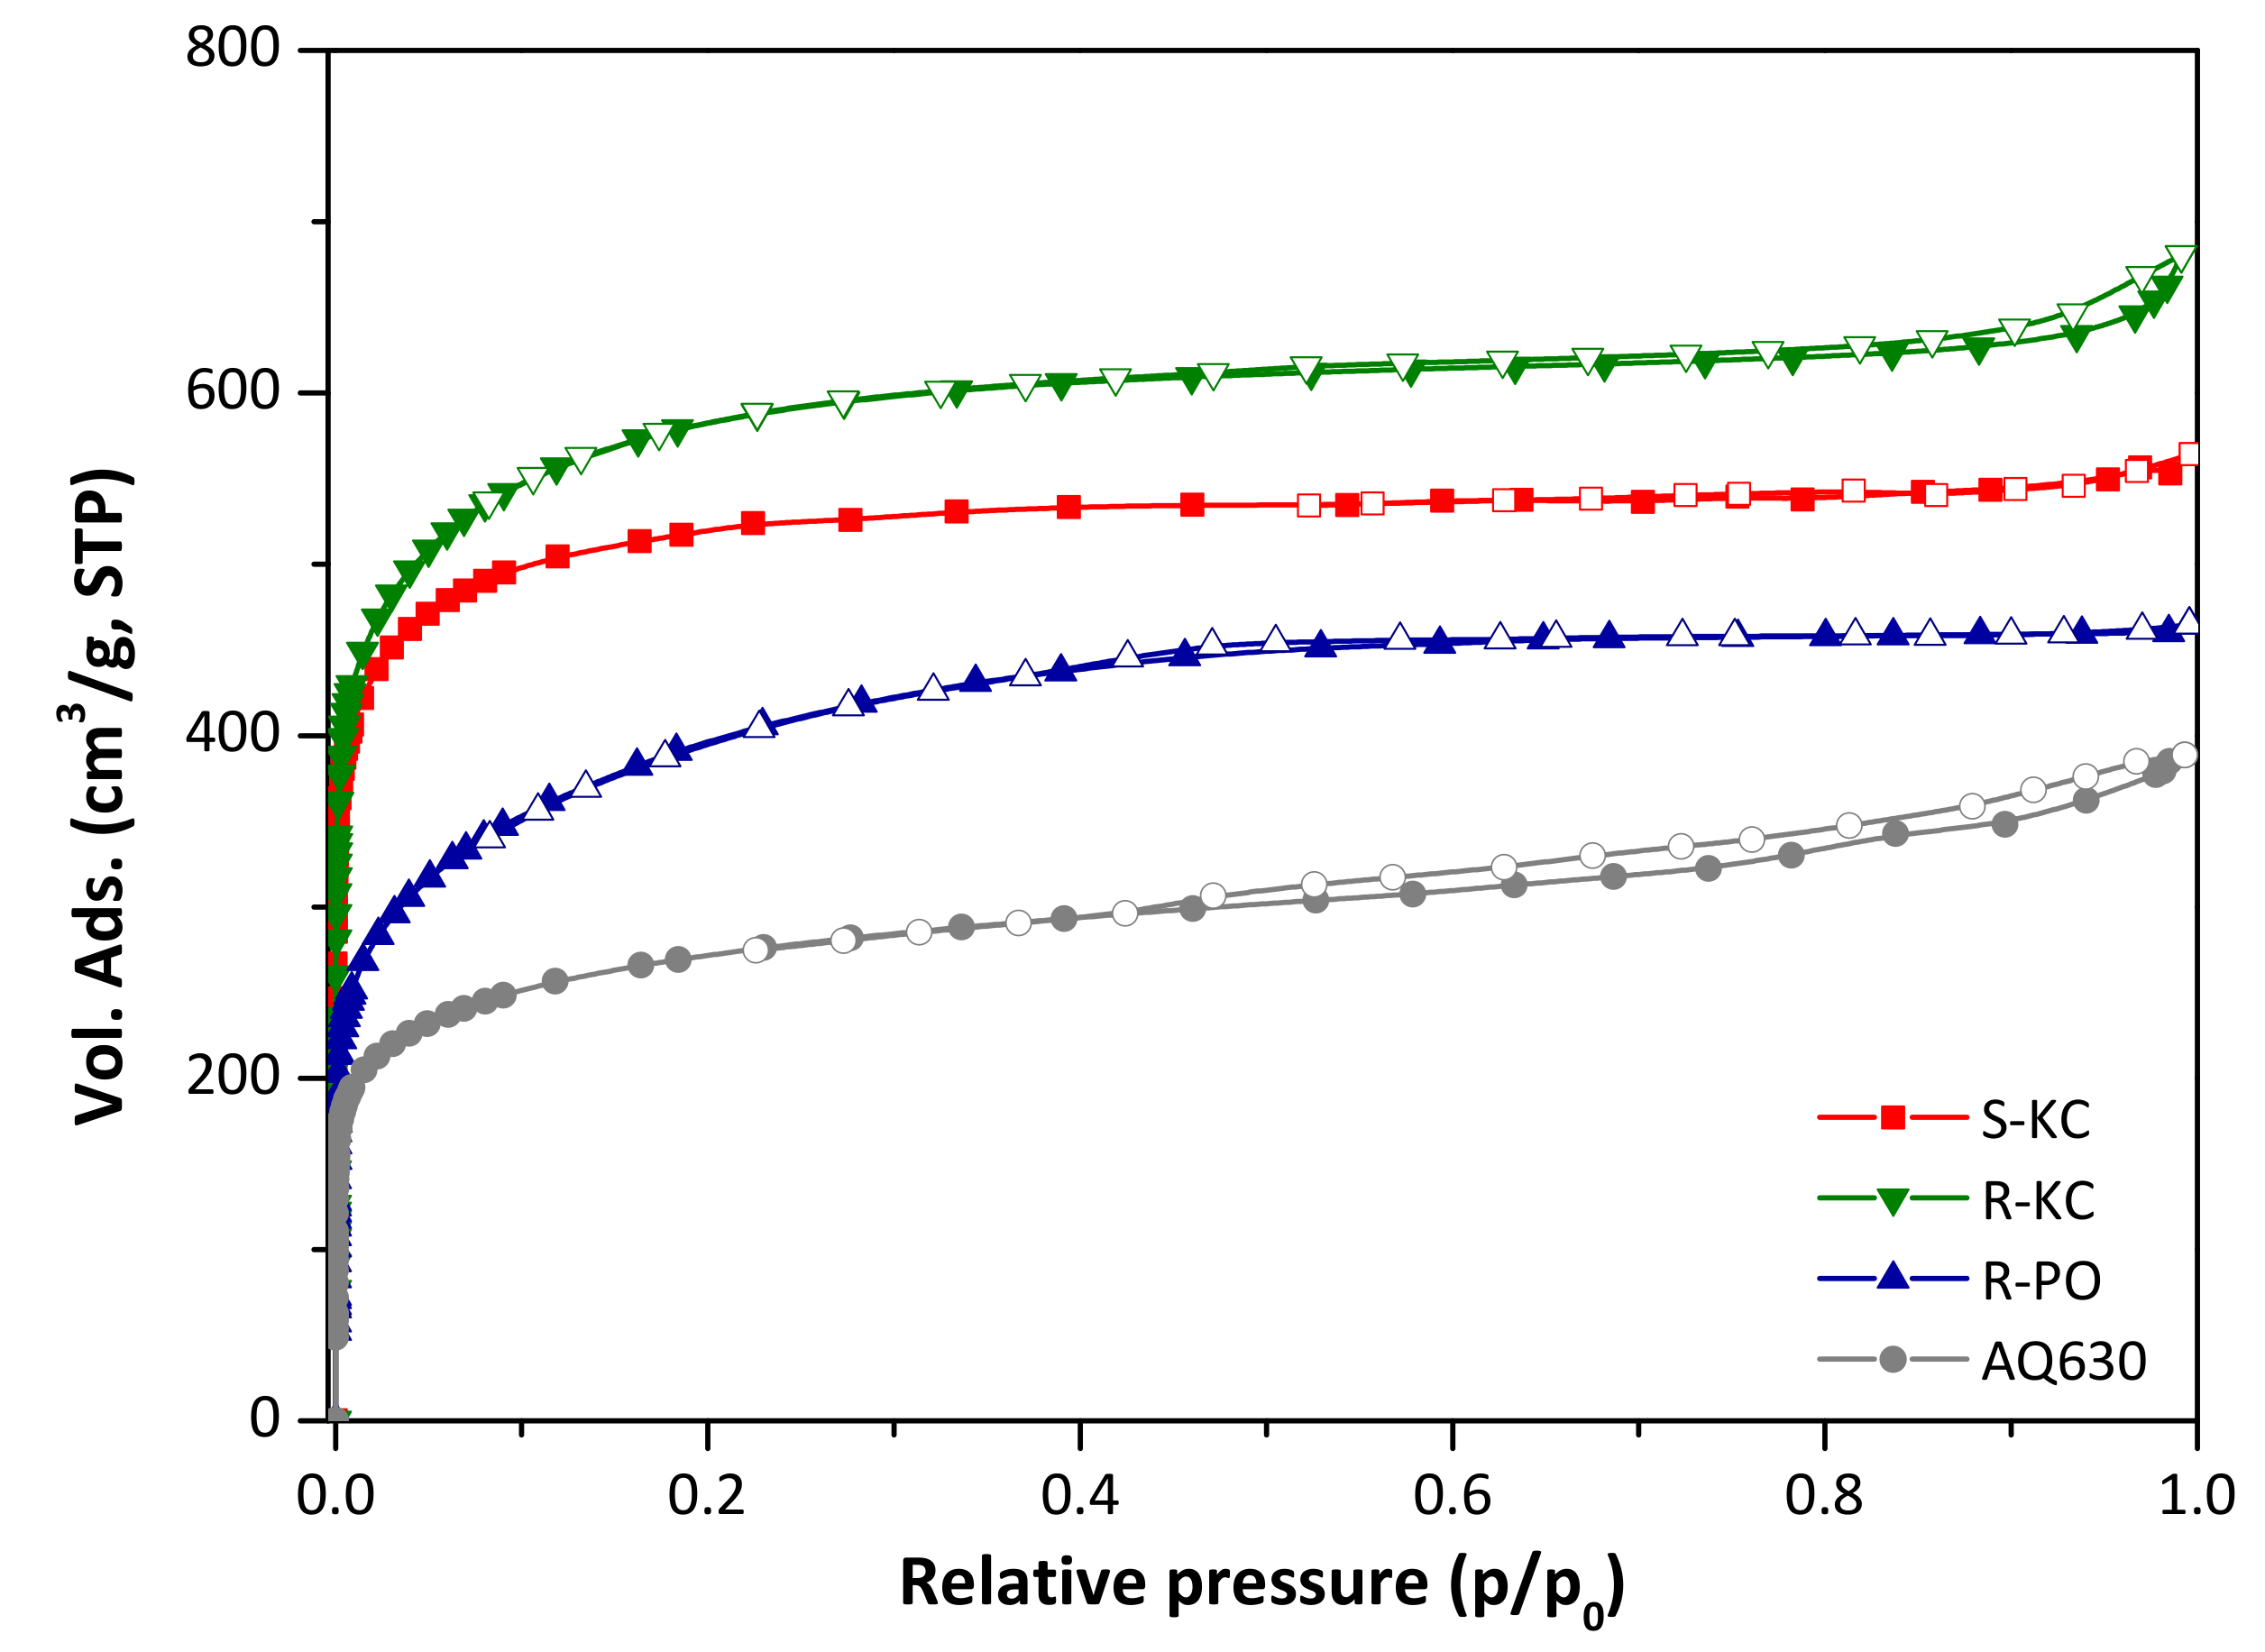
The activation protocols applied for both lignocellulosic materials yielded highly porous activated carbons with specific surface areas ranging between 1500 and 2200 m2/g (Table 2, [19]). The N2 adsorption/desorption isotherms at −196 °C of the four activated carbons are presented in Figure 1. All of them correspond to a Type I isotherm according to the IUPAC classification [27], which is characteristic of mainly microporous materials.
Table 2.
Textural parameters obtained from the N2 adsorption/desorption isotherms at −196 °C, synthesis yield and chemical composition of studied activated carbons.
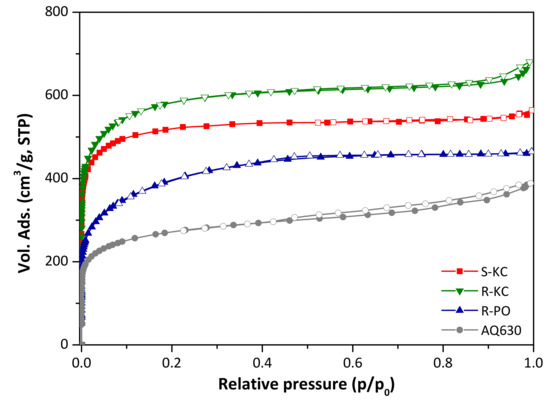
Figure 1.
Nitrogen adsorption/desorption isotherms at −196 °C of the four activated carbons (close symbols represent adsorption and empty symbols represent desorption branch).
Comparing the materials as a function of used precursor (R-KC and S-KC samples obtained from rape and sunflower, respectively), higher activation yield was obtained for the S-KC material (Table 2); this fact is linked with the higher lignin content on the sunflower residues (Table 1) [28]. With respect to the porosity, similar isotherm shape was obtained for both materials, with a steep knee at low relative pressures and a flat plateau at the higher range; however, the sample prepared from rape residue revealed the presence of a smooth hysteresis loop expanded from 0.8 to 1 of p/p0. Although similar surface areas were obtained for both materials, the rape residue allowed the preparation of activated carbon with higher total pore volume and greater development of mesoporosity (Table 2), probably associated with the higher presence of inorganic species, such as potassium and calcium (Table 1), which can act as intrinsic activating agents during the thermal process.
It is important to note that due to the different nature of both precursors (powder and flakes for rape and sunflower, respectively), the K2CO3/raw residue impregnation was physical (for rape) and wet (for sunflower) to facilitate the operation. The sample R-KC was activated following both impregnation processes rendering similar porous features (Figure S1 and Table S2, ESI), assuring that the experimental impregnation protocol did not affect the final porosity of the activated materials.
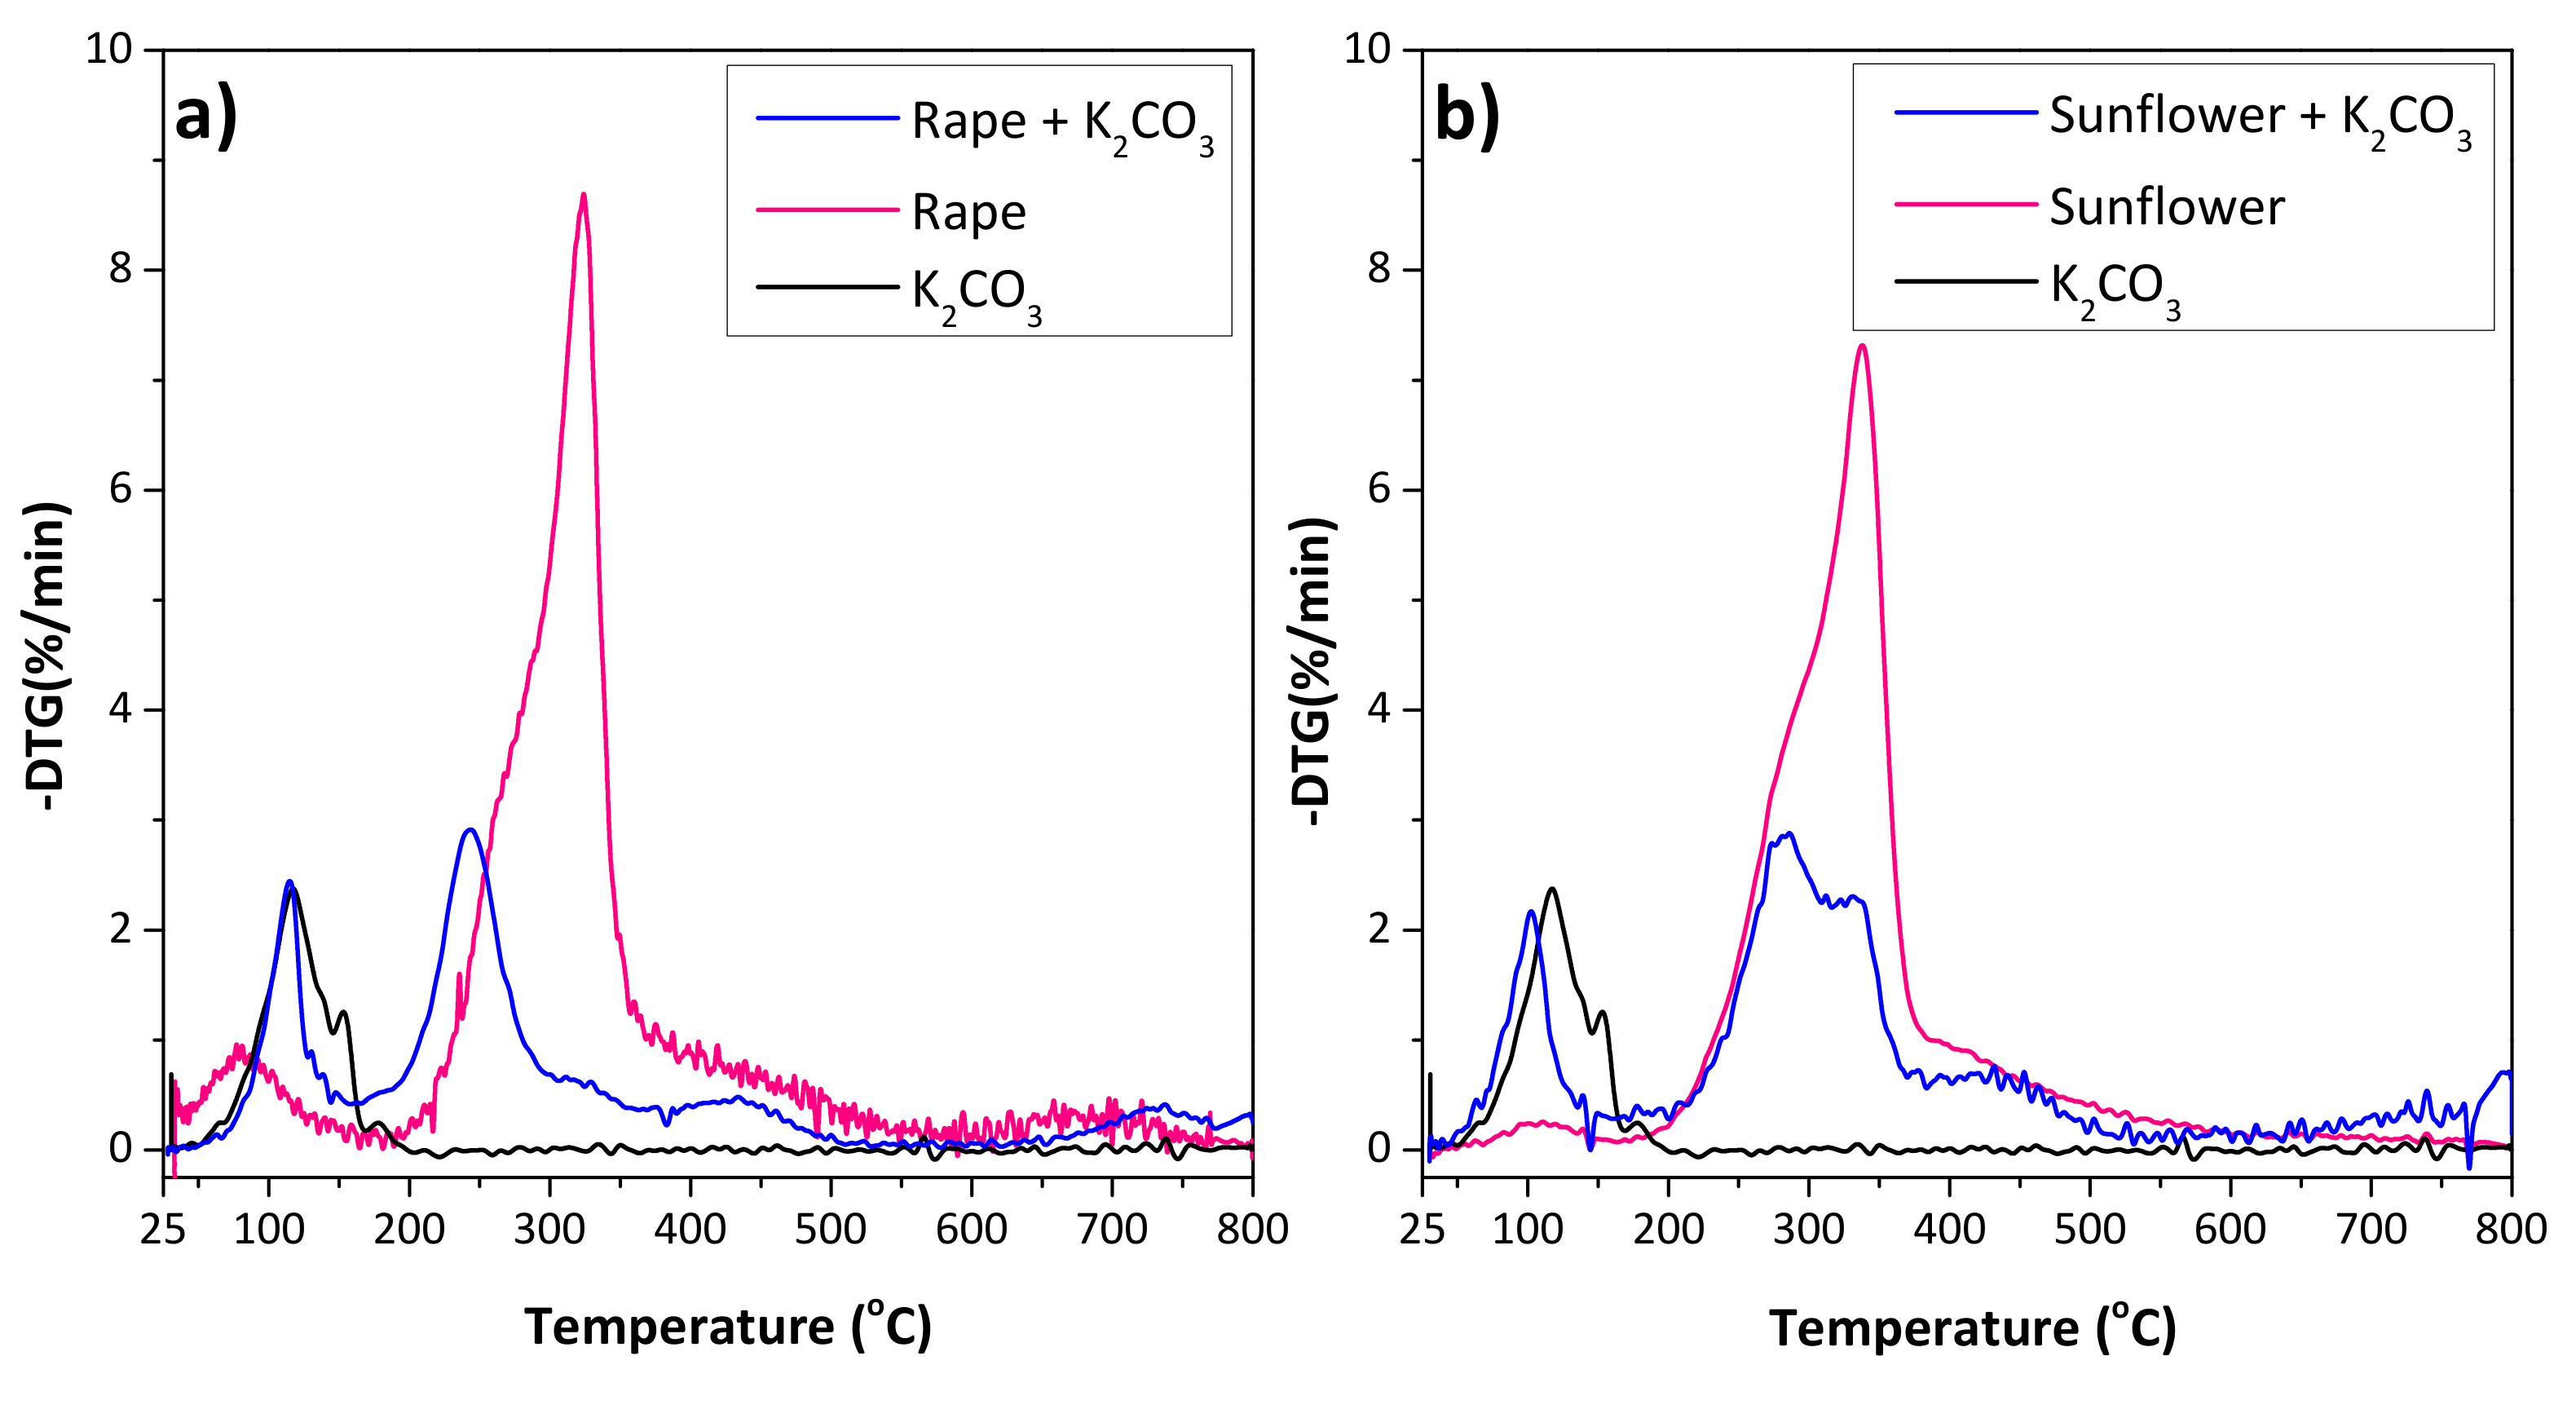
The activation process with K2CO3 as the activating agent was studied by thermogravimetry. Figure 2 shows the comparison of the DTG profiles of the raw materials and impregnated samples with K2CO3, where the profile of the K2CO3 powder is also included for comparison. The first mass loss for both precursors was observed below 150 °C, associated with the desorption of the moisture, hydrocarbons and the residual volatile matter. The degradation of the lignocellulosic materials was observed between 200 and 400 °C, and a small shoulder followed by a main peak were observed for both residues. The shoulders at 280 and 290 °C for rape and sunflower, respectively, correspond to the hemicellulose degradation, while the main peak is associated with the cellulose decomposition at 320 and 340 °C, respectively. The lignin degradation peak (expected at ca. 375 °C) is probably masked by the other peaks [29,30,31,32]. Similar total mass loss was observed for both precursors (67% for rape and 64% for sunflower). However, the thermal decomposition of the raw material impregnated with the activating agent revealed a shift in the mass loss to lower temperatures, being more remarkable for rape residue. This behavior was reported for other lignocelullosic materials [33,34], suggesting that the presence of K2CO3 modifies the carbonization process of the precursor. Additionally, in the case of sunflower, the mean peak was followed by a shoulder, indicating that the degradation is splitting.
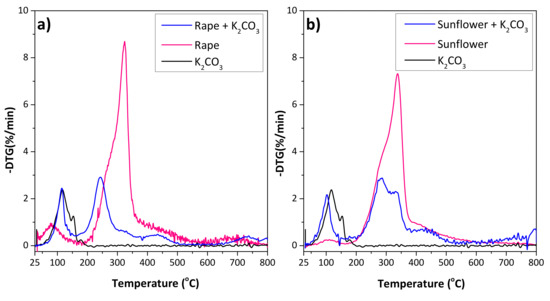
Figure 2.
DTG curves obtained from 25 to 800 °C (10 °C/min) under Ar atmosphere of (a) raw rape and rape impregnated with K2CO3, and (b) raw sunflower and sunflower impregnated with K2CO3. The profile of K2CO3 is included for comparison.
The material activated with phosphoric acid rendered a less porous material (R-PO) compared with those activated with K2CO3, despite of the H3PO4 is considered as strongest activating agent [35]. One of the reasons for this is that this activation process was carried out at a lower activation temperature (500 °C); additionally, the phosphoric acid could alter the structure of the lignocellulosic material, forming larger structural units, resulting in a rigid crosslinked solid affecting the final porous structure of the obtained material [36]. With respect to the activation yield, this material showed the highest value—almost three times that of R-KC’s yield (Table 2)—due to the above-described crosslinking and the ability of the acid to lead the hydrolysis of hemicellulose and cellulose, leaving a high amount of carbon coming from lignin [32].
According to the superficial pH values (Table 2), sample R-PO shows a hydrophilic character, as expected considering the synthetic route. However, the samples obtained by activation with K2CO3 presented a neutral-basic character.
3.2. Adsorption
3.2.1. Metolachlor Adsorption
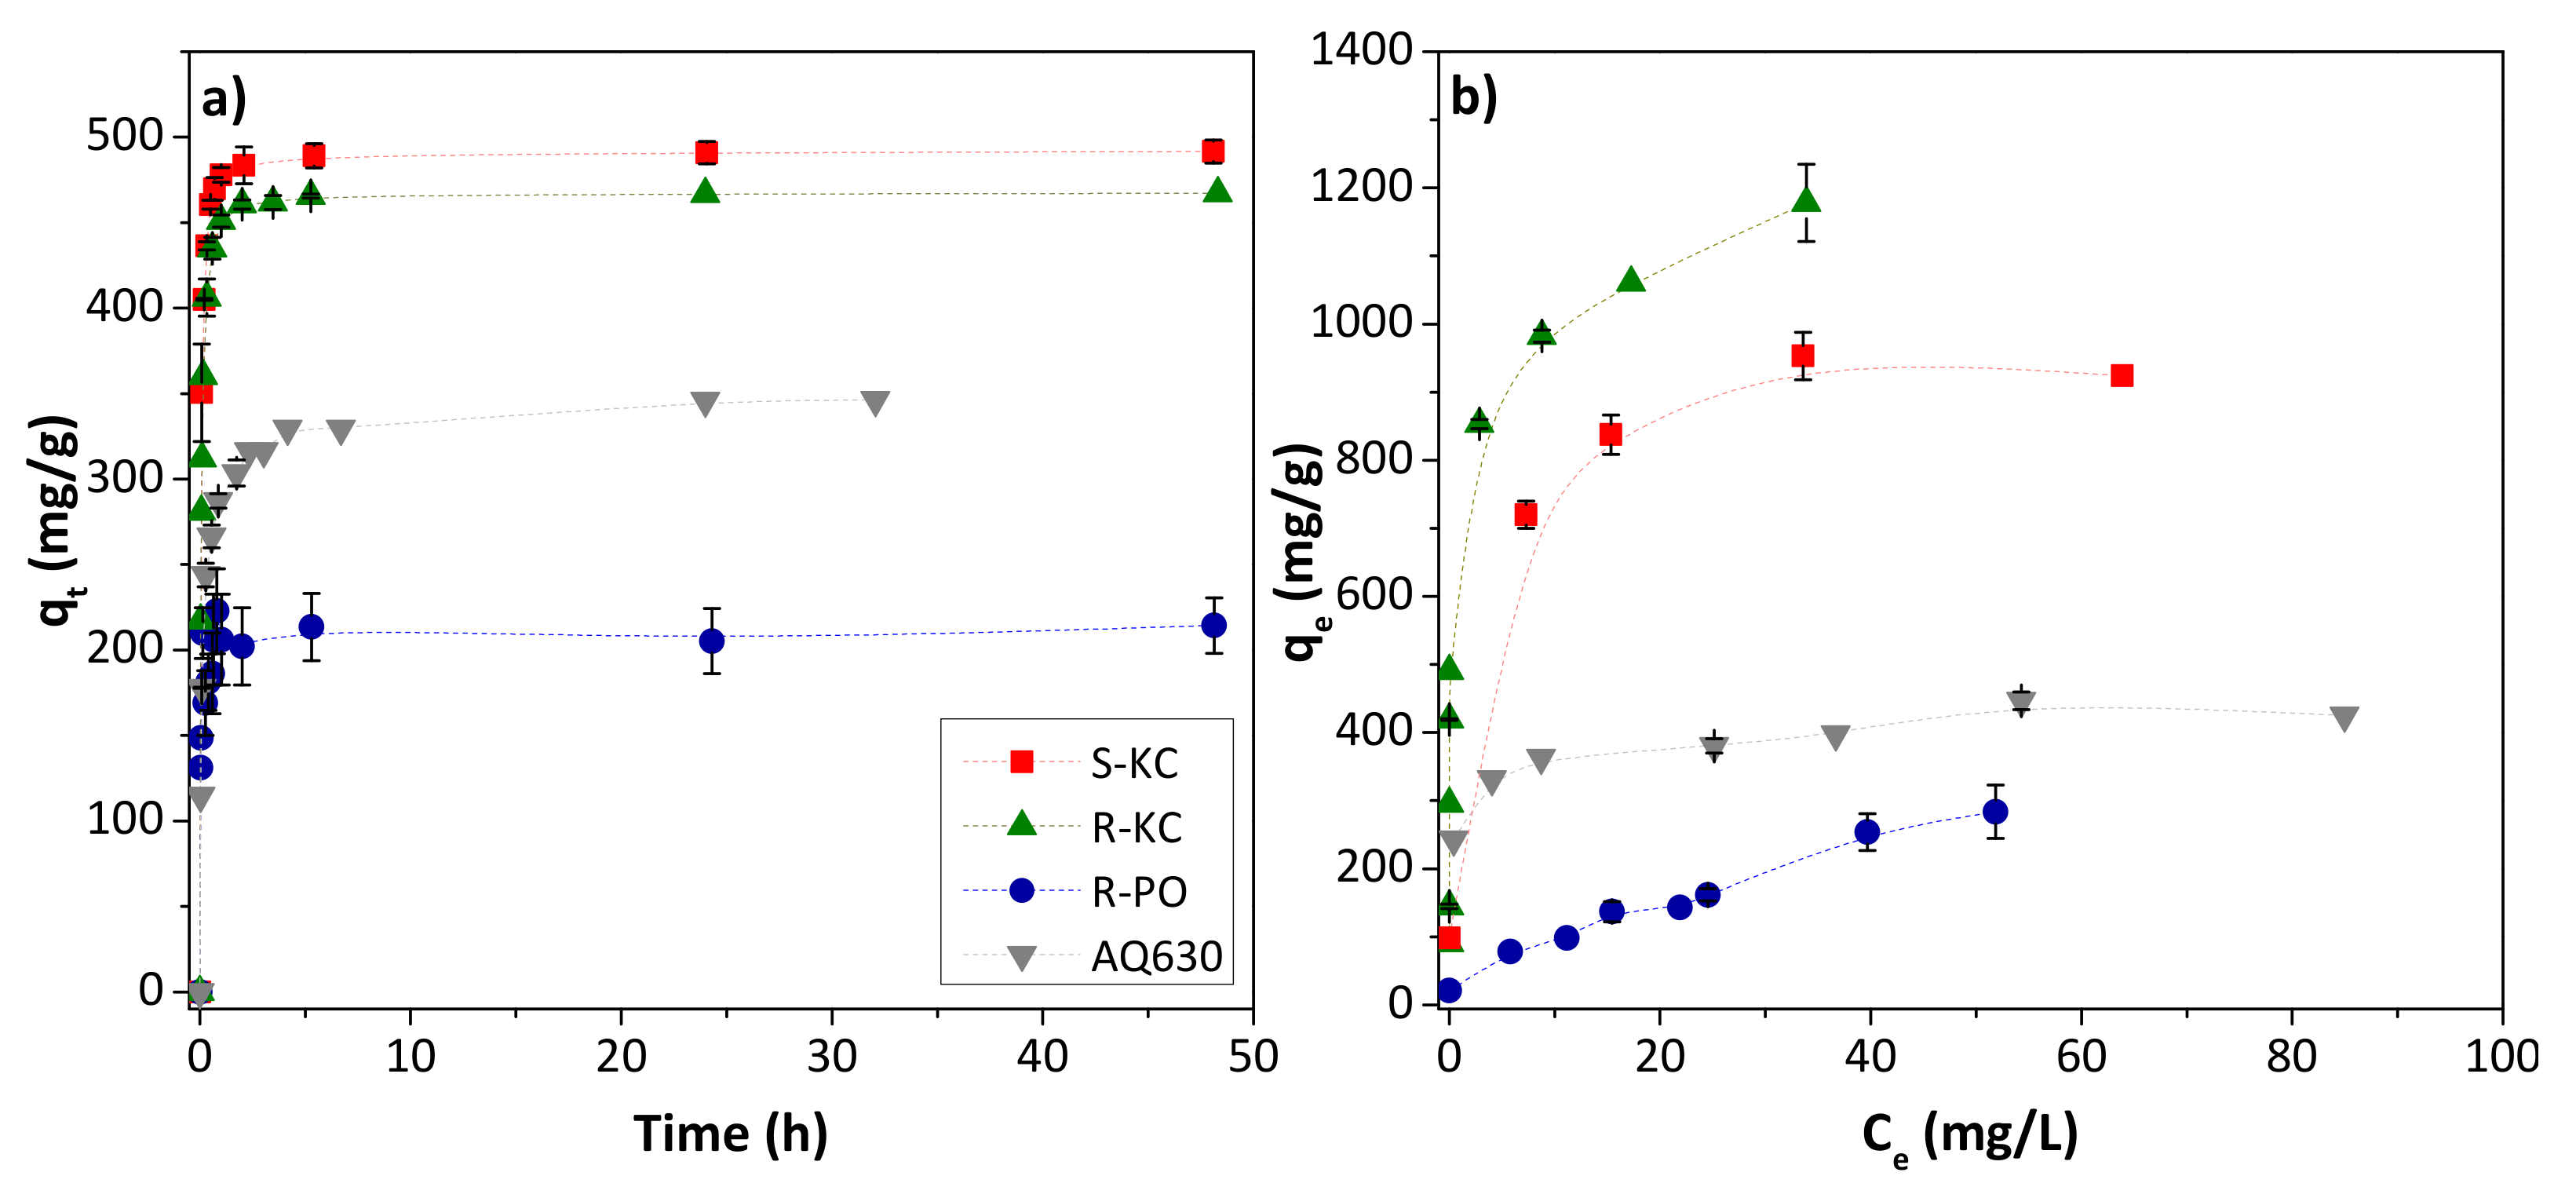
Figure 3a shows the adsorption kinetics of MET for the four adsorbents. As we observed in our previous studies [19], in all cases, an increase in the adsorption time implies a fast increase in the removal of MET before equilibrium was reached (ca. 3–4 h). However, the amount adsorbed in equilibrium conditions was very different for each adsorbent, with the highest adsorption for the S-KC material, followed by R-KC, AQ630 (the commercial activated carbon) and R-PO. The greater adsorption of carbonate activated carbons, R-KC and S-KC, (as it was already reported [19]) is mainly associated with their larger surface area, higher than 2000 m2/g (Table 2). The experimental data were well-fitted to the pseudo-second order model (correlation coefficients between 0.979–0.999) showing a calculated qe values closed to those experimentally obtained (Table 3). The highest value of the rate constant, k2, was obtained for the adsorption on R-PO, while AQ630 showed the slowest adsorption.
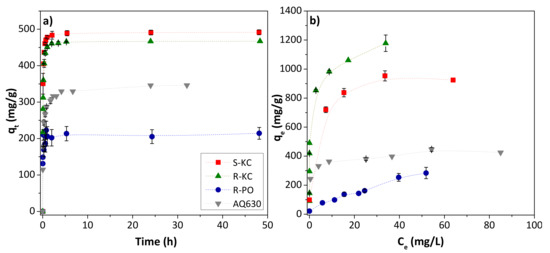
Figure 3.
Evolution of MET adsorption as a function of contact time employing 0.5 g MET/g adsorbent (a), and MET isotherms, 0.05–1.5 g MET/g adsorbent (b), obtained at 25 °C for the four studied adsorbents. The error bars represent the standard deviation.
Table 3.
Experimental adsorption capacity, pseudo-second order kinetics parameters, and isotherms non-linear fitting to the Langmuir and Freundlich models parameters, obtained by a non-linear fitting of MET adsorption. The coefficients of determination (R2) are also included.
The MET adsorption isotherms were realized for a contact duration of 3 h. Figure 3b reveals the following trend of adsorption capacity values: R-KC > S-KC > AQ630 > R-PO. The experimental isotherms were fitted to the Langmuir and Freundlich models (Table 3), showing the best adequateness to the Freundlich equation. Despite the different chemical composition of the adsorbents (Table 2), the variation of the adsorption capacity is mainly associated with the textural parameters, since the electrostatic interactions are discarded due to the non-polar character of MET [17,19]. Accordingly, the highest value (above 1000 mg/g) was observed for the material with the greater SBET and higher mesoporous development (R-KC); in contrast, the lowest adsorption capacities (ca. 280 and 435 mg/g for R-PO and AQ630, respectively) were obtained for the samples with lower surface area. The acidic character of the R-PO sample also showed an important effect, it being the adsorbent with the lowest adsorption capacity, probably associated with the adsorption competition with water molecules.
Additionally, after the adsorption of MET on R-KC and S-KC, the samples were tested using thermogravimetry (Figure S2a,b), revealing a total mass loss of 27% and 26% for R-KC and S-KC, respectively, from ca. 230 °C (while the pristine samples presented 8 and 13%). This increase in the mass loss is associated with the thermal decomposition of MET adsorbed on the porosity of the material.
3.2.2. Transformation Products ESA and OXA Adsorption
The kinetic study was performed on ESA and OXA compounds separately for the four activated carbons. A fast and high adsorption was observed for both TPs on R-KC, S-KC and AQ630 in short timeframes, reaching a plateau at ca. 3 h (Figure S3). Table 4 shows the results of the adsorption capacity at equilibrium time for both compounds. A similar trend was observed for both metabolites, and the highest removal efficiency was obtained for the carbons activated with potassium carbonate (samples R-KC and S-KC). This fact was more remarkable in the case of OXA, for which the adsorption was found to higher than 80% on the S-KC and R-KC samples at equilibrium time. For both OXA and ESA, adsorption efficiencies were less or equal to 5% on R-PO and between 32% and 38% for the commercial activated carbon, AQ630. These differences could be associated with the microporous development of the adsorbent, pointing out a higher adsorption of the metabolites on those materials which present greater microporous volume (Table 2).
Table 4.
Experimental adsorption parameters obtained by the kinetics of ESA and OXA adsorption for the studied adsorbents.
The S-KC and R-KC samples with adsorbed OXA were thermally decomposed under inert atmosphere. The materials displayed a mass loss of 4.4 and 2.8%, respectively, above ca. 100 °C (Figure S2b,c), confirming the metabolite confinement on the adsorption sites of the materials.
Comparing the adsorption of both TPs on the same adsorbents and in identical adsorption conditions, only the intrinsic properties of the molecules should be evaluated to explain the differences in the adsorption capacities. In this sense, since the water solubility is quite similar for OXA and ESA (Table S1), both compounds differ in molecular weight and the nature of the substituent groups influencing their adsorptivity. The greater adsorption of OXA compared to ESA on the adsorbents S-KC and R-KC could be explained by its lower molecular weight (279.33 vs. 329.70 g/mol, respectively, Table S1). Additionally, it seems that the shape of OXA fits better in the pores of those adsorbents. As a consequence, a largest part of microporosity could be accessible to OXA than to ESA for sorption sites.
Regarding the activated carbon R-PO, the adsorption of ESA and OXA was found to be very low, revealing values of metabolite adsorbed of below 5%; this fact could be associated with several factors: (i) the lower porous development compared to the other adsorbents (Table 2), as was previously assessed to the low adsorption of MET; (ii) the competitive adsorption of water molecules could have occurred due to the hydrophilic character of this adsorbent (Table 2), with the oxygen groups being favorable for the creation of water clusters, hindering the accessibility of the metabolite to the inner porous structure [37], and (iii) the oxidized groups located on the structure of the carbon material can cause a withdrawing effect of the electrons, reducing the π-electron density on the aromatic rings and decreasing the dispersive interaction between the metabolite and carbon material [37]. Similar effects have been previously reported for the adsorption of other aromatic herbicides [38,39,40].
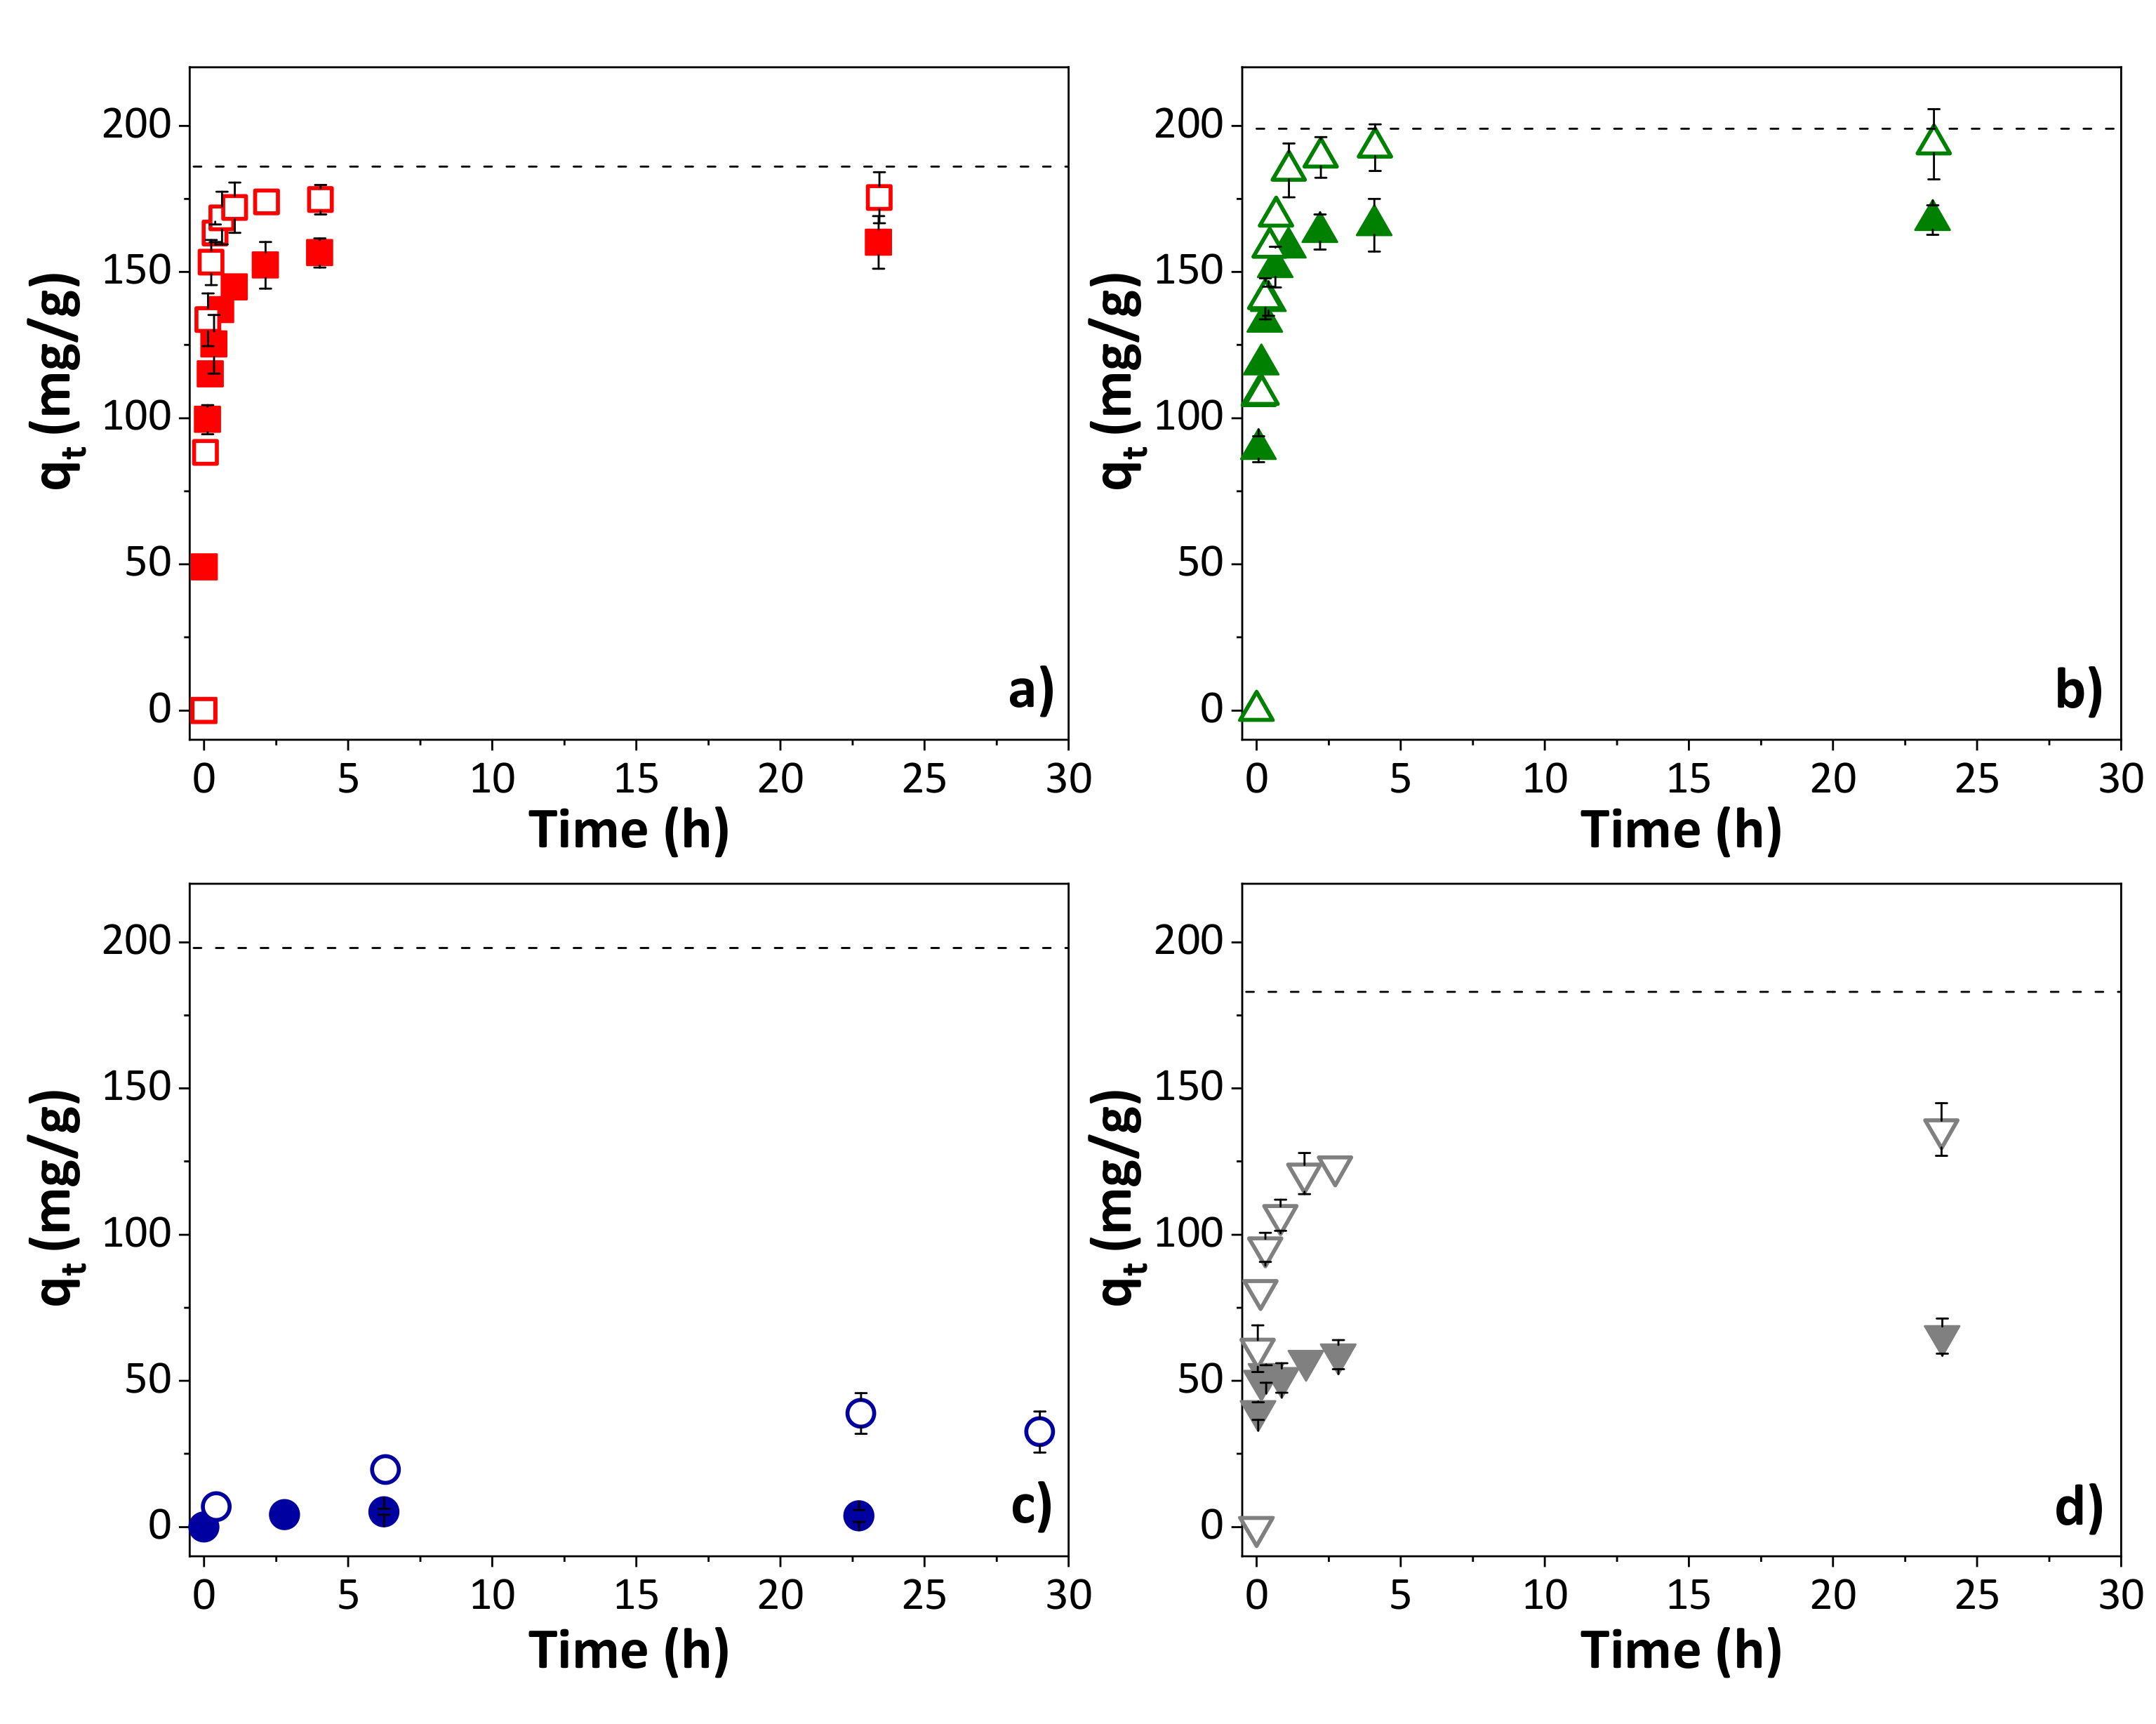
The influence of solution pH on the adsorption capacity was analyzed for the adsorption of OXA on the four adsorbents. Figure 4 shows the comparison of the adsorption evolution for a solution of the compound at natural pH (4.7–5.2, being the pH measured for OXA solution) and at pH 2 (adjusted with some drops of HCl). In all cases, independently of the nature of the adsorbent, the adsorption is increased for lower pH, reaching a removal efficiency of close to 100% for the S-KC and R-KC materials at equilibrium time. In aqueous solutions, the surface of the adsorbent and the molecules coexist in a complex system with different superficial charges than can generate repulsive or attractive electrostatic interactions. In the case of the OXA metabolite, the anionic form is predominant in a solution at pH above its pKa of 4.8 (Table S1). In a solution at pH 2, OXA’s anionic form becomes minor in the solution but is still present. All of the employed adsorbents are positively charged at pH 2 (solution pH < superficial pH); therefore, the adsorption capacity is increased due to the decrease in repulsive force between the OXA and the surface charges along the graphitic layers of the adsorbents. This effect is more remarkable in the case of AQ630 (adsorption at pH 2 increases to two times the adsorption at natural pH), as a consequence of its higher negatively charged character at pH 2 (adsorbent with the higher superficial pH, Table 2).
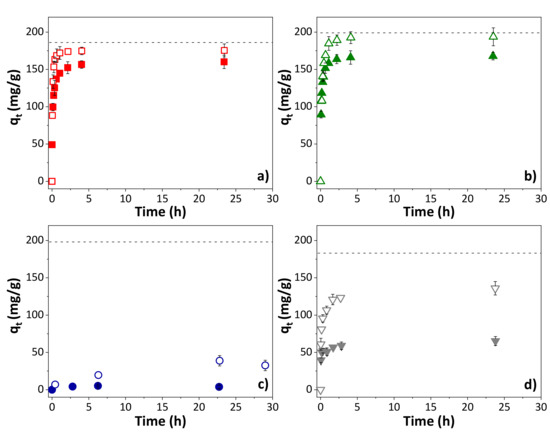
Figure 4.
Influence of the solution pH (closed symbols for natural pH and opened symbols for pH 2) on the adsorption of OXA on (a) S-KC, (b) R-KC, (c) R-PO and (d) AQ630 (0.2 g OXA/g adsorbent). The dashed line corresponds to the saturation. The error bars represent the standard deviation.
Figure 5 shows the adsorption isotherms obtained for ESA and OXA on S-KC, R-KC and AQ630 (the adsorbent R-PO was excluded due to its low adsorption observed above). The higher adsorption of both TPs was obtained for S-KC and R-KC with an experimental adsorption capacity, qmax, exp, of 218 and 273 mg/g for ESA and 439 and 554 mg/g for OXA, respectively (Table 5). As already observed in the kinetic study, adsorption is greater for OXA in all studied adsorbents.
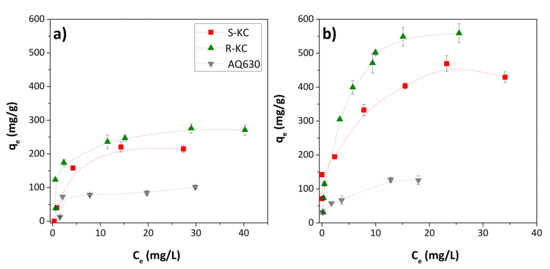
Figure 5.
Adsorption isotherms on the S-KC, R-KC and AQ630 adsorbents of (a) ESA and (b) OXA in the range of 0.05–1.5 g compound/g adsorbent. The error bars represent the standard deviation.
Table 5.
Fitting parameters of the equilibrium adsorption isotherms to the Langmuir and Freundlich models.
The ESA and OXA isotherms were fitted to the classical Langmuir and Freundlich theoretical models, being better fitted for the Langmuir model for all adsorbents (with higher R2 values), which indicates this model’s adequateness to evaluate the adsorption capacity. The maximum adsorption calculated by Langmuir’s model, qmax—which corresponds to the coverage of the monolayer [25]—suggests that the adsorption mainly occurs in a molecular monolayer, in agreement with the shape of the experimental isotherms (Figure 5). The value obtained for the Langmuir adsorption constant, b, was higher for the carbon material R-KC, for both metabolites, indicating greater adsorption energy for this material, which is in accordance with their upper adsorption capacity. This fact is probably associated with the higher presence of mesopores—compared with S-KC material (0.13 vs. 0.04 cm3/g, respectively) (Table 2)—which provide transport pores to reach sorption sites located in the micropores. Despite the higher mesoporous development of AQ630 compared to R-KC (0.20 vs. 0.13 cm3/g, respectively), the ESA and OXA adsorption is lower in AQ630 because of its minor microporosity (more than two times lower than in R-KC).
According to the literature, the ESA and OXA metabolites are commonly quantified at concentrations between 0.0001 and 0.005 mg/L in groundwater, depending on the sample collection area [11,12,13,14,15]. The adsorption of ESA and OXA was studied employing low concentrations, close to those quantified in groundwater (0.001 and 0.01 mg/L), since the initial concentration may impact the value of adsorption coefficients. At equilibrium, the adsorption of ESA and OXA on the adsorbent R-KC followed the same trend, showing a decrease in the adsorption capacity, qe, when the initial concentration went from 8 to 0.01 mg/L, whereas no remarkable effect was observed when the concentration decreased from 0.01 to 0.001 mg/L (Table 6). On the contrary, for commercial activated carbon, AQ630, no significant changes in the adsorption were noticed when the initial concentration was reduced, indicating that the adsorption process on this material is not influenced by the initial concentration.
Table 6.
Experimental adsorption capacities obtained for different initial concentration of ESA and OXA solutions for the R-KC and AQ630.
The observed decrease in the R-KC at lower initial concentration could be mainly associated with the smaller concentration gradient between the amount adsorbed inside the micropores (already adsorbed) and the molecules remaining in the solution, making the driving force to overcome the mass transfer resistance between the aqueous and the solid phase weaker; however, further investigation of this phenomenon should be performed. Nevertheless, the removal of the metabolites from water remains quite efficient for both studied adsorbents, being close to 50% for R-KC activated carbon. These results demonstrate the ability of the synthesized porous material to be employed for environmental remediation, it being able to adsorb in its pores both metolachlor metabolites, even when the amount of them is low.
4. Conclusions
Four activated carbons have been tested for the adsorption of metolachlor and its metabolites OXA and ESA, one commercially available and three synthesized from lignocellulosic residues. The synthesis of these three adsorbents was carried out by chemical activation employing K2CO3 and H3PO4 as activating agents, revealing an important effect on its adsorption capacities as a function of the activation process as well as the starting material nature. The samples activated with potassium carbonate (R-KC and S-KC) demonstrated the higher adsorption capacities for the metolachlor and its metabolites ESA and OXA, this being the first time that an efficiency higher than 80% was reported for these compounds. As a general trend, higher adsorption was observed for the activated carbons with greater porous development. Microporosity seems to be the main factor governing the adsorption capacity containing reactive sorption sites and the presence of mesopores facilitates the transport of the adsorbates to reach the microporosity. Additionally, the surface chemistry resulted in an important factor to consider for the TPs adsorption favoring the electrostatic interactions between the carbon surface and these anionic molecules. OXA was easily adsorbed compared to ESA, on samples R-KC and S-KC, due to its lowest molecular weight, fitting better in the pores of these two adsorbents. Finally, the study of the initial concentration revealed a lower adsorption capacity for both metabolites on R-KC sample when the concentration employed is close to that found in groundwater, this being an important factor to be considered.
Supplementary Materials
The following are available online at www.mdpi.com/article/10.3390/app11167342/s1, Table S1: Physicochemical properties of MET, ESA and OXA, Figure S1: Nitrogen adsorption/desorption isotherms at −196 °C for R-KC samples obtained by physical and wet impregnation, Table S2: Textural parameters obtained from the N2 adsorption/desorption isotherms at −196 °C for R-KC samples obtained by physical and wet impregnation, Figure S2: Thermogravimetric profiles of R-KC and S-KC with (a,b) MET and (c,d) OXA adsorbed. The pristine materials are included for comparison. Experimental conditions: Ar flow 50 mL/min up to 900 °C (ramp 10 °C/min). Figure S3: Evolution of adsorption as a function of contact time obtained at 25 °C on the four studied adsorbents for a) ESA and b) OXA metabolites (0.2 g compound/g adsorbent). The error bars represent the standard deviation.
Author Contributions
Conceptualization, A.G.-B. and B.C.; methodology, A.G.-B. and B.C.; formal analysis, A.G.-B.; writing—original draft preparation, A.G.-B.; writing—review and editing, A.G.-B., B.C. and P.S.; funding acquisition, B.C. All authors have read and agreed to the published version of the manuscript.
Funding
This work was co-financed by the European Union and the Conseil Regional du Centre-Val de Loire region through the European Regional Development Fund. We gratefully acknowledge the financial support provided by the PIVOTS project and the Conseil Regional du Centre-Val de Loire (ARD 2020 program and CPER 2015–2020), the French Ministry of Higher Education and Research (CPER 2015–2020) and subsidy funds from CNRS and University of Orleans and the Centre Val de Loire Region. This work has been carried out as part of the regional project DEPRICAME.
Conflicts of Interest
The authors declare no conflict of interest.
References
- Steele, G.V.; Johnson, H.M.; Sandstrom, M.W.; Capel, P.D.; Barbash, J.E. Occurrence and fate of pesticides in four contrasting agricultural settings in the United States. J. Environ. Qual. 2008, 37, 1116–1132. [Google Scholar] [CrossRef] [PubMed] [Green Version]
- Silva-Madera, R.J.; Salazar-Flores, J.; Peregrina-Lucano, A.A.; Mendoza-Michel, J.; Ceja-Gálvez, H.R.; Rojas-Bravo, D.; Reyna-Villela, M.Z.; Torres-Sánchez, E.D. Pesticide contamination in drinking and surface water in the Cienega, Jalisco, México. Water Air Soil Pollut. 2021, 232, 43. [Google Scholar] [CrossRef]
- Tisseau, M.A.; Fauchon, N.; Cavard, J.; Vandevelde, T. Pesticide contamination of water resources: A case study—The rives in the Paris region. Water Sci. Technol. 1996, 34, 147–152. [Google Scholar] [CrossRef]
- Sidoli, P.; Devau, P.; Angulo Jaramillo, R.; Baran, N. Reactivity of vadose-zone solids to S-metolachlor and its two main metabolites: Case of a glaciofluvial aquifer. Environ. Sci. Pollut. Res. 2020, 27, 22865–22877. [Google Scholar] [CrossRef] [PubMed]
- Nazir, M.S.; Tahir, Z.; Hassan, S.U.; Ali, Z.; Akhtar, M.N.; Azam, K.; Abdulah, M.A. Remediation of pesticide in water. In Sustainable Agriculture Reviews 47 Pesticide Occcurrence, Analysis and Remediation; Inamuddin, Ahamed, M.I., Lichtfouse, E., Eds.; Springer: Cham, Switzerland, 2021; Volume 47, pp. 271–308. [Google Scholar]
- Varjani, S.; Kumar, G.; Rene, E.R. Developments in biochar application for pesticide remediation: Current knowledge and future research directions. J. Environ. Manag. 2019, 232, 505–513. [Google Scholar] [CrossRef]
- Rodrigo, M.A.; Oturan, N.; Oturan, M.A. Electrochemically assisted remediation of pesticides in soils and water: A review. Chem. Rev. 2014, 114, 8720–8745. [Google Scholar] [CrossRef]
- Gusain, R.; Gupta, K.; Joshi, P.; Khatri, O.P. Adsorptive removal and photocatalytic degradation of organic pollutants using metal oxides and their composites: A comprehensive review. Adv. Colloid Interface Sci. 2019, 272, 102009. [Google Scholar] [CrossRef] [PubMed]
- Lopez, B.; Ollivier, P.; Togola, A.; Baran, N.; Ghestem, J.-P. Screening of French groundwater for regulated and emerging contaminants. Sci. Total Environ. 2015, 518–519, 562–573. [Google Scholar] [CrossRef]
- Loos, R.; Locoro, G.; Comero, S.; Contini, S.; Schwesig, D.; Werres, F.; Balsaa, P.; Gans, O.; Weiss, S.; Blaha, L.; et al. Pan-European survey on the occurrence of selected polar organic persistent pollutants in ground water. Water Res. 2010, 44, 4115–4126. [Google Scholar] [CrossRef] [PubMed]
- Amalric, L.; Baran, N.; Coureau, C.; Maingot, L.; Buron, F.; Routier, S. Analytical developments for 47 pesticides: First identification of neutral chloroacetanilide derivatives in French groundwater. Int. J. Environ. Anal. Chem. 2013, 93, 1660–1675. [Google Scholar] [CrossRef]
- Baran, N.; Gourcy, L. Sorption and mineralization of S-metolachlor and its ionic metabolites in soils and vadose zone solids: Consequences on groundwater quality in an alluvial aquifer (Ain Plain, France). J. Contam. Hydrol. 2013, 154, 20–28. [Google Scholar] [CrossRef]
- Hladik, M.L.; Bouwer, E.J.; Roberts, A.L. Neutral chloroacetamide herbicide degradates and related compounds in Midwestern united states drinking water sources. Sci. Total Environ. 2008, 390, 155–165. [Google Scholar] [CrossRef]
- Zimmerman, L.R. Analysis and detection of the herbicides dimethenamid and flufenacet and their sulfonic and oxanilic acid degradates in natural water. J. Agric. Food Chem. 2002, 50, 1045–1052. [Google Scholar] [CrossRef] [PubMed]
- Farlin, J.; Gallé, T.; Bayerle, M.; Pittois, D.; Köppchen, S.; Krause, M.; Hofmann, D. Breakthrough dynamics of s-metolachlor metabolites in drinking water wells: Transport pathways and time to trend reversal. J. Contam. Hydrol. 2018, 213, 62–72. [Google Scholar] [CrossRef]
- European Commission (EC). Council Directive 98/83/EC of 3 November 1998 on the quality of water intended for human consumption. Off. J. Eur. Comm. 1998, 330, 32–54. [Google Scholar]
- Otero, R.; Esquivel, D.; Ulibarri, M.A.; Romero Salguero, F.J.; Van Der Voort, P.; Fernández, J.M. Mesoporous phenolic resin and mesoporous carbon for the removal of S-metolachlor and bentazon herbicides. Chem. Eng. J. 2014, 251, 92–101. [Google Scholar] [CrossRef]
- Etcheverry, M.; Cappa, V.; Trelles, J.; Zanini, G. Montmorillonite-alginate beds: Natural mineral and biopolymers based sorbent of paraquat herbicides. J. Environ. Chem. Eng. 2017, 5, 5868–5875. [Google Scholar] [CrossRef]
- Gomis-Berenguer, A.; Laidin, I.; Renoncial, S.; Cagnon, B. Study of enantioselective metolachlor adsorption by activated carbons. RSC Adv. 2020, 10, 40321–40328. [Google Scholar] [CrossRef]
- Liu, L.; Dai, Y. Strong adsorption of metolachlor by biochar prepared from walnut shells in water. Environ. Sci. Pollut. Res. 2021. [Google Scholar] [CrossRef]
- Carrier, M.; Loppinet-Serani, A.; Denux, D.; Lasnier, J.-M.; Ham-Pichavant, F.; Cansell, F.; Aymonier, C. Thermogravimetric analysis as a new method to determine the lignocellulosic composition of biomass. Biomass Bioenergy 2011, 35, 298–307. [Google Scholar] [CrossRef]
- Bandosz, T.J.; Jagiello, J.; Contescu, C. Characterization of the surfaces of activated carbons in terms of their acidity constant distributions. Carbon 1993, 31, 1193–1202. [Google Scholar] [CrossRef]
- Ho, Y.S.J. Review of second-order models for adsorption systems. J. Hazard. Mater. 2006, 136, 681–689. [Google Scholar] [CrossRef] [Green Version]
- Ho, Y.S.; McKay, G. The kinetics of sorption of divalent metal ions onto sphagnum moss peat. Water Res. 2000, 34, 735–742. [Google Scholar] [CrossRef]
- Langmuir, I. The adsorption of gases on plane surfaces of glass, mica and platinum. J. Am. Chem. Soc. 1918, 40, 1361–1403. [Google Scholar] [CrossRef] [Green Version]
- Freundlich, H.M.F. Over the adsorption in solution. Phys. Chem. 1906, 57, 385–471. [Google Scholar]
- Thommes, M.; Kaneko, K.; Neimark, A.V.; Olivier, J.P.; Rodriguez-Reinoso, F.; Rouquerol, J.; Sing, K.S.W. Physisorption of gases, with special reference to the evaluation of surface area and pore size distribution (IUPAC technical report). Pure Appl. Chem. 2015, 87, 1051–1069. [Google Scholar] [CrossRef] [Green Version]
- Puziy, A.M.; Poddubnaya, O.I.; Sevastyanova, O. Carbon materials from technical lignins: Recent advances. Top. Curr. Chem. 2018, 376, 33. [Google Scholar] [CrossRef] [PubMed]
- Font, R.; Marcilla, A.; Verdu, E.; Devesa, J. Thermogravimetric kinetic study of the pyrolysis of almond shells and almond shells impregnated with CoCl2. J. Anal. Appl. Pyrolysis 1991, 21, 249–264. [Google Scholar] [CrossRef]
- Orfao, J.J.M.; Antunes, F.J.A.; Figueiredo, J.L. Pyrolysis kinetics of lignocellulosics materials-three independent reactions model. Fuel 1999, 78, 349–358. [Google Scholar] [CrossRef]
- Cagnon, B.; Py, X.; Guillot, A.; Stoeckli, F.; Chambat, G. Contributions of hemicellulose, cellulose and lignin to the mass and the porous properties of chars and steam activated carbons from various lignocellulosic precursors. Bioresour. Technol. 2009, 100, 292–298. [Google Scholar] [CrossRef] [PubMed] [Green Version]
- Boundzanga, H.M.; Cagnon, B.; Roulet, M.; De Persis, S.; Vautin-Ul, C.; Bonnamy, S. Contributions of hemicellulose, cellulose, and lignin to the mass and porous characteristics of activated carbons produced from biomass residues by phosphoric acid activation. Biomass Convers. Biorefin. 2020. [Google Scholar] [CrossRef]
- Hayashi, J.; Kazehaya, A.; Muroyama, K.; Watkinson, A.P. Preparation of activated carbon from lignin by chemical activation. Carbon 2000, 38, 1873–1878. [Google Scholar] [CrossRef]
- Zhang, S.; Tao, L.; Zhang, Y.; Wang, Z.; Gou, G.; Jiang, M.; Huang, C.; Zhou, Z. The role and mechanism of K2CO3 and Fe3O4 in the preparation of mangnetic peanut shell based activated carbon. Powder Technol. 2016, 295, 152–160. [Google Scholar] [CrossRef]
- Marsh, H.; Rodríguez-Reinoso, F. Activated Carbon; Elsevier: Amsterdam, The Netherlands, 2006. [Google Scholar]
- Molina-Sabio, M.; Rodríguez-Reinoso, F.; Caturla, F.; Sellés, M.J. Porosity in granular carbons activated with phosphoric acid. Carbon 1995, 33, 1105–1113. [Google Scholar] [CrossRef]
- Moreno-Castilla, C. Adsorption of organic molecules from aqueous solutions on carbon materials. Carbon 2004, 42, 83–94. [Google Scholar] [CrossRef] [Green Version]
- Ania, C.O.; Béguin, F. Mechanism of adsorption and electrosorption of bentazone on activated carbon cloth in aqueous solution. Water Res. 2007, 41, 3372–3380. [Google Scholar] [CrossRef] [PubMed] [Green Version]
- Lupul, I.; Yperman, J.; Carleer, R.; Gryglewicz, G. Adsorption of antrazine on hemp stem-based activated carbons with different surface chemistry. Adsorption 2015, 21, 489–498. [Google Scholar] [CrossRef] [Green Version]
- Kusmierek, K.; Bialek, A.; Swiatkowski, A. Effect of activated carbon surface chemistry on adsorption of phenoxy carboxylic acid herbicides from aqueous solutions. Desalin. Water Treat. 2020, 186, 450–459. [Google Scholar] [CrossRef]

Publisher’s Note: MDPI stays neutral with regard to jurisdictional claims in published maps and institutional affiliations. |
© 2021 by the authors. Licensee MDPI, Basel, Switzerland. This article is an open access article distributed under the terms and conditions of the Creative Commons Attribution (CC BY) license (https://creativecommons.org/licenses/by/4.0/).