Abstract
The investigation aims at static examination and determination of differences for three age groups: under 13, 13–15 years old and over 15, all practitioners of the martial art karate do. This investigation occured at the level of the main parameters, measured using the FreeMed baropodometric platform and Free Step software by Sensor Medica: plantar surface areas, location of the pressure center (C) inside the support polygon, imbalances noticed at the level of the plantar areas, Pmax value, weight distribution on each foot and at the level of the rearfoot and forefoot areas, misalignments of the pressure centers of each foot, etc. Results: subjects under the age of 13 had the highest number of cases related to the off-centered positioning of the pressure center (C); the groups of those under 13 and over 15 years old located in most cases Pmax at the level of the left retropodal part, and those between 13–15 years old have a location on the dominant leg, at the level of the right retropodal part. The highest numbers of cases of normal bilateral leg are for the group under 13 years, and the other groups have a higher incidence of various plantar imbalances. The analysis of variance (F) identified only two situations in which the independent variable, “age stages,” significantly influences the resulting parameters, at the level of the non-dominant foot: forefoot_left_surface and total_left_surface. The data differences for the right/left pairs within each batch generate insignificant values of |Z| for most cases, with the superiority of the dominant foot parameters for the first two age groups, but in the case of the group over 15 years old, some results are atypical, with higher average values of left/non-dominant foot parameters in the following cases: total_left_Pmax, total_left_Pavg, rearfoot_left_load_percent, rearfoot_left_weight_ratio_percent. The comparison between the data pairs for all three batches (between the forefoot and rearfoot plantar areas) generated significant values of |Z| only for the area of the plantar surfaces. The older the subjects, the more obvious the plantar load on the forefoot area, which is similar to the results of some martial arts studies analyzed here, and is determined by the long use of the non-dominant foot as a support base, during kicks with the dominant one.
1. Introduction
Karate do is a martial art that aims primarily at self-defense. It has an important role in favorably influencing flexibility, strength and aerobic fitness, is accessible to different age groups and is practiced by both sexes. Practitioners assimilate basic techniques and apply them in particular situations, which require concentration and discipline; any part of the body can become a vital weapon [1,2]. In addition to direct physical effects, major influences on character modeling and mental education are reported, through transferable attitudes and daily activities: combativeness, courage, respect for opponents, superior concentration, self-discipline, patience and creativity [3].
The use of baropodometric platforms facilitates the recording of useful parameters in the in-depth scientific study of the biomechanics of different segments and joints, the identification of the distribution of plantar pressure and even the signaling of medical problems at the muscular and osteoarticular level. Modern technologies and advances in the field of electronics allow a faithful analysis of movements in different branches of sport, with applications in various fields: orthopedics, functional rehabilitation, sports training, fitness, physiotherapy, etc. [4,5,6,7].
An improved optical variant for measuring static and dynamic plantar pressure is proposed by [8], with advantages in individual recognition/identification. A mobile application, developed by [9], allows the analysis of plantar pressure, with a role in supporting the process of postoperative rehabilitation at a distance/outside hospitals. Categorical plantar pressure provides relevant data that allow the recognition of ambulatory activity and the identification of pedestrians/pedestrian identification [10].
Hard, intense or overlong training is often the cause of manifestation of various osteoarticular and muscular problems, materialized in acute or chronic pain and the appearance of physical injuries. These diseases are often associated with changes in the position of the center of pressure (often oriented towards the overworked area), problems related to joint stability and maintaining balance. The use of baropodometric platforms would facilitate the early detection of these undesirable situations and the rapid implementation of correction/rehabilitation programs for affected athletes, according to [11]. Plantar fingerprint parameters are viable and important tools for evaluating subjects with normal/neutral and flat/flat foot in a clinical environment, following [12]. Measurement of plantar pressure by podometry facilitates the identification of various disorders and problems in children, and plays a major role in preventing the occurrence of injuries to the lower spine and knees. [13].
Determining plantar pressure by using sensors is also important in the process of improving walking by using innovative soles (proprioceptive insoles) that can change the distribution of plantar load in static and dynamic conditions also after removing the insoles [14]. The correct choice of sports shoes for athletes (basketball players) is facilitated by the determination of plantar pressure, the study of [15] highlights higher values of pressure for experienced players, in the analysis of the execution of five specific moves, but without registering significant differences at the level of the whole group (between the moments of testing: the beginning of the season and the peak of the competitive season). Studying plantar pressure is helpful in making custom soles. Softer materials distribute the plantar pressure better than rigid ones, reducing it for diabetic patients with neuropathy/diabetic foot with neuropathy [16].
The use of sensors to measure plantar pressure is also used by [17] to investigate the differences between professional and intermediate skiers. For high-level skiers signaling a load of 60% on the rearfoot area, the use of heels for the application of loads and turns are performed symmetrically and aggressively. The application of non-elastic bands at the level of the plantar fascia—for a period of 3 days—optimizes the load distribution and reduces the sensitivity to foot pain, which is an optimal way to support the arch of the medial foot and prevents the development of injuries among futsal players, according to [18].
The use of baropodometric platforms brings to the attention of researchers the need to calibrate them and to standardize data, to validate the results in sports research andalso in related fields: medicine, physiotherapy, etc. [19].
Standard reference values of plantar weight distribution for healthy adults in Germany (aged 18–65 years) are determined and analyzed by [20]. Load distribution on the left foot vs. the right foot is balanced, for all stages of age, without gender/sex differences. The distributed load is higher on the rearfoot area of the legs (55%) and lower on the forefoot area (45%). An increase in BMI (body mass index) generated an increase in pressure in all areas, and advancing in age led to the movement of the load/load to the front part of the foot/forefoot and to an increase of the maximum pressure in the left foot, the biggest differences being observed between young people (18–40 years) and older persons (41–65 years).
The identification of the degree of confidence for the data recorded by the baropodometric platform (as a way of analyzing the distribution of plantar load and in terms of static assessment of postural stability) is made by [21], the platform being frequently used in research and in clinical medical protocols. The study on a group of 33 clinically healthy subjects/without signs of overload, aged 18–35 years, indicates significant differences between initial and final tests only for rearfoot plantar pressure and CoP/pressure center, and for total surface, maximum pressure, mean pressure, arc index forefoot plantar pressure and midfoot plantar pressure, no significant differences are reported.
Gender comparative analysis of plantar surfaces while walking identifies higher values for men than women, an important aspect for footwear design, according to [22]. For both sexes—both in the static and dynamic investigation—the distribution of plantar pressure at the level of the medial area is highlighted, but in women there is a higher load than men for the medial part, the finger area and the toe area [23].
The type of motor load and the unbalanced load of the body with different weights (luggage, backpack, bag, etc.) will generate an asymmetrical distribution of body weight on the two plantar surfaces, causing the inclination of the spine in the opposite direction of the weight, the manifestation of imbalances at the level of the trunk, according to [24]. These aspects will generate a significant increase in plantar pressure for the loaded foot area.
If additional body loads are added, with values between 10–30% of the individual body weight, for young male subjects (who do not present traumas of the musculoskeletal system and with the right leg dominant) higher values of plantar pressure are found on the dominant leg at the level of all areas of the plant, with the probability of trauma and collapse of the plantar arch, according to [25].
Physical activities and their specificity influence postural stability. Dance reduces visual dependence and increases postural control in young adolescents with an average age of 17.5 years [26]. A study made by [27] on nurses/women with an average age of 35 years-healthy and without orthopedic conditions-showed that there are no significant differences in the average values of plantar pressure (average pressure) before and after the end of the work schedule, but neither the differences obtained between the initial values and those after the application of a 10-min stretching program are not significant.
The effect of lower limb dominance on walking and running plantar load is studied by [28], on a group of young people with an average age of 20, all with dominant right leg. The equilibrium index indicates asymmetries for walking and running, and the static pressure on the dominant leg in the medial area is higher than for the non-dominant leg. Ambidextrous performances are indicated in sports, both for the actions of upper and lower limbs, ensuring rapid adaptation of movements to various contexts and greater chances of capitalizing on the assimilated motor skills, avoiding imbalances and ensuring harmonious development and limb symmetry [29].
Comparative analysis of the manner of distribution of plantar pressure in pubertal children characterized by physical activity vs. those with sedentary behavior is performed by [30], who finds better results in terms of balance for the active, doubled by a definitely improved postural attitude. Despite these results, no significant differences were found between the two groups for the values of distribution and plantar pressure. The study of the authors of [31], however, identifies significant differences in the lateral area for the forefoot and midfoot regions, between normal and obese children. Other research conducted by [32] indicates (for children aged 7–12 years) that the rearfoot area is identified with the highest values of plantar pressure, regardless of the weight of those investigated: normal weight, underweight, overweight and obese. Instead, there is a higher load for girls in the rearfoot area, compared to the values recorded by boys, and significant differences in plantar pressure are found in obese, between the right foot and left foot. No significant loading differences were reported on the forefoot vs. rearfoot at the level of the four tested groups.
2. Materials and Methods
The aim of this study is to investigate the differences in indicators resulting from the use of the baropodometric platform (values of pressures and surfaces of different areas and the positioning of the pressure centers) for karate do practitioners, divided into 3 age stages, and to identify plantar imbalances encountered in this martial art.
Working hypotheses:
H1.
There are significant differences between the average values of the indicators measured using the baropodometric platform, at the level of the 3 age stages investigated by the variance analysis.
H2.
There are significant differences between the pairs of scores recorded for the dominant and non-dominant foot, at the level of each age group.
H3.
There are significant differences between the pairs of scores recorded for the forefoot and rearfoot areas at the level of each foot, separately for the 3 age groups.
2.1. Participants
The investigated group is composed of 20 practitioners of the martial art karate do/Shotokan style (16 girls and 4 boys), registered at the Kazumi Sports Club in Focșani, Vrancea County, Romania. The dominant leg for all the analyzed subjects is the right one, being determined using the Harris test [33,34], and the average time spent practicing this sport at the level of the whole group is 5.27 ± 2.74 years. The subjects were divided into 3 age stages for multivariate analysis: athletes aged < 13 years/first stage of puberty (8 subjects/7 girls and 1 boy, aged 11.62 ± 1.18 years, height 157 ± 5.06 cm, weight of 48.75 ± 4.81, BMI of 19.67 ± 2.18, seniority of 4.43 ± 1.76 years); those aged 13–15 years/second part of puberty (6 subjects/4 girls and 2 boys, aged 13.66 ± 0.18 years, height 165.83 ± 7.57 cm, weight 60.50 ± 12.22, BMI of 21.93 ± 3.46, seniority of 3.83 ± 1.60 years); those already adolescent, aged > 15 years (6 subjects/5 girls and 1 boy, aged 16.00 ± 0.63 years, height 168.33 ± 9.47 cm, weight 56.16 ± 3.86, seniority of 7.83 ± 3.18 years, BMI of 20.04 ± 3.11). From the group aged over 15 years, 2 girls are members of the national Karate team.
The study fully complied with international conventions aimed at processing personal data and ensuring the anonymity of those investigated (Helsinki Declaration), the tested subjects being previously informed about the purpose and tasks of the research in which they participated voluntarily, expressing their agreement on voluntary adherence to this scientific investigation. The Ethics Commission at the level of the higher education institution has given its consent to the research in question.
2.2. The Organization of the Research
Subjects were assessed at the end of February 2021 (in the training mesocycle designed to optimize the specific training for the national Karate competition, with 3 workouts per week and a duration of 2 h/session), using the FreeMed By Sensor Medica baropodometric platform, whose instructions for use are detailed by [35]. The testing location of the group of athletes is represented by the material base of the Research Center for Human Performance, belonging to the Faculty of Physical Education and Sports, within the “Dunarea de Jos” University in Galați. Athletes were prohibited from performing any form of physical activity on the day of testing, so that the data collected would not be influenced by the onset of forms of nervous or physical fatigue.
The software used provided, for each athlete tested (following the static examination), a synthesis of the individual resulting data, materialized in: alignment or misalignment of the pressure centers corresponding to each foot, the place of projection of the pressure center (C) at the level of the support area and the distance from it to each foot (distance L-C/mm, distance R-C/mm), indication of the area and values of maximum pressure/peak pressure (P.max in g/cm2) for each foot, alignment or orientation of the legs forward/backward, the manner of loading (load% and kg) and the distribution of body weight on each foot, but also separately on the forefoot and rearfoot areas, the loading mode (balanced or unbalanced) of body weight for each leg, the existence of symmetries throughout the plantar surface for left foot vs. right foot, but also the differentiated comparison on the forefoot and rearfoot areas of the surfaces (surface in cm2), etc. In addition to these synthesized data, the individual tables also provide other measured values, referring to the values of the average pressure (P.avg. in g/cm2) at the level of each sole, the misalignment of the pressure center (misalignment C), the manner of percentage distribution of weight taken by each left/right leg at the level of the forefoot and rearfoot areas (Weight ratio R/F%), the misalignment at the level of the 2 soles (misalignment L-R0), etc.
Identifying areas of maximum, medium or low pressure is easy. The images provided by the software are diversified: plantar areas with high pressure are highlighted by warm colors (shades of orange to red), medium pressure areas are yellow, and areas with low pressures are in green, blue and purple. There is also the variant of detailed zonal representations, each small area having a number from 9 (maximum) to 0 (minimum) pressure, each number being colored according to the intensity of the represented pressure.
2.3. The Statistical Analysis of Data
The SPSS data processing software, version 24, was used to perform the statistical calculation. The confidence interval was set to 95% (p < 0.05). The indicators of the central tendency for the whole group and separately for each age group were calculated, in order to determine the arithmetic mean and standard deviations at the level of age-related indicators, seniority in sports activity and anthropometric values [36,37,38]. The influence of the independent variable age stage (with 3 steps) on the obtained results was based on the multivariate analysis/MANOVA (F)-multivariate and univariate tests, the calculation of the size effect, expressed by partial eta squared (η2p). In addition the Bonferroni factor of correction was used to determine the differences between the means of the analyzed dependent variables [39,40,41,42]. The low number of subjects in each age group and the fact that the normal distribution curve of the data is not respected, imposed the statistical calculation based on the nonparametric Wilcoxon test, both in determining the differences between the values (pairs) of the dominant/right foot and non-dominant/left foot, as well as when comparing the values (pairs) between the forefoot and rearfoot areas for each leg [38,43]. The high volume of data does not allow the presentation of an analysis of the correlations between anthropometric values and those resulting from the baropodometric study, and the study of differences between dominant and non-dominant foot values for the whole group (the 20 athletes) and centralization of individual data provided by software has already been published in the study [44].
3. Results
The data provided by the baropodometric platform are displayed in tables, and to facilitate their understanding, we also used a series of photos provided by the software (Figure 1). Table 1 summarizes the projection of the body pressure center at the level of the support area/polygon. It may be observed that most cases of decentralized distribution of the pressure center are found for the age group under 13 years old, with orientation on the right side (four cases). For all batches, the number of cases with offset or slightly offset right distribution is higher than for the left offset variant, and the number of cases of centered positioning of (C) increases with age, the maximum number of cases (four) being met for the group over 15 years old, an aspect that can be explained by the mental, biological and motor accumulations regarding balance, specific to adolescence (Figure 2).
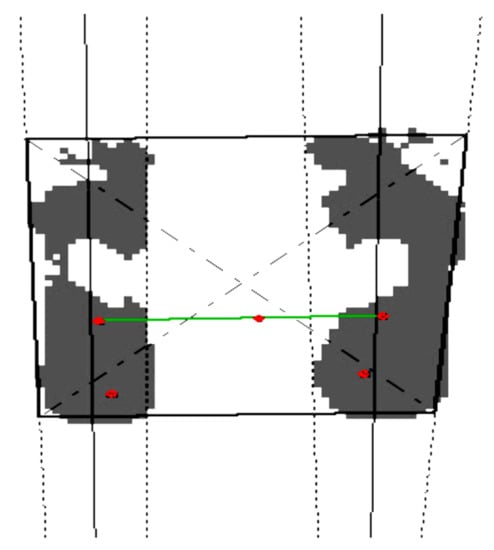
Figure 1.
Decentralized positioning of the center of pressure (C) of a subject/male, Misaligment (C) = 3.20 cm, with right posterior orientation (RG-P).

Table 1.
Variations of the center of pressure (C) positioning by age groups.
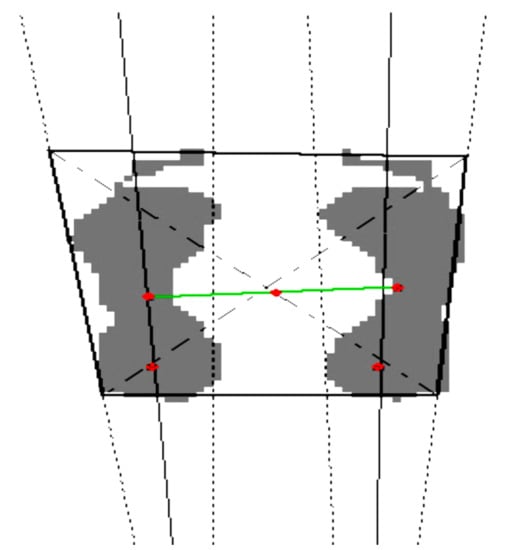
Figure 2.
Example of centered positioning of the center of pressure (C) of a subject/female, Misaligment (C) = 0.27 cm, with slight posterior orientation (P).
Table 2 summarizes the number of cases for the positioning of the pressure centers of each foot and their misalignments or alignment. It is observed that perfect alignment situations (L-R = 00) are very few, one case in the first two age categories and two cases for the interval over 15 years. Another aspect that should be mentioned is that the number of cases in which the center of pressure for the right leg is placed backwards and the one for the left leg is oriented forward exceeds the reverse positioning variant (right forward and left backward), but only for the first two age stages (Figure 3). For the group of adolescents, the dominance of the right in front and left in the back variants is noted (four cases) and the absence of the opposite variant, as an effect of the adaptations induced by the long period of sports activity, the left leg being used primarily as a support in the execution of the kicks with the dominant leg (right) (Figure 4).

Table 2.
Synthesis of the variants of positioning the L/R pressure centers on age groups.
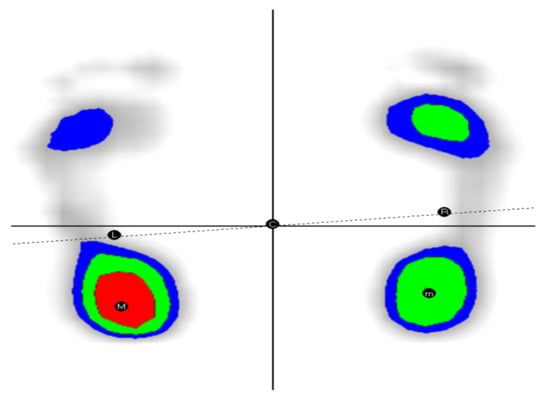
Figure 3.
Example of misalignment of pressure centers: female subject. L-back, R-front/Misalignment L-R = 70.
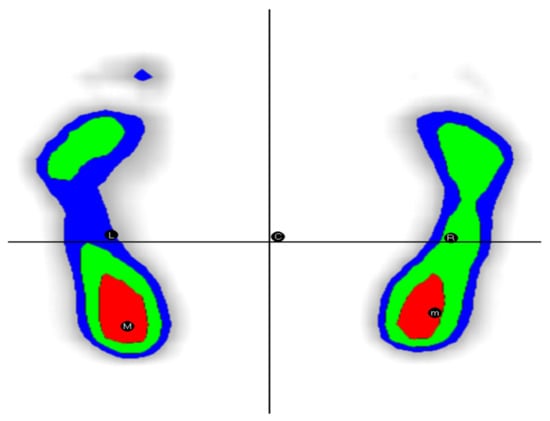
Figure 4.
Example of perfect alignment of pressure centers: female subject. Misalignment L-R = 00.
Table 3 shows the distribution of the variants of allocation of the maximum pressure points (P.max) for the analyzed batches. For the group of those under 13, there is a balance between the distributions of the maximum pressure point between the retropodal areas of the right foot and the left foot, with four cases on each side (Figure 4). At the level of the group 13–15 years, the distribution on the right leg/retropodal part dominates with five cases. Interestingly, for those over 15 years old, the situation is reversed (Figure 5), the maximum pressure values being recorded for the retropodal area of the non-dominant/left foot (Figure 6) (probably as an adaptive mechanism to high pressure demands as a support foot), also here being encountered the only case of atypical distribution/on the front part (forefoot) of the plantar surface of the right foot (Figure 7).

Table 3.
Distribution of maximum pressure points by areas and age groups.
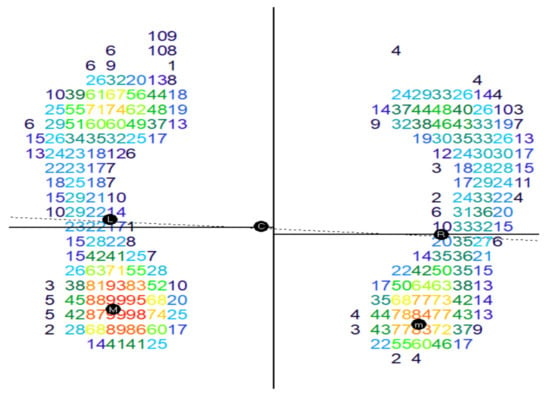
Figure 5.
Example of distribution of the maximum pressure point in the area left retropodal part: female subject. P.max. = 640 g/cm2.
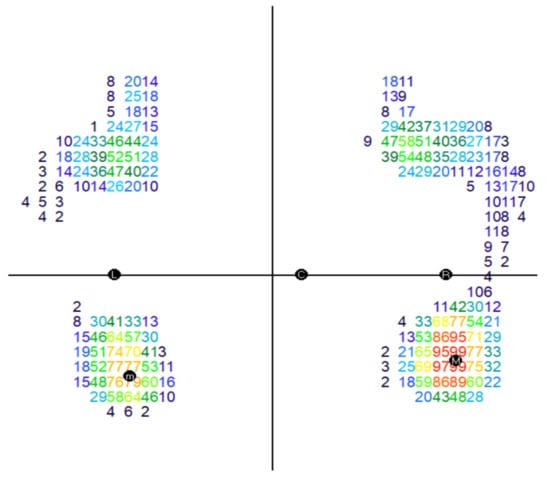
Figure 6.
Example of distribution of the maximum pressure point in the area right retropodal part: female subject. P.max. = 788 g/cm2.
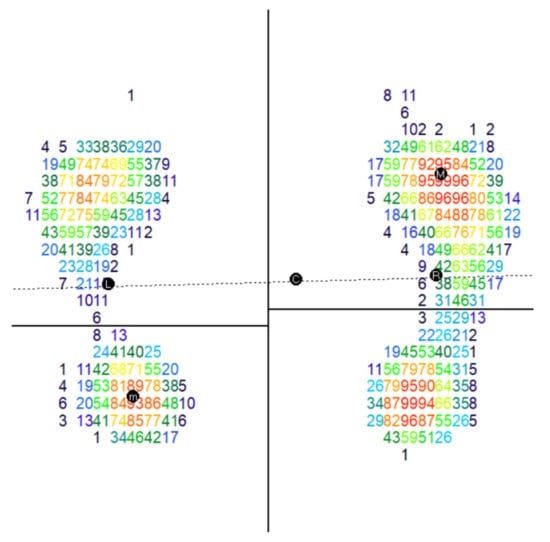
Figure 7.
Example of distribution of the maximum pressure point in the right forefoot part area: female subject. P.max. = 580 g/cm2.
Table 4 summarizes the situations of normal foot and the existing imbalances at the level of the plantar surfaces, related to the appearance of the cases of flat, hollow and mixed foot (a normal foot, combined with one to which they are signalled). Most cases with normal leg (Figure 8) are reported in the group under 13 years (4), followed by the other two groups, with two cases each. The 13–15 year-old age group has two cases of flat bilateral foot (Figure 9), and those over 15 have the most cases of mixed foot (3). Orthopedic specialists consider that these deviations (Figure 10) from normality (plantar imbalances) are due to the instability of the musculoskeletal system at the ankle joint, doubled by the specifics of sports, aspects that highlight a pronation syndrome (subtalar joint and eversion of the calcaneus bone) and supination (of the subtalar joint and inversion of the calcaneus bone) resulting in a flat leg and hollow leg (Figure 11). The fact that 12 athletes out of 20 fall into one of these imbalances, calls for future global investigations of the musculoskeletal system to find the cause, using specialists in orthopedics and physical therapy, to rebalance the architecture of the sole of the foot, by implementing an individualized improvement protocol, according on the encountered imbalances.

Table 4.
Distribution of cases of normal foot and deviations from normal for the three age groups.
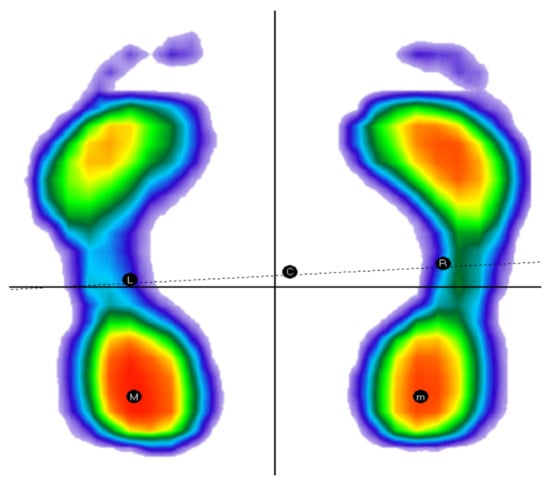
Figure 8.
Example of normal bilateral leg-female subject.
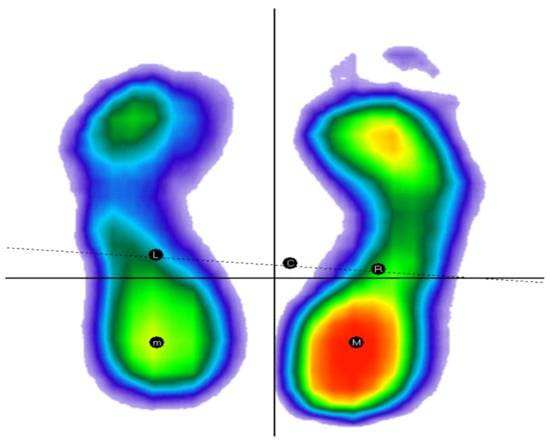
Figure 9.
Example of bilateral flat foot-male subject.
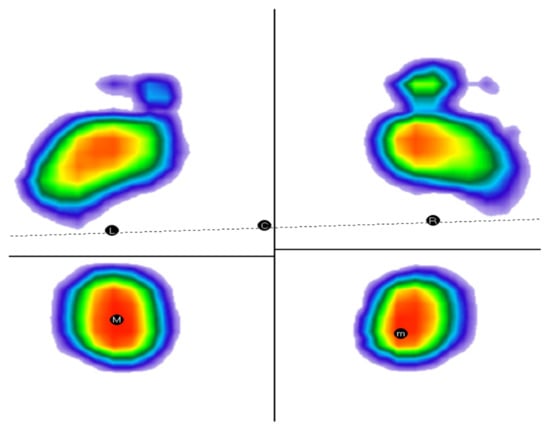
Figure 10.
Example of leg with bilateral cavity-male subject.
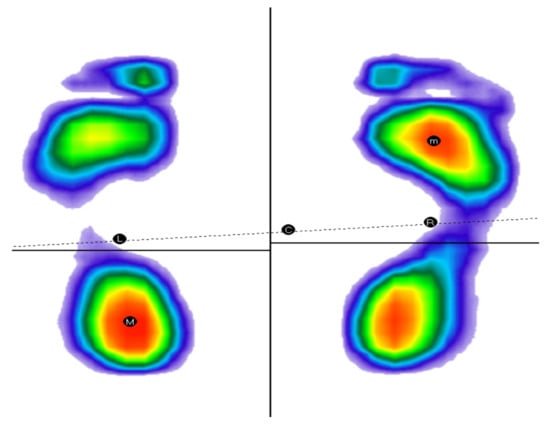
Figure 11.
Example of mixed leg (left cavity, normal right)-female subject.
Table 5 presents the results of the ANOVA univariate test, which indicates the influence of the independent age step variable on each dependent variable provided by the baropodometric platform. It is observed that significant values of F are recorded only for the results related to the areas of the surfaces of the left foot, i.e., forefoot_left_surface, total_left_surface: F(2,17) = 4.63, with Sig. = 0.025 and η2p = 0.353 (that is, 35.3% of the variance of the variable forefoot_left_surface is determined by the influence of the independent variable), F(2,17) = 3,74, with Sig. = 0.045 and η2p = 0.306 (that is, 30.6% of the variance of the variable total_left_surface is determined by the influence of the independent variable). For the rest of the variables presented in the table, the values of F correspond to thresholds of Sig. > 0.05, so it is not possible to discuss a significant influence of age groups on the results related to the values of the plantar surfaces for the right foot, the values of the maximum pressure, the values of the average pressure, the load on each foot and each area of the feet (forefoot and rearfoot), the values related to the misalignments of the center of pressure (C) and the misalignments left/right, the distances from the pressure centers of each plantar area to the pressure center of the body, etc.

Table 5.
Results of the analysis of univariate tests (Univariate ANOVA)/Tests of Between-Subjects Effects.
Table 6 shows the comparison of the differences between the averages obtained by each analyzed group, for the investigated dependent variables. Significant differences between averages result only for the averages of the variable forefoot_left_surface, at the level of groups under 13 years old and over 15 years old, with Sig. = 0.044, value < 0.05. For all other data pairs, no significant differences were obtained (p > 0.05), even if there are many situations in which the group aged 13–15 years old has higher results than the other two groups (forefoot_left_weight_ratio_percent, rearfoot_left_surface, rearfoot_right_surface, rearfoot_right_weight_ratio_percent, total_left_surface, total_right_surface, total_right_load_percent and total_right_load_kg, total_right_Pmax and total_right_Pavg, misalignment_C_cm and misalignment_L_R_grade). The group of those over 15 years old has the highest average values for most of the dependent analyzed variables. The group under 13 years old has the fewest increased average values.

Table 6.
The results of the differences between the averages of the tested lots and their significance.
Table 7, Table 8 and Table 9 summarize the comparison of the differences in results between the lower left limb vs. the right one, separated by age groups, but using the nonparametric Wilcoxon test/by ranks (due to the small number of subjects that does not ensure the normal distribution of data), the values of the central tendency being entered in the tables only for an easier representation of the scores obtained. It is observed that in most cases, for the age group under 13, the average values of the right foot (dominated segment) are higher than the left, except for rearfoot_right_weight_ratio_percent. The values of |Z| however, are associated for all the resulting pairs, with statistically insignificant thresholds (Sig. > 0.05).

Table 7.
Wilcoxon right/left nonparametric test results-pairs/under 13 years (N = 8).

Table 8.
Wilcoxon right/left nonparametric test results—pairs/13–15 years (N = 6).

Table 9.
Wilcoxon right/left nonparametric test results—pairs/over 15 years (N = 6).
For the age group 13–15 years old, the average values for the right foot area are also higher than those for the left foot, the exception being in this case forefoot_right_weight_ratio_percent. In addition, in this case, all the values of |Z| are associated with statistically insignificant thresholds (Sig. > 0.05).
For the group of those over 15 years old, a series of values appear that are different from those found in the previously analyzed groups, even if, for most pairs, the right leg has higher scores, and in most cases there are still insignificant differences. A higher load is found for the rearfoot_left_load_percent and rearfoot_left_weight_ratio_percent, as well as higher values for total_left_Pmax. There is also a pair of data where statistically significant differences are reported: when loading the front of the foot (forefoot_left_load_percent and forefoot_right_load_percent), with a value of |Z| = 1.997, corresponding to a Sig. = 0.046.
Understanding the differences between the values recorded for the dominant leg vs. the non-dominant one is made easier, due to the photos generated by the software for each case. The average values presented in the previous tables do not facilitate the formation of a complete image of the analyzed problem, and the selective presentation of the photographs for some of the measured parameters can be a source of complementary information. At the level of weight distribution L/R (percent or kg), the software values indicate a difference of maximum 3% between the load of the two feet, for that to be considered balanced (Figure 12). For 12 athletes this aspect is not confirmed (Figure 13), nine of them having an exaggerated load on the dominant/right leg (Figure 14), and 3three on the left (Figure 15), (seven cases for the group under 13 years old, four cases for those aged between 13–15 years, and only one case for the group over 15 years old), so we can conclude that experience and aging favorably regulate the weight distribution on the two feet.
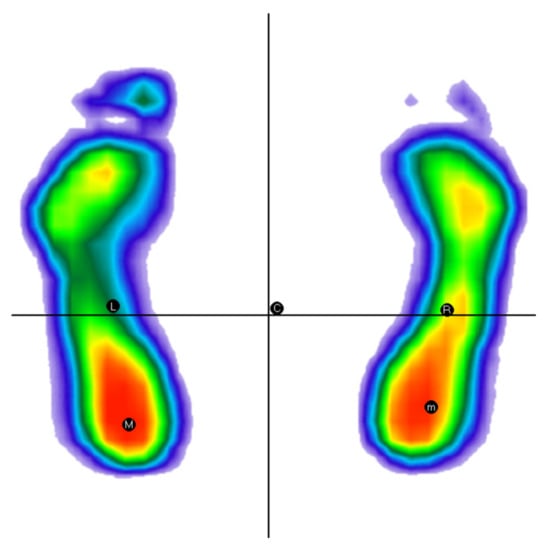
Figure 12.
Example of balanced body weight distribution (Load L = 51%, Load R = 49%)—female subject.
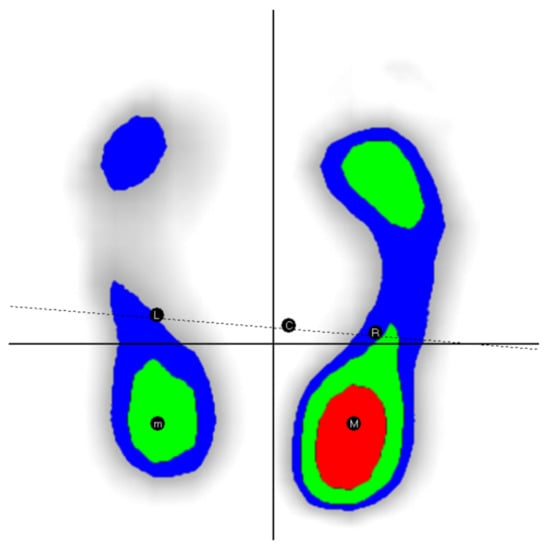
Figure 13.
Example of unbalanced body weight distribution, with load dominance on the right leg. (Load L = 39%, Load R = 61%)—male subject.
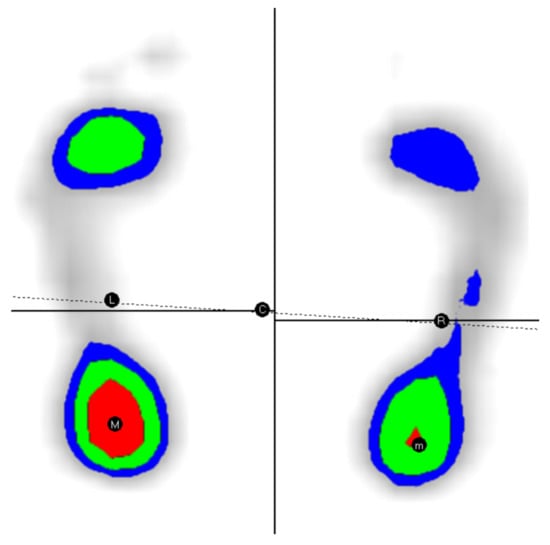
Figure 14.
Example of unbalanced body weight distribution, with load dominance on the left leg. (Load L = 55%, Load R = 45%)—female subject.
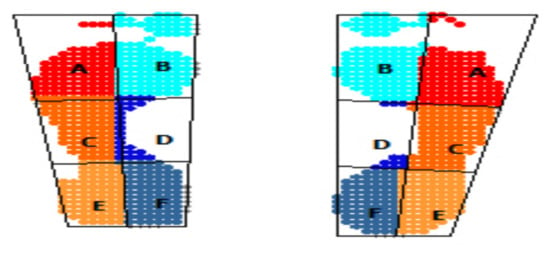
Figure 15.
Example of symmetry of the values of the total plantar surfaces and at forefoot and rearfoot level/female subject (Total surface: L = 118 cm2, R = 119 cm2), (forefoot surface: L = 69 cm2, R = 69 cm2), (rearfoot surface: L = 49 cm2, R = 50 cm2).
The values provided by the software for the interpretation of the symmetry of the total plantar surfaces (cm2) indicate in the group of those under 13 the most situations of relative symmetry/difference of surfaces of maximum 8 cm2 or of small differences (6 cases). For this aim, the area was divided into 6 sectors marked with the letters A-F (Figure 15). The group aged 13–15 years had the fewest cases (two), and half of the group of those over 15 years old (three cases) fall into these values, so with increasing age there is a higher incidence of those with asymmetries of plantar surfaces (Figure 16).
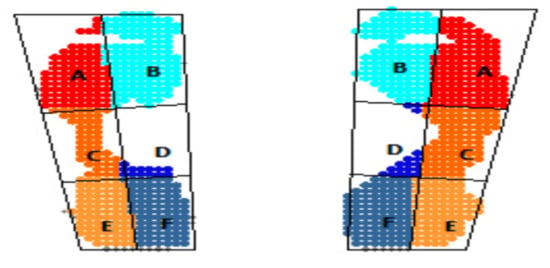
Figure 16.
Example of asymmetry of the values of the total plantar surfaces and at forefoot and rearfoot level/female subject (Total surface: L = 114 cm2, R = 134 cm2), (forefoot surface: L = 63 cm2, R = 76 cm2), (rearfoot surface: L = 51 cm2, R = 58 cm2).
Table 10, Table 11 and Table 12 summarize the average values of the parameters measured at the forefoot and rearfoot areas and the differences between them separately, for each foot. The interpretation of the differences between the resulting pairs was also analyzed based on the Wilcoxon parametric procedure. At the level of the group under 13 years old, statistically significant results are found only for the differences of the rearfoot and forefoot surfaces, for both legs: on the left one a value of |Z| = 2524 is obtained, and for the right one, |Z| = 2521, both scores are associated with a threshold (Sig. = 0.012), value < 0.05. For the other pairs no significant differences are found (Sig. > 0.05), even if normal/higher load values of the total body weight are recorded on the rearfoot area compared to the forefoot area. The situation is similar for the percentage distribution between the two areas of each foot/forefoot and rearfoot weight_ratio_percent.

Table 10.
Forefoot-rearfoot differences (Wilcoxon test)—age group under 13 years/pairs (N = 8).

Table 11.
Forefoot-rearfoot differences (Wilcoxon test)—age group 13–15 years/pairs (N = 6).

Table 12.
Forefoot-rearfoot differences (Wilcoxon test)—age group over 15 years/pairs (N = 6).
At the level of the group aged 13–15 years old, the same statistically significant difference could be noticed. In this way in Table 11 are displayed significant values of |Z|. However, the upper average load of the total body weight on the forefoot side of the left foot should be highlighted, compared to the value assigned to the rearfoot area, which is abnormal and requires further investigation to find explanations, and in the case of the right leg is noticed the equal load distribution on the 2 areas. Other atypical values result in the comparison between forefoot_left_weight_ratio_percent and rearfoot_left_weight_ratio_percent, highlighting the additional load on the forefoot side.
For the group over 15 years old, in the case of the first two pairs of tests, the differences between the rearfoot and forefoot areas are similar to those of the other groups, so these are significant. Even if insignificant values of |Z| are obtained for the rest of the data pairs, the results contrast sharply with those of the other age stages, especially with the group under 13 years old. If, at the level of the left leg, there is a relative balance in the distribution of body weight between the two areas, at the level of the dominant/right foot, the load on the front (forefoot_right_load_percent) has a higher value than the load on the back (rearfoot_right_load_percent). The situation is the same for the right foot in the pair (forefoot_right_weight_ratio_percent vs. rearfoot_right_weight_ratio_percent), where the average load on the forefoot area is excessively high and contrasts sharply with average values for ordinary adults, presented in the introduction.
At the level of the differentiated load for each left/right leg of forefoot vs. rearfoot areas (forefoot_weight_ratio_percent and rearfoot_weight_ratio_percent), equal-load values (50–50%) or higher values of the forefoot area are not considered to belong to the normality standard (Figure 17). A higher value of this rapport (maximum 59%) for the rearfoot area is considered normal by the software. Only one subject (out of the whole group of 20) has a distribution according to this standard for both legs, seven subjects for only one of the legs (Figure 18), and the remaining 12 have large variations/load imbalances for both legs, both in the variant of overloading the forefoot area, and also in the variant of overloading the rear foot area (Figure 19).
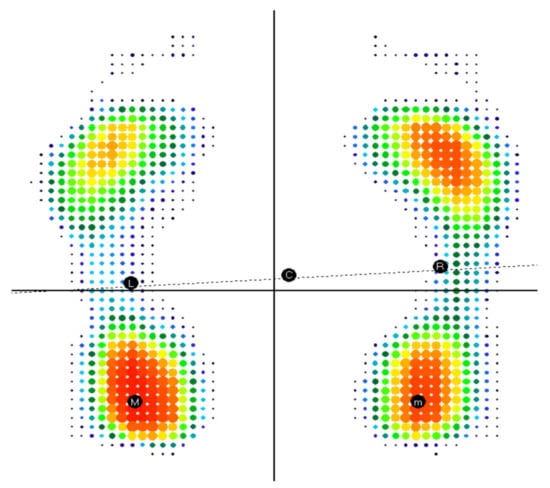
Figure 17.
Example of normal weight distribution between forefoot and rearfoot areas for both legs/female subject/weight ratio left (forefoot = 47%, rearfoot = 53%), weight ratio right (forefoot = 44%, rearfoot = 56%).
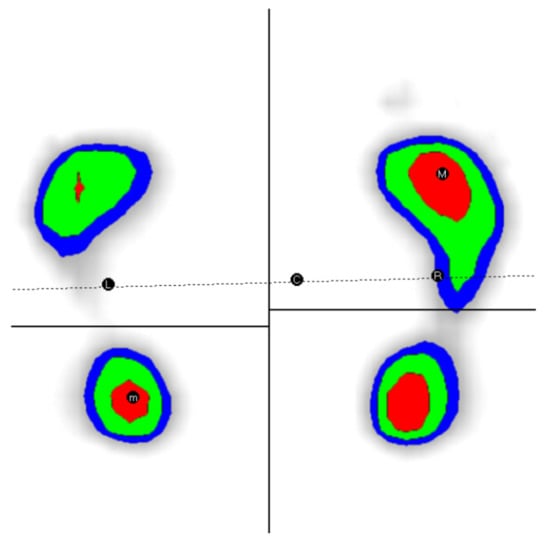
Figure 18.
Example of excessive weight distribution on the forefoot side for both legs/female subject/weight ratio Left (forefoot = 58%, rearfoot = 42%), weight ratio right (forefoot = 68%, rearfoot = 32%).
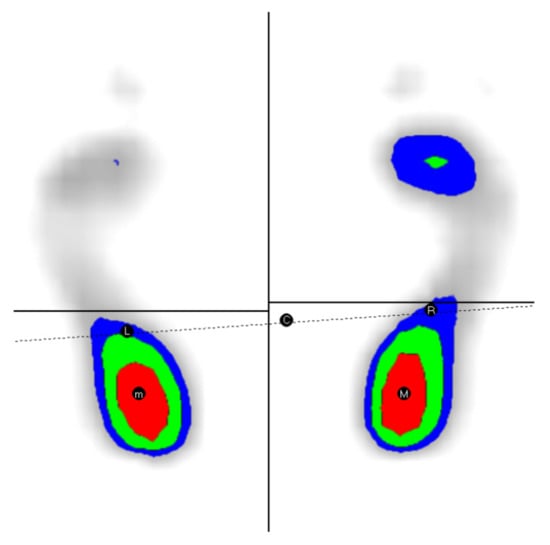
Figure 19.
Example of overstated weight distribution on the rearfoot side for both legs/female subject/weight ratio Left (forefoot = 32%, rearfoot = 68%), weight ratio right (forefoot = 38%, rearfoot = 62%).
4. Discussion
The results presented above are partly consistent with studies conducted by different authors, who investigated, using different devices, the values of plantar pressure for athletes practicing various martial arts styles, but also for groups practicing other disciplines and sporting events. These studies investigated the presence of asymmetries at the plantar level. The study investigated higher values of the plantar pressure on the dominant foot, the location of high pressure points at the heel and metatarsal area and the increase of the plantar pressure on the forefoot area for the supporting/non-dominant foot, especially with the increase of seniority in activity.
The analysis of plantar pressure values for elite Karate practitioners (men and women) in the study of [45] highlighted major differences between the front/hitting foot and the back/providing the support, in terms of peak pressure values, contact area and ground reaction force, which affect the long-term distribution of plantar pressure. The authors [46] refer to the process of correcting the poor execution technique during the training of young athletes in karate do, which highlights the need for optimal plantar pressure, as a premise for good hitting technique in this martial art.
The execution speed of the karate do movements is strongly and positively correlated with the maximum values of the plantar pressure for both legs, so this parameter conditions the execution technique, with the improvement in the speed of the blows coming with the increase of the plantar pressure, according to [47]. Similar studies support this statement, the manner of distribution of plantar pressure being an indicator of the correctness of technical procedures specific to martial arts. The authors of [48] highlight the associations between the value of plantar pressure and speed of blows with different segments. This facilitates the identification and correction of technical errors in due time.
The modification of the plantar loads for karate practitioners, according to the type and density of the contact surface at training/type of pad, is studied by [49]. The movement on flexible and softer surface/soft floor does not have the same benefits as hard surface/hard floor. In the latter case, there are significant benefits and improvements for a correct posture of the arch of the foot, which are missing in the soft surface variant. The study of [50] highlights the influence of the type of surface used for running (grass, synthetic rubber and concrete) on the plantar load of runners, the variant of tracks made of synthetic rubber reducing the plantar pressure on the lateral forefoot area, compared to concrete surface.
The lack of ambidextrous executions for the components of the kata and kumite group (Iran) leads to imbalances of the plantar pressure values between the dominant and the homologous segment, and the peak values are generated by the kumite group, due to the higher demands of the segmental force. The same group obtains higher pressures in the metatarsal area 2–5, and the base/dominated foot has values higher than the other one at the level of the toe/big toe and toes 3–5, according to [51].
A comparative study done on karate athletes (9–19 years old) and a group of non-athletes highlights higher values of karate practitioners in terms of postural stability and lower values of the projection of the center of gravity on the support surface, but the athletes who suffered injuries to the lower limbs do not record a symmetric load of the sole area [52].
The analysis of the manner of distribution of the load and plantar distribution at the level of capoeira practitioners (martial art with Brazilian origins) showed higher values at the level of the dominant foot/dominant limb and significant differences in the division of body load for forefoot load, respectively total load, compared to the control group/not involved in practicing capoeira. However, no significant differences were reported between the 2 groups tested, in terms of muscle strength and postural balance [53].
A study made on elite Iranian Taekwondo female athletes showed that there are asymmetries in the lower limbs dominant vs. non-dominant, the reaction force on the ground and the increased plantar pressure are located in the area of the heel and metatarsals 3–5, and the lowest pressures are at the level of the toes 2,3,4,5 for both feet [54].
The analysis of the duration of maintaining and the distribution of plantar pressure in Tai Chi practitioners for the static position on one leg stance indicates a displacement of the CoP in the mid-lateral plane during the position, greater than during walking, and the load is on the anterior-medial area of the foot, compared to walking, where it is in the anterior and middle area of the foot. The Tai Chi movements generate a higher load on the big toe and metatarsal area 1-first head. The location of the CoP is predominantly medial and posterior at the initial contact, respectively medial and anterior at the end of the contact with the ground [55,56]. In addition, for this martial art, [57] signals a decrease in the values of plantar pressure during walking, doubled by the balancing of the body distribution between the rearfoot and forefoot areas, but the displacement with increased amplitude of the CoP in the medial-lateral direction is found.
At the level of elite weightlifters (12 subjects with an average age of 23.2 years) is reported a different pattern of plantar pressure while walking compared to healthy unsportsmanlike adults, according to the study of [58]. Pressure differences are significant between the left leg vs. right one for zone 3/middle of the middle leg (medial midfoot) and zone 9/toe 9 (second toe), being indicated the design of insoles that reduce the load on the metatarsal bones 3–5 in order to avoid metatarsalgia in athletes.
The use of the baropodometric platform to study the plantar pressure of kendo fighters identified-for the defumikiri movement performed with the right foot forward-that during the blow there is an increase in plantar pressure at the toe and metatarsal points M1 and M2 on the right leg [59].
A comparison of plantar pressure in Polish first division/league footballers, by comparison with unsportsmanlike subjects/students in physiotherapy is made by [60]. Significant differences between groups at the level of the dominant foot and significant associations between BMI values and the average plantar pressure of the dominant foot are found only for the group of footballers, so there are direct influences of sports activity on plantar pressure. Plantar overload, generated by inappropriate leg positions, can cause imbalances and injuries, by transferring forces to the biomechanical chains of the lower limbs. Correlations of plantar pressure and non-dominant limb peak values with BMI values, for weightlifting women/female Olympic style we-ightlifters, in static conditions are also highlighted in the study [61].
The static and dynamic evaluation of 8 national team golfers/Turkey aged 15–18 years generated significant differences between the values of forefoot and rearfoot surfaces/cm2, the values for the dominated foot being higher than the ones for the counterpart. There are also significant differences between forefoot load and rearfoot load (forefoot vs. rearfoot load %), but also significant differences between forefoot and rearfoot weight ratio R/F% for both legs [62]. In contrast, the study of [63], conducted on elite fighters with the average age of 23.6 years does not signal the existence of significant differences between the dominant and non-dominant leg, this aspect being a feature of this sport. However, there are positive associations between the values of height and weight with those of the plantar pressure, especially in the heel area (lateral area of the left foot, respectively lateral and medial areas of the right foot).
Plantar pressure is influenced by the type of stretching performed in the study [64] demonstrating that intermittent stretching/intermittent stretching at the bilateral ankle plantar flexors will lead to reduced maximum plantar pressure for the rearfoot area and a better balance in adults, compared to the continuous variant/continous stretching. Increasing plantar pressure during physical activity can increase the chances of foot ulcers, even if their beneficial effect on health is undeniable. Walking speed-from moderate to fast pace (3.6 mph) will reduce plantar stiffness, compared to the slower pace of movement (1.8 mph) [65].
The sedentary lifestyle of women over 60 years of age will generate increases in the values of plantar pressure in the rearfoot and forefoot areas, as well as high values of P max (peak plantar pressure), in the opinion from [66].
The influence of long distance running (45 min at a speed of 12 km/h) on plantar pressure and foot posture is determined by [67] on a study group of 116 healthy adults with no lower limb injuries, with an average age of 28.31 years. Immediately after running, there is a neutral positioning of the pronated foot, a decrease in average plantar pressures for forefoot areas, internal and external rearfoot, as well as a decrease in peak pressure/peak plantar pressures for the forefoot area.
Changes in plantar pressure for half-marathon runners are analyzed by [68], highlighting the differences between the moment before and after the race. The study performed on 36 men found an uneven distribution of plantar pressure (before the race), the left being more loaded. In addition, on the left leg, there was an increase in plantar pressure after the run at the forefoot and rearfoot, but also a decrease in the central/midfoot area. After running, there was an increase in cases of high arched feet. Marathon runners have increased values of plantar pressure in the forefoot area-in static conditions for the dominant foot-compared to sedentary individuals, but also a lower median pressure of both extremities for dynamic activities, according to [69]. Significant correlations between BMI and average plantar pressure of the dominant foot are observed only for marathon runners and only under dynamic conditions. The specialization of the runners generates different static pressure indicators, according to [70], the sprinters registering higher indicators of the plantar pressure distribution compared to the recreational runners.
Problems caused by physical deficiencies can affect the values of plantar pressure. Moderate double idiopathic scoliosis (S-shape) in the spine, among adolescents, will cause significant changes in plantar pressure between the right leg vs. left. A same result is observed for the foot as a whole, and the first and fifth metatarsal and heel area, according to [71]. The importance of arch stiffness index (ASI) values in maintaining balance when walking from standing to standing is highlighted by [72]. There are significant differences between people with rigid arch/stiff arch and those with flexible arch/flexible arch, at the level of forefoot and rearfoot areas.
5. Conclusions
The importance of this research results from the fact that the baropodometric examination provides a series of data in addition to those resulting from simple observations or physical tests and which allow the identification of problems related to possible errors in execution technique, generated by the distribution of plantar pressure and imbalances. This aspect raises questions about the negative effects that the effort has on the architecture of the foot. It is obvious that the specifics of the sports activity, the working positions, the execution technique and the dominant muscular demands on certain body regions, muscle chains and joints will leave their mark on the values provided by the static baropodometric examination. The fact that the results related to plantar loading in different areas and the location of maximum pressure points have some common features, but also differences from one group to another, shows that there are effects generated by adapting to the effort of karate do, combined with transformations associated with the growth and development of the body. Adolescent subjects had the lowest number of cases related to the off-centered positioning of the pressure center (C), and those under the age of 13 have the most cases; the pubertal disorders can explain this gap. The groups of those under 13 and over 15 years old located in most cases P.max at the level of the area in the left retropodal part, while those between 13–15 years have a location on the dominant leg, at the level of the area in the right retropodal part. The highest numbers of cases with normal bilateral foot are for the group under 13 years, and the other groups have a higher incidence of various plantar imbalances.
Significant differences between the three groups for the analyzed parameters are found only for the support leg (at forefoot left surface). The increase in age also leads to an increase in the values of the measured indicators, but without registering significant differences, so we cannot speak of a validation of the first working hypothesis. The second hypothesis cannot be confirmed either, as the differences within each batch between the dominant and the non-dominant leg are in most cases in favor of the dominant/right leg, but in this case no statistically significant differences are reported, except fore-foot_right_load_percent and forefoot_left_load_percent for the group over 15 years old. A possible explanation for the lack of significant differences may be the concern for ambidextrous executions in training. The differences between the forefoot and rearfoot areas for each lot are statistically significant only for the surface values, not for the load, so hypothesis 3 is partially confirmed.
The analysis of variance (F) identified only two situations in which the independent variable age stage significantly influences the resulting parameters, at the level of the non-dominant foot: forefoot_left_surface and total_left_surface. Even if the average values of the dependent variables are in most cases higher for the older age groups, their comparison for the three formed pairs generates in most cases statistically insignificant differences. The data differences for the right/left pairs within each group generate insignificant values of |Z| for most cases, with superiority of the dominant foot parameters for the first two age groups, but in the case of the group over 15 years old some results are atypical, with higher average values of the left/non-dominant foot parameters in the following cases: total_left_Pmax, total_left_Pavg, rearfoot left_load_percent andrearfoot_left_weight_ratio_percent. The comparison between the data pairs for all three groups (between the forefoot and rearfoot plantar areas) generated significant values of |Z| only for the area of the plantar surfaces. The older the subjects, the more the plantar load on the forefoot area is more obvious, for the group over 15 years this aspect is obvious for the dependent variables forefoot_left_weight_ratio_percent and forefoot_right_weight_ratio_percent, an aspect that is similar to the results of some martial arts studies, and which is determined by the prolonged use of the non-dominant foot as a support base, during executions with the dominant one.
Limits of the Study
The research carried out is not exhaustive, and the recorded results cannot be generalized, due to the limited number of investigated subjects, generated by the lower specificity and popularity of this sport. Another limitation of the study is that individual anthropometric data and factors related to joint biomechanics (body mass, height, lower limb length, value of joint angles and possible deficiencies in the knees and spine, etc.) are not analyzed. aspects that can influence the plane-hard pressure distribution. The absence of a control group (not involved in sports activities) did not allow the identification of the differences between martial arts practitioners and those of the same age who do not have these concerns. The fact that there is no numerical balance between girls and boys practicing karate do ruled out the possibility of comparing data between the sexes, implicitly identifying common issues and gender differences. More in-depth investigations could be aimed at testing the subjects during and immediately after training, to identify acute changes in pressure and contact plantar surfaces generated by the specific effort; identification of the values offered by the platform in the case of dynamic/walking actions, highlighting the disturbances that occur; analysis of positive and negative associations that appear between the analyzed parameters and the values of anthropometric indicators; extending the study to older/senior practitioners and even retired athletes, in order to determine the long-term effects of training on indicators of plantar pressure and possible imbalances; investigating other disciplines in the field of martial arts, to highlight commonalities and differences that occur in comparison with the discipline of karate doand measurement of plantar pressure for different age-representative categories, not involved in sports activities (pre-school, preschool, early school age, puberty, adolescents, adults at different intervals, the elderly), in order to establish average values/standards of normality and their comparison with the results generated by practicing different physical sports activities or leisure in the same age range.
Author Contributions
Conceptualization, G.D.M. and G.M.; methodology, G.D.M., D.A.I. and I.S.; software, G.D.M. and G.M.; formal analysis, D.A.I.; investigation, G.D.M., G.M. and I.S.; resources, G.D.M. and D.A.I.; data curation, G.D.M., G.M. and I.S.; writing—original draft preparation, G.D.M.; writing—review and editing, G.D.M. and G.M.; visualization, G.D.M. and G.M.; supervision, G.D.M. and G.M.; project administration, G.D.M. and G.M.; funding acquisition, D.A.I. All authors have read and agreed to the published version of the manuscript.
Funding
The work of Daniel Andrei IORDAN was supported by the project “ANTREPRENORDOC”, Contract no. 36355/23.05.2019, financed by The Human Capital Operational Program 2014e2020 (POCU), Romania.
Institutional Review Board Statement
The study was conducted according to the guidelines of the Declaration of Helsinki, and approved by the Institutional Review Board and Ethics Committee of “Dunarea de Jos” University of Galati no 17683/21.07.2021.
Informed Consent Statement
Informed consent was obtained from all subjects involved in the study.
Data Availability Statement
Details regarding where data supporting reported results can be found at the address www.phys.ugal.ro/Documents/art03.
Acknowledgments
The authors of this study thank the group of athletes practicing the martial art of karate do, from the Kazumi Focșani Sports Club and coach Marius Cojocaru for their involvement and contribution to this scientific investigation.
Conflicts of Interest
The authors declare no conflict of interest.
References
- Mor-Stabilini, S. Ido Movement for Culture. J. Martial Arts Anthropol. 2013, 13, 45–48. [Google Scholar]
- Nagamine, S. Essence of Okinawan Karate-Do; Tuttle Publishing: Rutland, VT, USA, 2011; ISBN 978-1-4629-0248-4. [Google Scholar]
- Sabina, M.; Ioana-Sorina, L.; Elena-Andreea, L.; Radu, P. Manifestations of Some Personality Traits in Karate Do. Procedia Soc. Behav. Sci. 2014, 117, 269–274. [Google Scholar] [CrossRef][Green Version]
- Chitaree, R.; Rattananupong, P. Plantar Pressure Detection with Mechanically Induced Long Period Fiber Grating System, Proceedings of the Fourth International Conference on Photonics Solutions (ICPS2019), Chiang Mai, Thailand, 20–22 November 2019; Kawanishi, T., Kanprachar, S., Anukool, W., Mankong, U., Eds.; Spie-Int Soc Optical Engineering: Bellingham, WA, USA, 2020; Volume 11331, p. 1133107. ISBN 978-1-5106-3430-5. [Google Scholar]
- Melakessou, F.; Bieck, W.; Lallemant, Q.; Palmirotta, G.; Anti, B. Presentation of a New Sensor Enabling Reliable Real Time Foot Plantar Pressure Distribution Retrieval. In Wireless Mobile Communication and Healthcare; Perego, P., Rahmani, A.M., TaheriNejad, N., Eds.; Springer: Berlin/Heidelberg, Germany, 2018; Volume 247, pp. 217–224. ISBN 978-3-319-98551-0. [Google Scholar]
- Navandar, A.; Veiga, S.; Garcia, C.; Rueda, J.; Torres, G.; Chorro, D.; Navarro, E. Gender Effects on Limb Dominance in Kicking Biomechanics in Elite Soccer Players. In Proceedings of the ISBS Conference Proceedings Archive, Tsukuba, Japan, 18–22 July 2016. [Google Scholar]
- Navarro, E.; Chorro, D.; Torres, G.; Navandar, A.; Rueda, J.; Veiga, S. Electromyographic Activity of Quadriceps and Hamstrings of a Professional Football Team during Bulgarian Squat and Lunge Exercises. J. Hum. Sport Exerc. 2021, 16, 581–594. [Google Scholar] [CrossRef]
- Keatsamarn, T.; Visitsattapongse, S.; Aoyama, H.; Pintavirooj, C. Optical-Based Foot Plantar Pressure Measurement System for Potential Application in Human Postural Control Measurement and Person Identification. Sensors 2021, 21, 4437. [Google Scholar] [CrossRef]
- Cheng, X.; Mei, X.; Hu, Y.; Fang, Y.; Wu, S.; You, F.; Kuang, S. Development of an E-Health App for Lower Limb Postoperative Rehabilitation Based on Plantar Pressure Analysis. Appl. Sci. 2018, 8, 766. [Google Scholar] [CrossRef]
- Truong, P.H.; You, S.; Ji, S.-H.; Jeong, G.-M. Adaptive Accumulation of Plantar Pressure for Ambulatory Activity Recognition and Pedestrian Identification. Sensors 2021, 21, 3842. [Google Scholar] [CrossRef]
- Andreev, D.; Karmazin, V.; Parastaev, S. Comprehensive Assessment of Postural Control as a Conceptual Basis for Optimizing Rehabilitation and Recovery Programs in Sports. Bull. Russ. State Med. Univ. 2017, 5–11. [Google Scholar] [CrossRef][Green Version]
- Marouvo, J.; Castro, M.A.; Santos, C.; Sousa, F. Correlation between Different Methods to Diagnose Foot Posture Condition. J 2021, 4, 233–243. [Google Scholar] [CrossRef]
- Rosero-Montalvo, P.D.; Fuentes-Hernández, E.A.; Morocho-Cayamcela, M.E.; Sierra-Martínez, L.M.; Peluffo-Ordóñez, D.H. Addressing the Data Acquisition Paradigm in the Early Detection of Pediatric Foot Deformities. Sensors 2021, 21, 4422. [Google Scholar] [CrossRef]
- Oro Nobili, C.; Mannacio, E.; Ciccarelli, A.; Tajani, F.; Ripani, M. Analysis of Modifications of the Plantar Parameters after the Use of a Proprioceptive Insole: Regular Gait. J. Sports Med. Phys. Fit. 2019, 59, 65–70. [Google Scholar] [CrossRef]
- Amaro, C.M.; Castro, M.A.; Roseiro, L.; Neto, M.A.; Amaro, A.M. Plantar Pressure Evaluation during the Season in Five Basketball Movements. Appl. Sci. 2020, 10, 8691. [Google Scholar] [CrossRef]
- Nouman, M.; Dissaneewate, T.; Chong, D.Y.R.; Chatpun, S. Effects of Custom-Made Insole Materials on Frictional Stress and Contact Pressure in Diabetic Foot with Neuropathy: Results from a Finite Element Analysis. Appl. Sci. 2021, 11, 3412. [Google Scholar] [CrossRef]
- Matsumura, S.; Ohta, K.; Yamamoto, S.; Koike, Y.; Kimura, T. Comfortable and Convenient Turning Skill Assessment for Alpine Skiers Using IMU and Plantar Pressure Distribution Sensors. Sensors 2021, 21, 834. [Google Scholar] [CrossRef] [PubMed]
- Klich, S.; Wang, B.; Chen, A.; Yan, J.; Kawczyński, A. Preventative Taping in Futsal: An Exploratory Analysis of Low-Dye Taping on Planter Force Distribution and Pain Sensitivity. Appl. Sci. 2020, 10, 540. [Google Scholar] [CrossRef]
- Rosário, J.L.P. A Review of the Utilization of Baropodometry in Postural Assessment. J. Bodyw. Mov. Ther. 2014, 18, 215–219. [Google Scholar] [CrossRef]
- Ohlendorf, D.; Kerth, K.; Osiander, W.; Holzgreve, F.; Fraeulin, L.; Ackermann, H.; Groneberg, D.A. Standard Reference Values of Weight and Maximum Pressure Distribution in Healthy Adults Aged 18-65 Years in Germany. J. Physiol. Anthropol. 2020, 39, 39. [Google Scholar] [CrossRef]
- Alves, R.; Borel, W.P.; Rossi, B.P.; Vicente, E.J.D.; Chagas, P.S.d.C.; Felício, D.C.; Alves, R.; Borel, W.P.; Rossi, B.P.; Vicente, E.J.D.; et al. Test-Retest Reliability of Baropodometry in Young Asyntomatic Individuals during Semi Static and Dynamic Analysis. Fisioter. Mov. 2018, 31. [Google Scholar] [CrossRef]
- Martínez-Jiménez, E.M.; Becerro de Bengoa-Vallejo, R.; Losa-Iglesias, M.E.; Díaz-Velázquez, J.I.; Casado-Hernández, I.; Calvo-Lobo, C.; López-López, D.; Rodríguez-Sanz, D. Sex Differences in the Footprint Analysis During the Entire Gait Cycle in a Functional Equinus Condition: Novel Cross Sectional Research. Appl. Sci. 2019, 9, 3611. [Google Scholar] [CrossRef]
- Yamamoto, T.; Hoshino, Y.; Kanzaki, N.; Nukuto, K.; Yamashita, T.; Ibaraki, K.; Nagamune, K.; Nagai, K.; Araki, D.; Matsushita, T.; et al. Plantar Pressure Sensors Indicate Women to Have a Significantly Higher Peak Pressure on the Hallux, Toes, Forefoot, and Medial of the Foot Compared to Men. J. Foot Ankle Res. 2020, 13, 40. [Google Scholar] [CrossRef]
- Zawadka, M.; Kochman, M.; Jablonski, M.; Gawda, P. Effects of External Light Load on Posture and Foot Pressure Distribution in Young Adults: A Pilot Study. Int. J. Ind. Ergon. 2021, 82, 103102. [Google Scholar] [CrossRef]
- Cen, X.; Xu, D.; Baker, J.S.; Gu, Y. Effect of Additional Body Weight on Arch Index and Dynamic Plantar Pressure Distribution during Walking and Gait Termination. PeerJ 2020, 8, e8998. [Google Scholar] [CrossRef]
- Cheng, H.-S.; Law, C.-L.; Pan, H.-F.; Hsiao, Y.-P.; Hu, J.-H.; Chuang, F.-K.; Huang, M.-H. Preliminary Results of Dancing Exercise on Postural Stability in Adolescent Females. Kaohsiung J. Med. Sci. 2011, 27, 566–572. [Google Scholar] [CrossRef]
- Baumfeld, D.; Baumfeld, T.; da Rocha, R.L.; Macedo, B.; Raduan, F.; Zambelli, R.; Alves Silva, T.A.; Nery, C. Reliability of Baropodometry on the Evaluation of Plantar Load Distribution: A Transversal Study. BioMed Res. Int. 2017, 2017, e5925137. [Google Scholar] [CrossRef]
- Gao, Z.; Mei, Q.; Xiang, L.; Baker, J.S.; Fernandez, J.; Gu, Y. Effects of Limb Dominance on the Symmetrical Distribution of Plantar Loading during Walking and Running. Proc. Inst. Mech. Eng. Part P J. Sport. Eng. Technol. 2020, 1754337120960962. [Google Scholar] [CrossRef]
- Bădău, D. Ambidextria în Activitatea Motrică; Editura Universităţii Transilvania: Brasov, Romania, 2006. [Google Scholar]
- Fattahi, A.; Zehtab Asghari, H.; Koreili, Z. A Comparative Study of Plantar Arch Index, Weight Distribution, Equilibrium Performance, and Selected Musculoskeletal Disorders in Active and Non-Active Adolescences. J. Sport Biomech. 2020, 6, 154–169. [Google Scholar] [CrossRef]
- Zhao, Y.; Zheng, D.; Yan, S.; Liu, M.; Yang, L. Children with Obesity Experience Different Age-Related Changes in Plantar Pressure Distributions: A Follow-Up Study in China. Int. J. Environ. Res. Public Health 2020, 17, 6602. [Google Scholar] [CrossRef] [PubMed]
- Feka, K.; Brusa, J.; Cannata, R.; Giustino, V.; Bianco, A.; Gjaka, M.; Iovane, A.; Palma, A.; Messina, G. Is Bodyweight Affecting Plantar Pressure Distribution in Children? An Observational Study. Medicine 2020, 99, e21968. [Google Scholar] [CrossRef] [PubMed]
- Vlad, E. Evaluarea in Actul Educational-Terapeutic. Available online: https://ro.scribd.com/document/231124750/Evaluarea-in-Actul-Educational-terapeutic (accessed on 19 July 2021).
- Belmont, L.; Birch, H.G. Lateral Dominance, Lateral Awareness, and Reading Disability. Child Dev. 1965, 36, 57–71. [Google Scholar] [CrossRef] [PubMed]
- Baropodometric Analysis—Pressure Analysis. Available online: https://www.sanitop.it/en/service/baropodometric-analysis (accessed on 12 July 2021).
- Murariu, G. Fizică Statistică și Computațională—Aspecte Contemporane si Aplicații; Galați University Press: Galati, Romania, 2018. [Google Scholar]
- Murariu, G.; Munteanu, D. Lucrări Practice de Identificare, Modelare şi Simulare a Proceselor Fizice; Galați University Press: Galati, Romania, 2018. [Google Scholar]
- Opariuc-Dan, C. Statistică Aplicată în Științele Socio-Umane: Analiza Asocierilor și a Diferențelor Statistice; Arhip-Art Sibiu: Constanța, Romania, 2011. [Google Scholar]
- Armstrong, R.A. When to Use the Bonferroni Correction. Ophthalmic Physiol. Opt. 2014, 34, 502–508. [Google Scholar] [CrossRef]
- French, A.; Macedo, M.; Poulsen, J.; Waterson, T.; Yu, A. Multivariate Analysis of Variance (MANOVA); Academia: San Francisco, CA, USA, 2008. [Google Scholar]
- Warne, R.T. A Primer on Multivariate Analysis of Variance (MANOVA) for Behavioral Scientists. Pract. Assess. Res. Eval. 2014, 19, 10. [Google Scholar]
- Sarma, K.V.S.; Vardhan, R.V. Multivariate Statistics Made Simple: A Practical Approach; CRC Press: Boca Raton, FL, USA, 2018; ISBN 978-0-429-87787-2. [Google Scholar]
- Rosner, B.; Glynn, R.J.; Lee, M.-L.T. The Wilcoxon Signed Rank Test for Paired Comparisons of Clustered Data. Biometrics 2006, 62, 185–192. [Google Scholar] [CrossRef] [PubMed]
- Mocanu, G.-D.; Iordan, D.-A.; Mocanu, M.-D.; Cojocaru, M. Nechifor Alexandru Investigation of Plantar Pressure and Plantar Imbalances in the Static phase of Karate do Athletes. Balneo PRM Res. J. 2021, 133–144. [Google Scholar] [CrossRef]
- Tasoojian, E.; Dizaji, E.; Memar, R.; Alizade, F. The Comparison of Plantar Pressure and Ground Reaction Force in Male and Female Elite Karate Practitioners. J. Paramed. Sci. Rehabil. 2016, 5, 42–54. [Google Scholar]
- Teodoru, M.D.; Petre, R.-L. The Efficient Learning OF Strikes in Relation to the Karate-Do Stances by Means of the Pedar-X Plantar Pressure Measurement System. eLearning Softw. Educ. 2013, 159–166. [Google Scholar]
- Daniel, T.M.; Răzvan-Liviu, P. Correlation between Plantar Pressure and Striking Speed in Karate-Do. Procedia Soc. Behav. Sci. 2014, 117, 357–360. [Google Scholar] [CrossRef]
- Miu, D.; Visan, D.M.; Bucur, D.; Petre, R.L. Improving the Efficiency of Martial Arts by Studying the Fighting Techniques’ Biomechanics. Int. J. Biosci. Biochem. Bioinform. 2019, 9, 10. [Google Scholar] [CrossRef]
- Zvonar, M.; Lutonska, K.; Reguli, Z.; Sebera, M.; Vespalec, T. Influence of Combative Sports on State of Plantar Pressure—Ido Movement for Culture. J. Martial Arts Anthropol. 2012, 12, 30–35. [Google Scholar]
- Zhang, Z.; Zhang, Y.; Fu, W.; Wei, Z.; Jiang, J.; Wang, L. Plantar Loads of Habitual Forefoot Strikers during Running on Different Overground Surfaces. Appl. Sci. 2020, 10, 2271. [Google Scholar] [CrossRef]
- Dizaji, E.; Memar, R.; Sadeghi, H. Comparison of Plantar Pressure Distribution in Dominant & Non-Dominant Leg of Female Kata and Kumite National Team. J. Sport Biomech. 2016, 2, 17–30. [Google Scholar]
- Pop, T.; Czarny, W.; Glista, J.; Skrzypiec, M. Wpływ Treningu Karate Tradycyjnego Na Stabilność i Symetrię Obciążenia Kończyn Dolnych. Arch. Budo 2013, 9, 39–49. [Google Scholar] [CrossRef]
- De Paula Lima, P.O.; Camelo, P.R.P.; Ferreira, V.M.L.M.; do Nascimento, P.J.S.; Bezerra, M.A.; Almeida, G.P.L.; de Oliveira, R.R. Evaluation of the Isokinetic Muscle Function, Postural Control and Plantar Pressure Distribution in Capoeira Players: A Cross-Sectional Study. Muscles Ligaments Tendons J. 2018, 7, 498–503. [Google Scholar] [CrossRef]
- Entezari, S.; Memar, R.; Kakavand, M. Effect of Taekwondo on Plantar Pressure Distribution Symmetry in Dominant and None-Dominant Limb. Res. Sport Med. Technol. 2017, 15, 17–24. [Google Scholar]
- Mao, D.W.; Li, J.X.; Hong, Y. The Duration and Plantar Pressure Distribution during One-Leg Stance in Tai Chi Exercise. Clin. Biomech. 2006, 21, 640–645. [Google Scholar] [CrossRef]
- Mao, D.W.; Li, J.X.; Hong, Y. Plantar Pressure Distribution During Tai Chi Exercise. Arch. Phys. Med. Rehabil. 2006, 87, 814–820. [Google Scholar] [CrossRef]
- Wu, G.; Hitt, J. Ground Contact Characteristics of Tai Chi Gait. Gait Posture 2005, 22, 32–39. [Google Scholar] [CrossRef]
- Pirani, H.; Azizi, M. Comparison of Peak Pressure, Maximum Force, Contact Area, and Contact Time Between the Right and Left Foot in Elite Weightlifters. J. Kermanshah Univ. Med. Sci. 2020, 24. [Google Scholar] [CrossRef]
- Takahashi, K.; Yokoyama, N.; Nakiri, F. Changes of Plantar Pressure in the Fumikiri Movement of Kendo. J. Biomech. 2006, 39, S559. [Google Scholar] [CrossRef]
- Hawrylak, A.; Brzeźna, A.; Chromik, K. Distribution of Plantar Pressure in Soccer Players. Int. J. Environ. Res. Public Health 2021, 18, 4173. [Google Scholar] [CrossRef]
- Hawrylak, A.; Gronowska, H. Plantar Pressure Distribution in Female Olympic-Style Weightlifters. Int. J. Environ. Res. Public Health 2020, 17, 2669. [Google Scholar] [CrossRef]
- Odabas, H.I.; Bulgan, C.; Bingul, B.M.; Sarpyener, K. The Evaluation of Foot Pressure and Postural Structure of National Golfers. Acta Orthop. Traumatol. Turc. 2019, 53, 150–153. [Google Scholar] [CrossRef] [PubMed]
- Memar, R.; Noori, S. Comparison of Plantar Pressure Distribution between the Right and Left Foot and Their Correlation with Height and Weight at Wrestlers. Res. Sport Med. Technol. 2016, 14, 45–57. [Google Scholar] [CrossRef]
- Martínez-Jiménez, E.M.; Losa-Iglesias, M.E.; Díaz-Velázquez, J.I.; Becerro-De-Bengoa-Vallejo, R.; Palomo-López, P.; Calvo-Lobo, C.; López-López, D.; Rodríguez-Sanz, D. Acute Effects of Intermittent Versus Continuous Bilateral Ankle Plantar Flexor Static Stretching on Postural Sway and Plantar Pressures: A Randomized Clinical Trial. J. Clin. Med. 2019, 8, 52. [Google Scholar] [CrossRef]
- Lung, C.-W.; Wu, F.-L.; Zhang, K.; Liau, B.-Y.; Townsend, R.; Jan, Y.-K. Using Elastographic Ultrasound to Assess Plantar Tissue Stiffness after Walking at Different Speeds and Durations. Appl. Sci. 2020, 10, 7498. [Google Scholar] [CrossRef]
- Kasović, M.; Štefan, L.; Zvonař, M. More Time Spent in Sedentary Behaviors Is Associated with Higher Plantar Pressures in Older Women. Int. J. Environ. Res. Public Health 2020, 17, 2089. [Google Scholar] [CrossRef] [PubMed]
- Bravo-Aguilar, M.; Gijón-Noguerón, G.; Luque-Suarez, A.; Abian-Vicen, J. The Influence of Running on Foot Posture and In-Shoe Plantar Pressures. J. Am. Podiatr. Med. Assoc. 2016, 106, 109–115. [Google Scholar] [CrossRef]
- Rohan, A.; Nyc, M.; Fugiel, J. Changes in Plantar Pressure Distribution after Long-Distance Running. New Med. 2017, 21, 58–68. [Google Scholar] [CrossRef]
- Hawrylak, A.; Matner, P.; Demidas, A.; Barczyk-Pawelec, K.; Demczuk-Wlodarczyk, E. Static and Dynamic Plantar Pressure Distribution in Amateur Marathon Runners. J. Sports Med. Phys. Fit. 2019, 59, 76–81. [Google Scholar] [CrossRef]
- Chow, T.-H.; Chen, Y.-S.; Wang, J.-C. Characteristics of Plantar Pressures and Related Pain Profiles in Elite Sprinters and Recreational Runners. J. Am. Podiatr. Med. Assoc. 2018, 108, 33–44. [Google Scholar] [CrossRef]
- Cațan, L.; Cerbu, S.; Amaricai, E.; Suciu, O.; Horhat, D.I.; Popoiu, C.M.; Adam, O.; Boia, E. Assessment of Static Plantar Pressure, Stabilometry, Vitamin D and Bone Mineral Density in Female Adolescents with Moderate Idiopathic Scoliosis. Int. J. Environ. Res. Public Health 2020, 17, 2167. [Google Scholar] [CrossRef]
- Cen, X.; Lu, Z.; Baker, J.S.; István, B.; Gu, Y. A Comparative Biomechanical Analysis during Planned and Unplanned Gait Termination in Individuals with Different Arch Stiffnesses. Appl. Sci. 2021, 11, 1871. [Google Scholar] [CrossRef]
Publisher’s Note: MDPI stays neutral with regard to jurisdictional claims in published maps and institutional affiliations. |
© 2021 by the authors. Licensee MDPI, Basel, Switzerland. This article is an open access article distributed under the terms and conditions of the Creative Commons Attribution (CC BY) license (https://creativecommons.org/licenses/by/4.0/).