
Are We Able to Match Non Sport-Specific Strength Training with Endurance Sports? A Systematic Review and Meta-Analysis to Plan the Best Training Programs for Endurance Athletes

 , ,
, ,  , ,
, , 
Abstract
:1. Introduction
2. Materials and Methods
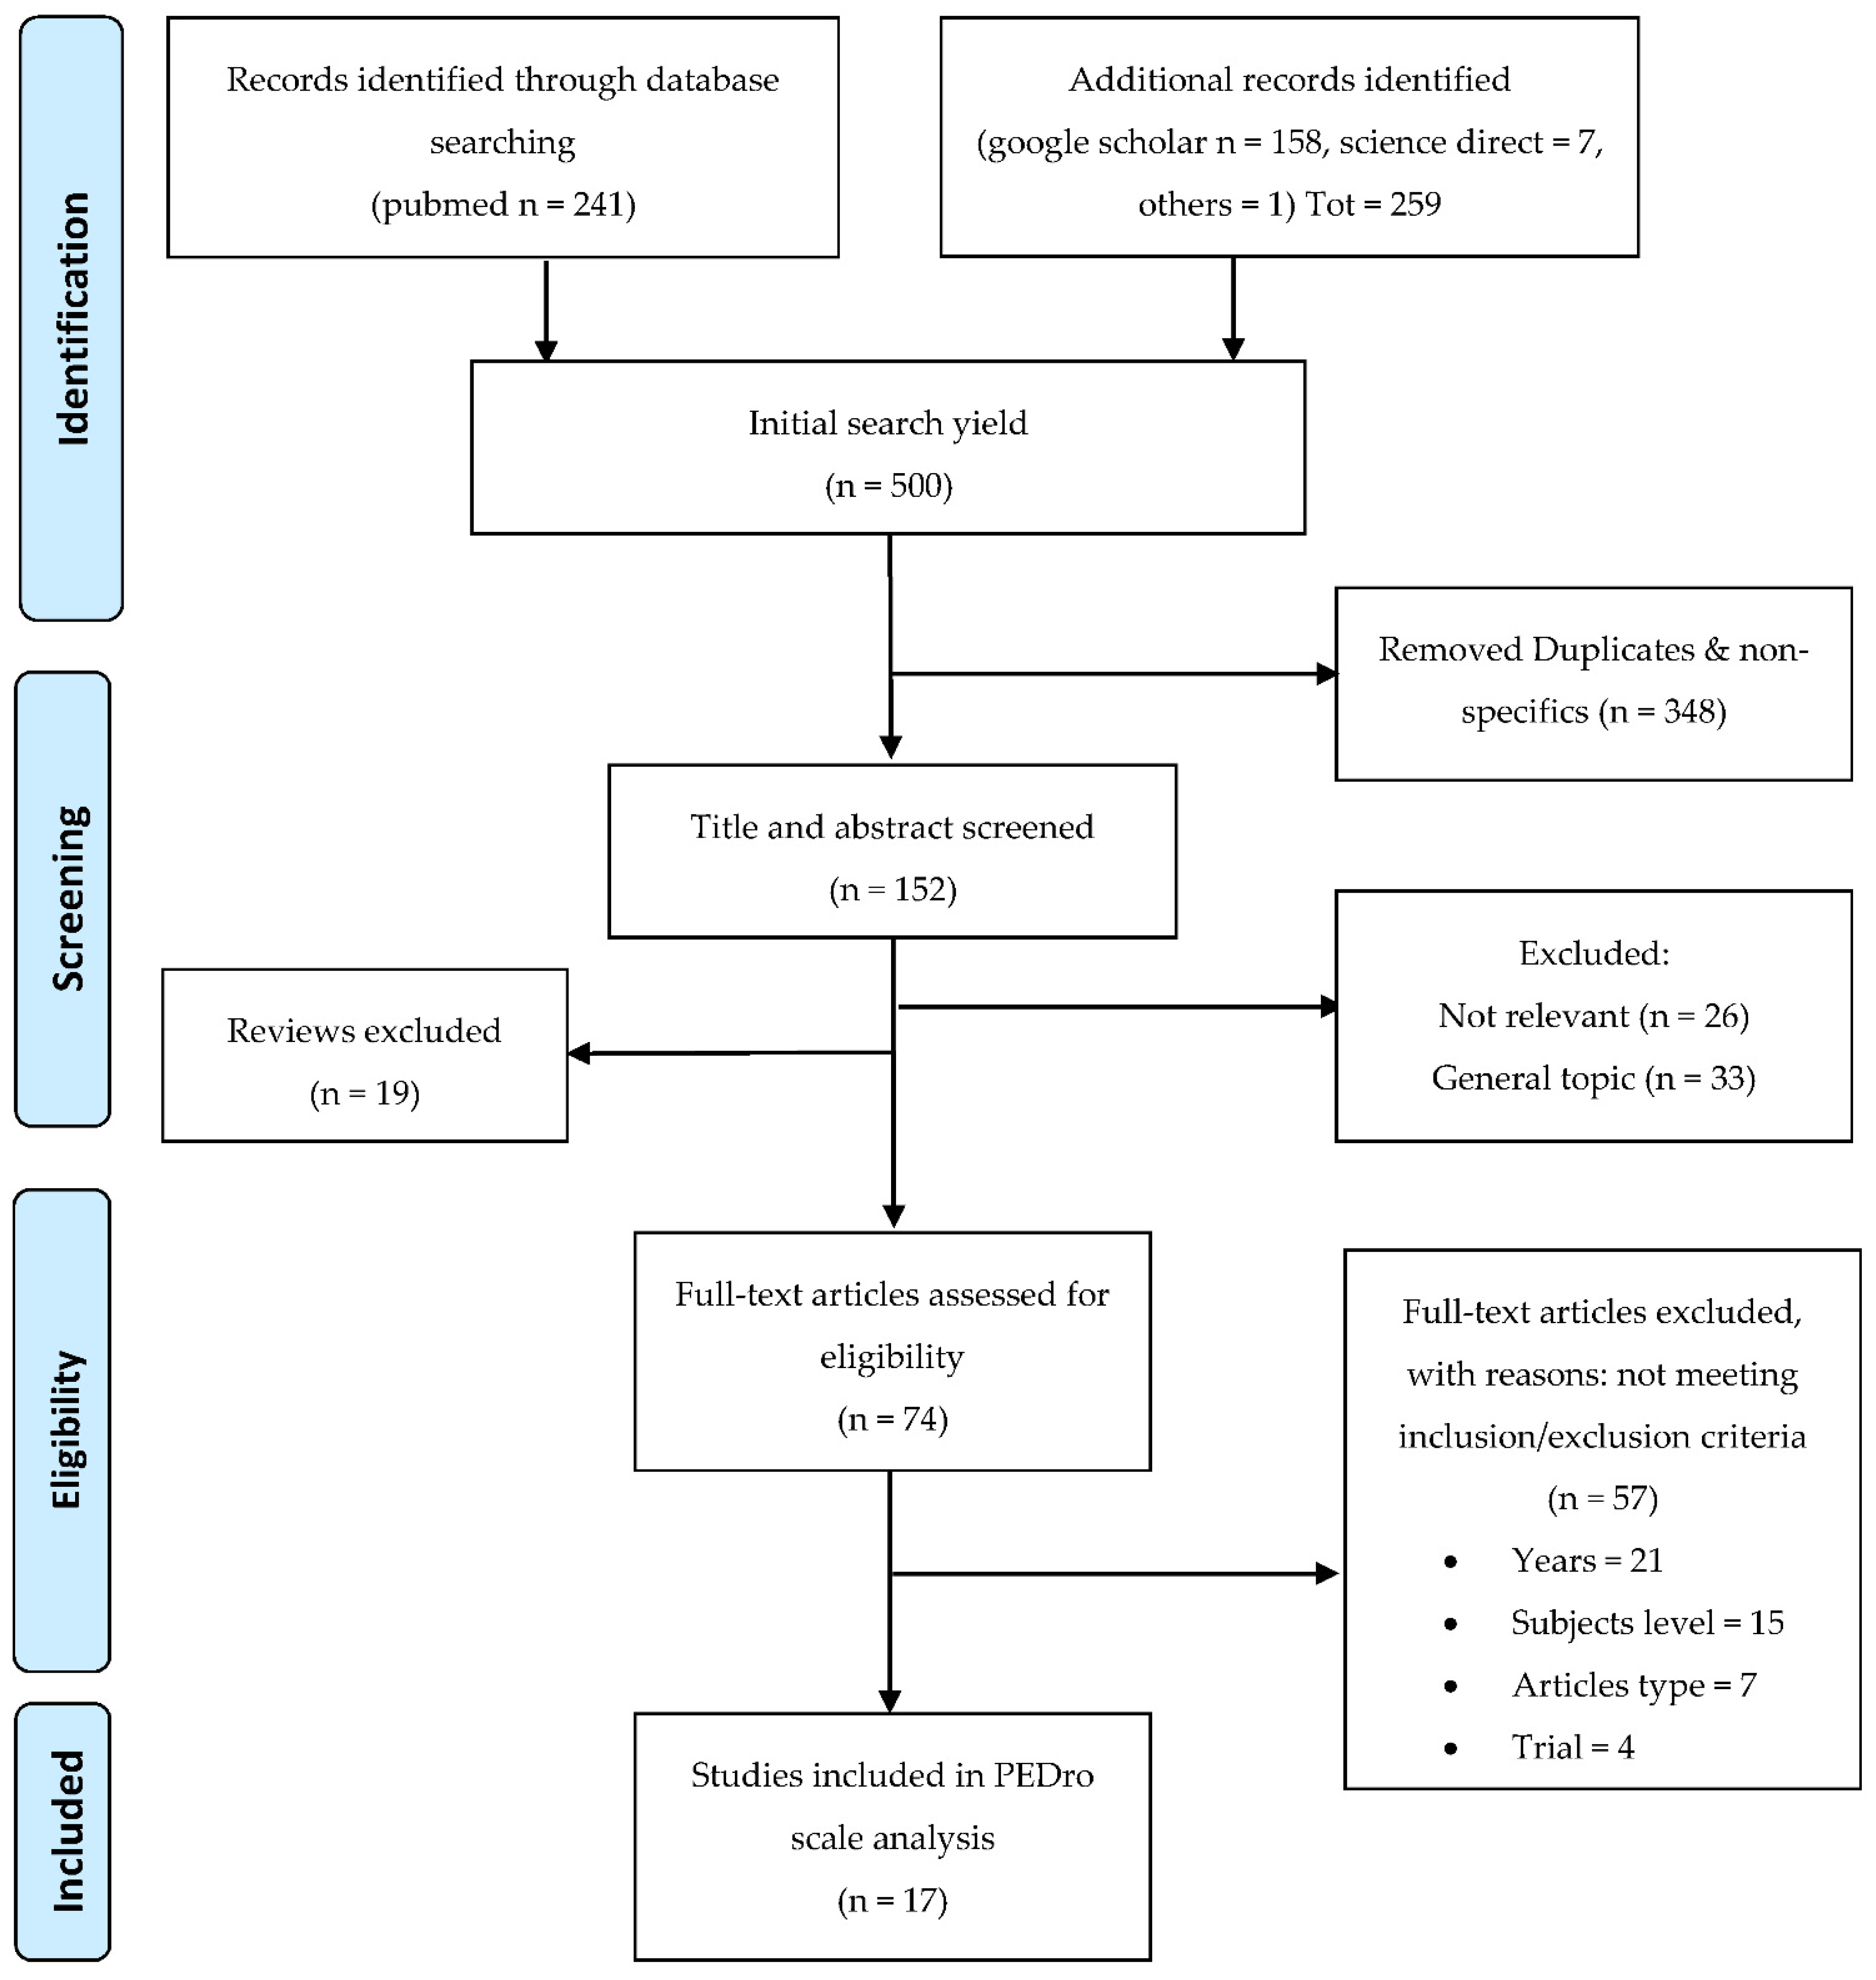
2.1. Search Strategy
2.2. Eligibility Criteria
2.3. Inclusion
- Original research papers published on international scientific journals;
- Athletes involved had a VO2max: Female > 50 mL/min/kg; Male > 55 mL/min/kg or well experience training level;
- Athletes had >6 months’ endurance training;
- Strength intervention > 4 weeks in duration;
- Presence of control group(s) (only aerobic training).
2.4. Exclusion
- Reviews and Ph.D. theses;
- Specific strength training interventions (i.e., strength exercises directly related to a specific sport activity);
- Studies evaluating only one physiological or biomechanical parameter (i.e., VO2max, Lactate, WE, time trial (TT) or time trial to exhaustion (TTE)), to exclude the accidental effects that could improve the endurance performance;
- Non-athlete subjects recruited.
2.5. Quality Assessment
2.6. Statistical Analysis
3. Results
3.1. Included Studies
3.2. Data Extraction and Outcome Measures
3.2.1. Study Characteristics
3.2.2. Study Protocols
3.2.3. Effect of NST on Sport Performance
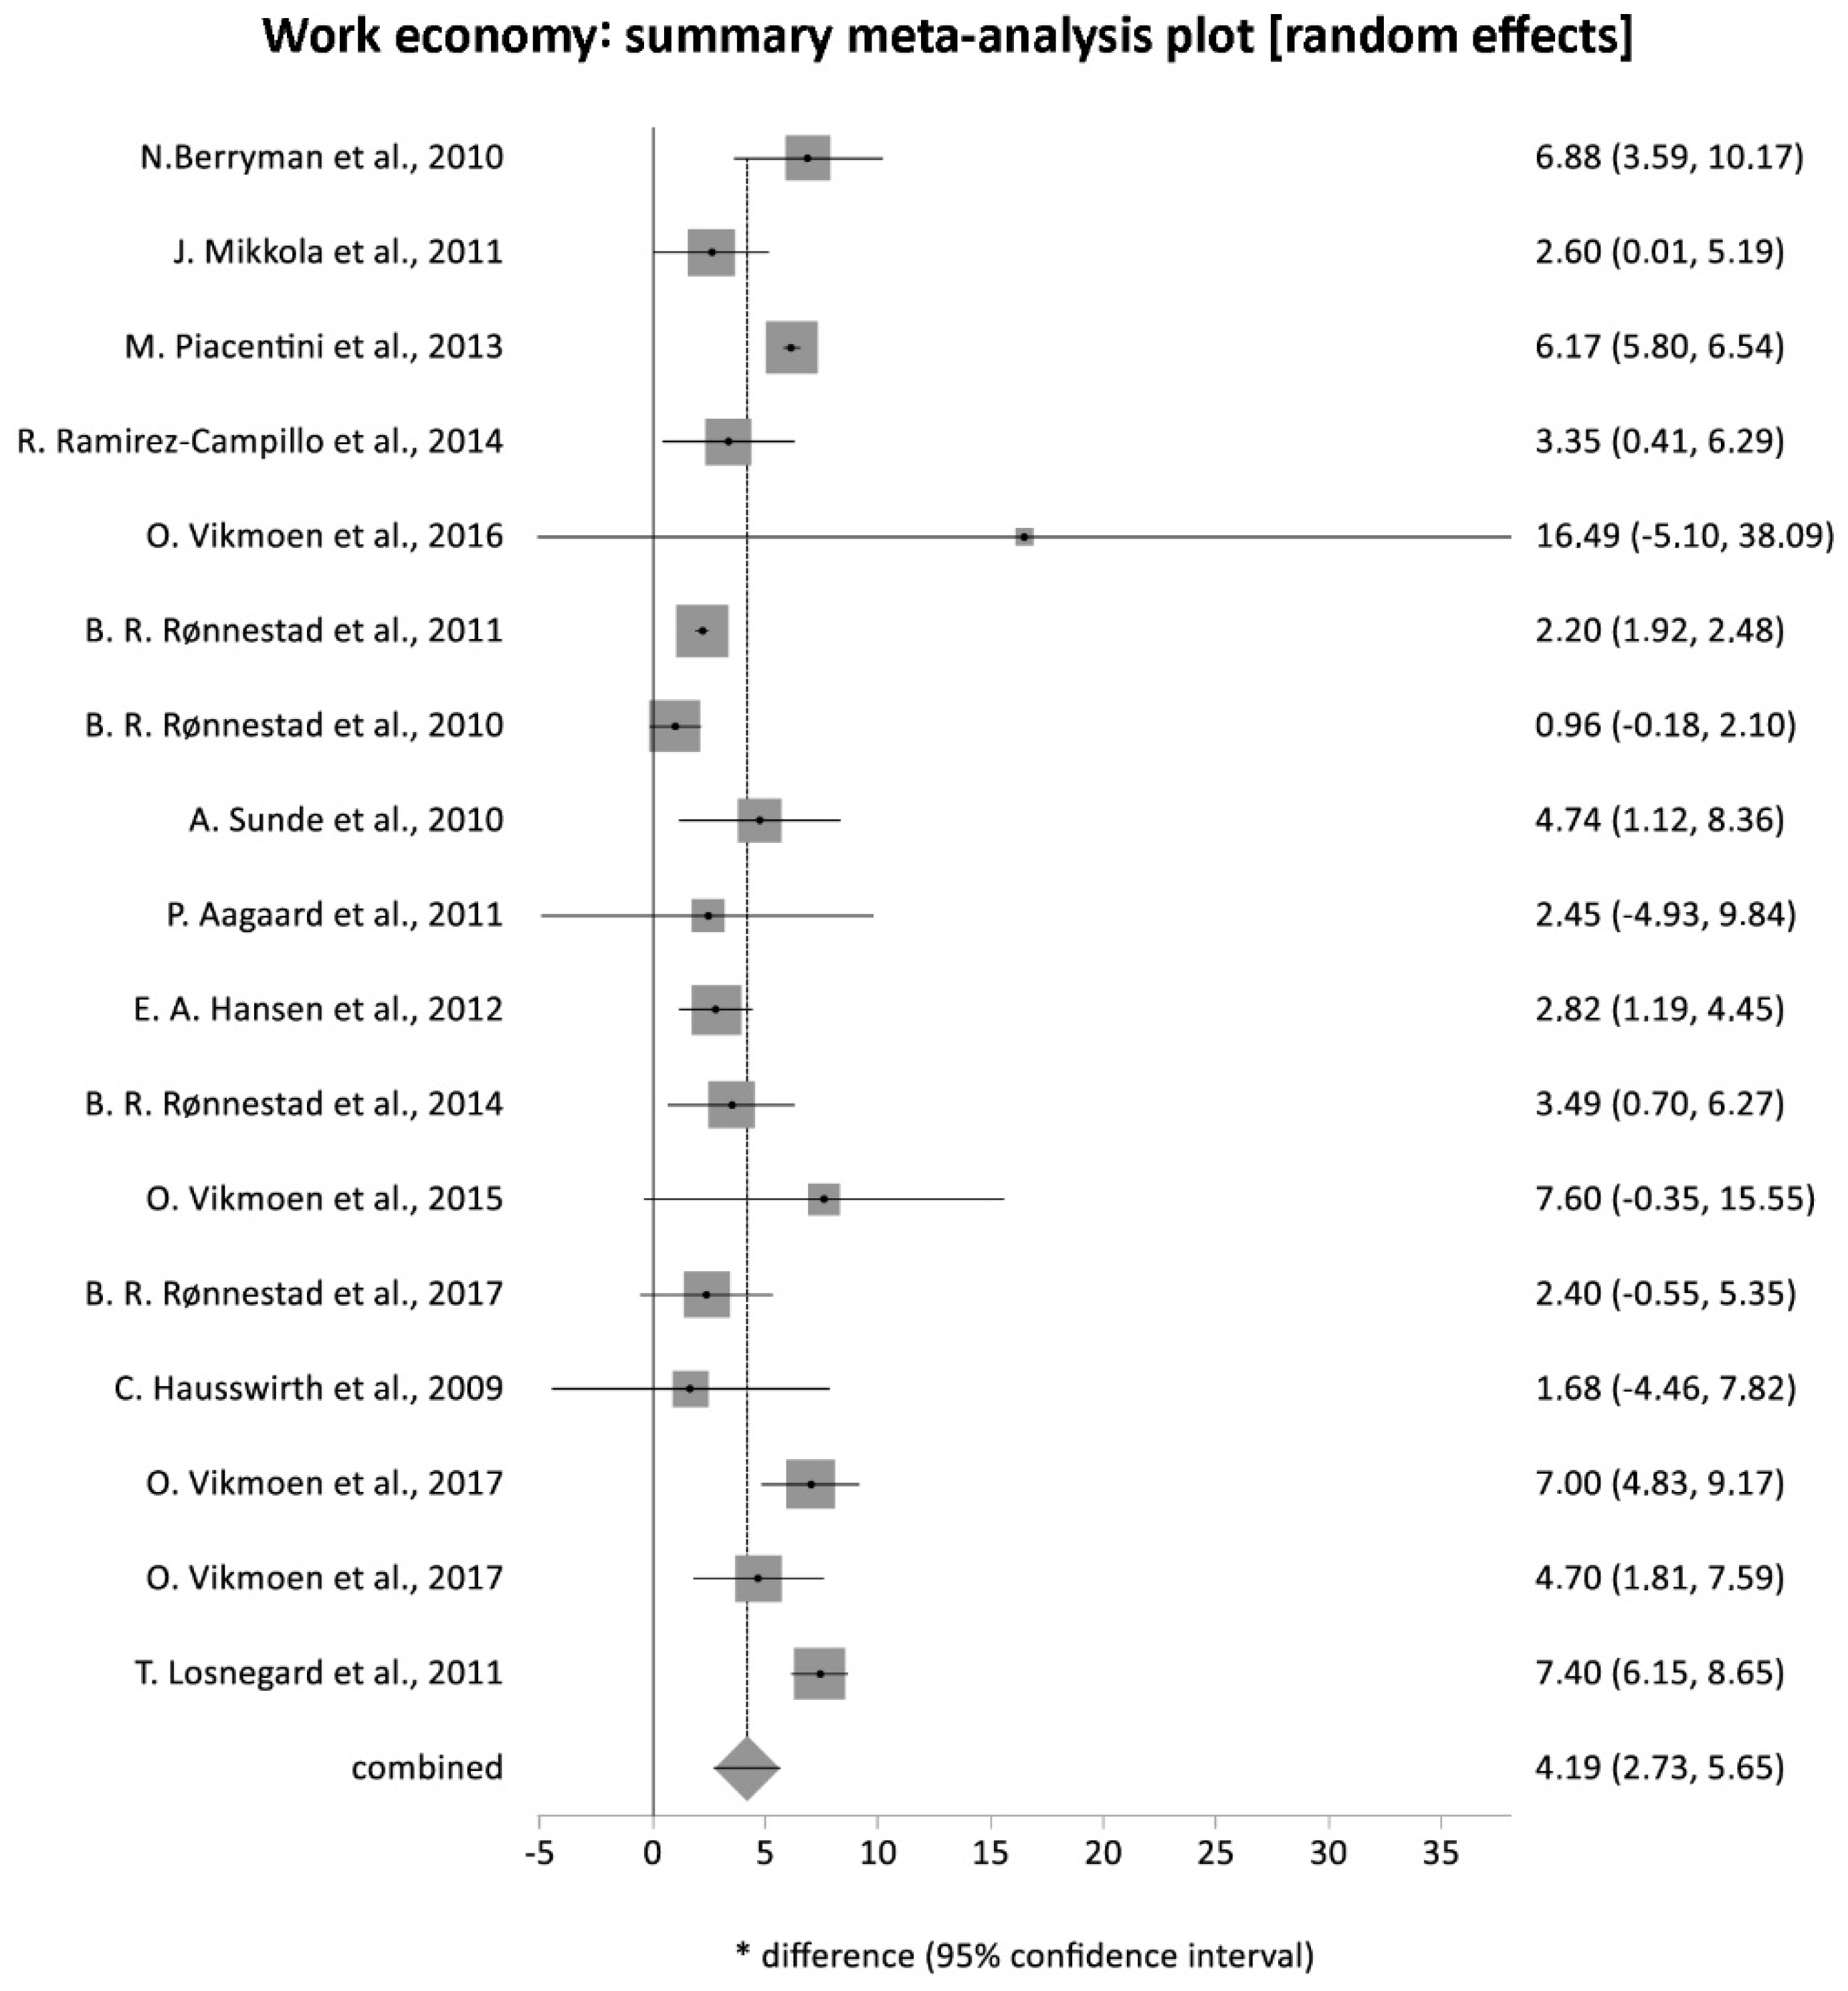
3.3. Aerobic Capacity and Work Economy
3.3.1. Maximal Strength Training (MST)
3.3.2. Explosive Strength Training (EST)
3.3.3. Plyometric Strength Training (PST)
3.3.4. Resistance Strength Training (RST)
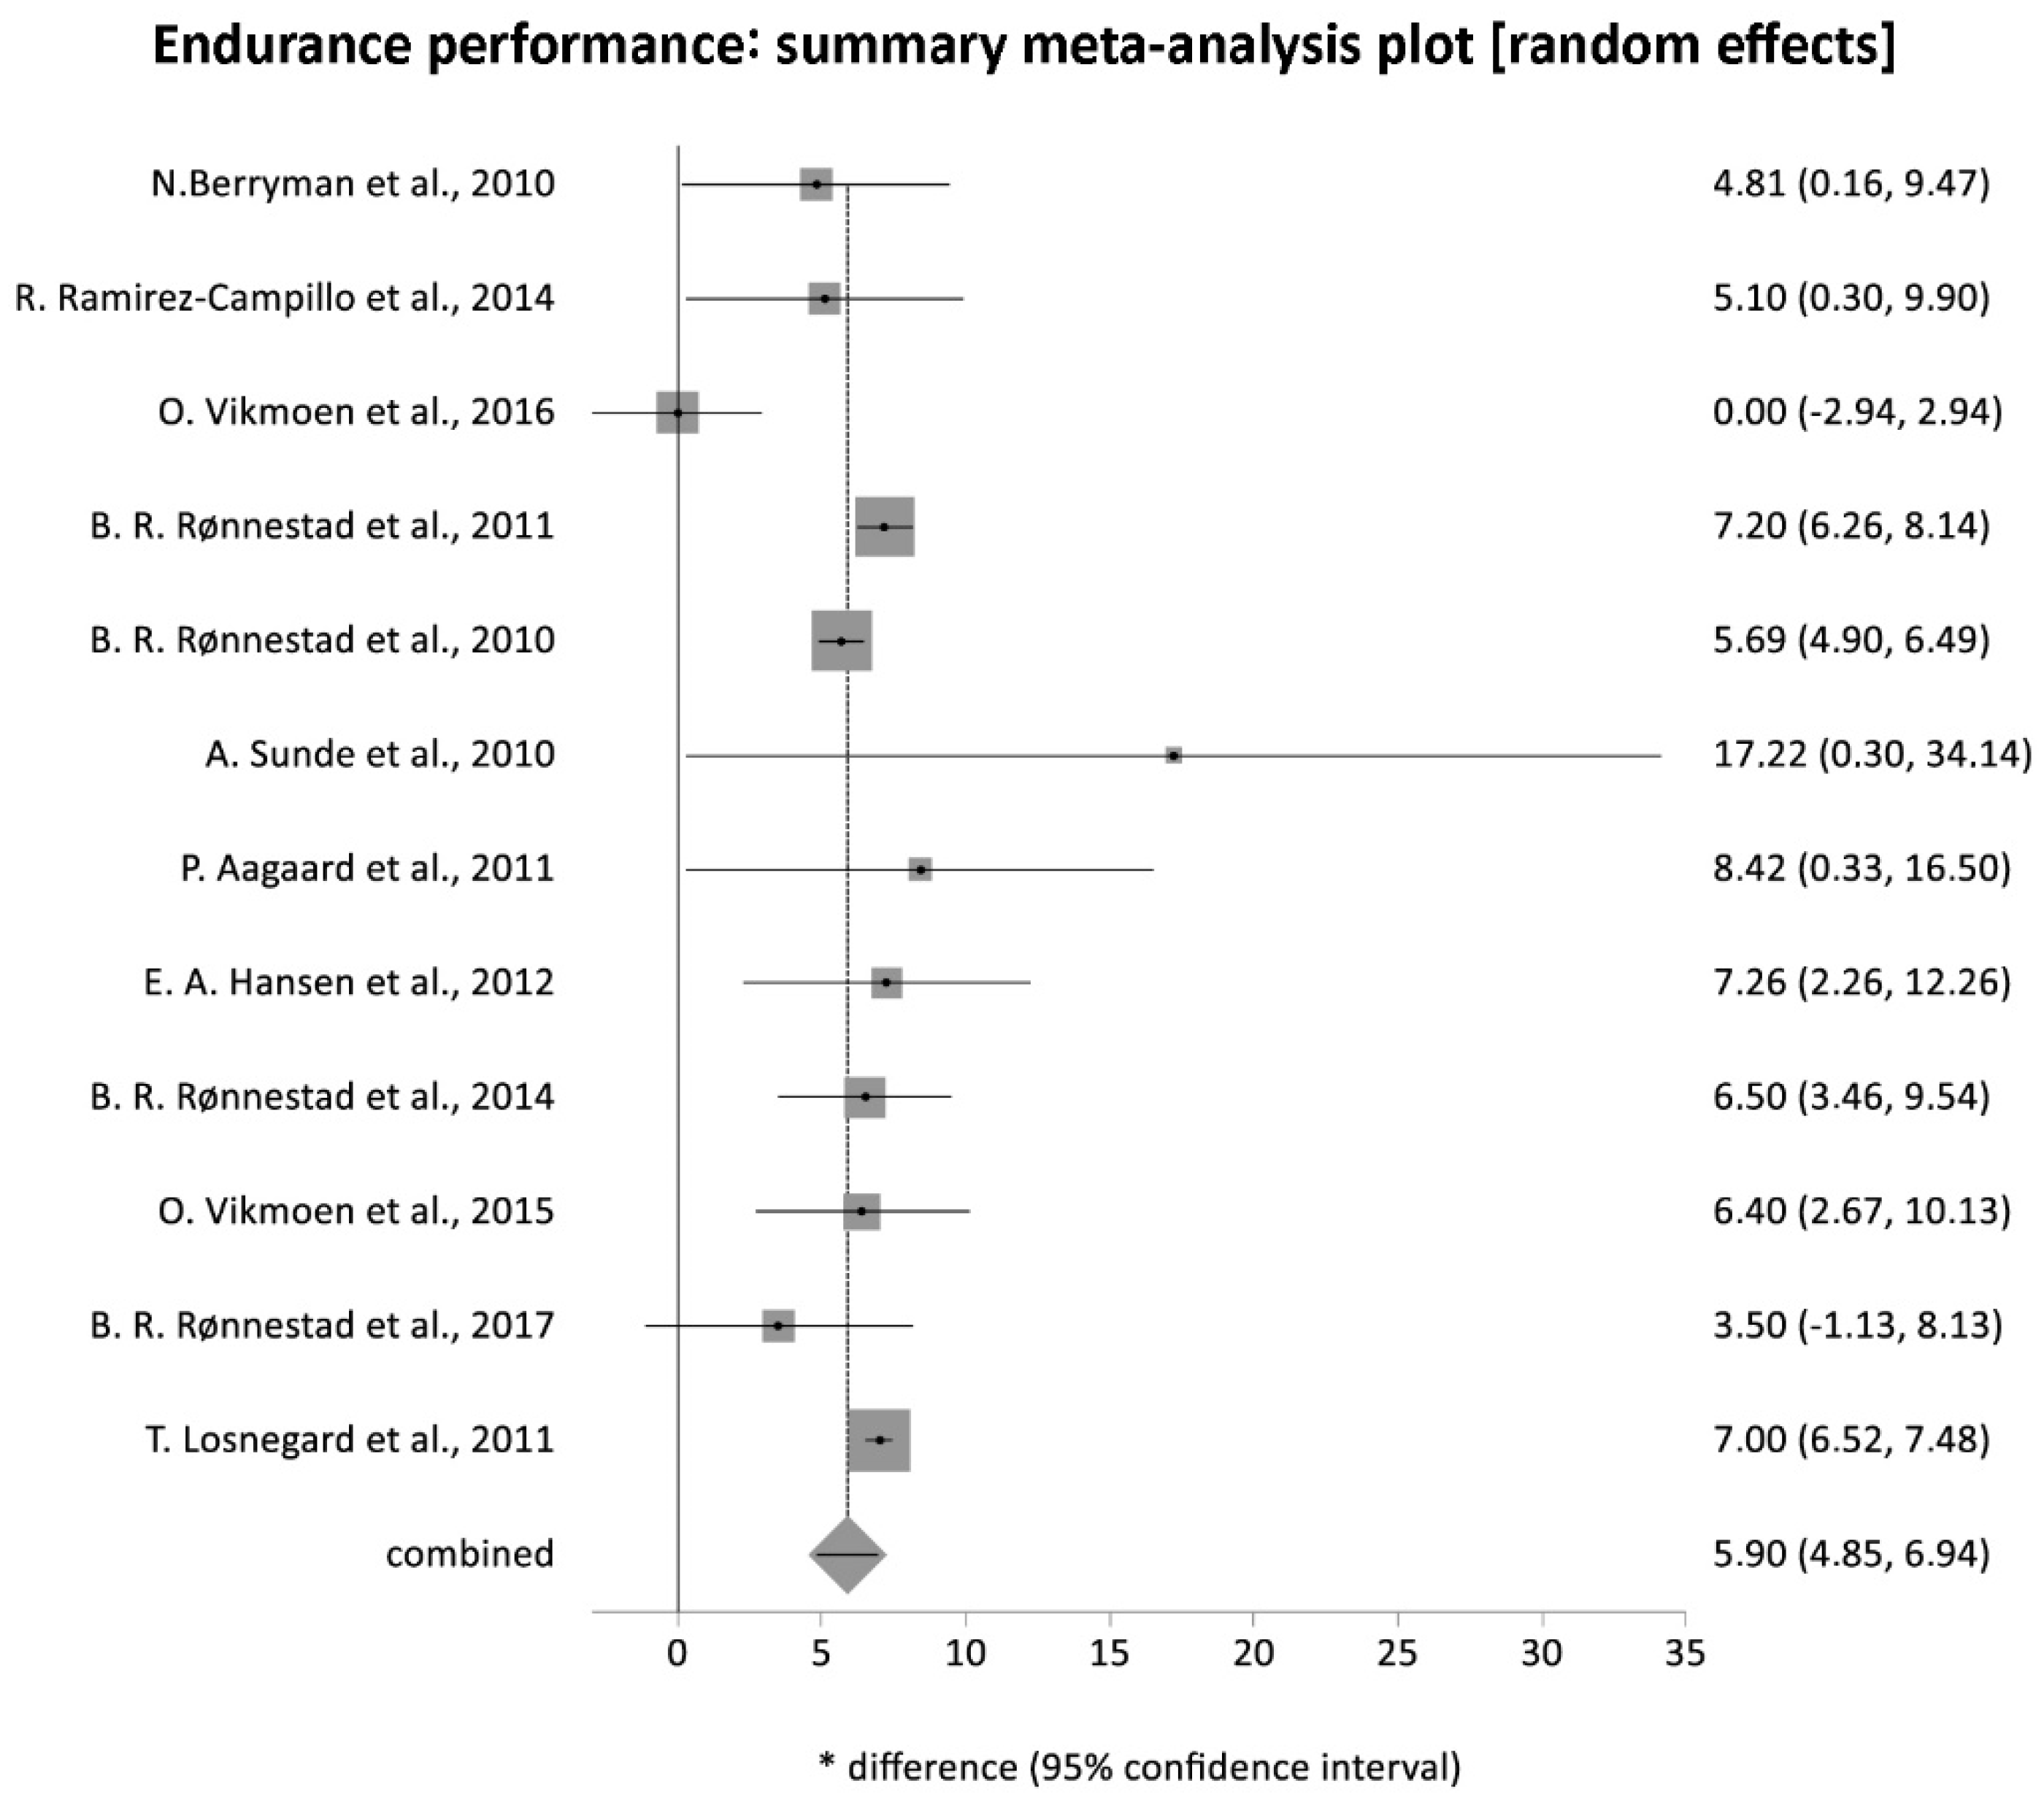
3.4. Endurance Performance Tests
4. Discussion
5. Limitations
6. Perspective
Author Contributions
Funding
Institutional Review Board Statement
Informed Consent Statement
Data Availability Statement
Conflicts of Interest
Glossary
References
- Beattie, K.; Kenny, I.C.; Lyons, M.; Carson, B.P. The effect of strength training on performance in endurance athletes. Sports Med. 2014, 44, 845–865. [Google Scholar] [CrossRef] [PubMed] [Green Version]
- Sandbakk, Ø.; Ettema, G.; Holmberg, H.C. Efficiency in cross-country skiing. A brief review. In Science in Skiing V., Meyer & Meyer Sport, Maidenhead (UK); Müller, L., Stöggl, T., Eds.; Cardinal Pub Group: Indianapolis, IN, USA, 2012; pp. 557–567. ISBN 9781841263533. [Google Scholar]
- Denadai, B.S.; de Aguiar, R.A.; de Lima, L.C.R.; Greco, C.C.; Caputo, F. Explosive Training and Heavy Weight Training are Effective for Improving Running Economy in Endurance Athletes: A Systematic Review and Meta-Analysis. Sports Med. 2017, 47, 545–554. [Google Scholar] [CrossRef]
- Hickson, R.C.; Dvorak, B.A.; Gorostiaga, E.M.; Kurowski, T.T.; Foster, C. Potential for strength and endurance training to amplify endurance performance. J. Appl. Phys. 1988, 65, 2285–2290. [Google Scholar] [CrossRef] [PubMed]
- Burnie, L.; Barratt, P.; Davids, K.; Stone, J.; Worsfold, P.; Wheat, J. Coaches’ philosophies on the transfer of strength training to elite sports performance. Int. J. Sports Sci. Coach. 2018, 13, 729–736. [Google Scholar] [CrossRef]
- Barnes, K.R.; Hopkins, W.G.; McGuigan, M.R.; Kilding, A.E. Effects of different uphill interval-training programs on running economy and performance. Int. J. Sports Physiol. Perform. 2013, 8, 639–647. [Google Scholar] [CrossRef] [PubMed]
- Silva, R.A.S.; Silva-Júnior, F.L.; Pinheiro, F.A.; Souza, P.F.M.; Boullosa, D.A.; Pires, F.O. Acute Prior Heavy Strength Exercise Bouts Improve the 20-km Cycling Time Trial Performance. J. Strength Cond. Res. 2014, 28, 2513–2520. [Google Scholar] [CrossRef] [PubMed] [Green Version]
- Murlasits, Z.; Kneffel, Z.; Thalib, L. The physiological effects of concurrent strength and endurance training sequence: A systematic review and meta-analysis. J. Sports Sci. 2018, 36, 1212–1219. [Google Scholar] [CrossRef]
- Bazyler, C.D.; Abbott, H.A.; Bellon, C.R.; Taber, C.B.; Stone, M.H. Strength Training for Endurance Athletes: Theory to Practice. Strength Cond. J. 2015, 37, 1–12. [Google Scholar] [CrossRef]
- Sammoud, S.; Negra, Y.; Chaabene, H.; Bouguezzi, R.; Moran, J.; Granacher, U. The Effects of Plyometric Jump Training on Jumping and Swimming Performances in Prepubertal Male Swimmers. J. Sports Sci. Med. 2019, 18, 805–811. [Google Scholar]
- Potdevin, F.J.; Alberty, M.E.; Chevutschi, A.; Pelayo, P.; Sidney, M.C. Effects of a 6-Week Plyometric Training Program on Performances in Pubescent Swimmers. J. Strength Cond. Res. 2011, 25, 80–86. [Google Scholar] [CrossRef]
- Keiner, M.; Wirth, K.; Fuhrmann, S.; Kunz, M.; Hartmann, H.; Haff, G.G. The Influence of Upper- and Lower-Body Maximum Strength on Swim Block Start, Turn, and Overall Swim Performance in Sprint Swimming. J. Strength Cond. Res 2019. Publish Ahead of Print. [Google Scholar] [CrossRef]
- Tanghe, K.K.; Martin, J.C. Heavy and Explosive Training Differentially Affect Modeled Cyclic Muscle Power. Med. Sci. Sports Exerc. 2020, 52, 1068–1075. [Google Scholar] [CrossRef]
- Moher, D.; Liberati, A.; Tetzlaff, J.; Altman, D.G.; PRISMA Group. Preferred reporting items for systematic reviews and meta-analyses: The PRISMA statement. BMJ 2009, 339, b2535. [Google Scholar] [CrossRef] [PubMed] [Green Version]
- Berryman, N.; Maurel, D.B.; Bosquet, L. Effect of plyometric vs. dynamic weight training on the energy cost of running. J. Strength Cond. Res. 2010, 24, 1818–1825. [Google Scholar] [CrossRef]
- Mikkola, J.; Vesterinen, V.; Taipale, R.; Capostagno, B.; Häkkinen, K.; Nummela, A. Effect of resistance training regimens on treadmill running and neuromuscular performance in recreational endurance runners. J. Sports Sci. 2011, 29, 1359–1371. [Google Scholar] [CrossRef] [PubMed]
- Piacentini, M.F.; De Ioannon, G.; Comotto, S.; Spedicato, A.; Vernillo, G.; La Torre, A. Concurrent Strength and Endurance Training Effects on Running Economy in Master Endurance Runners. J. Strength Cond. Res. 2013, 27, 2295–2303. [Google Scholar] [CrossRef] [PubMed]
- Sedano, S.; Marín, P.J.; Cuadrado, G.; Redondo, J.C. Concurrent training in elite male runners: The influence of strength versus muscular endurance training on performance outcomes. J. Strength Cond. Res. 2013, 27, 2433–2443. [Google Scholar] [CrossRef]
- Ramírez-Campillo, R.; Álvarez, C.; Henríquez-Olguín, C.; Baez, E.B.; Martínez, C.; Andrade, D.C.; Izquierdo, M. Effects of Plyometric Training on Endurance and Explosive Strength Performance in Competitive Middle- and Long-Distance Runners. J. Strength Cond. Res. 2014, 28, 97–104. [Google Scholar] [CrossRef] [PubMed] [Green Version]
- Vikmoen, O.; Raastad, T.; Seynnes, O.; Bergstrøm, K.; Ellefsen, S.; Rønnestad, B.R. Effects of Heavy Strength Training on Running Performance and Determinants of Running Performance in Female Endurance Athletes. PLoS ONE 2016, 11, e0150799. [Google Scholar] [CrossRef] [Green Version]
- Rønnestad, B.R.; Hansen, E.A.; Raastad, T. Effect of heavy strength training on thigh muscle cross-sectional area, performance determinants, and performance in well-trained cyclists. Eur. J. Appl. Physiol. 2010, 108, 965–975. [Google Scholar] [CrossRef] [Green Version]
- Sunde, A.; Støren, O.; Bjerkaas, M.; Larsen, M.H.; Hoff, J.; Helgerud, J. Maximal strength training improves cycling economy in competitive cyclists. J. Strength Cond. Res. 2010, 24, 2157–2165. [Google Scholar] [CrossRef] [PubMed] [Green Version]
- Aagaard, P.; Andersen, J.L.; Bennekou, M.; Larsson, B.; Olesen, J.L.; Crameri, R. Effects of resistance training on endurance capacity and muscle fiber composition in young top-level cyclists: Concurrent resistance and endurance training. Scand. J. Med. Sci. Sports 2011, 21, e298–e307. [Google Scholar] [CrossRef]
- Rønnestad, B.R.; Hansen, E.A.; Raastad, T. Strength training improves 5-min all-out performance following 185 min of cycling: Strength training and cycling performance. Scand. J. Med. Sci. Sports 2011, 21, 250–259. [Google Scholar] [CrossRef]
- Hansen, E.A.; Rønnestad, B.R.; Vegge, G.; Raastad, T. Cyclists’ Improvement of Pedaling Efficacy and Performance After Heavy Strength Training. Int. J. Sports Physiol. Perform. 2012, 7, 313–321. [Google Scholar] [CrossRef] [PubMed] [Green Version]
- Rønnestad, B.R.; Hansen, J.; Hollan, I.; Ellefsen, S. Strength training improves performance and pedaling characteristics in elite cyclists: Strength training in elite cyclists. Scand. J. Med. Sci. Sports 2015, 25, e89–e98. [Google Scholar] [CrossRef]
- Vikmoen, O.; Ellefsen, S.; Trøen, Ø.; Hollan, I.; Hanestadhaugen, M.; Raastad, T.; Rønnestad, B.R. Strength training improves cycling performance, fractional utilization of VO 2max and cycling economy in female cyclists: Strength training and cycling performance. Scand. J. Med. Sci. Sports 2016, 26, 384–396. [Google Scholar] [CrossRef] [PubMed] [Green Version]
- Rønnestad, B.R.; Hansen, J.; Nygaard, H. 10 weeks of heavy strength training improves performance-related measurements in elite cyclists. J. Sports Sci. 2017, 35, 1435–1441. [Google Scholar] [CrossRef] [PubMed]
- Hausswirth, C.; Argentin, S.; Bieuzen, F.; Le Meur, Y.; Couturier, A.; Brisswalter, J. Endurance and strength training effects on physiological and muscular parameters during prolonged cycling. J. Electrom. Kines. 2010, 20, 330–339. [Google Scholar] [CrossRef]
- Vikmoen, O.; Rønnestad, B.R.; Ellefsen, S.; Raastad, T. Heavy strength training improves running and cycling performance following prolonged submaximal work in well-trained female athletes. Physiol. Rep. 2017, 5, e13149. [Google Scholar] [CrossRef]
- Losnegard, T.; Mikkelsen, K.; Rønnestad, B.R.; Hallén, J.; Rud, B.; Raastad, T. The effect of heavy strength training on muscle mass and physical performance in elite cross-country skiers. Scand. J. Med. Sci. Sports 2011, 21, 389–401. [Google Scholar] [CrossRef]
- Lum, D.; Barbosa, T.M. Effects of Strength Training on Olympic Time-Based Sport Performance: A Systematic Review and Meta-Analysis of Randomized Controlled Trials. Int. J. Sports Physiol. Perform. 2019, 1–13. [Google Scholar] [CrossRef]
- Wilson, J.M.; Marin, P.J.; Rhea, M.R.; Wilson, S.M.; Loenneke, J.P.; Anderson, J.C. Concurrent training: A meta-analysis examining interference of aerobic and resistance exercises. J. Strength Cond. Res. 2012, 26, 2293–2307. [Google Scholar] [CrossRef] [PubMed]
- Damasceno, M.; Pasqua, L.; Gáspari, A.; Araujo, G.; de-Oliveira, F.; Lima-Silva, A.; Bertuzzi, R. Effects of strength training on bioenergetics parameters determined at velocity corresponding to maximal oxygen uptake in endurance runners. Sci. Sports 2018, 33, e263–e270. [Google Scholar] [CrossRef]
- Aagaard, P.; Andersen, J.L. Effects of strength training on endurance capacity in top-level endurance athletes: Strength training and endurance capacity. Scand. J. Med. Sci. Sports 2010, 20, 39–47. [Google Scholar] [CrossRef] [PubMed]
- Rønnestad, B.R.; Mujika, I. Optimizing strength training for running and cycling endurance performance: A review: Strength training and endurance performance. Scand. J. Med. Sci. Sports 2014, 24, 603–612. [Google Scholar] [CrossRef]


| PEDro Scale | Eligibility Criteria Were Specified | Subjects Were Randomly Allocated to Groups | Allocation Was Concealed | The Groups Were Similar at Baseline Regarding the Most Important Prognostic Indicators | Blinding of All Subjects | Blinding of All Therapists Who Administered the Therapy | Blinding of All Assessors Who Measured at Least 1 Key Outcome | Measures of 1 Key Outcome Were Obtained from 85% of Subjects Initially Allocated to Groups | All Subjects for Whom Outcome Measures Were Available Received the Treatment or Control Condition as Allocated or, Where This Was Not the Case, Data for at Least 1 Key Outcome Were Analysed by “Intention to Treat” | The Results of between-Group Statistical Comparisons Are Reported for at Least 1 Key Outcome | The Study Provides both Point Measures and Measures of Variability for at Least 1 Key Outcome | Total |
|---|---|---|---|---|---|---|---|---|---|---|---|---|
| N.Berryman et al., 2010 [15] | Yes | 1 | 0 | 1 | 0 | 0 | 0 | 1 | 1 | 1 | 1 | 6 |
| J. Mikkola et al., 2011 [16] | Yes | 1 | 0 | 1 | 0 | 0 | 0 | 1 | 1 | 1 | 1 | 6 |
| M. Piacentini et al., 2013 [17] | Yes | 1 | 0 | 1 | 0 | 0 | 0 | 1 | 1 | 1 | 1 | 6 |
| S. Sedano et al., 2013 [18] | Yes | 1 | 0 | 1 | 0 | 0 | 0 | 1 | 1 | 1 | 1 | 6 |
| R. Ramirez-Campillo et al., 2014 [19] | Yes | 1 | 0 | 1 | 0 | 0 | 0 | 1 | 1 | 1 | 1 | 6 |
| O. Vikmoen et al., 2016 [20] | Yes | 1 | 0 | 1 | 0 | 0 | 0 | 1 | 1 | 1 | 1 | 6 |
| B. R. Rønnestad et al., 2010 [21] | Yes | 0 | 0 | 1 | 0 | 0 | 0 | 1 | 1 | 1 | 1 | 5 |
| A. Sunde et al., 2010 [22] | Yes | 1 | 0 | 0 | 0 | 0 | 0 | 1 | 1 | 1 | 1 | 5 |
| P. Aagaard et al., 2010 [23] | Yes | 1 | 0 | 1 | 0 | 0 | 0 | 1 | 1 | 1 | 1 | 6 |
| B. R. Rønnestad et al., 2011 [24] | Yes | 1 | 0 | 0 | 0 | 0 | 0 | 1 | 1 | 1 | 1 | 5 |
| E. A. Hansen et al., 2012 [25] | Yes | 1 | 0 | 0 | 0 | 0 | 0 | 1 | 1 | 1 | 1 | 5 |
| B. R. Rønnestad et al., 2014 [26] | Yes | 1 | 0 | 1 | 0 | 0 | 0 | 1 | 1 | 1 | 1 | 6 |
| O. Vikmoen et al., 2015 [27] | Yes | 1 | 0 | 1 | 0 | 0 | 0 | 1 | 1 | 1 | 1 | 6 |
| B. R. Rønnestad et al., 2017 [28] | Yes | 1 | 0 | 1 | 0 | 0 | 0 | 1 | 1 | 1 | 1 | 6 |
| C. Hausswirth et al., 2009 [29] | Yes | 1 | 0 | 1 | 0 | 0 | 0 | 1 | 1 | 1 | 1 | 6 |
| O. Vikmoen et al., 2017 [30] | Yes | 1 | 0 | 1 | 0 | 0 | 0 | 1 | 1 | 1 | 1 | 6 |
| T. Losnegard et al., 2011 [31] | Yes | 0 | 0 | 1 | 0 | 0 | 0 | 1 | 1 | 1 | 1 | 5 |
| Study | Athletes | Research Design | Quality Assessment | ||||||||
|---|---|---|---|---|---|---|---|---|---|---|---|
| Authors | Purpose | N° | Gender | Age Mean | Vo2max Mean | Experience | Endurance Training | Subjects Assignment | Intervention Group(s) (n°) | Control Group (n°) | PEDro SCALE |
| Running | |||||||||||
| N. Berryman et al., 2010 [15] | To compare the effects of 2 strength training methods on the energy cost of running (Cr). | 28 | M | 28 | 56.9 | Well trained | Yes | RCT | 11 Reactive 12 Explosive | 5 | 6 |
| J. Mikkola et al., 2011 [16] | To assess the effects of heavy resistance, explosive resistance, and muscle endurance training on neuromuscular, endurance, and high-intensity running performance. | 27 | M | 35.5 | n.d. | Well trained | n.d. | Matched | 10 Heavy 11 Explosive | 6 | 6 |
| M. Piacentini et al., 2013 [17] | To evaluate the effects of 2 different strength training protocols on RE and strength parameters. | 16 | 12 M 4 F | 44.05 | n.d. | Master | Yes | RCT | 6 Maximal 5 Resistance | 5 | 6 |
| S. Sedano et al., 2013 [18] | To determine which mode of concurrent strength-endurance training might be the most effective at improving running performance in highly trained runners. | 18 | M | 23.7 | >65 | Well trained | Yes, HR Zones (1) 75/85%, (2) 85/95%, (3) 95/100% | RCT | 6 Resistance + Plyometric 6 Strength <40% | 6 | 6 |
| R. Ramirez-Campillo et al., 2014 [19] | To examine the effect of a short-term plyometric training program on explosive strength and endurance performance in highly competitive middle- and long-distance runners. | 36 | 22 M 14 F | 22.1 | n.d. | National + International | n.d. | RCT | 18 | 18 | 6 |
| O. Vikmoen et al., 2016 [20] | To investigate the effects of adding strength training to normal endurance training on running performance and running economy in well-trained female athletes. | 19 | F | n.d. | 53 | 5.8 h × week | Yes, HR Zones (1) 60/82%, (2) 83/87%, (3) 88/100% | RCT | 11 | 8 | 6 |
| Cycling | |||||||||||
| B. R. Rønnestad et al., 2010 [21] | To investigate the effect of heavy strength training on thigh muscle cross-sectional area (CSA), determinants of cycling performance, and cycling performance in well-trained cyclists. | 20 | 18 M 2 F | 28.5 | 66.35 | National | Yes, HR Zones (1) 60/72% (2) 73/82%, (3) 83/87%, (4) 88/92%, (5) 93/100% (5) 93/100% | Self-Ch. | 11 | 9 | 5 |
| A. Sunde et al., 2010 [22] | To investigate the effect of maximal strength training on CE. | 13 | 10 M 3 F | 32.85 | 61.05 | Well trained | Yes | Matched | 8 | 5 | 5 |
| P. Aagaard et al., 2011 [23] | To examine the effect of concurrent strength and endurance training (SE) on muscle morphology and long/short-term endurance performance. | 14 | M | 19.5 | 72.5 | National + International | Yes | RCT | 7 | 7 | 6 |
| B. R. Rønnestad et al., 2011 [24] | To investigate how adding heavy strength training to usual endurance training for 12 weeks affects the mean power output during a 5-min all-out trial performed following 185 min of submaximal cycling. | 20 | 18 M 2 F | 28.5 | 66.35 | Well Trained | Yes, HR Zones (1) 60/72% (2) 73/82%, (3) 83/87%, (4) 88/92%, (5) 93/100% | Self-Ch. | 11 | 9 | 5 |
| E. A. Hansen et al., 2012 [25] | To investigate whether enhanced cycling performance after strength training was accompanied by an improved pattern of crank-torque application, reflecting improved pedalling efficacy. | 18 | 16 M 2 F | 28.5 | 52.4 | National | Yes, HR Zones (1) 60/72% (2) 73/82%, (3) 83/87%, (4) 88/92%, (5) 93/100% | Matched | 10 | 8 | 5 |
| B. R. Rønnestad et al., 2014 [26] | To investigate the hypothesis that a 10-week strength development period would increase lower body muscle strength, and that this adaptation would be maintained by a subsequent 15-week. | 16 | M | 19.6 | 76.15 | National + International | Yes, HR Zones (1) 60–72% (2) 73–87% (3) 88–100% | RCT | 9 | 7 | 6 |
| O. Vikmoen et al., 2015 [27] | To investigate the effects of 11 weeks of heavy strength training on 40-min all-out performance in trained female cyclist. | 19 | F | 33.2 | 54.05 | Well trained | Yes, HR Zones 1) 60–72%, (2) 73–87%, (3) 88-100% | Matched | 11 | 8 | 6 |
| B. R. Rønnestad et al., 2017 [28] | To investigate the effect of 10-week heavy strength training on lean lower-body mass, leg strength, determinants of cycling performance and cycling performance in elite cyclists. | 20 | 16 M 4 F | 19.5 | 72–80 63–65 | National + International | Yes, HR Zones (1) 60–82%, (2) 83–87%, (3) 88–100% | RCT | 12 | 8 | 6 |
| Triathlon | |||||||||||
| C. Hausswirth et al., 2009 [29] | This study investigated the effects of a combined endurance and strength training on the physiological and neuromuscular parameters during a 2-h cycling test. | 14 | M | 31.3 | 69.2 | 17.3 h × week | Yes | RCT | 7 | 7 | 6 |
| O. Vikmoen et al., 2017 [30] | Investigate the effects of 11 weeks of heavy strength training on 5-min all-out performance after separate trials of prolonged submaximal work in both running and cycling and on physiological responses during the prolonged work. | 19 | F | n.d. | 54 Bike 53 Run | Duathletes | Yes, HR Zones (1) 60–82%, (2) 83–87%, (3) 88–100% | RCT | 11 | 8 | 6 |
| Cross Country Skiing | |||||||||||
| T. Losnegard et al., 2011 [31] | The aims of this study were to examine the effect of supplementing high-volume endurance training with strength training | 19 | 11 M 8 F | 21.5 | 64.7 | International | n.d. | Self-Ch. | 9 | 10 | 5 |
| Authors | Type of Strength Training | Type of Exercises | Volume (Sets and Repetitions) | Frequency | Time | Periodization | |
|---|---|---|---|---|---|---|---|
| Running | |||||||
| N. Berryman et al., 2010 [15] | Plyometric Explosive | Drop Jump Squat Jump | 3 sets × 8 reps 6 sets × 8 reps | 1 × w | 8 w | n.d. | |
| J. Mikkola et al., 2011 [16] | Explosive Maximal | Squat Smith Machine, Leg Press, Calf, Core ex., Bench Press, Pull Down | 3 sets × 6 reps + 2 sets × 5 reps—1st to 4th w 3 sets × 6 reps + 3 sets × 5 reps + 2 sets × 5 reps rest 2/3 min—5th to 8th w 3 sets × 4 reps rest 2/3 min | 2 × w | 8 w | Pre-season | |
| M. Piacentini et al., 2013 [17] | Maximal Resistance | Half Squat and Lunges with arm weights, Calf raises (Leg Press), Eccentric Quad., Leg Press (MST and RST), Bench Press, Lat Machine, Pulldown Machine, Cable machine, Triceps extension, Dumbbell biceps curl, (MST and RST) Seated Calf raises (RST); Core strength, Push up (RST) | 4 sets × 3/4 reps 85/90% 1RM rest 3/4 min 5 sets × 10 reps 70% 1RM rest 2/3 min | 2 × w | 6 w | Pre-season | |
| S. Sedano et al., 2013 [18] | Resistance/Plyometric Endurance <40%1RM | Barbell Squat + Vertical Jump (40cm), Lying Leg Curl + Horizontal Jumps, Seated Calf raises + Vertical Jump, Leg Extension + Horizontal Jump Barbell Squat, Lying Leg curl, Seated Calf raises, Leg Extension | 3 sets × 7 reps 70% 1RM + 10 reps rest 5 min 3 sets × 20 reps 40% 1RM rest 1 min | 2 × w | 12 w | Pre-season | |
| R. Ramirez-Campillo et al., 2014 [19] | Plyometric | Drop box Jump | 60 reps (2 sets × 10 reps of 20 cm, 2 sets × 10 reps of 40 cm, 2 sets × 10 reps of 60 cm) | 2 × w | 6 w | n.d. | |
| O. Vikmoen et al., 2016 [20] | Maximal | Half Squat Smith Machine, 1 Leg press, 1 Leg Hip flexion, calf smith machine | 3 sets × exercises | 10/6 RM—1st to 3rd w 8/5 RM—4th to 6th w 6/4 RM—7th to 12th w | 2 × w | 11 w | In season |
| Cycling | |||||||
| B. R. Rønnestad et al., 2010 [21] | Maximal | Half Squat, 1 Leg press, 1 Leg Hip flexion, Ankle plantar flexion | 3 sets × exercises | 10/6 RM—1st to 3rd w 8/5 RM—4th to 6th w 6/4 RM—7th to 12th w | 2 × w | 12 w | Pre-season |
| A. Sunde et al., 2010 [22] | Maximal | Half Squat Smith Machine | 4 sets × 4 reps | 3 × w | 8 w | Pre-season | |
| P. Aagaard et al., 2011 [23] | Maximal | Leg Extension, Leg Press, Leg Curl, Calf raises | 3sets × 12 reps—1st week 3 sets × 10 reps—2/3th weeks 3 sets × 8 reps—4/5th weeks 2/3sets × 6 reps—6th to 16th weeks | 2/3 × w | 16 w | / | |
| B. R. Rønnestad et al., 2011 [24] | Maximal | Half Squat, 1 Leg press, 1 Leg Hip flexion, Ankle plantar flexion | 3 sets × exercises | 10/6 RM—1st to 3rd w 8/5 RM—4th to 6th w 6/4 RM—7th to 12th w | 2 × w | 12 w | Pre-season |
| E. A. Hansen et al., 2012 [25] | Maximal | Half Squat, 1 Leg press, 1 Leg Hip flexion, Ankle plantar flexion | 3 sets × exercises | 10/6 RM—1st to 3rd w 8/5 RM—4th to 6th w 6/4 RM—7th to 12th w | 2 × w | 12 w | Pre-season |
| B. R. Rønnestad et al., 2014 [26] | Maximal | Half Squat, 1 Leg Press, 1 Leg Deadlift, Calf raises | Pre-season 3 sets × (10—6—6 reps)—1/2/3rd w 3 sets (8—5—5 reps)—4/5/6th w 3 sets (6—4—4 reps)—7/8/9/10th w | In season 3 sets × 5 Reps (8/10 RM)—11th to 25th w | 2 × w pre-season 1 × w in season | 25 w | Pre-season 10 w In season 15 w |
| O. Vikmoen et al., 2015 [27] | Maximal | Half Squat, 1 Leg Press, 1 Leg Hip Flexion, Ankle plantar flexion | 3 sets × exercises | 10/6RM—1st to 3rd w 8/5RM—4th to 6th w 6/4RM—7th to 12th w | 2 × w | 11 w | Pre-season |
| B. R. Rønnestad et al., 2017 [28] | Maximal | Half Squat, 1 Leg Press, 1 Leg Hip Flexion, Ankle plantar flexion | 3 sets × exercises | 10/6RM—1st to 3rd w 8/5RM—4th to 6th w 6/4RM—7th to 12th w | 2 × w | 10 w (20 sessions) | Off-season |
| Triathlon | |||||||
| C. Hausswirth et al., 2009 [29] | Maximal | Leg curl, Leg press, Leg Extension, Calf raises | 3/5 sets × 3/5 reps | 3 × w | 5 w | Pre-season | |
| O. Vikmoen et al., 2017 [30] | Maximal | Half Squat Smith Machine, 1 Leg Press, 1 Leg Deadlift, Calf raises | 3sets (10—6—6 reps)—1st to 3rd w 3 sets (8—5—5 reps)—4th to 6th w 3 sets (6—4—4 reps)—7th to 11th w | 2 × w | 11 w | In season | |
| Cross Country Skiing | |||||||
| T. Losnegard et al., 2011 [31] | Maximal | Half Squat, Seated pull-down, standing pull down and Triceps press | 1st day 3 sets × 6 reps/ 2nd day 3 sets × 10 reps—1st to 3rd w 1st day 3 sets × 5 reps/ 2nd day 3 sets × 8 reps—4th w 1st day 4 sets × 8 reps—5th to 8th w 1st day 3 sets × 4 reps/ 2nd day 3 sets × 6 reps—9th to 12th w | 2 × w (45′) | 12 w | Pre-season | |
| Authors | Tests | VO2max/Peak | MAS | Strength | Power Output (Po) | WE | Time Trial (TT) | Time Trial Exhaustion (TTE) | Other Targets (Body Composition, Body Mass, Muscle Fibers, CSA) |
|---|---|---|---|---|---|---|---|---|---|
| Running | |||||||||
| N. Berryman et al., 2010 [15] | VO2max, MAV, RE, PP, TT 3 km | = | n.d. | n.d. | ↑ PP ** EST | ↑ RE: +7% PST +4% ** EST | ↑↑ TT 3 km: * EST +4% PST +5% Control +3% | n.d. | = |
| J. Mikkola et al., 2011 [16] | Body mass, Jump test, 1 RM, EMG, MART, VO2max, LT, Endurance test | = | ↑ MART: +2.6 ± 2.7% * MST | ↑ 1 RM Leg Press: +3.6% r MST * EST ** ↑ r EMG activation: +16.2% * MST +9% ** EST ↑ Jump test: +6.1% ** MST | n.d. | ↑ Speed at 7 mmol/L LT: +2.6 ± 2.5% * MST | n.d. | n.d. | n.d. |
| M. Piacentini et al., 2013 [17] | 1RM, SJ, CMJ, Stiffness, RPE, VO2, RE, Anthropometric | n.d. | n.d. | ↑ 1 RM: +17% * MST ↑ Stiffness: +13% * RST | n.d. | ↑ RE: (marathon pace) +6.17% * MST | n.d. | n.d. | = |
| S. Sedano et al., 2013 [18] | CMJ, Hopping test, 1RM, RE, VO2max, HRmax, Peak, RPE, TT 3 km | = | n.d. | ↑ CMJ: +9.1% *** ↑ Hopping test: +3.7% *** PST | ↑ Peak Velocity: +4.4% *** MST | ↑ RE: VO2 16 km/h * PST | ↑↑ TT 3 km PST ** | n.d. | ↓ RPE: MST *** |
| R. Ramirez-Campillo et al., 2014 [19] | CMJ, DJ, 20 m sprint, TT 2.4 km | n.d. | n.d. | ↑ CMJ: +8.9% ↑ DJ 20 cm: +12.7% r ↑ DJ 40 cm: (r = −0.82) +16.7% *** | n.d. | ↑↑ r 20 m sprint test: +2.3% ** | r ↑↑ TT 2.4 km: +3.9% ** ↑↑ r 20 m sprint test: +2.3% ** | n.d. | ↑ BMI: ** |
| O. Vikmoen et al., 2016 [20] | Muscle sample, 1RM one leg press and half squat, VO2max, SJ, CMJ, TT 40′ all out | = | n.d. | ↑ 1RM 40%: ** SJ and CMJ: +8.9% and +5.9% * | n.d. | = | = | n.d. | ↑ CSA: vastus lateralis ** |
| Cycling | |||||||||
| B. R. Rønnestad et al., 2010 [21] | Thigh muscle CSA, Isometric (ISO) Half Squat, Cycling incremental test, Wingate Test, TT 40′ all out | = | n.d. | ↑ ISO Half squat: +21.2 ± 4.9% ** | ↑ W max: +4.3 ± 1.1% * ↑ Wmax at 2mmol/L: +3.6% * ↑ r Wingate test: +9.4 ± 2.9%** | = | ↑↑ TT 40-min all out trial: +6.0 ± 1.7% ** | n.d. | ↑ rr Lean Body mass: +1 ± 0.5% ** ↑ r Thigh muscle knee extensors CSA: +4.6 ± 0.5% ** (r = 0.47) |
| A. Sunde et al., 2010 [22] | 1RM Squat Smith Machine, RFD, WE 70% VO2max, TTE, VO2max, LT | = | n.d. | ↑ 1RM squat: +14.2% ↑ r RFD squat: +16.2% * | ↑ Pm at VO2max 70%: +6.9% * | ↑ r WE: (70%VO2max) +4.7% (r = 0.58) * | n.d. | ↑ r TTE: +17.2% (r = 0.64) * | = |
| P. Aagaard et al., 2011 [23] | MCV Leg Extension Isometric, RFD, TT 45 min | = | n.d. | ↑ MCV Isom: +12% * ↑ RFD: +20% ** | n.d. | = | ↑↑ TT 45 min: +8% * | n.d. | ↑ Type IIA fibers 26–34% * ↓ Type IIX 0.5–0.6% * |
| B. R. Rønnestad et al., 2011 [24] | 1RM Half Squat, Cycling incremental test, TT 5 min all out trial after 185 min at 44% of Wmax, RPE | ↓ VO2max during 185 min: −2.2 ± 0.6% * | n.d. | ↑ r 1RM Half squat: +26% ** | ↑ r Pm at TT 5 min all out: +7.2 % ± 2 ** | ↓ VO2max during 185 min: -2.2 ± 0.6% * | ↑ r Pm at TT 5 min all out: +7.2% ± 2 ** | n.d. | ↑ Lean Body mass: +1.2% * ↓ RPE: * |
| E. A. Hansen et al., 2012 [25] | 1RM Half Squat, Cycling incremental test, 5 min all out trial after 185 min at 44% of W max, Crank torque | = | n.d. | ↑ 1RM Half squat: +18.9% *** | ↑↑ r Pm TT 5 min all out: +7 % ** | ↑ r Peak positive crank torque: +3% ** ↓ Peak negative crank torque | ↑↑ r Pm TT 5 min all out: +6.8% ** | n.d. | = |
| B. R. Rønnestad et al., 2014 [26] | FFM, PP-40 min, VO2max, WE, PP, PP-30” (Wingate test), PP 4mmol/L | = | n.d. | ↑ ISO half squat: +20% ±12 ** | ↑ r W max: +3% ± 3 * (r = 0.69) ↑ rr Pm 4mmol/L: +3.2% ± 3.5 * ↑ r Pm TT 40 min: +6.5% ± 5.7 ** | ↑ Peak torque in pedal stroke: * r(r = −0.63) rr (r = −0.50) | ↑ r Pm TT 40 min: ±6.5% ± 5.7 ** | n.d. | ↑ Lean body mass: +2% ± 1* |
| O. Vikmoen et al., 2015 [27] | Thigh muscle CSA, 1RM Half Squat, Cycling incremental test, Wingate, TT 40′ all out | = | n.d. | ↑ 1RM Leg Press: +38.6 ± 19.0% ** | ↑ PP Wingate test: +12.7 ± 12.6% ** ↑ Pm Wingate test: +3.4 ± 4.3% * ↑ rr TT 40-min all-out Pm output: +6.4 ± 7.9% ** r (r = 0.67) | = (testo) | ↑ rr TT 40-min all-out Pm output: +6.4 ± 7.9% ** r (r = 0.67) | n.d. | ↑ r (r = 0.59) ↑ rr CSA of m. Quadriceps Femoris: +7.4 ± 5.3% ** (r = 0.73) ↑ rr Type IIA Fibers 39–50% ** (r = 0.63) |
| B. R. Rønnestad et al., 2017 [28] | Lower body mass, SJ, 1RM Half Squat, Cycling incremental test, Wingate, TT 40′ all out | = | n.d. | ↑ Isom Half Squat: +20% *** ↑ SJ: +8% ** | ↑ Pm Wingate test: +2 ± 3% * | = | = | n.d. | = |
| Triathlon | |||||||||
| C. Hausswirth et al., 2009 [29] | 1RM Leg Press, MCV Leg Extension Isometric after 2 h bike test. BIKE: VO2max, MAV | = | n.d. | ↑ 1RM Leg Press: +6.6% ** | n.d. | = | n.d. | n.d. | n.d. |
| O. Vikmoen et al., 2017 [30] | VO2max, 1RM Half Squat, Pm 5 min all out | = | n.d. | ↑ 1RM Half squat: +45% ** | ↑ Pm Bike 5 min all out: +7 ± 4.5% * ↑ Pm Run 5 min all out: +4.7 ± 6% * | ↑ Pm Bike 5 min all out: +7 ± 4.5% * ↑ Pm Run 5 min all out: +4.7 ± 6% * | n.d. | n.d. | ↑ Lean Body mass: +3.1% * |
| Cross Country Skiing | |||||||||
| T. Losnegard et al., 2011 [31] | 1RM Half Squat + Seat pull down, CMJ, VO2max, TT 5 min double poling | ↑ VO2max on skate-roller skiing performance test: +7 ± 1% ** | n.d. | ↑ 1RM Half Squat: +12% ↑ Pull down: +19% ** | ↑ Pm +5 min double poling * | ↑ 5 min Double poling: +7.4% ± 2.6 * | ↑↑ Upper body 1.1 km TT: +7% ± 1 * | n.d. | ↑ CSA triceps: +5.5% ** |
Publisher’s Note: MDPI stays neutral with regard to jurisdictional claims in published maps and institutional affiliations. |
© 2021 by the authors. Licensee MDPI, Basel, Switzerland. This article is an open access article distributed under the terms and conditions of the Creative Commons Attribution (CC BY) license (https://creativecommons.org/licenses/by/4.0/).
Share and Cite
Ambrosini, L.; Presta, V.; Goldoni, M.; Galli, D.; Mirandola, P.; Vitale, M.; Gobbi, G. Are We Able to Match Non Sport-Specific Strength Training with Endurance Sports? A Systematic Review and Meta-Analysis to Plan the Best Training Programs for Endurance Athletes. Appl. Sci. 2021, 11, 7280. https://doi.org/10.3390/app11167280
Ambrosini L, Presta V, Goldoni M, Galli D, Mirandola P, Vitale M, Gobbi G. Are We Able to Match Non Sport-Specific Strength Training with Endurance Sports? A Systematic Review and Meta-Analysis to Plan the Best Training Programs for Endurance Athletes. Applied Sciences. 2021; 11(16):7280. https://doi.org/10.3390/app11167280
Chicago/Turabian StyleAmbrosini, Luca, Valentina Presta, Matteo Goldoni, Daniela Galli, Prisco Mirandola, Marco Vitale, and Giuliana Gobbi. 2021. "Are We Able to Match Non Sport-Specific Strength Training with Endurance Sports? A Systematic Review and Meta-Analysis to Plan the Best Training Programs for Endurance Athletes" Applied Sciences 11, no. 16: 7280. https://doi.org/10.3390/app11167280
APA StyleAmbrosini, L., Presta, V., Goldoni, M., Galli, D., Mirandola, P., Vitale, M., & Gobbi, G. (2021). Are We Able to Match Non Sport-Specific Strength Training with Endurance Sports? A Systematic Review and Meta-Analysis to Plan the Best Training Programs for Endurance Athletes. Applied Sciences, 11(16), 7280. https://doi.org/10.3390/app11167280