Article

Self-Ratings of Olfactory Function and Their Relation to Olfactory Test Scores. A Data Science-Based Analysis in Patients with Nasal Polyposis

1
Institute of Clinical Pharmacology, Goethe-University, Theodor Stern Kai 7, 60590 Frankfurt am Main, Germany
2
Fraunhofer Institute for Translational Medicine and Pharmacology ITMP, Theodor-Stern-Kai 7, 60596 Frankfurt am Main, Germany
3
Department of Otorhinolaryngology, University of Regensburg, Franz-Josef-Strauß-Allee 11, 93053 Regensburg, Germany
4
Smell & Taste Clinic, Department of Otorhinolaryngology, TU Dresden, Fetscherstrasse 74, 01307 Dresden, Germany
5
Department of Otorhinolaryngology, St. Johannes Municipal Hospital, Johannesstraße 9-17, 44137 Dortmund, Germany
*
Author to whom correspondence should be addressed.
Appl. Sci. 2021, 11(16), 7279; https://doi.org/10.3390/app11167279
Submission received: 16 June 2021 / Revised: 29 July 2021 / Accepted: 3 August 2021 / Published: 7 August 2021

Abstract

:
Olfactory self-assessments have been analyzed with often negative but also positive conclusions about their usefulness as a surrogate for sensory olfactory testing. Patients with nasal polyposis have been highlighted as a well-predisposed group for reliable self-assessment. In a prospective cohort of n = 156 nasal polyposis patients, olfactory threshold, odor discrimination, and odor identification were tested using the “Sniffin’ Sticks” test battery, along with self-assessments of olfactory acuity on a numerical rating scale with seven named items or on a 10-point scale with only the extremes named. Apparent highly significant correlations in the complete cohort proved to reflect the group differences in olfactory diagnoses of anosmia (n = 65), hyposmia (n = 74), and normosmia (n = 17), more than the true correlations of self-ratings with olfactory test results, which were mostly very weak. The olfactory self-ratings correlated with a quality of life score, however, only weakly. By contrast, olfactory self-ratings proved as informative in assigning the categorical olfactory diagnosis. Using an olfactory diagnostic instrument, which consists of a mapping rule of two numerical rating scales of one’s olfactory function to the olfactory functional diagnosis based on the “Sniffin’ Sticks” clinical test battery, the diagnoses of anosmia, hyposmia, or normosmia could be derived from the self-ratings at a satisfactorily balanced accuracy of about 80%. It remains to be seen whether this approach of translating self-assessments into olfactory diagnoses of anosmia, hyposmia, and normosmia can be generalized to other clinical cohorts in which olfaction plays a role.

1. Introduction

Self-ratings of olfaction have been reported to reflect true olfactory function well in patients with nasal polyposis [1]. A PubMed database search at https://pubmed.ncbi.nlm.nih.gov on 19 May 2021 using the string “((”self-rating” OR ”self-ratings” OR ”self-estimate” OR ”self-estimates”) AND (smell OR olfaction)) NOT review[PT]” returned 45 results. After removing reports in which the self-rated item was not olfaction but, for example, depression, or the self-estimate merely referred to a global perception of a loss of smell, and adding a further paper from the references of the queried papers, 24 original papers on this topic remained (Table 1).
The assessment of olfactory self-ratings in terms of their correspondence to the tested olfactory function was mostly moderate rather than enthusiastic. For example, we recently published an analysis of a large cohort of n = 6049 subjects comparing self-assessments with the results of a 12-item odor identification test, with the conclusion that asking the patient about olfactory function can at best provide a rough diagnosis of anosmia versus normosmia that cannot be relied upon [20]. Similarly, an analysis of n = 211 subjects from the general population of Taiwan came to the result that most subjects did not rate their olfactory function well and measured olfactory function and self-ratings correlated only weakly [7]. This seems to be partly rooted in the fact that many individuals in the general population are not aware of their own olfactory status [23,24].
High correlations have been reported twice and independently for patients with nasal polyposis [1,21]. This raised the question of whether they constitute a special group that is particularly aware of their olfactory function. In the present study, a cohort of patients scheduled for surgery for nasal polyposis was assessed. Two different self-assessment scales were used together with a standard clinical test of olfactory function that included three main sensory dimensions: olfactory threshold, odor discrimination, and odor identification. Quality-of-life ratings were added as a common reference point to facilitate the interpretation of information on olfactory acuity, which is queried either through self-assessments or clinical odor tests.

2. Methods

2.1. Study Design

The prospective study was conducted in accordance with the Declaration of Helsinki on Biomedical Studies Involving Human Subjects. It was approved by the Ethics committee at the Dresden University Hospital (approval number EK14502017). All participants gave informed written consent.

2.2. Setting

The cohort included patients who were preparing for endoscopic sinus surgery at the Department of Otorhinolaryngology, St. Johannes Municipal Hospital, Dortmund, Germany. Measurements took place between May 2018 and August 2019.
The data analyzed in the present report were obtained as an add-on performed at baseline assessment of olfactory function in a study that aimed at investigating the olfactory outcome and the quality of life after functional endoscopic paranasal sinus surgery in patients with nasal polyps. The main part of the study will be analyzed separately. However, the present analyses of agreement between self-assessed olfactory function and olfactory performance quantified by an established clinical test, are not redundant with the main analyses of the present study; they would distract from the focus of the main analyses, hence, they are reported separately. Thus, the present data were obtained in a cross-sectional design on a single occasion.

2.3. Participants

A total of 158 patients with nasal polyps, i.e., 60 men and 98 women, aged 13.9–84.6 years (mean ± standard deviation: 49.1 ± 14.8 years) was included. Inclusion criteria were age 18 years and older, absence of pregnancy, absence of a neurodegenerative disorders such as Parkinson’s or Alzheimer’s disease, and absence of other disorders that are strongly associated with olfactory loss, e.g., advanced renal dysfunction.

2.4. Variables and Measurements

2.4.1. Self-Ratings of Olfactory Function

Participants rated their olfactory function in two ways on two different Likert-type scales. Rating scale #1 was an 8-point scale, with each point being labeled as 0 = “no smell perception”, 1 = “extremely bad”, 2 = “much worse than normal”, 3 = “worse than normal”, 4 = “normal sense of smell”, 5 = “better than normal”, 6 = “much better than normal”, and 7 = “excellent”. Rating scale #2 was a discrete scale, with labels only at endpoints of the scale, with 10 data points on which subjects rated their olfactory function from 1 = “not present” to 10 = “excellent”. The scales were presented at different positions of the questionnaire.

2.4.2. Olfactory Testing

Olfactory function was quantified using an established clinical test (“Sniffin’ Sticks”, Burghart Instruments, Wedel, Germany) [25,26], which evaluated three sensory dimensions of odors comprising olfactory threshold (to phenylethyl ethanol), odor discrimination (16 pairs of odors) and odor identification (16 odors). The olfactory functional diagnosis was obtained from the sum of scores for threshold, discrimination and identification (TDI) subtests, with a range between 1 and 48 points. The TDI score allows the categorization of subjects as normosmic (sum score > 30.5 points), hyposmic (16.5–30.5 points), or functionally anosmic (< 16.5 points), based on normative scores obtained in more than 9000 healthy subjects [27].

2.4.3. Assessment of the Quality of Life

As a disease-specific measure of the patients’ quality of life, the Sino-Nasal Outcome Test (SNOT-20) questionnaire [28] was used to quantify sinonasal symptoms. It consists of 20 questions categorized into five different domains (rhinologic symptoms, extranasal rhinologic symptoms, ear/face, psychological dysfunction, and sleep dysfunction). Each of the 20 queried items was rated on a Likert scale from 0 = “no problem” to 5 = “it can’t get any worse”. From the responses a sum score and three specific subscores are calculated. In the present context of a general exploration of the context of self-ratings of the sense of smell, the subscore “general quality of life” was selected. It contains the individual responses to questions about dizziness, problems with waking up at night, fatigue during the day, diminished performance, poor concentration frustration/restlessness/irritability, sadness, and embarrassment of the disease symptoms. According to the original definition of the SNOT-20 questionnaire, the final “general quality of life” subscore is calculated as ( r a t i n g # 11 , 13 , , 20 ) / 45 · 100 , where the value of 45 accounts for the maximum sum of individual response to nine questions and the numbers #11, … refer to the item numbers in the SNOT-20.

2.4.4. Bias

The study included an unselected random sample of patients consecutively enrolled for functional endoscopic sinus surgery at their scheduling. Potential confounders of olfactory function such as occupational exposure to toxic substances or intake of medications [29,30] were recorded and eventually excluded as a possible cause of the observed results.

2.4.5. Study Size

The sample size was defined to be twice that of a positive study of the correlation of measured olfactory function with self-assessments of olfaction in n = 80 patients with nasal polyposis [1]. A formal sample size estimate was not performed.

2.4.6. Quantitative Variables

The data set included n = 158 subjects and d = 9 variables, including (i–iii) d = 3 variables that contained the results of the olfactory subtests from which the individual sum scores (iv) were calculated and translated into the olfactory diagnosis, (v–vi) d = 2 variables that contained the self-assessments of olfactory function according to the two rating scales, (vii) the quality of life expressed as the weighted sum score of the relevant nine items in the SNOT-20 questionnaire, and (viii–ix) the patients’ age and gender. Missing values in key variables on sense of smell were not imputed; missing values in other variables were replaced by the median of the available data.

2.5. Data Analysis

The data analysis was primarily aimed at evaluating the utility of self-assessments of olfactory function as a surrogate for functional olfactory testing. Quality of life was included in some of the analyses as a guide for interpreting possible discrepancies between self-assessments and olfactory test results.
The programming work for this report was performed in the R language [31] using the R software package [32] (version 4.0.5 for Linux), which is available free of charge in the Comprehensive R Archive Network (CRAN) at https://CRAN.R-project.org/, accessed on 20 May 2021. The analyses were performed on an Intel Core i9-7940X® computer (Intel Corporation, Santa Clara, CA, USA) running Ubuntu Linux 20.04.2 LTS (Canonical, London, UK).

2.5.1. Statistical Comparison of Diagnostic Group Differences in Self-Rated Olfactory Function

Data analysis was aimed first at statistically significant differences in the two self-assessment scores between the olfactory diagnostic groups of anosmia, hyposmia, and normosmia. For this purpose, the results of the three subtests were subjected to a repeated measures analysis of variance (rm-ANOVA), with the within-subject factor ”rating scale” (two levels), the between-subject factors ”olfactory diagnosis” (three levels), and ”gender”. To avoid detecting the effects of the factor “rating scale” simply due to the different scaling, both scores were (re)scaled to the range [1,…,10]. These calculations were performed using the R libraries ”rstatix” (https://cran.r-project.org/package=rstatix, accessed on 20 May 2021 [33]) and “scales” (https://CRAN.R-project.org/package=scales, accessed on 20 May 2021 [34]). The α-level was set at 0.05.

2.5.2. Covariance and Correlation Analyses

Second, the covariance and correlation structure between clinical olfactory test results and subjective ratings of olfactory function were analyzed. Quality of life was included in the analysis for comparison. Olfactory thresholds were log-transformed to account for the geometric scaling of their acquisition. The 7 x n sized data space (n denoting the analyzed sample size) was projected onto a two-dimensional space using principal component analysis (PCA [35,36]) on scaled and centered data as the default settings of the R-library “FactoMineR“ (https://cran.r-project.org/package=FactoMineR, accessed on 20 May 2021 [37]). To select the most suitable PCs for further analyses, the eigenvalues were submitted to an item categorization technique implemented as computed ABC analysis [38]. This divides each set of positive numerical items into three non-overlapping subsets, referred to as ”A”, ”B”, and ”C” [39], of which subset ”A” contains the ”important few” items (i.e., the relevant PCs) to be retained. As shown previously, this is a mathematically valid replacement for traditional thresholds, such as the Kaiser-Gutman criterion, which chooses a threshold of eigenvalue > 1 for PC selection [40,41] and maximizes the information obtained from multivariate biomedical data. These calculations were performed using our R package “ABCanalysis” (https://cran.r-project.org/package=ABCanalysis, accessed on 20 May 2021 [38]). Finally, given the discussions about the suitability of PCA for Likert-scale data [42], nonlinear PCA was additionally performed to test whether the conclusions drawn from standard PCA held up. This was conducted using the R package “kernlab” (https://cran.r-project.org/package=kernlab, accessed on 20 May 2021 [43]).
Third, correlations between olfactory test results or self-assessments were analyzed by calculating Spearman’s ρ [44]. Quality of life was included in the analysis as a common reference point to facilitate interpretation. Correlations were calculated for the entire data set and separately for the six subgroups consisting of the three odor diagnoses anosmia, hyposmia, and normosmia and the two genders. These analyses were performed using the R packages “GGally” (https://CRAN.R-project.org/package=GGally, accessed on 20 May 2021 [45]) and “inspectdf” (https://CRAN.R-project.org/package=inspectdf, accessed on 20 May 2021 [46]).

2.5.3. Assessment of the Utility of Self-Ratings for Olfactory Diagnosis Establishment

Fourth, the usefulness of the olfactory self-ratings for olfactory diagnosis assignment was evaluated. The two necessary breakpoints for the olfactory diagnoses hyposmia and normosmia were determined using an exhaustive search approach. That is, all possible combinations of two consecutive breakpoints along increasing self-assessment scores were analyzed with respect to the balanced accuracy [47] of the obtained olfactory diagnosis. The procedure resulted in an assignment rule for the olfactory diagnoses from the self-rating in the form of “IF self-assessment < breakpoint #1 THEN anosmia ELSE IF self-assessment < breakpoint #2 THEN hyposmia ELSE normosmia”. This was repeated 1000 times using bootstrap [48] resampled data sets of 100 cases each, from which the minimum accuracy among the three olfactory diagnoses was maintained. The final combination of breakpoints was the one for which the median minimum balanced accuracy was highest. Other measures of classification performance were calculated for this combination, including sensitivity, specificity, negative and positive predictive values calculated using standard equations [49,50], and the F1 measure [51,52]. These calculations were performed using the R library “caret” (https://cran.r-project.org/package=caret, accessed on 20 May 2021 [53]). The 95% confidence intervals (CI) of the classification performance parameters were determined as the range between the 2.5th and 97.5th percentile of the respective values during the 1000 runs.

3. Results

3.1. Participants and Descriptive Data

Two women were excluded because olfactory tests or self-ratings were incomplete. The analyzed data set thus consisted of n = 156 patients (60 men, 96 women, aged 49.1 ± 14.8 years), of whom n = 65 were anosmic, n = 74 had hyposmia, and n = 17 had normal olfactory function, based on testing with the “Sniffin’ Sticks”. Two missing quality-of-life ratings were replaced with the median of the available 154 cases.

3.2. Main Results

Patients assigned to either the olfactory diagnoses of anosmia, hyposmia, or normosmia based on TDI scores differed with respect to self-assessments of their olfactory function (Figure 1). The results of the analysis of variance for repeated measures showed significant effects of the factors “olfactory diagnosis” and, at a much lower significance level, “rating scale”, while “gender” had no effect. Details are given in Table 2.
Table 2. Results of analyses of variance for repeated measures. The analysis was designed using the within-subject factor “rating scale” (two levels, one degree of freedom) and the between-subject factors ”olfactory diagnosis” (three levels, two degrees of freedom) and “gender” (one degree of freedom). The factor “rating scale” refers to the ratings on the two different scales, i.e., a numerical rating scale with seven named items (rating scale #1) and a 10-point scale with only the extremes named (rating scale #2). For the direction of the effects, see Figure 2. Degrees of freedom were corrected according to Greenhouse–Geiser [56]. * p < 0.05.
qEffect (rm-ANOVA Factor)Degrees of FreedomF-Valuep-Valuep < 0.05
Gender11501.9251.67E-01
Olfactory diagnosis215040.6577.79E-15*
Self-assessment score11504.5623.40E-02*
Gender: olfactory diagnosis21500.1718.43E-01
Gender: self-assessment score11500.0977.56E-01
Olfactory diagnosis: self-assessment score21501.5862.08E-01
Gender: olfactory diagnosis: self-assessment score21500.9843.76E-01

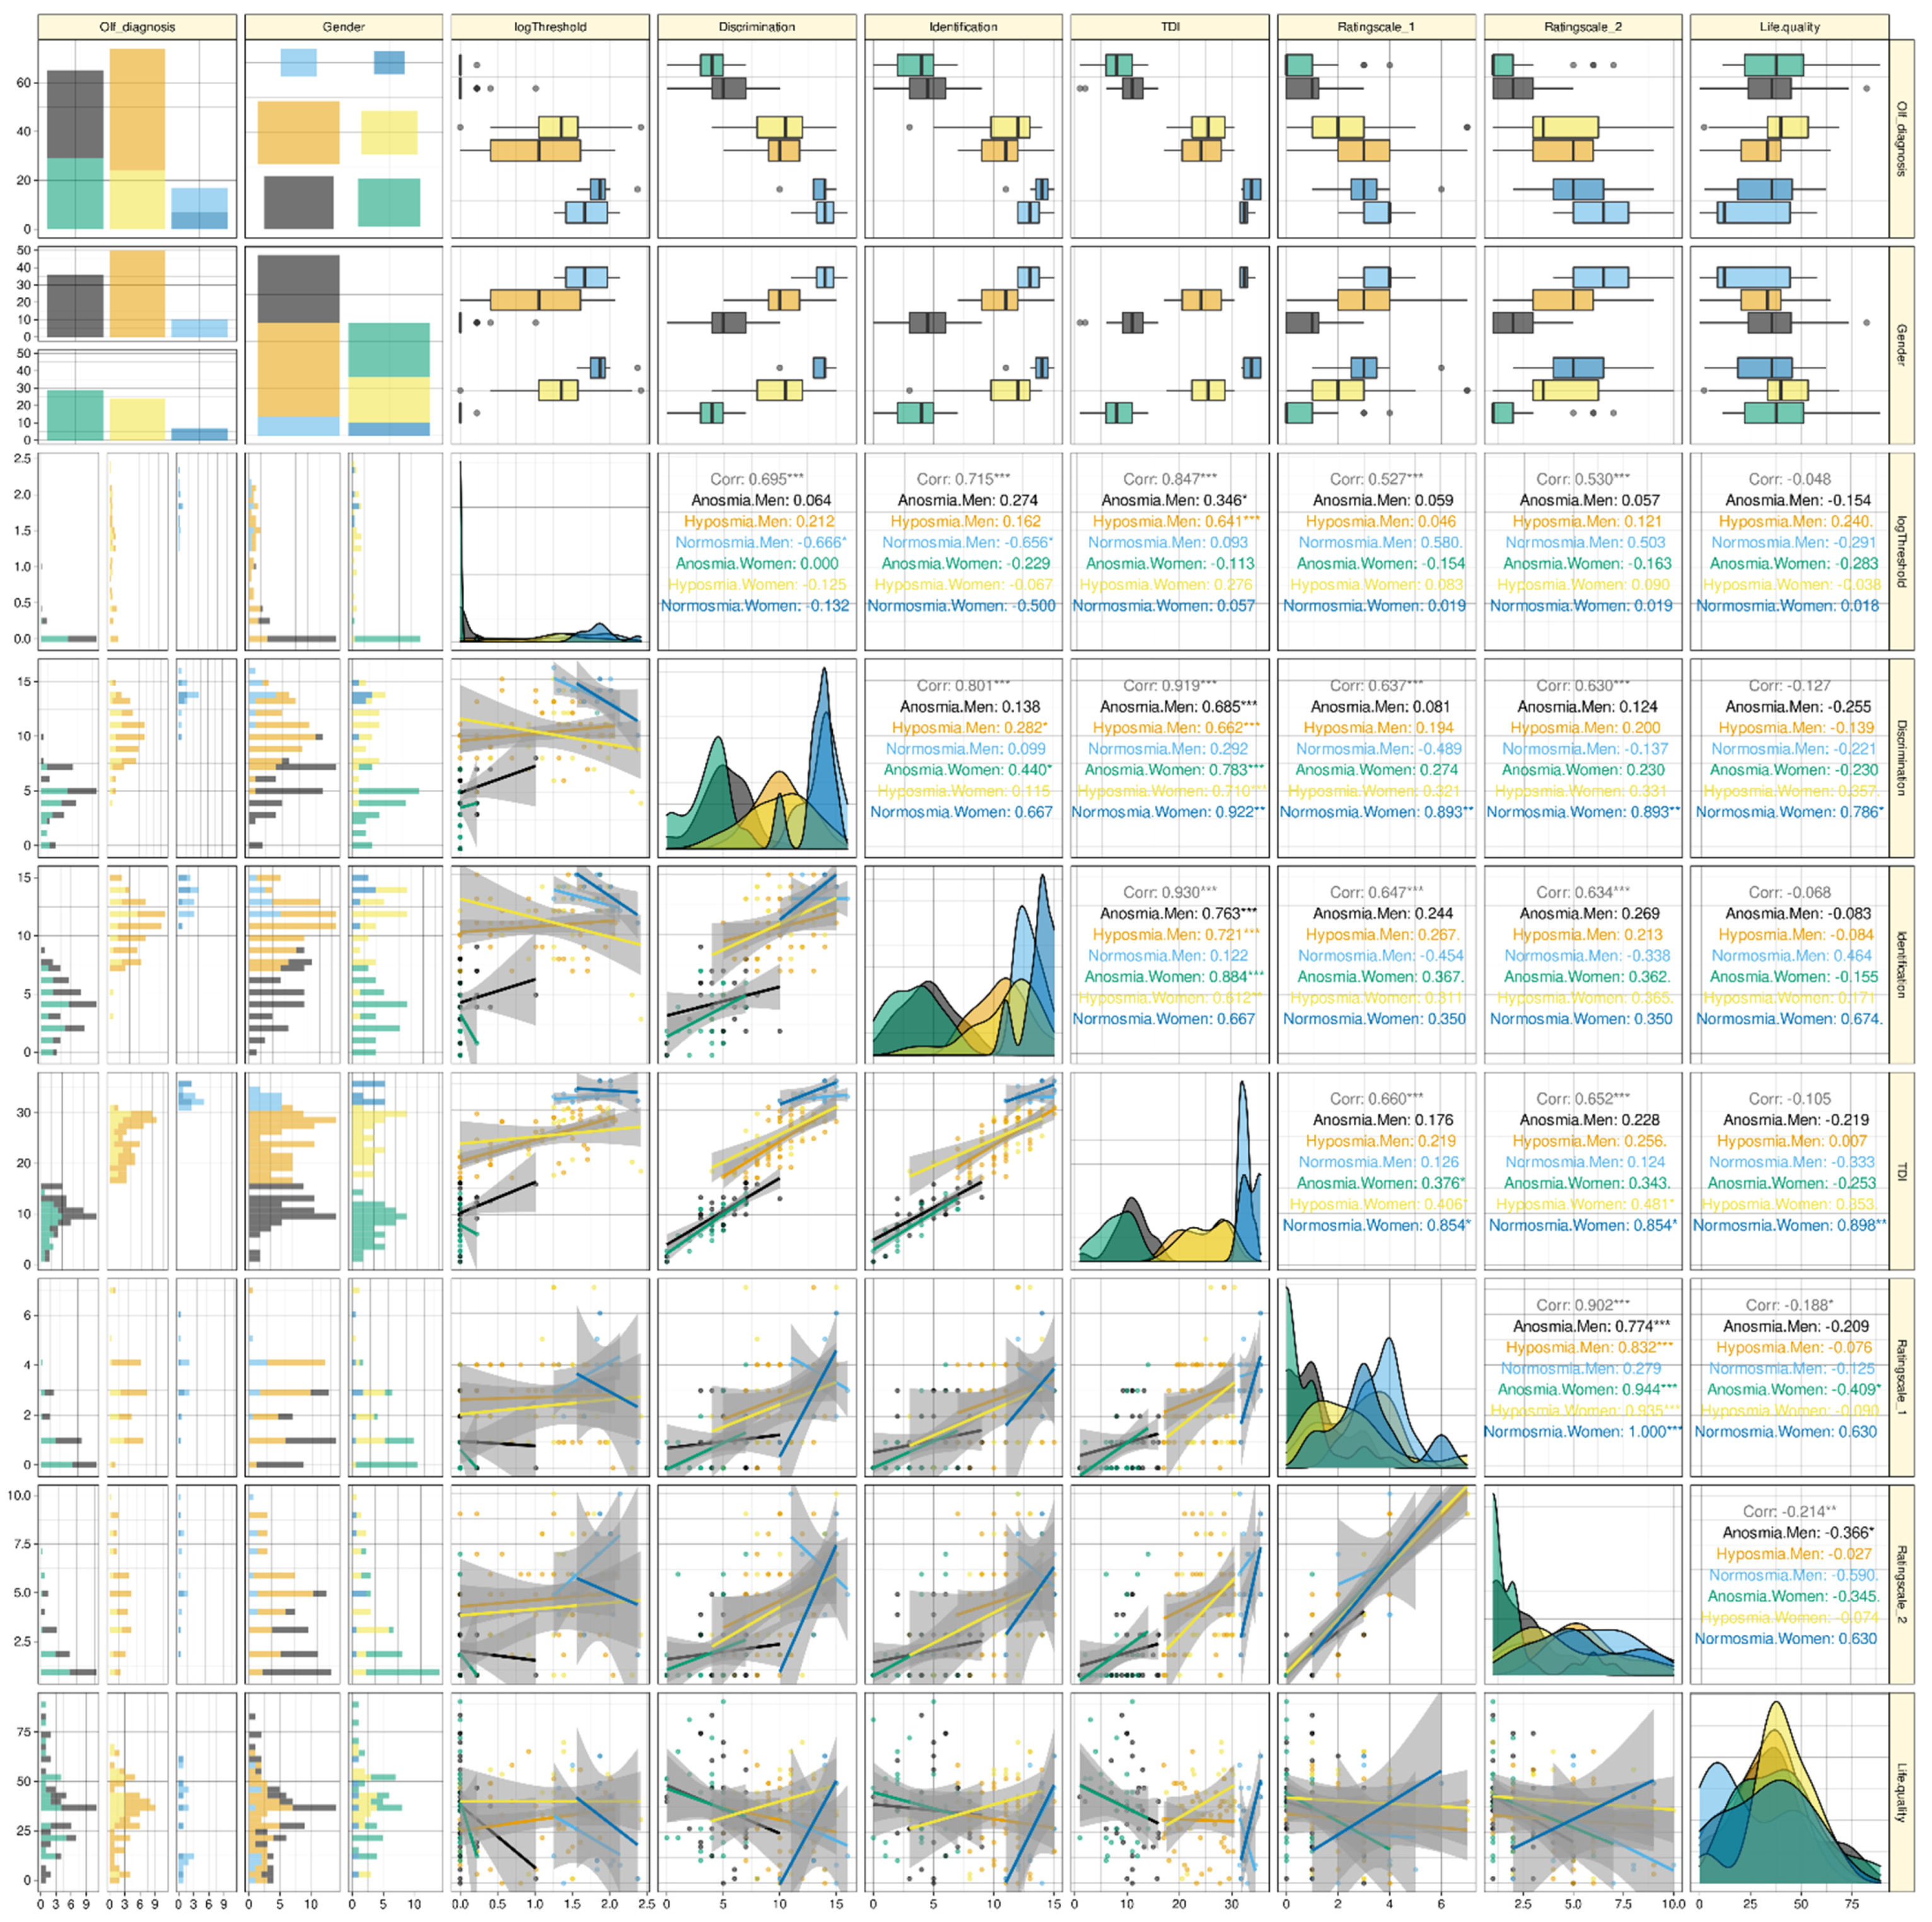
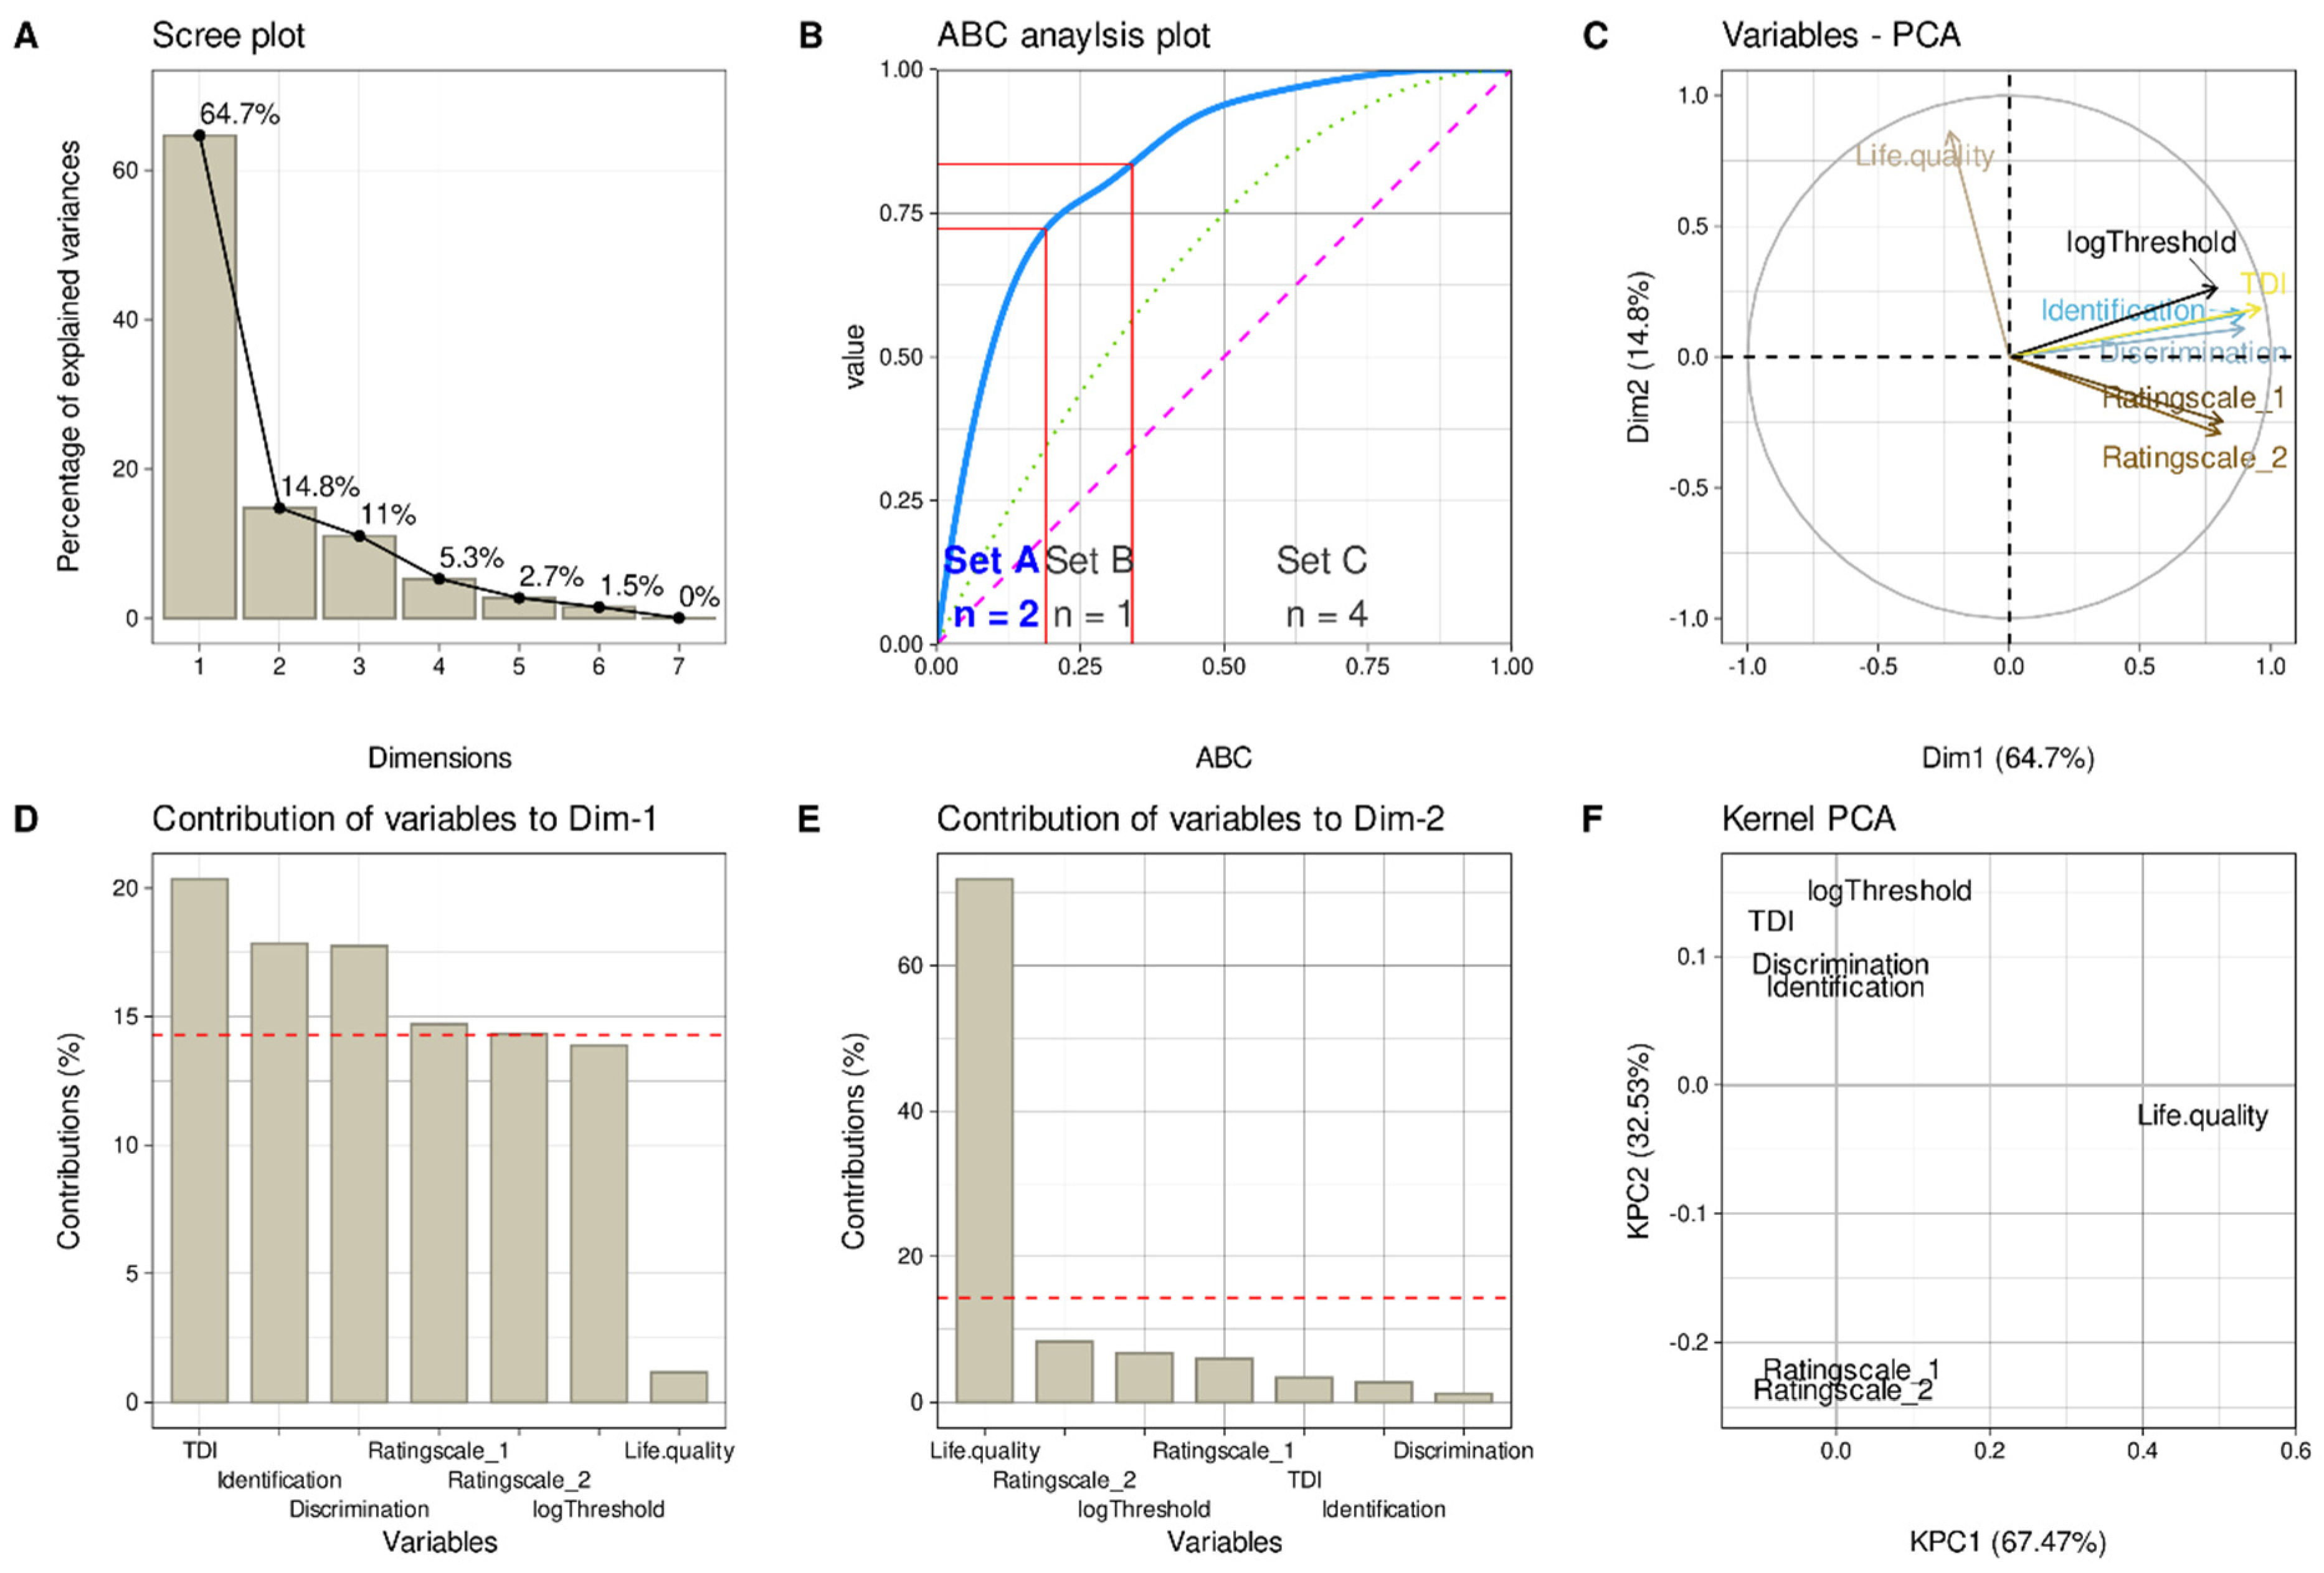
3.3. Pattern of Olfactory Tests and Self-Ratings

PCA projection of the high-dimensional olfactory test or self-estimates data (Figure 3) and subsequent selection of the relevant PCs based on computed ABC analysis of the eigenvalues retained two PCs. The two PCs explained 64.7 and 14.8% of the total variance, respectively. PC1 carried relevant loadings from all olfaction-related variables except olfactory threshold. PC2 carried relevant loadings from the quality of life. However, nonlinear PCA showed an additional separation of rating scales from olfactory test scores. This was also observed in the factor plot (Figure 3C) and became even more evident when quality of life was omitted from the standard PCA projection, which resulted in two main PCs in which PC1 carried loadings from the olfactory tests but not self-ratings, and PC2 carried loadings from the self-ratings (Supplemental Figure S1).

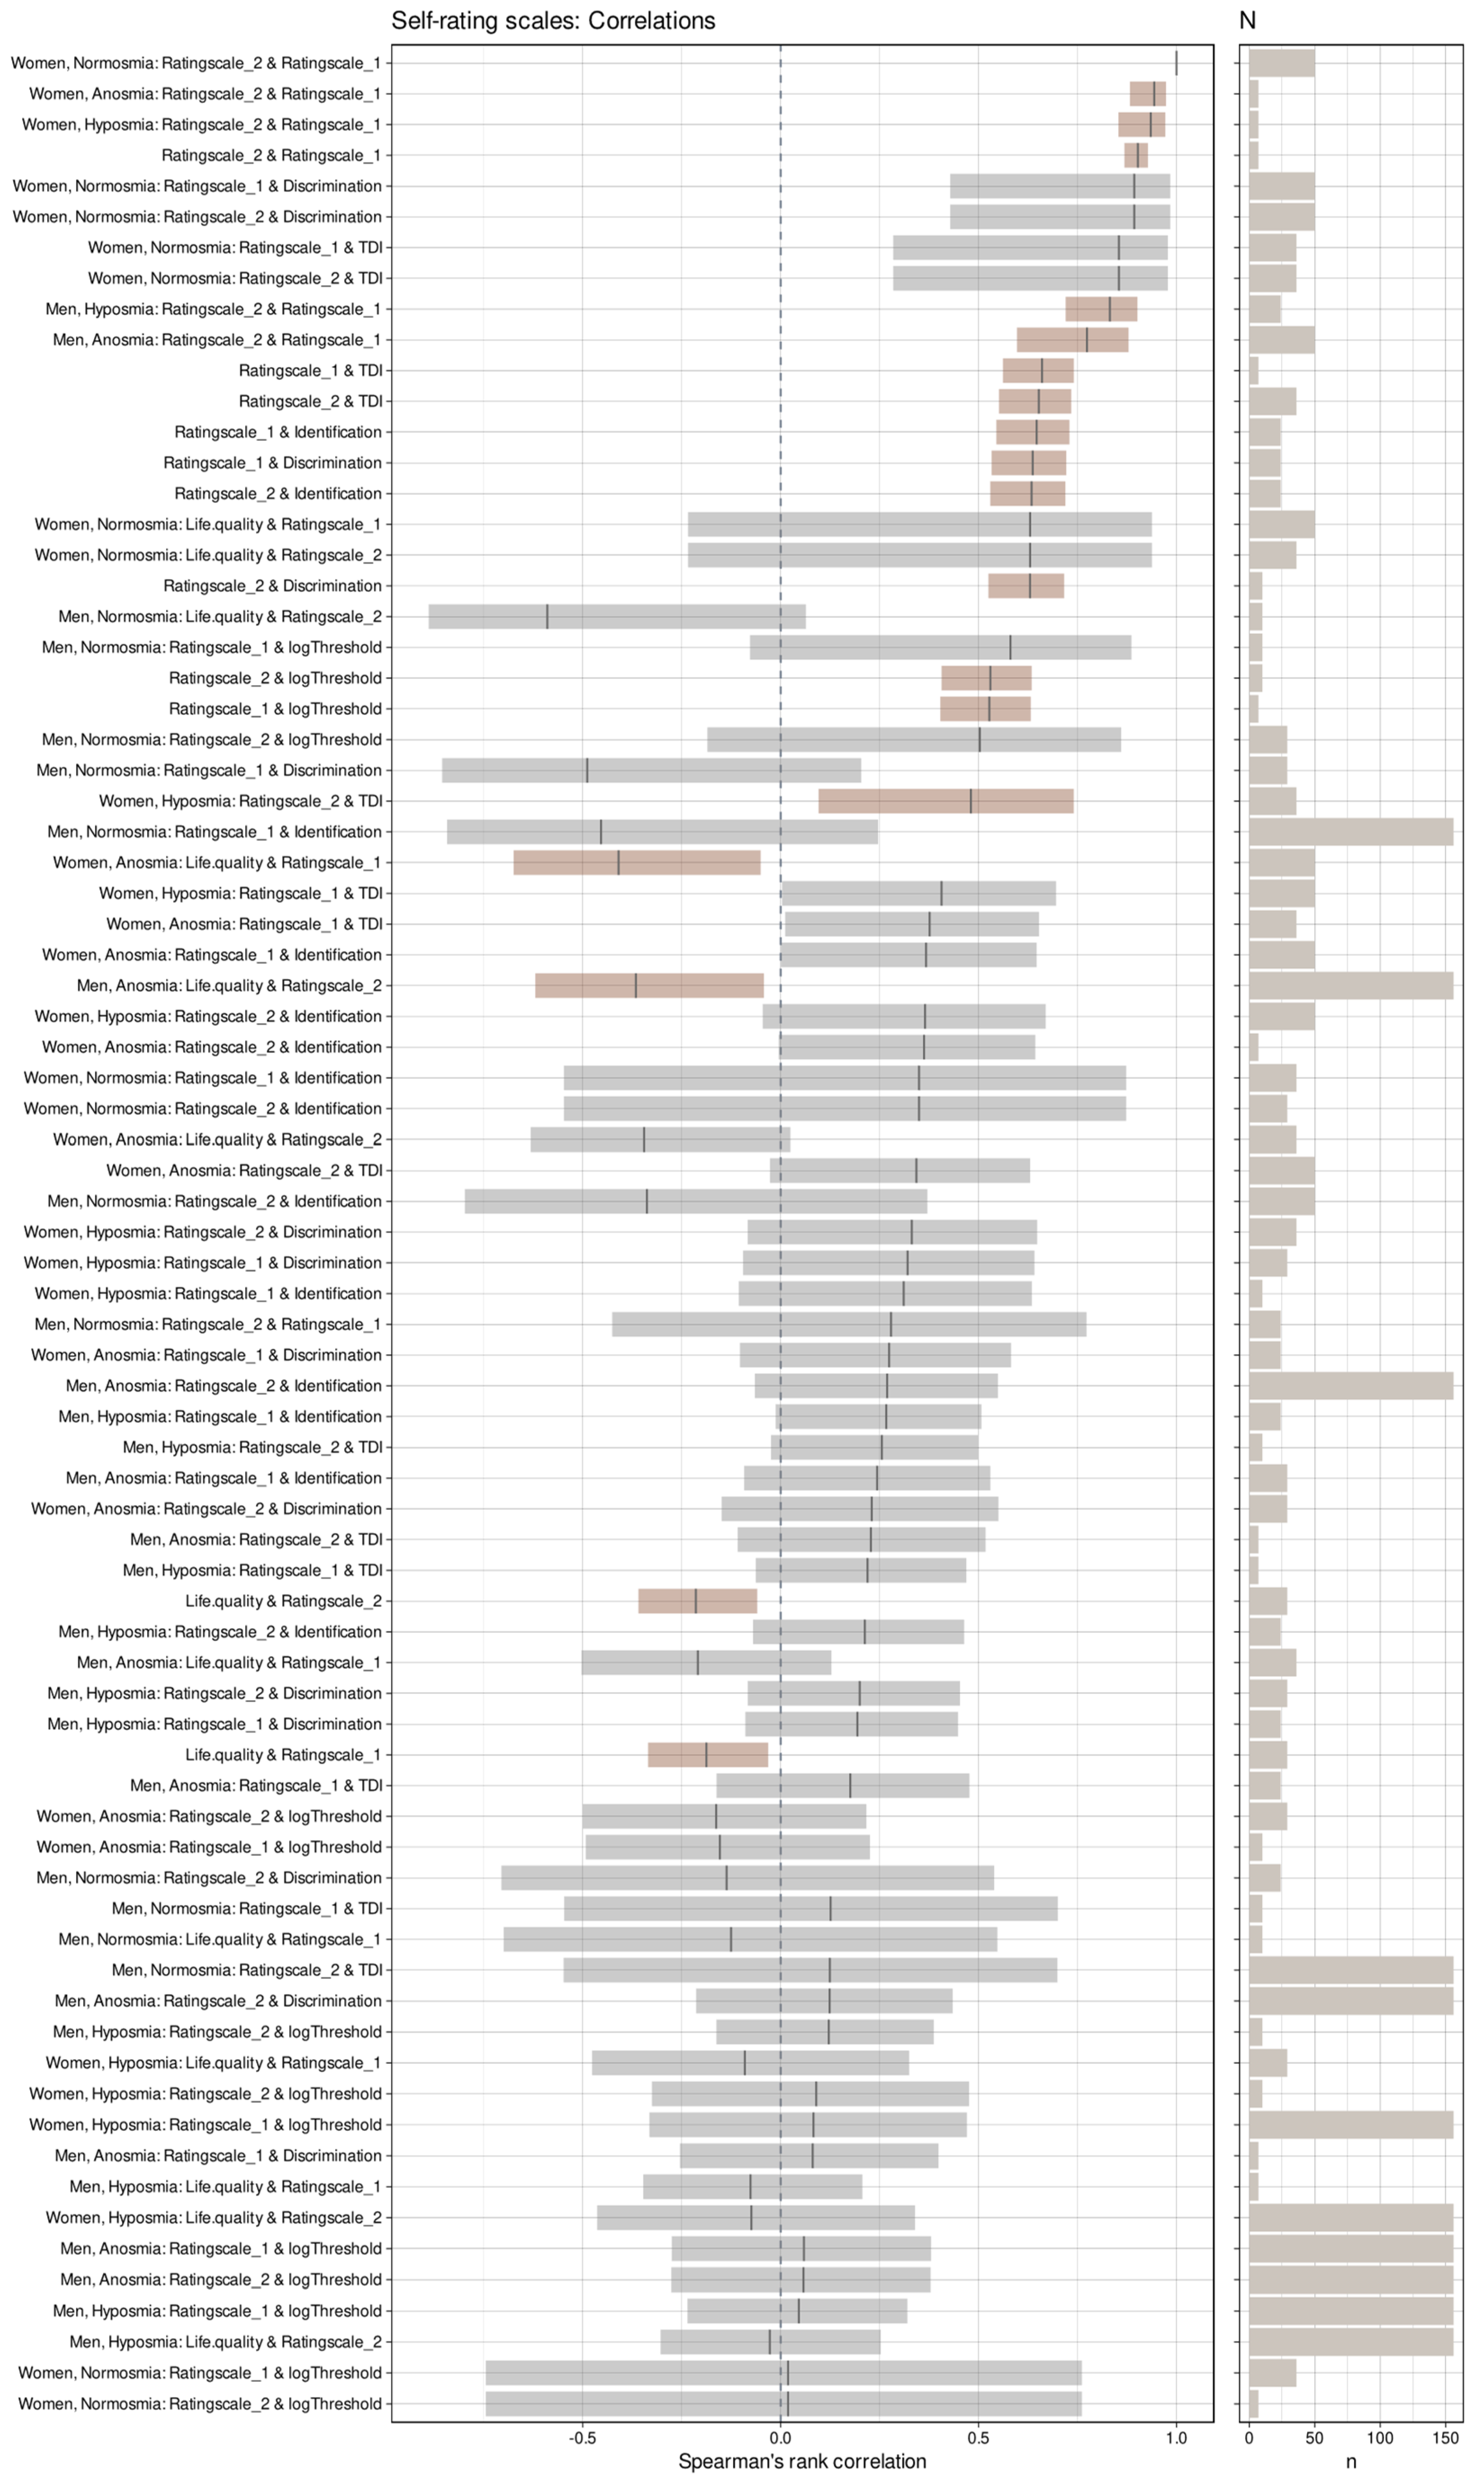
3.4. Correlations of Olfactory Tests and Self-Ratings

High correlations of the olfactory subtests with each other and the resulting TDI sum score of the two self-assessment scores with each other were implied by the PCA results and were not investigated further. The focus was on the correlations of self-ratings with olfactory test results. There, a global assessment also indicated high correlations with values of ρ between 0.53 and 0.66 and p-values < 0.001 (precisely, 1.57 · 10−12 or less) (Figure 1). However, the apparently high correlations of self-assessments and olfactory test results disappeared when the analyses were applied to the olfactory diagnoses separately. Then, the first self-assessment scale showed only five significant correlations with odor test scores, three of which were with total sum score, one with odor discrimination, and one with odor identification, all in females only (Figure 2), with no order of strength of correlations following the order of sample sizes. The second self-assessment score correlated significantly with olfactory test scores only three times, twice with the TDI total score, and once with odor discrimination, again only in women. Olfactory thresholds showed the least tendency for correlation with olfactory self-assessments among the olfactory test scores. Finally, both self-rating scales, but none of the variables from the odor tests, showed significant global negative correlations with the general quality-of-life scores. In addition, both rating scales correlated significantly negatively with the quality of life scores of the anosmic patients.

3.5. Utility of Self-Ratings for Olfactory Diagnosis Establishment

The optimal breakpoints for determining the clinical olfactory diagnosis, known from the TDI test result from the self-ratings, differed with respect to the two self-rating scales and the sex of the patient (Supplemental Figure S2). For self-assessment score 1 and men, the obtained assignment rule was “IF self-assessment < 2 THEN anosmia ELSE IF self-assessment < 4 THEN hyposmia ELSE normosmia”. For women, the breakpoints were at scores 1 and 3, respectively. For self-assessment score 2, the respective values were 4 and 7 for men and 3 and 5 for women. Using these rules in a 1000-resampling scenario provided the assignment performance measures and their 95% CI (Table 3). The median assignment performance appeared to be satisfactory with balanced accuracies of 69.5–75.3%. However, the first of the lower bounds of the 95% CIs of 49.5, 54.6, 56.5, and 61.5% indicated that the assignment of the three TDI-based clinical olfactory diagnoses from the self-assessments may also be in the range of pure guessing. The median assignment performance improved when combining both self-rating scores. Using the rule “IF ratingscale #1 < 2 AND ratingscale #2 < 4 THEN anosmia ELSE IF ratingscale #1 < 5 AND ratingscale #2 < 7 THEN hyposmia ELSE normosmia” in men provided median balanced accuracies mostly above 70% for the entire three-diagnosis setting as well as for each olfactory diagnosis alone, occasionally reaching 80% or more and with 95% CIs always > 50%. The respective breakpoints in the rule for women were 2, 3, 4, 5, providing similarly successful assignments as observed in men (Table 3).

4. Discussion

4.1. Key Results

The present results obtained in patients with nasal polyposis suggest that self-assessments of olfaction on numerical scales can be translated fairly accurately into nominal diagnostic categories of anosmia, hyposmia, or normosmia, but they cannot be expected to reliably provide fine-scale information about olfactory function that could be used as a surrogate for quantitative olfactory tests. Thus, the present independently recruited cohort replicated the observation that in patients with nasal polyposis, self-assessment of their olfactory function provides fairly reliable information about their sense of smell [1,21], but the reported high correlation of NRS ratings and olfactory test scores was not reproduced. This overall usefulness of the self-ratings as a source of information about main categories of olfactory function is consistent with previous assessments of olfactory self-reports, in which a simpler 4-point scale detected anosmia at positive predictive values of >58% in a mixed cohort of subjects [20].
The observed poor correlation between self-assessments and measured olfactory function, which contrasts with some previous reports, underscores the need to exercise caution when assessing correlations between self-assessments of olfaction and olfactory test results. Global analyses may suggest a strong correlation, but this is due to overall group differences between the olfactory diagnoses, which may suggest a correlative relationship to be much larger than it actually is. This has been performed in some of the reports of apparently strong correlations of self-assessments with sensory test scores and has probably contributed to the disagreeing study results about the utility of self-assessments as a substitute for olfactory testing. To avoid these pitfalls, it is a recommended practice (e.g., [59]) to cross-check numerical correlation calculations first with an analysis of the shape of the distributions of each variable and second with a scatter plot. However, there is often little correlation within the main diagnostic subgroups, which has been similarly observed previously [3]. Therefore, the self-ratings do not qualify as a good replacement for olfactory functional test scores.
Thus, when the olfactory diagnostic subgroups were assessed for the correlation of self-ratings with test scores, i.e., for the possibility of using the former as a surrogate for the latter, significant correlations were found sparsely and mainly in patients with normosmia, with an additional correlation in hyposmic subjects and with the first rating scale for anosmia, although this diagnosis implies test results in the range of chance. However, “functional” anosmia, which is the precise meaning of olfactory diagnosis [60], does not indicate a complete lack of the sense of smell, and it would not be surprising to observe differences in individual subtest scores along a low range of possible scores, occasionally exceeding chance but not summing-up above the limit of hyposmia. The finding may also be interpreted as a lower validity of the precisely labelled scale for which every point required a clear decision in contrast to the continuous rating scale #2.
The usefulness of self-assessment as a surrogate measure for scaled olfactory test scores was further supported by the significant negative correlations of the assessments with the general quality of life score of the SNOT-20 questionnaire, which is a weighted sum of nine questions in which worse symptoms get a higher rating than items that cause no problem for the patient. This agrees with the general perception that olfaction contributes positively to quality of life, which has been supported by numerous studies [61,62,63,64,65,66].
However, while the general association of a worse quality of life with more reduced perception of one own’s sense of smell was preserved, the PCA projected the quality-of-life ratings to be almost perpendicular to the olfactory test scores, which was consistent with their almost nonexistent correlation. The present findings compare to previous multicentric work in a group of 760 individuals with olfactory loss where measures of quality of life were better correlated to self-rated olfactory function than results from psychophysical tests of olfactory function [65]. This raises the question of what is rated when patients are asked to estimate the acuity of their own sense of smell. Using an alternative projection technique on more complex data than the present set, implemented as multidimensional scaling as an alternative classical data projection technique [67], the odor perception space was found to be complex, leaving room for different aspects captured either by self-assessments or clinical sensory testing [68]. For example, olfactory self-ratings were found to be more related to the affective impact of the odor, such as annoyance, but not to the results of the olfactory tests [6,17]. Personality traits have also been associated with self-perception of the performance of one’s sense of smell [69]. Importantly, nasal airflow has been shown to modify self-ratings of olfactory function [3]. Furthermore, the poor self-assessments of one’s olfactory acuity could be due to the much more limited content of consciousness compared to the other main senses, which has been discussed as being a consequence of the mainly paleocortical processing of chemosensory information [70]. Finally, while other sensory perceptions such as seeing and hearing are subject to constant external feedback, this is less pronounced for olfactory function. Anosmia can go unnoticed despite the fact that, at least during eating, each day there are numerous olfactory encounters [23,24].

4.2. Strengths and Limitations

Splitting the sample into subgroups in terms of gender and odor diagnoses had the inevitable effect of rapidly reducing sample sizes per subgroup. This is a common problem with studies that are initially conducted with a fairly large sample, but as one moves into subgroup analyses, the sample size melts away. In addition, the study sample was not set based on a previous estimate of sample size, but was set at approximately twice the size of the largest study of olfactory self-assessments in patients with nasal polyposis [1]. However, visual inspection of the scatter plots (Figure 1) shows that the apparent correlation was due to the artificial effect described above, and the linear trends in the subgroup-specific test score versus rating score plots showed no evidence that the too small sample just prevented statistical significance; on the contrary, there was little or no correlation. In addition, the lower correlations in the split analysis for gender and odor diagnosis, which also resulted in smaller samples compared with the correlations performed in the entire cohort, did not appear to be a consequence of the smaller samples. On the contrary, the order of sample sizes used for the specific correlations did not at all follow the order of decreasing strength of the correlations (Figure 2, right bar plot).
The present use of two numerical rating scales did not reveal clear differences in the query of self-assessment of olfactory function. However, the two scales were relatively similar, which has been used in most other studies in the same or slightly modified form. The question to the participants is simple, but odor awareness, i.e., a person’s ability to perceive and respond to odor stimuli in the environment, is more complex and contributes to self-assessment. It also contrasts with the present assessments of the quality of life, which have been queried using a complex questionnaire. However, studies that used questionnaires instead of one-dimensional scales yielded ambiguous results with strong or no correlation to the measured olfactory function respectively [1,19]. A specific questionnaire on odor perception was not used in the present study or in others that addressed the issue of the accuracy of self-assessments related to measured olfactory function [71].
Modest data imputation was performed for the quality-of-life assessments, but was only required for two patients who belonged to the olfactory diagnostic category of anosmia, which was the second most common diagnostic subgroup with n = 65 patients. Two imputed values corresponded to 3.07%, which did not have a major impact on subsequent statistical analyses. Indeed, when the analyses were repeated without imputed values, meaning that two patients were lost from the analyses, no changes in the results were observed but in only numerical details, without any change in significant versus nonsignificant results. In particular, the values of the olfactory test results and the olfactory self-ratings, which are the focus of this report, were completely unaffected by this imputation.

4.3. Interpretation

The present results suggest that asking patients with nasal polyposis about the function of their sense of smell provides relevant correct information; however, not as a correlating ordinal- or interval-scale measure that correlates with measured olfactory scores, but when categorical information is extracted from the ratings. By combining two numerical self-rating scales of olfactory function, it was possible to create a diagnostic tool in the form of a simple rule that provides olfactory function with an accuracy of up to 80% or slightly above, which can be considered a moderately to fairly good diagnosis-assignment performance. With regard to a correlative relationship of ratings with measured olfactory scores, as previously reported [1,21], the present results from a cohort of comparable size suggest a contrary interpretation. Self-assessments cannot be not expected to provide scaled information that can substitute for quantitative olfactory functional measurements.

4.4. Generalizability

Self-assessments of olfactory function are applied in different clinical settings and different cohorts of healthy or ill subjects. Perceptions of their accuracy for true olfactory function, based on previously reported evidence, are mixed. The presently developed olfactory diagnostic instrument, which consists of a mapping rule of two numerical rating scales of one’s olfactory function to the olfactory functional diagnosis based on the “Sniffin’ Sticks” clinical test battery, demonstrates that self-assessments can be usefully employed in clinical and research settings if care is taken to ensure that they are intended to provide categorical rather than interval/ordinally scaled information. This has been demonstrated in patients with nasal polyposis, who may stand out as a group particularly well aware of their own olfactory function. However, with clear instructions available, it seems possible to generalize the approach of translating self-assessments into olfactory diagnoses to other clinical cohorts in which olfaction plays a role. Still, the obtained instrument provides a good performance of assigning the categorial olfactory diagnosis from self-ratings.

Supplementary Materials

The following are available online at https://www.mdpi.com/article/10.3390/app11167279/s1, Supplemental information includes the PCA results without quality-of-life ratings (Supplemental Figure S1) and the Supplementary Materials: balanced accuracies obtained during the exhaustive search for association rules from self-ratings to odor diagnoses (Supplemental Figure S2).

Author Contributions

Conceptualization, T.H., C.A.H., P.P. and J.P.; Conceptualization of data analysis, J.L.; validation, J.L. and T.H.; formal analysis, J.L.; investigation, C.A.H., P.P. and J.P.; resources, C.A.H., P.P., J.P. and T.H.; data curation, J.L. and T.H.; writing—original draft, J.L. and T.H. All authors have read and agreed to the published version of the manuscript.

Funding

None.

Institutional Review Board Statement

The study has been approved by the Ethics committee at the Dresden University Hospital (approval number EK14502017).

Informed Consent Statement

All participants gave informed written consent.

Data Availability Statement

Data available on request from the last author.

Conflicts of Interest

The authors have declared that no competing interests exist.

References

  1. Nguyen, D.T.; Nguyen-Thi, P.L.; Jankowski, R. How Does Measured Olfactory Function Correlate with Self-Ratings of the Sense of Smell in Patients with Nasal Polyposis? Laryngoscope 2012, 122, 947–952. [Google Scholar] [CrossRef] [PubMed]
  2. Van Dam, F.S.; Hilgers, F.J.; Emsbroek, G.; Touw, F.I.; van As, C.J.; de Jong, N. Deterioration of Olfaction and Gustation As a Consequence of Total Laryngectomy. Laryngoscope 1999, 109, 1150–1155. [Google Scholar] [CrossRef]
  3. Landis, B.N.; Hummel, T.; Hugentobler, M.; Giger, R.; Lacroix, J.S. Ratings of Overall Olfactory Function. Chem. Senses 2003, 28, 691–694. [Google Scholar] [CrossRef] [Green Version]
  4. Cameron, E.L. Measures of Human Olfactory Perception During Pregnancy. Chem. Senses 2007, 32, 775–782. [Google Scholar] [CrossRef] [Green Version]
  5. Leon, E.A.; Catalanotto, F.A.; Werning, J.W. Retronasal and Orthonasal Olfactory Ability After Laryngectomy. Arch. Otolaryngol. Head Neck Surg. 2007, 133, 32–36. [Google Scholar] [CrossRef] [PubMed] [Green Version]
  6. Knaapila, A.; Tuorila, H.; Kyvik, K.O.; Wright, M.J.; Keskitalo, K.; Hansen, J.; Kaprio, J.; Perola, M.; Silventoinen, K. Self-Ratings of Olfactory Function Reflect Odor Annoyance Rather Than Olfactory Acuity. Laryngoscope 2008, 118, 2212–2217. [Google Scholar] [CrossRef] [PubMed]
  7. Lin, S.H.; Chu, S.T.; Yuan, B.C.; Shu, C.H. Survey of the Frequency of Olfactory Dysfunction in Taiwan. J. Chin. Med. Assoc. 2009, 72, 68–71. [Google Scholar] [CrossRef] [Green Version]
  8. Shu, C.H.; Hummel, T.; Lee, P.L.; Chiu, C.H.; Lin, S.H.; Yuan, B.C. The Proportion of Self-Rated Olfactory Dysfunction Does Not Change Across the Life Span. Am. J. Rhinol. Allergy 2009, 23, 413–416. [Google Scholar] [CrossRef]
  9. Seo, H.S.; Guarneros, M.; Hudson, R.; Distel, H.; Min, B.C.; Kang, J.K.; Croy, I.; Vodicka, J.; Hummel, T. Attitudes Toward Olfaction: A Cross-Regional Study. Chem. Senses 2011, 36, 177–187. [Google Scholar] [CrossRef]
  10. Trellakis, S.; Tagay, S.; Fischer, C.; Rydleuskaya, A.; Scherag, A.; Bruderek, K.; Schlegl, S.; Greve, J.; Canbay, A.E.; Lang, S.; et al. Ghrelin, Leptin and Adiponectin As Possible Predictors of the Hedonic Value of Odors. Regul. Pept. 2011, 167, 112–117. [Google Scholar] [CrossRef]
  11. Lötsch, J.; Kraetsch, H.G.; Wendler, J.; Hummel, T. Self-Ratings of Higher Olfactory Acuity Contrast with Reduced Olfactory Test Results of Fibromyalgia Patients. Int. J. Psychophysiol. 2012, 86, 182–186. [Google Scholar] [CrossRef]
  12. Cameron, E.L. Pregnancy Does Not Affect Human Olfactory Detection Thresholds. Chem. Senses 2014, 39, 143–150. [Google Scholar] [CrossRef] [PubMed] [Green Version]
  13. Kollndorfer, K.; Kowalczyk, K.; Nell, S.; Krajnik, J.; Mueller, C.A.; Schöpf, V. The Inability to Self-Evaluate Smell Performance. How the Vividness of Mental Images Outweighs Awareness of Olfactory Performance. Front. Psychol. 2015, 6, 627. [Google Scholar] [CrossRef] [Green Version]
  14. Sorokowska, A.; Schriever, V.A.; Gudziol, V.; Hummel, C.; Hähner, A.; Iannilli, E.; Sinding, C.; Aziz, M.; Seo, H.S.; Negoias, S.; et al. Changes of Olfactory Abilities in Relation to Age: Odor Identification in More Than 1400 People Aged 4 to 80 Years. Eur. Arch. Otorhinolaryngol. 2015, 272, 1937–1944. [Google Scholar] [CrossRef] [PubMed] [Green Version]
  15. Fasunla, A.J.; Daniel, A.; Nwankwo, U.; Kuti, K.M.; Nwaorgu, O.G.; Akinyinka, O.O. Evaluation of Olfactory and Gustatory Function of HIV Infected Women. AIDS Res. Treat. 2016, 2016, 2045383. [Google Scholar] [CrossRef] [PubMed]
  16. Galletti, B.; Santoro, R.; Mannella, V.K.; Caminiti, F.; Bonanno, L.; De Salvo, S.; Cammaroto, G.; Galletti, F. Olfactory Event-Related Potentials: A New Approach for the Evaluation of Olfaction in Nasopharyngeal Carcinoma Patients Treated with Chemo-Radiotherapy. J. Laryngol. Otol. 2016, 130, 453–461. [Google Scholar] [CrossRef]
  17. Knaapila, A.; Raittola, A.; Sandell, M.; Yang, B. Self-Ratings of Olfactory Performance and Odor Annoyance Are Associated with the Affective Impact of Odor, but Not with Smell Test Results. Perception 2017, 46, 352–365. [Google Scholar] [CrossRef]
  18. Seok, J.; Shim, Y.J.; Rhee, C.S.; Kim, J.W. Correlation Between Olfactory Severity Ratings Based on Olfactory Function Test Scores and Self-Reported Severity Rating of Ol-Factory Loss. Acta Otolaryngol. 2017, 137, 750–754. [Google Scholar] [CrossRef]
  19. Chen, G.; Pan, H.; Li, L.; Wang, J.; Zhang, D.; Wu, Z. Olfactory Assessment in the Chinese Pediatric Population. Medicine 2018, 97, e0464. [Google Scholar] [CrossRef] [PubMed]
  20. Lötsch, J.; Hummel, T. Clinical Usefulness of Self-Rated Olfactory Performance-A Data Science-Based Assessment of 6000 Patients. Chem. Senses 2019. [Google Scholar] [CrossRef]
  21. Bogdanov, V.; Walliczek-Dworschak, U.; Whitcroft, K.L.; Landis, B.N.; Hummel, T. Response to Glucocorticosteroids Predicts Olfactory Outcome After ESS in Chronic Rhinosinusitis. Laryngoscope 2020, 130, 1616–1621. [Google Scholar] [CrossRef] [PubMed]
  22. Liu, D.T.; Besser, G.; Prem, B.; Sharma, G.; Koenighofer, M.; Renner, B.; Mueller, C.A. Association Between Orthonasal Olfaction and Chemosensory Perception in Patients with Smell Loss. Laryngoscope 2020, 130, 2213–2219. [Google Scholar] [CrossRef]
  23. Oleszkiewicz, A.; Hummel, T. Whose Nose Does Not Know? Demographical Characterization of People Unaware of Anosmia. Eur. Arch. Otorhinolaryngol. 2019, 276, 1849–1852. [Google Scholar] [CrossRef] [PubMed] [Green Version]
  24. Oleszkiewicz, A.; Kunkel, F.; Larsson, M.; Hummel, T. Consequences of Undetected Olfactory Loss for Human Chemosensory Communication and Well-Being. Philos. Trans. R. Soc. B 2020, 375, 20190265. [Google Scholar] [CrossRef] [PubMed]
  25. Kobal, G.; Hummel, T.; Sekinger, B.; Barz, S.; Roscher, S.; Wolf, S.R. “Sniffin’ Sticks”: Screening of Olfactory Performance. Rhinology 1996, 34, 222–226. [Google Scholar]
  26. Hummel, T.; Sekinger, B.; Wolf, S.R.; Pauli, E.; Kobal, G. ‘Sniffin’ Sticks’: Olfactory Performance Assessed by the Combined Testing of Odor Identification, Odor Discrimination and Olfactory Threshold. Chem. Senses 1997, 22, 39–52. [Google Scholar] [CrossRef]
  27. Oleszkiewicz, A.; Schriever, V.A.; Croy, I.; Hahner, A.; Hummel, T. Updated Sniffin’ Sticks Normative Data Based on an Extended Sample of 9139 Subjects. Eur. Arch. Otorhinolaryngol. 2019, 276, 719–728. [Google Scholar] [CrossRef] [PubMed] [Green Version]
  28. Piccirillo, J.F.; Merritt, M.G., Jr.; Richards, M.L. Psychometric and Clinimetric Validity of the 20-Item Sino-Nasal Outcome Test (SNOT-20). Otolaryngol. Head Neck Surg. 2002, 126, 41–47. [Google Scholar] [CrossRef] [PubMed]
  29. Lötsch, J.; Geisslinger, G.; Hummel, T. Sniffing Out Pharmacology: Interactions of Drugs With Human Olfaction. Trends Pharmacol. Sci. 2012, 33, 193–199. [Google Scholar] [CrossRef]
  30. Lötsch, J.; Daiker, H.; Hähner, A.; Ultsch, A.; Hummel, T. Drug-Target Based Cross-Sectional Analysis of Olfactory Drug Effects. Eur. J. Clin. Pharmacol. 2015, 71, 461–471. [Google Scholar] [CrossRef]
  31. Ihaka, R.; Gentleman, R. R: A Language for Data Analysis and Graphics. J. Comput. Graph. Stat. 1996, 5, 299–314. [Google Scholar] [CrossRef]
  32. R Core Team. R: A Language and Environment for Statistical Computing; R Foundation for Statistical Computing: Vienna, Austria, 2018; Available online: https://www.R-project.org/ (accessed on 20 May 2021).
  33. Kassambara, A. rstatix: Pipe-Friendly Framework for Basic Statistical Tests. 2021. Available online: https://CRAN.R-project.org/package=rstatix (accessed on 20 May 2021).
  34. Wickham, H.; Seidel, D. scales: Scale Functions for Visualization. 2020. Available online: https://CRAN.R-project.org/package=scales (accessed on 20 May 2021).
  35. Hotelling, H. Analysis of a Complex of Statistical Variables Into Principal Components. J. Educ. Psychol. 1933, 24, 498–520. [Google Scholar] [CrossRef]
  36. Pearson, K. LIII. On Lines and Planes of Closest Fit to Systems of Points in Space. Lond. Edinb. Dublin Philos. Mag. J. Sci. 1901, 2, 559–572. [Google Scholar] [CrossRef] [Green Version]
  37. Le, S.; Josse, J.; Husson, F. FactoMineR: A Package for Multivariate Analysis. J. Stat. Softw. 2008, 25, 1–18. [Google Scholar] [CrossRef] [Green Version]
  38. Ultsch, A.; Lötsch, J. Computed ABC Analysis for Rational Selection of Most Informative Variables in Multivariate Data. PLoS ONE 2015, 10, e0129767. [Google Scholar] [CrossRef] [Green Version]
  39. Juran, J.M. The Non-Pareto Principle; Mea Culpa. Qual. Prog. 1975, 8, 8–9. [Google Scholar]
  40. Kaiser, H.F. The Varimax Criterion for Analytic Rotation in Factor Analysis. Psychometrika 1958, 23, 187–200. [Google Scholar] [CrossRef]
  41. Guttman, L. Some Necessary Conditions for Common Factor Analysis. Psychometrika 1954, 19, 149–161. [Google Scholar] [CrossRef]
  42. Linting, M.; van der Kooij, A. Nonlinear Principal Components Analysis With CATPCA: A Tutorial. J. Personal. Assess. 2012, 94, 12–25. [Google Scholar] [CrossRef]
  43. Karatzoglou, A.; Smola, A.; Hornik, K.; Zeileis, A. Kernlab–An S4 Package for Kernel Methods in R. J. Stat. Softw. 2004, 11, 1–20. [Google Scholar] [CrossRef] [Green Version]
  44. Spearman, C. The Proof and Measurement of Association Between Two Things. Am. J. Psychol. 1904, 15, 72–101. [Google Scholar] [CrossRef]
  45. Schloerke, B.; Crowley, J.; Cook, D.; Briatte, F.; Marbach, M.; Thoen, E.; Elberg, A.; Larmarange, J. GGally: Extension to ‘ggplot2’. Available online: https://CRAN.R-project.org/package=GGally (accessed on 20 May 2021).
  46. Rushworth, A. Inspectdf: Inspection, Comparison and Visualisation of Data Frames. R package version. Available online: https://CRAN.R-project.org/package=inspectdf (accessed on 20 May 2021).
  47. Brodersen, K.H.; Ong, C.S.; Stephan, K.E.; Buhmann, J.M. The Balanced Accuracy and Its Posterior Distribution. In Proceedings of the 20th International Conference on Pattern Recognition (ICPR), Istanbul, Turkey, 23–26 August 2010; pp. 3121–3124. [Google Scholar]
  48. Efron, B.; Tibshirani, R.J. An Introduction to the Bootstrap; Chapman and Hall: San Francisco, CA, USA, 1995. [Google Scholar]
  49. Altman, D.G.; Bland, J.M. Diagnostic Tests. 1: Sensitivity and Specificity. BMJ 1994, 308, 1552. [Google Scholar] [CrossRef] [PubMed] [Green Version]
  50. Altman, D.G.; Bland, J.M. Diagnostic Tests 2: Predictive Values. BMJ 1994, 309, 102. [Google Scholar] [CrossRef] [Green Version]
  51. Sørensen, T.J. A Method of Establishing Groups of Equal Amplitude in Plant Sociology Based on Similarity of Species Content and Its Application to Analyses of the Vegetation on Danish Commons. Biol. Skar. 1948, 5, 1–34. [Google Scholar]
  52. Jardine, N.; van Rijsbergen, C.J. The Use of Hierarchic Clustering in Information Retrieval. Inf. Storage Retr. 1971, 7, 217–240. [Google Scholar] [CrossRef]
  53. Kuhn, M. Caret: Classification and Regression Training. Astrophys. Source Code Libr. 2018, 1505. Available online: https://cran.r-project.org/package=caret (accessed on 20 May 2021).
  54. Kassambara, A. ggpubr: ‘ggplot2’ Based Publication Ready Plots. 2020. Available online: https://cran.r-project.org/package=ggpubr (accessed on 20 May 2021).
  55. Arnold, J.B. ggthemes: Extra Themes, Scales and Geoms for ‘ggplot2’. 2019. Available online: https://cran.r-project.org/package=ggthemes (accessed on 20 May 2021).
  56. Greenhouse, S.W.; Geisser, S. On Methods in the Analysis of Profile Data. Psychometrika 1959, 24, 95–112. [Google Scholar] [CrossRef]
  57. Thomas, J.D.; Bradley, E. Bootstrap Confidence Intervals. Stat. Sci. 1996, 11, 189–228. [Google Scholar] [CrossRef]
  58. Watson, D. Bioplotr: Pretty, Simple, Optionally Interactive Plots for Bioinformatics Analysis Pipelines. 2021. Available online: https://github.com/dswatson/bioplotr (accessed on 20 May 2021).
  59. Katz, M.H. Multivariable Analysis: A Practical Guide for Clinicians, 2nd ed.; Cambridge University Press: Cambridge, UK, 2006. [Google Scholar] [CrossRef]
  60. Hummel, T.; Whitcroft, K.L.; Andrews, P.; Altundag, A.; Cinghi, C.; Costanzo, R.M.; Damm, M.; Frasnelli, J.; Gudziol, H.; Gupta, N.; et al. Position Paper on Olfactory Dysfunction. Rhinol. Suppl. 2017, 54, 1–30. [Google Scholar] [CrossRef] [PubMed] [Green Version]
  61. Hummel, T.; Nordin, S. Olfactory Disorders and Their Consequences for Quality of Life. Acta Otolaryngol. 2005, 125, 116–121. [Google Scholar] [CrossRef] [PubMed]
  62. Smeets, M.A.M.; Veldhuizen, M.G.; Galle, S.; Gouweloos, J.; de Haan, A.J.A.; Vernooij, J.; Visscher, F.; Kroeze, J.H.A. Sense of Smell Disorder and Health-Related Quality of Life. Rehabil. Psychol. 2009, 54, 404–412. [Google Scholar] [CrossRef] [PubMed]
  63. Yilmaz, Y.; Karakas, Z.; Uzun, B.; Sen, C.; Comoglu, S.; Orhan, K.S.; Aydogdu, S.; Karagenc, A.O.; Tugcu, D.; Karaman, S.; et al. Olfactory Dysfunction and Quality of Life in Patients with Transfusion-Dependent Thalassemia. Eur. Arch. Otorhinolaryngol. 2017, 274, 3417–3421. [Google Scholar] [CrossRef] [PubMed]
  64. Croy, I.; Nordin, S.; Hummel, T. Olfactory Disorders and Quality of Life–An Updated Review. Chem. Senses 2014, 39, 185–194. [Google Scholar] [CrossRef] [PubMed] [Green Version]
  65. Zou, L.Q.; Hummel, T.; Otte, M.S.; Bitter, T.; Besser, G.; Mueller, C.A.; Welge-Lussen, A.; Bulut, O.C.; Goktas, O.; Negoias, S.; et al. Association Between Olfactory Function and Quality of Life in Patients with Olfactory Disorders: A Multicenter Study in Over 760 Participants. Rhinology 2021, 59, 164–172. [Google Scholar] [CrossRef] [PubMed]
  66. Mattos, J.L.; Schlosser, R.J.; Storck, K.A.; Soler, Z.M. Understanding the Relationship Between Olfactory-Specific Quality of Life, Objective Olfactory Loss, and Patient Factors in Chronic Rhinosinusitis. Int. Forum Allergy Rhinol. 2017, 7, 734–740. [Google Scholar] [CrossRef]
  67. Hefner, R.; Togerson, W.S. Theory and Methods of Scaling. Behav. Sci. 1959, 4, 245–247. [Google Scholar] [CrossRef]
  68. Madany Mamlouk, A.; Chee-Ruiter, C.; Hofmann, U.G.; Bower, J.M. Quantifying Olfactory Perception: Mapping Olfactory Perception Space by Using Multidimensional Scaling and Self-Organizing Maps. Neurocomputing 2003, 52, 591–597. [Google Scholar] [CrossRef]
  69. Seo, H.S.; Lee, S.; Cho, S. Relationships between Personality Traits and Attitudes Toward the Sense of Smell. Front. Psychol. 2013, 4, 901. [Google Scholar] [CrossRef] [Green Version]
  70. Stevenson, R.J.; Attuquayefio, T. Human Olfactory Consciousness and Cognition: Its Unusual Features May Not Result from Unusual Functions but From Limited Neocortical Processing Resources. Front. Psychol. 2013, 4, 819. [Google Scholar] [CrossRef] [Green Version]
  71. Smeets, M.A.M.; Schifferstein, H.N.J.; Boelema, S.R.; Lensvelt-Mulders, G. The Odor Awareness Scale: A New Scale for Measuring Positive and Negative Odor Awareness. Chem. Senses 2008, 33, 725–734. [Google Scholar] [CrossRef] [Green Version]
Figure 1. Raw data of olfactory subtest results or self-ratings of the olfactory sensory function, and their correlations, separately for olfactory diagnosis and gender. The individual data are shown as dots at the lower left half of the correlation matrix, colored separately for men and women and for the olfactory diagnoses of anosmia, hyposmia, or normosmia. The similarly colored regression lines (and 95% confidence intervals) are added for visual guidance; however, the correlations shown in the upper right half of the correlation matrix are non-parametric Spearman’s correlations. The correlations are provided as global correlation (grey numbers) and separately for the subgroups (colored numbers). The two lines of panels on top of the correlation matrix show the original scores as box plots, constructed using the minimum, quartiles, median (solid line within the box), and maximum. The whiskers add 1.5 times the interquartile range (IQR) to the 75th percentile or subtract 1.5 times the IQR from the 25th percentile. The similarly grouped probability density distributions of the scores are shown on the diagonal of the correlation matrix. The two columns of panels left of the correlation matrix display the distribution of the data as stacked histograms. The four panels at the top left of the figure display mosaic plots of the numbers of cases observed in each subgroup that result from the three olfactory diagnoses versus the two genders. Quality-of-life ratings are shown for comparison. The figure has been created using the R software package (version 4.0.5 for Linux; https://CRAN.R-project.org/, accessed on 20 May 2021 (R Development Core Team, 2008)) and the R libraries “ggplot2” (https://cran.r-project.org/package=ggplot2, accessed on 20 May 2021 (Wickham, 2009)), “GGally” (https://CRAN.R-project.org/package=GGally, accessed on 20 May 2021 [45]), and “ggpubr” (https://CRAN.R-project.org/package=ggpubr, accessed on 20 May 2021 [54]). The colors were selected from the “colorblind_pal” palette provided with the R library “ggthemes” (https://cran.r-project.org/package=ggthemes, accessed on 20 May 2021 [55]).
Applsci 11 07279 g001
Figure 2. Correlation coefficients among olfactory subtest results or self-ratings of the olfactory sensory function, separately for olfactory diagnosis and gender. Coefficients of correlation for each pair of variables with self-rating scale #1, sorted for decreasing magnitude, and their 95% bootstrap confidence intervals [57]. Significant correlations are indicated in a red-brown color. On the right, the sample size, N, of the respective correlation is shown as a horizontal bar. The figure has been created using the R software package (version 4.0.5 for Linux; https://CRAN.R-project.org/, accessed on 20 May 2021 (R Development Core Team, 2008)) and the libraries “ggplot2” (https://cran.r-project.org/package=ggplot2, accessed on 20 May 2021 (Wickham, 2009)), “GGally” (https://CRAN.R-project.org/package=GGally, accessed on 20 May 2021 [45]), “inspectdf” (https://CRAN.R-project.org/package=inspectdf, accessed on 20 May 2021 [46]) and “ggpubr” (https://CRAN.R-project.org/package=ggpubr, accessed on 20 May 2021 [54]). The colors were selected from the “colorblind_pal” palette provided with the R library “ggthemes” (https://cran.r-project.org/package=ggthemes, accessed on 20 May 2021 [55]).
Applsci 11 07279 g002
Figure 3. Results of a principal component analysis. Projection of the 151 × 7 data matrix comprising of the three olfactory subtest results, the TDI sum score, the two olfactory self-ratings, and the quality-of-life ratings obtained in n = 151 patients. (A) Scree-plot of the amount of variation of the data captured by each principal component (PC). (B) Computed ABC analysis of the eigenvalues of the PCs shown in panel A as an alternative method for the selection of the relevant PCs as demonstrated in [38]. The ABC plot (blue line) shows the cumulative distribution function of the eigenvalues, along with the identity distribution, xi = constant (magenta line), and the uniform distribution (green dotted line). The red lines indicate the borders between ABC sets “A”, “B” and “C”. Only set “A” containing the most profitable items was selected, i.e., PCs 1 and 2. (C) Plots the eigenvectors of the variables in PCA dimensions (Dim) 1 and 2. (D,E) Bar graphs of the contributions of each variable to PC1 and PC2, respectively. The dashed horizontal reference lines correspond to the expected value if the contribution where uniform. (F) Plots the eigenvectors of the variables in the two dimensions of a nonlinear PCA [42]. The figure has been created using the R software package (version 4.0.5 for Linux; https://CRAN.R-project.org/, accessed on 20 May 2021 (R Development Core Team, 2008)) and the libraries “ggplot2” (https://cran.r-project.org/package=ggplot2, accessed on 20 May 2021 (Wickham, 2009)), “ggpubr” (https://CRAN.R-project.org/package=ggpubr, accessed on 20 May 2021 [54]), “FactoMineR” (https://cran.r-project.org/package=FactoMineR, accessed on 20 May 2021 [37]), “ABCanalysis” (https://cran.r-project.org/package=ABCanalysis, accessed on 20 May 2021 [38]) and bioplotr (https://github.com/dswatson/bioplotr, accessed on 20 May 2021 [58]).
Applsci 11 07279 g003
Table 1. Studies (in order of publication year) that use olfactory self-ratings. The list is based on a PubMed database at https://pubmed.ncbi.nlm.nih.gov on 19 May 2021 using the string “((“self-rating” OR “self-ratings” OR “self-estimate” OR “self-estimates”) and (sense of smell OR olfaction)) NOT review[PT]”, followed by the curation of the hits.
ReferenceSubjects [n] (Total Sample)SettingRating ScaleOlfactory TestVerdict
[2]63Laryngectomy7-point NRSThreshold (PEA), discrimination (8 odors)High correlation
[3]60 and 23Healthy volunteersVASThreshold, discrimination, identification (Sniffin’ Sticks)No correlation (n = 60) or present correlation (n = 23)
[4]100Pregnant women7-point NRSIdentification (UPSIT)No correlation
[5]36Healthy volunteersVASIdentification (n-butanol), 10-item identification (CCCRC)Good correlation
[6]1311Twins, general population7-point NRSIdentification (6 odors)No correlation
[7]211General population5-point NRS, VASIdentification (16 odors)Weak correlation
[8]1005General population4-point NRS, VASIdentification (16 odors)No correlation
[9]1082General population5-point NRSNone-
[10]31Healthy volunteersVASThreshold, discrimination, identification (Sniffin’ Sticks)Not tested
[11]31Fibromyalgia3-point NRSThreshold, discrimination, identification (Sniffin’ Sticks)Poor correlation
[1]80Nasal polyposisVAS based DyNaChron questionnaireThreshold (n-butanol), identification (16 odors)Strong correlation
[12] Pregnant women9-point NRSThreshold (PEA),Poor agreement
[13]75Patients with olfactory dysfunction9-point NRSThreshold, discrimination, identification (Sniffin’ Sticks)No correlation
[14]1422General population and olfactory dysfunction5-point NRSIdentification (16 odors)Low but significant correlation
[15]162HIV infection1-point NRSThreshold, discrimination, identification (Sniffin’ Sticks)Self-ratings and test results differed
[16]9Nasopharyngeal carcinoma10-point NRS, 6-point NRSOlfactory event-related potentialsSignificant correlation
[17]117 (44 tested)General population7-point NRSIdentification (14 odors)No correlation
[18]1555Olfactory loss5-point NRSThreshold (n-butanol), Identification (CCSIT)Significant correlation
[19]193ChildrenQuestionnaireDiscrimination, identification (Sniffin’ Sticks), Threshold (5 odors; T&T)No correlation
[20]6049General population and olfactory dysfunction5-point numerical12-item odor identificationModerate agreement
[21]52Nasal polyposis10-point NRSThreshold, discrimination, identification (Sniffin’ Sticks)High correlation
[22]203Olfactory dysfunction10-point NRSThreshold, discrimination, identification (Sniffin’ Sticks)Weak significant correlation
PEA: phenylethyl alcohol; VAS: visual analogue scale; NRS: numerical (ordinal) rating scale; CCCRC: Connecticut Chemosensory Clinical Research Center (CCCRC) olfactory test; UPSIT: University of Pennsylvania Smell Identification Test; T&T: Detection threshold and recognition threshold olfactometry; CCSIT: Cross-Cultural Smell Identification Test DyNaChron: Questionnaire for Chronic Nasal Dysfunction.
Table 3. Performance of the assignment to the TDI based olfactory diagnoses either for the three-diagnoses setting of anosmia, hyposmia, or normosmia, or for each diagnosis separately, from the olfactory self-ratings based on the best-performing rules as established in an exhaustive search (Supplemental Figure S2). The results represent the medians and 95% confidence intervals of the performance measures obtained during 1000 runs using bootstrapped resampling of each 100 cases from the original data set.
ParameterThree DiagnosesAnosmiaHyposmiaNormosmiaThree DiagnosesAnosmiaHyposmiaNormosmia
Men Women
Rating scale 1
Sensitivity, recall60 (29.4–87.2)75.7 (60.6–87.5)42 (28.6–55.1)60 (25–90)59.3 (41.2–90)58.3 (45.3–72.3)54.1 (39.5–69.1)71.4 (40–100)
Specificity78.1 (61.9–88.7)80 (69.4–90.3)72.2 (58.5–84.5)80.2 (72–88.8)76.8 (60.8–100)96.7 (90.7–100)69.2 (57.6–81)75.3 (66.3–83.9)
Positive predictive value, precision59.5 (13–80)69.2 (55.3–83.8)61.5 (44.4–76.9)25 (8.7–44.5)53.9 (16.1–100)95 (84–100)53.8 (38.9–69.2)26.9 (12.5–44.4)
Negative predictive value84.4 (44.6–98.5)84.5 (73.9–92.2)53 (41.4–65.7)94.7 (88.6–98.7)74.1 (59.7–98.6)71.4 (60.6–81.5)69.4 (57.6–79.7)95.5 (90–100)
F151.1 (20–80)72 (60–82.1)50 (36.1–61.2)35.9 (14.3–55.8)54.5 (25–80.6)72.4 (60.6–83)53.8 (40.6–66)38.9 (19.3–57.1)
Balanced Accuracy69.5 (49.5–84.6)77.5 (68.8–85.5)56.8 (47–65.7)70.4 (53–86.1)72 (54.6–85.1)77.7 (70.4–85.2)61.7 (52.4–71)73.3 (58.4–87.5)
Rating scale 2
Sensitivity, recall59.3 (26.6–94.3)86.7 (74.2–97.1)54 (38.9–68.3)50 (18.2–81.8)70.6 (33.3–92.9)82.9 (71.4–93.2)45.5 (29.7–61.9)71.4 (40–100)
Specificity80.9 (65.6–95.5)75 (63.8–85.7)78.7 (65.8–88.9)90.9 (84–96.6)82.6 (69.6–98.4)80.5 (69.4–91.1)94.8 (87.9–100)77.3 (68.5–85.5)
Positive predictive value, precision65.2 (20–83.3)67.3 (54.3–80.5)73.5 (57.8–87.1)38.5 (12.5–66.7)77.3 (16.7–95.7)80 (68–90.2)85 (66.7–100)28.2 (13.8–45.5)
Negative predictive value89.8 (52.2–97.8)90.6 (81.1–98)61 (48.5–72.9)94.2 (88.5–97.8)83.3 (64.8–98.6)83.3 (73.1–93.8)72.4 (62–81)95.7 (90–100)
F162.9 (23.5–82.7)75.7 (65.1–84.4)62.1 (48.2–73.3)42.9 (17.4–66.7)59.5 (26.1–87.5)81.3 (72.1–89.1)59.1 (43.1–73.4)40.8 (20.5–58.5)
Balanced Accuracy72.1 (56.5–86.7)80.6 (72.5–87.8)66.3 (56.6–75)70.3 (54.4–86)75.3 (61.5–88.1)81.9 (73.9–89.3)70 (61.7–78.6)74.2 (58.9–88.2)
Combined rating scales 1 and 2
Sensitivity, recall66.7 (26.6–85.3)75.7 (60.6–87.5)66 (52.2–78.7)50 (18.2–81.8)70.6 (33.3–92.9)82.9 (71.4–93.2)45.5 (29.7–61.9)71.4 (40–100)
Specificity84.6 (59.6–95.5)84.9 (75–93.2)69.8 (56.2–81.8)90.9 (84–96.6)82.6 (69.6–98.4)80.5 (69.4–91.1)94.8 (87.9–100)77.3 (68.5–85.5)
Positive predictive value, precision68.1 (20–85)75 (60.5–88.6)70.2 (56.5–82.1)38.5 (12.5–66.7)77.3 (16.7–95.7)80 (68–90.2)85 (66.7–100)28.2 (13.8–45.5)
Negative predictive value85.1 (55.6–97.6)85.2 (75.4–92.6)65.3 (51.1–78.3)94.2 (88.5–97.8)83.3 (64.8–98.6)83.3 (73.1–93.8)72.4 (62–81)95.7 (90–100)
F167 (23.5–82.2)75 (63.4–84.8)68 (56–77.2)42.9 (17.4–66.7)59.5 (26.1–87.5)81.3 (72.1–89.1)59.1 (43.1–73.4)40.8 (20.5–58.5)
Balanced Accuracy72.6 (57.3–86.1)80 (72.1–87.4)67.8 (58.4–76)70.3 (54.4–86)75.3 (61.5–88.1)81.9 (73.9–89.3)70 (61.7–78.6)74.2 (58.9–88.2)
Publisher’s Note: MDPI stays neutral with regard to jurisdictional claims in published maps and institutional affiliations.

