1. Introduction
Wet friction clutch is an important component of a transmission. Wet friction clutch is often used in tracked vehicles [
1]. The torque converter is adopted to achieve uninterrupted power shift and reduce the shift impact. However, the efficiency of hydraulic torque converter is relatively low. In order to decrease the frequency of shifting and improve the efficiency of a transmission system, a binary logic automatic transmission is presented. The related products have been used in military vehicles [
2]. The characteristics of the transmission are quasi-infinitely variable, and the efficiency is higher than 90%.
The conical groove surface configuration is a novel design in the transmission. The conical groove friction disks, which transfer torque through the cone, are used to replace the conventional plane friction disks. The conical configuration can also be seen in the synchronizer system. In cone synchronization systems, friction cone is used to increase the area of friction surface. Conical surface configuration is an effective method to improve the torque capability of the transmission.
The friction behavior of wet friction disks is critical for transmission applications. The multi-cone configuration influences the stability of the torque transfer significantly. It is important that the friction disk provides a relatively stable dynamic coefficient of friction. Experimental investigations of the friction characteristics of friction disks have been implemented.
Daniel [
3] used rig test to determine the sliding speed and axial force, as well as the coefficient of friction in a synchronizer system. Alizadeh [
4] studied the frictional models of the wet cone clutch system, and the frictional behavior was described by the Stribeck curve. Nakada [
5] evaluated the static friction coefficient and the stick-slip properties. Zhang [
6] established a dynamic model of friction pair bearing capacity, friction torque, and clutch shift engagement, and the relationship between damping coefficient and dynamic friction coefficient was revealed. However, their test objects were still the traditional disks, and these traditional calculation models could not apply to the new conical groove friction disk.
Marklund [
7,
8] developed a simplified experiment (a pin on disk test) to investigate the boundary friction behavior of a wet clutch and described the effect on temperature, velocity, and surface pressure on the friction process. However, the temperature distribution of different models was different, so it was difficult for the simplified model to achieve good simulation effect at high temperature. Nyman [
9] investigated the topography of the sintered friction material. Lingesten [
10] designed a wet clutch apparatus to investigate wet clutch engagement. The effects of the sliding velocity, torque and temperature were discussed. Lingesten [
10] used a test rig to continuously monitor the clutch engagement characteristics in the clutch, which was similar to the SAE #2. The SAE #2 experiments were used to test the friction disks in complex conditions, but the test was complex and costly. Ost [
11] utilized a pin-on-disk test rig to investigate the friction characteristics of the friction disk. The friction coefficients under different operating conditions were measured. Compared with the pin-on-disk test, the contact area and contact state of the conical groove friction disk are quite different.
Al-Mayah [
12] presented a three-stage load-slippage relationship to represent the general friction behavior of the carbon-fiber-reinforced-polymer-metal (CFRP) interface. Similar behavior was observed by Mohee [
13] with CFRP–copper and CFRP–aluminum couples [
14]. Farfán [
15,
16] carried out a series of pin-on-disk tests to evaluate the frictional behaviors of different lubricants. The pin-on-disk test was applicable to evaluate the friction behavior of friction disks, but could not evaluate the multi-cone configuration. Neupert [
17,
18] presented a transient 3D CFD simulation model, which enabled to calculate the flow behaviour and drag torque of a disengaged wet clutch disk. Wang [
19,
20] presented a mathematical model of the drag torque of the disengaged wet clutch by considering the effects of grooves and waviness on the friction plates. Wu [
21,
22] established a comprehensive numerical model, which took radial grooves, hydrodynamic, mechanics of elasticity, plasticity contact, and thermal effect into consideration. This model solved the domain decomposition of groove area by coupled finite element method. Ye [
23,
24] investigated the friction and wear performance of commercially available unidirectional CFRP plates in contact with the roughened mold steel plates through a comprehensive experiment. However, this simplified model lacked test verification. Especially for the new type of conical groove friction disk, the friction calculation model and experimental data are even less. Recently, Wu [
25] investigated the friction coefficient of multi-cone friction pair under different loads and different speeds, and research shows that the multi-cone structure influences the frictional behaviors of the friction specimens.
In this paper, the friction model of conical groove friction disk is established, and the friction coefficient is calculated by equivalent radius and is developed based on the previous work by Wu et al. [
25]. An experimental investigation is designed to analyze the influences of different cone configuration parameters on behaviors of conical groove friction disks. Frictional specimens with different configuration parameters are designed and the influences of configurations parameters are obtained. The results can be suitable for the friction components in engineering practice.
2. Friction Model for Conical Friction Element in Wet Clutch
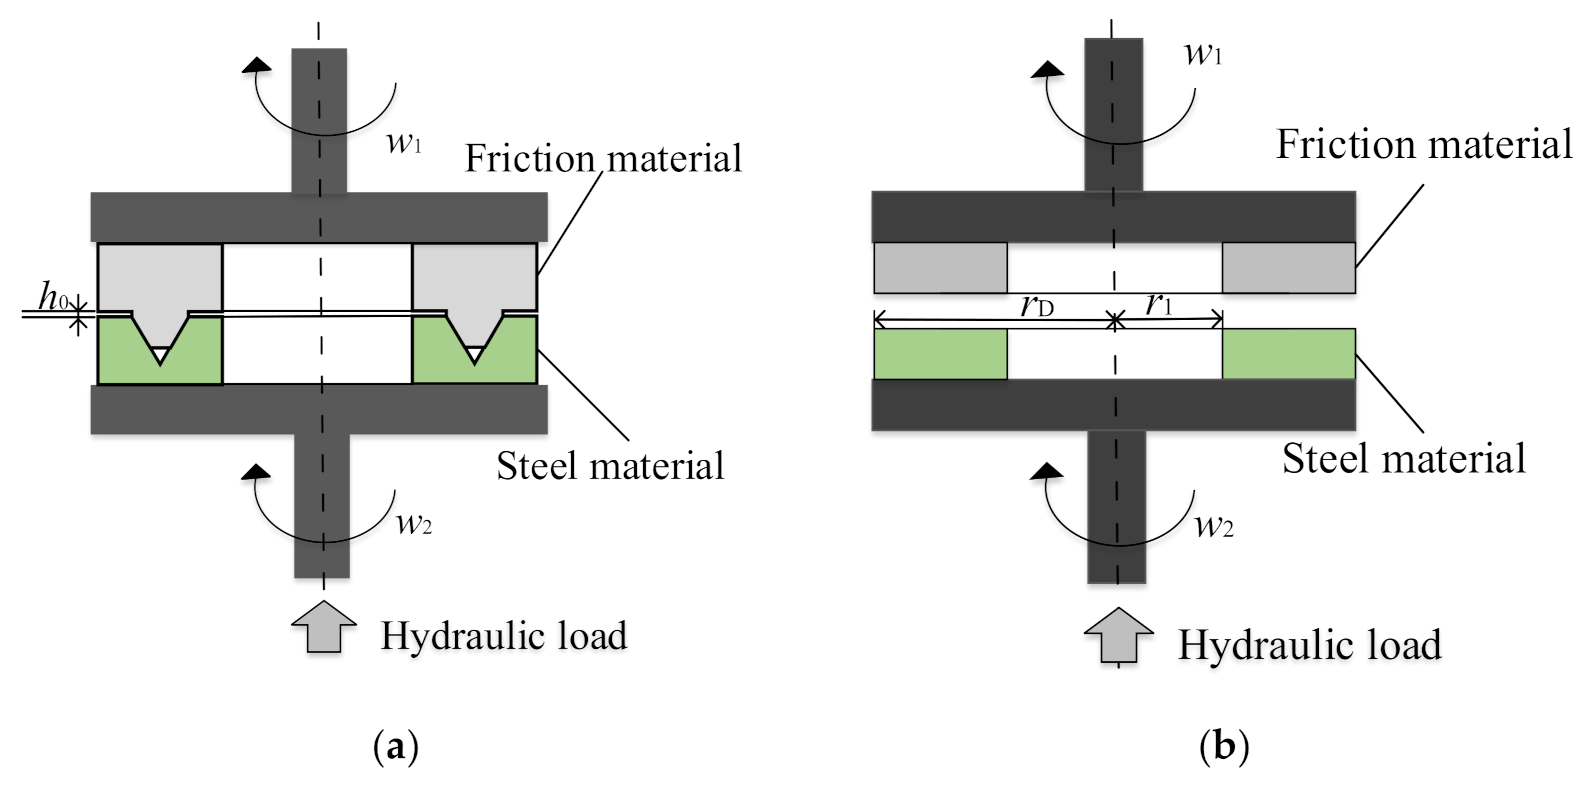
Wet friction clutch is an important component of a transmission. As shown in
Figure 1, the single cone friction pair is designed with two conical friction surfaces. The friction torque is generated by the conical interfaces and directly depends on the friction coefficient and the conical structure.
In the process of contact, the two cone surfaces of the single cone friction element contact with each other. The clearance between the friction disk and the separator disk is h0, the inner diameter of the friction element is Ri, the outer diameter is Ro, the cone angle is α, the equivalent inner diameter is r1, and the equivalent outer diameter is rD. The rotation speed of friction disk is ω1, the separator disk starts to rotate under the action of oil film shear torque, the rotation speed is ω2, and the hydraulic load of the separator disk is F.
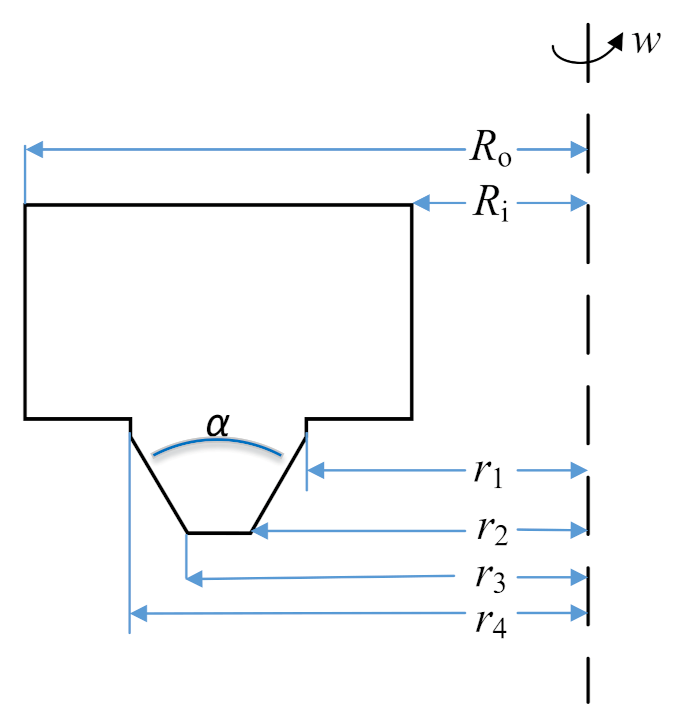
As shown in
Figure 2,
Ri are
Ro are the inner and outer radius, respectively;
r1,
r2,
r3, and
r4 are the vertices of the conical surfaces. The normal force is applied on the back of the friction disk.
All calculations are based on the Reynolds equation, and the pressure distribution is assumed to be constant. According to the cone friction calculation method [
25], the equivalent radius calculation of conical friction element is carried out.
The equivalent radius is used to describe the conical feature. As shown in
Figure 1, the conical friction surface is equivalent to a plane disk with an external radius of
and an internal radius of
r1. The equivalent radius
of the cone surface can be calculated as Equation (1).
The instantaneous friction coefficient
can be calculated as Equation (2):
where,
T is the belt torque, which can be obtained by the test.
F is the hydraulic load of the separator disk. (The equivalent radius
and internal radius of
are shown in
Figure 1b)
The working pressure
of friction disk can be calculated as Equation (3):
3. The Speed Test
In order to evaluate the friction performance of conical friction pairs under constant speed conditions, a speed test is designed. The influences of configuration parameters on the friction coefficient curve under constant speed condition are evaluated.
3.1. Test Machine
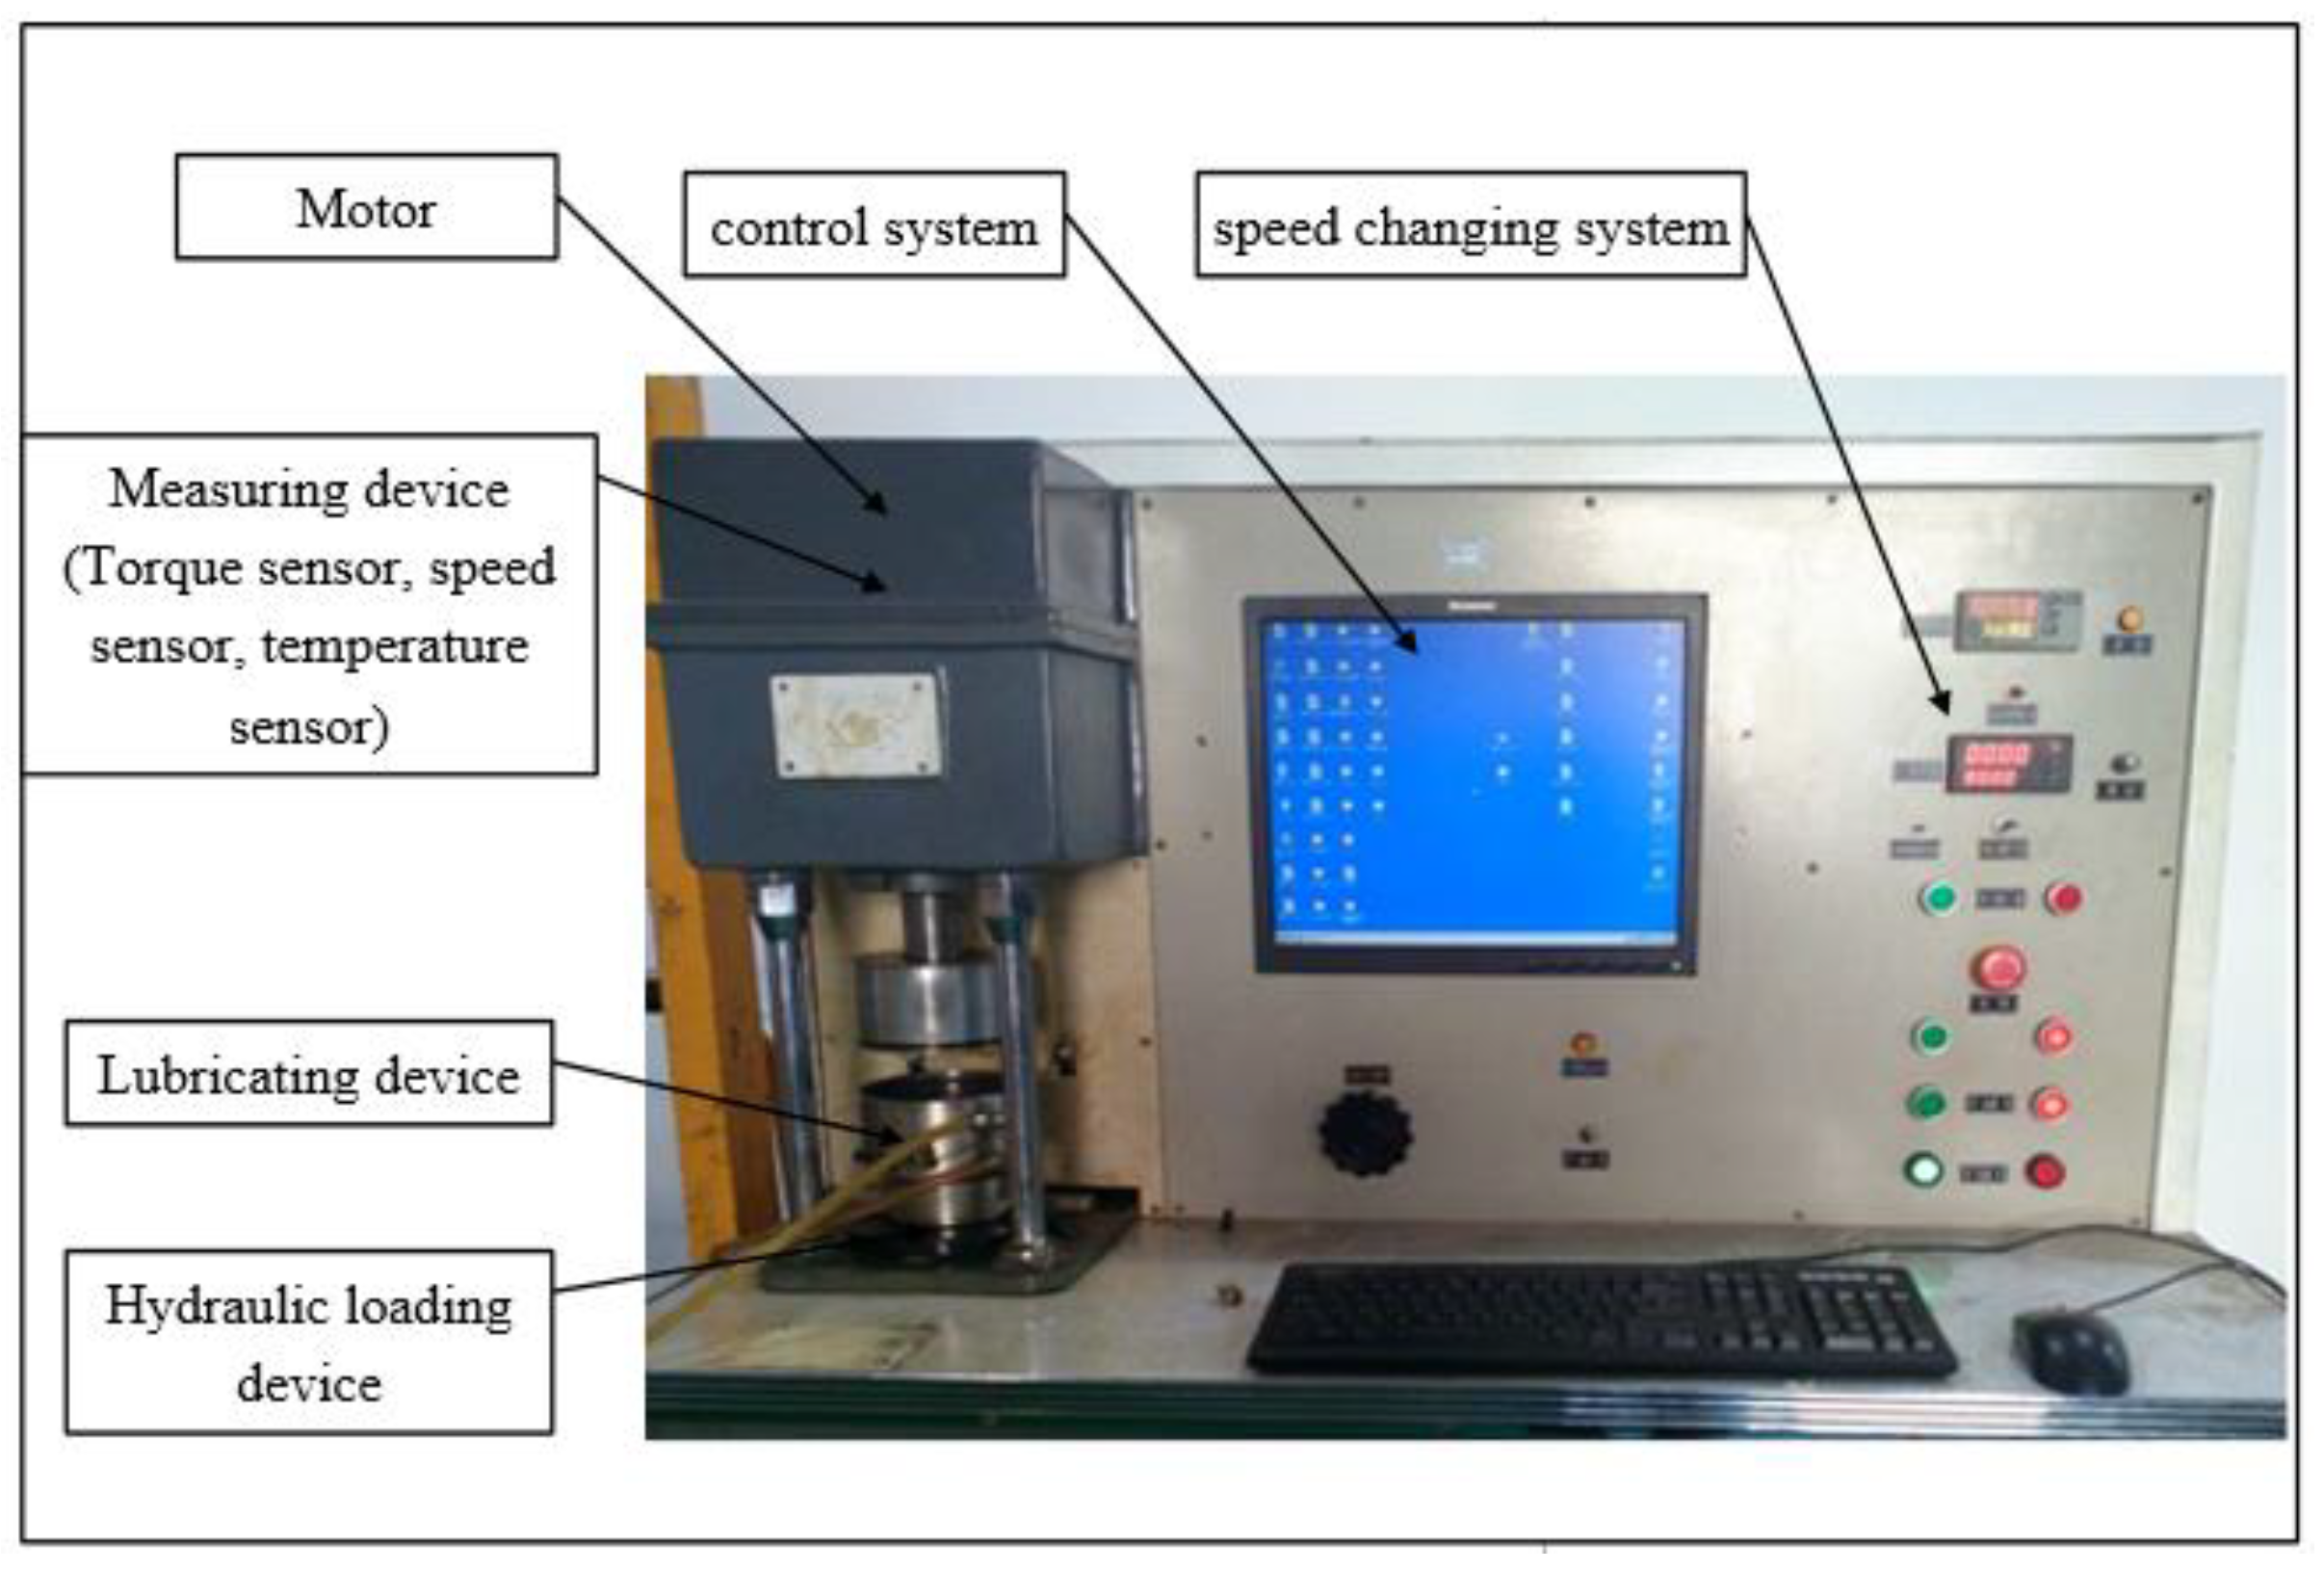
A multifunctional test machine (designed in our laboratory, see
Figure 3) is established to measure frictional behaviors of friction disks in wet clutch. The test rig mainly consists of hydraulic loading device, measuring device, control system, lubricating device, and speed changing system. An AC motor with rated power of 3 kW at a rated speed of 2800 r/min was employed to drive the friction disks. The speed and drag torque were measured by a speed sensor and torque sensor. Friction and separated disks are installed in the test box. A lubricant supply system provides lubricant flow to the test rig, and the lubricant supply flow is 4 L/min.
Figure 4 is the schematic diagram of the friction test equipment. Normal force on the test is applied by a hydraulic loading device. The closed-loop control can improve the load stability. The friction disk is connected to the driving shaft, and the separator disk is connected to the driven part. During the operation, the up parts are rotating. Torque, force, rotating speed are measured by the measuring device.
Table 1 lists the main components of the test rig.
3.2. Test Specimens
Four conical friction specimens with different configuration parameters are developed. As shown in
Figure 5, the outer radius is
Ro; the inner radius
Ri; the thickness is b; the cone angle is
; and the cone height is h. Cone angle
and cone height h are the main conical configuration parameters. The cone angle is mainly decided by the design torque. The distribution of temperature of the friction disk affected the friction coefficient, and a bigger value of the angle tends to reduce the effect of the temperature on the friction period.
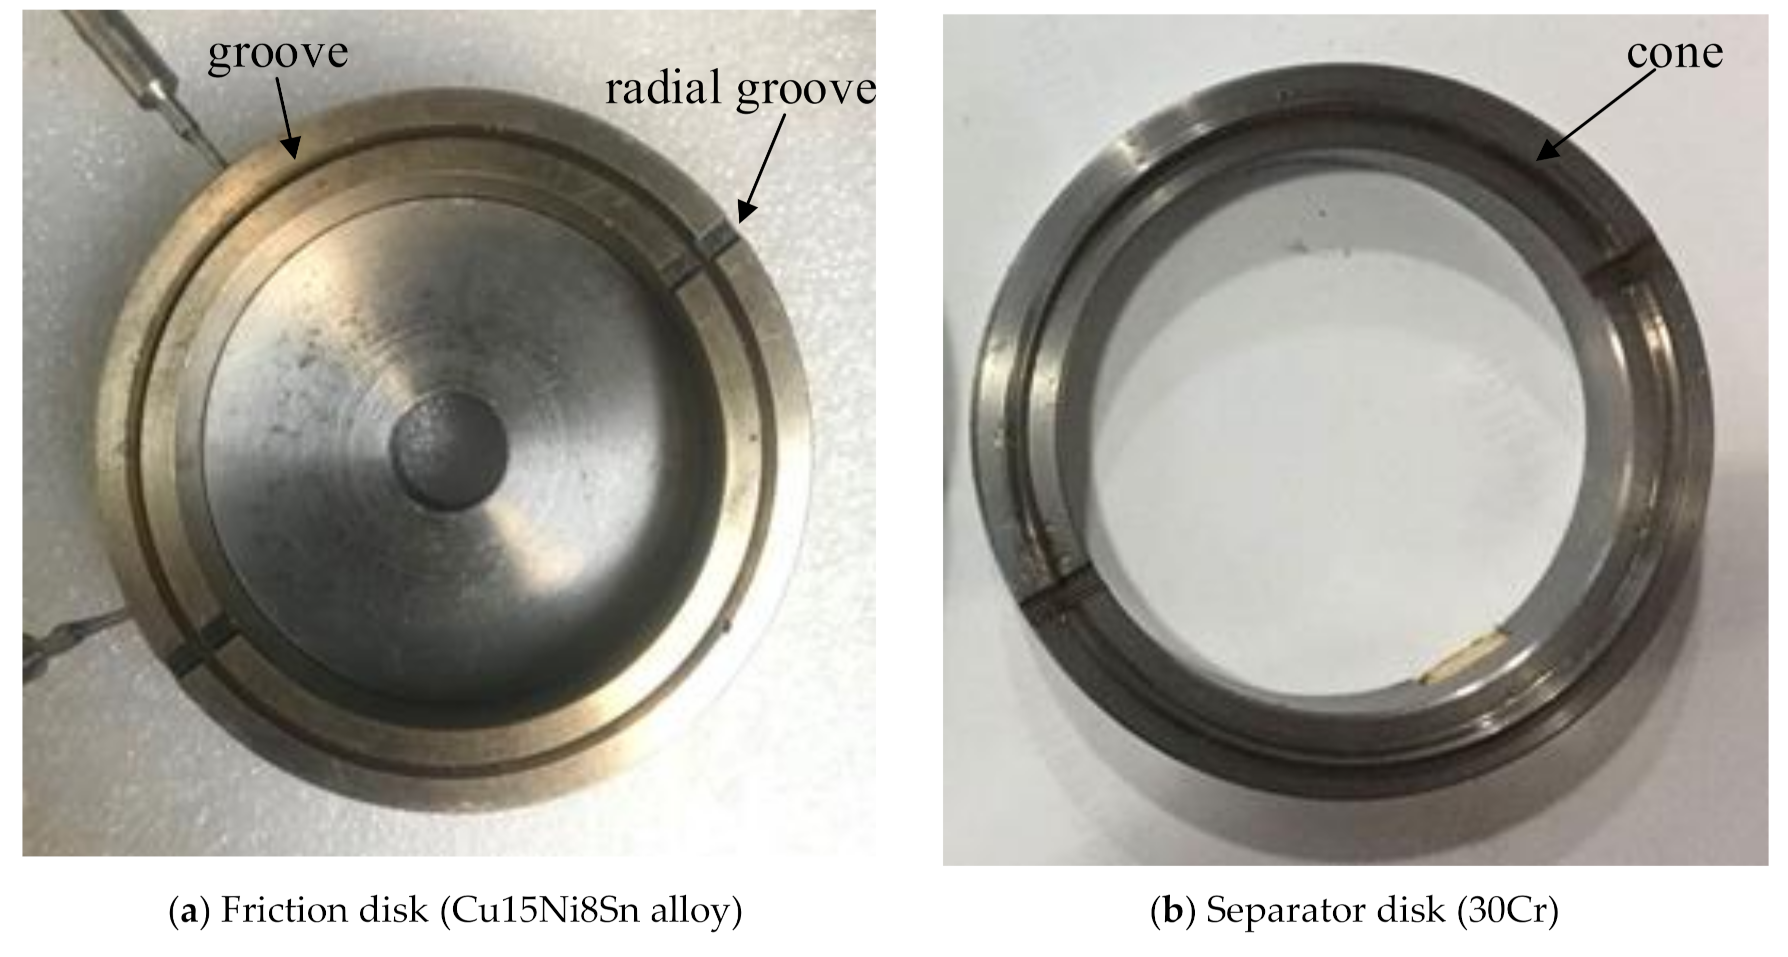
Radial grooves (
Figure 6a) are intended to facilitate lubrication and help lower the temperature of the contact area. The cone height is mainly decided by the whole thickness of the friction disk. The height of the cone (
h) is typically between a third and a half of the thickness of specimens (
b).
The configuration parameters of test specimens are listed in
Table 2. The outer diameter and inner diameter are designed as constant. The cone angle
and the cone height h of the conical structure are the main variables.
Test specimens with cone angle of 45° and cone height of 3 mm can be seen in
Figure 6. The material of friction disk is Cu15Ni8Sn–copper alloy. The separator disk is made of steel 30Cr. The mean surface roughness Sa of friction disk and separator disk are 0.3 ± 0.1 μm.
The basic physical properties of the disks are shown in
Table 3. Cu15Ni8Sn is widely used in ships to achieve excellent abrasion resistance capability. Its main element proportions and mechanical properties are shown in
Table 4.
3.3. Test Conditions
In the experiment, a stable force is applied by hydraulic loading system first, then the motor rotated. At the same time, the friction torque and friction coefficient are recorded automatically.
In order to reduce the influence of temperature on the friction coefficient test, the oil temperature is controlled at 30 ± 2 °C (temperature control is obtained by installing a temperature detection and heating device in the oil return tank).
In order to reduce the influence of manufacturing error on the test, a 30 min running in experiments is carried out for each specimen under constant load condition before the test (test conditions of running in: speed is 800 rpm, force is 400 N). A relatively stable friction coefficient was achieved. Multiple groups of tests are performed to guarantee data consistency.
The working pressure of friction disks is 1 MPa and the working speed is under 3000 rpm. The critical torque of the friction disks is 100 Nm and the critical radial temperature is 300 °C. According to the actual application condition of the tracked vehicles, the friction coefficient is relative stable upon the speed of 800 rpm; the test condition is set as shown in
Table 5. Test condition S1 is used to define the lubrication regime. Test conditions S2, S3, and S4 are used to evaluate the friction performance of the speed condition.
As shown in
Figure 7, the variable speed process is about 240 s, and the maximum speed is 800 rpm. The normal force is constant throughout the test. The test is divided into three phases: the increase speed phase, the constant speed phase, and decrease speed phase. The speed is increasing from 1 rpm to 800 rpm in the first 60 s, and then the speed is kept at 800 rpm for 120 s, then speed begins to decrease from 800 rpm to 0 rpm in 60 s.
4. Results and Discussion
A series of variable speed tests were conducted to study the frictional behaviors of the conical friction pair. Typical friction coefficient, speed, friction torque, and force curves of conical friction pair (T1) under variable speed conditions are given in
Figure 8. The normal force is kept as 600 N throughout the test; the speed varies approximately linearly in the whole test procedure. The friction coefficient and friction torque of Cu15Ni8Sn alloy materials show a symmetrical trend as the speed increases and decreases.
In the acceleration phase (0–60 s), the speed increases from 0 rpm to 800 rpm, and the friction coefficient decreases (The average friction coefficient is 0.044). In the constant speed phase (60–180 s), the speed is stable at 800 rpm, and the friction coefficient remains relatively stable (The average friction coefficient is 0.035). In the deceleration phase (180–240 s), the speed decreases from 800 rpm to 0 rpm, and the friction coefficient increases (the average friction coefficient is 0.041).
4.1. The Lubrication Regime
The Stribeck curve is always used to define the lubrication regime of the friction. The friction coefficient is closely related to the lubrication conditions. The viscosity characteristics of lubricating oil, normal force, and rotating speed can define the lubrication regime. When the speed is defined as a constant, we can evaluate the lubrication regime with the relationship between friction coefficient and the normal force instead of the Stribeck curve.
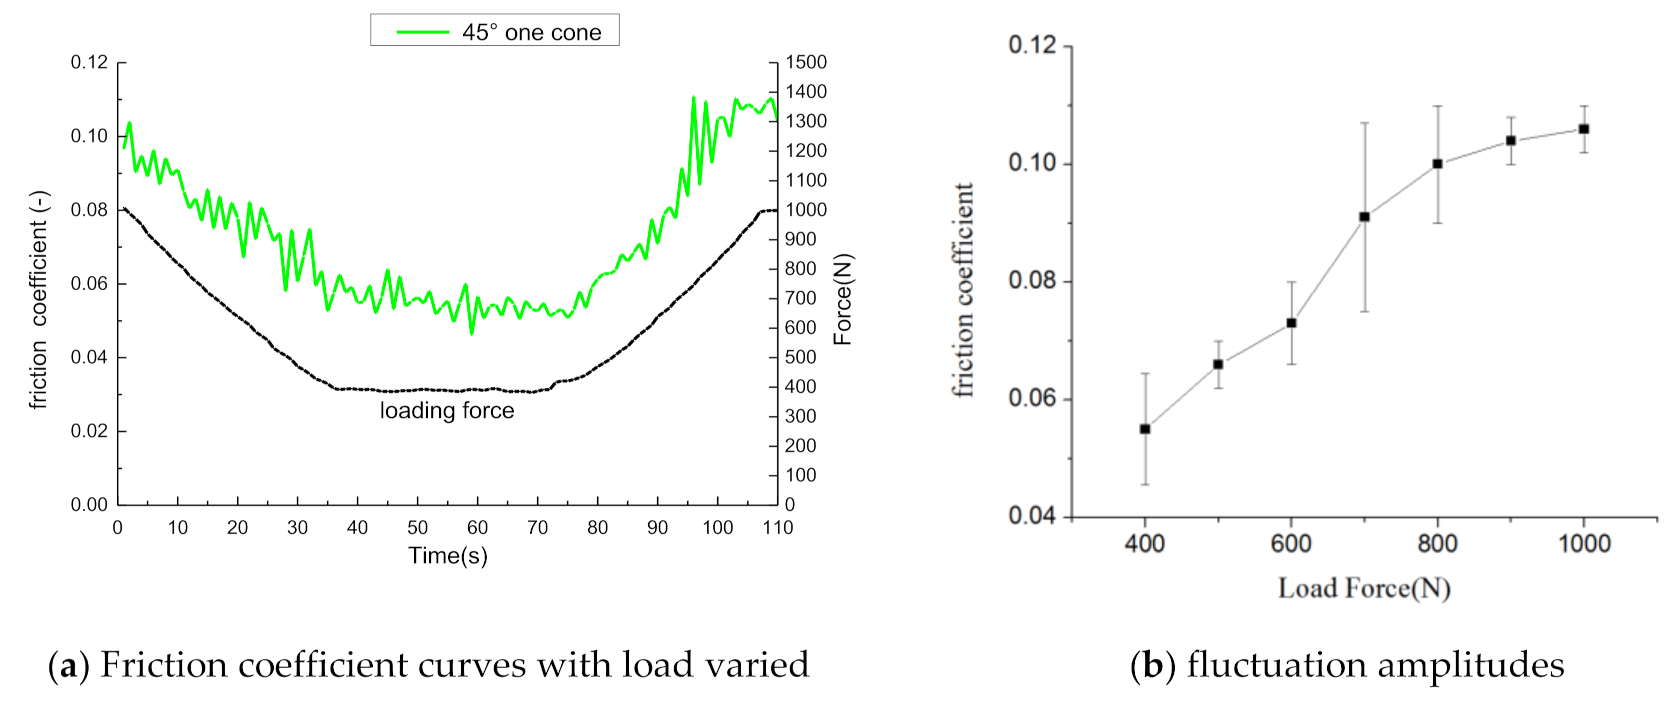
As seen in
Figure 9a, the normal load decreases from 1000 N to 400 N, kept at 400 N for 30 s, then increases from 400 N to 1000 N. The speed is 800 rpm. The normal load has a significant influence on the friction coefficient of the conical groove friction disk.
Figure 9b shows that with the increase of load, the friction coefficient of the conical groove friction disk increases steadily, but the fluctuation amplitude first increases and then decreases.
It implies that the friction coefficient decreases when the load decreases, and increases when the load increases. The friction coefficient is about 0.06 when the axial force is kept at 400 N. The friction coefficient and the load are positively correlated. The friction coefficient is affected by the adhesion of liquid and the asperity contact area. The mixed lubrication regime is dominant during the test.
4.2. The Friction Coefficient Curves with Different Load
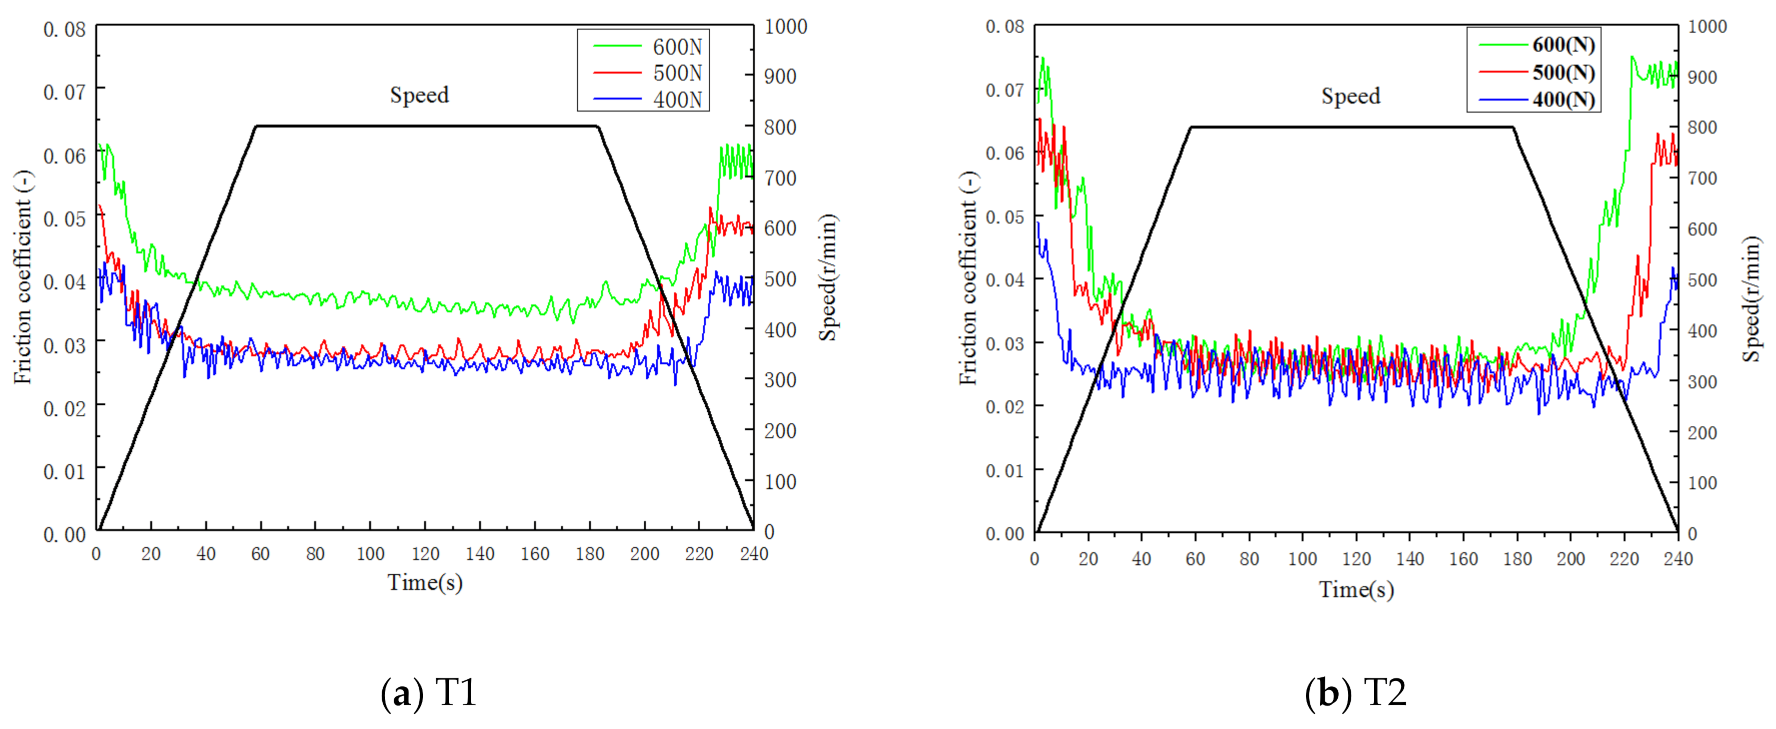
The friction coefficient curves of four kinds of friction disks under different loads are given in
Figure 10.
Figure 10a is the friction coefficient curve of test specimen T1. The maximum (average) friction coefficient and pressure value under 400 N, 500 N, and 600 N are given in
Table 6.
The maximum friction coefficient value under the load of 600 N is the largest. In the acceleration phase, the friction coefficient decreases first and then becomes stable. In the deceleration phase, the friction coefficient rises slowly first and then rapidly goes to locking friction. The friction coefficient value of 600 N in constant speed period is larger than that of 400 N and 500 N. The friction coefficient curves of 400 N and 500 N are close.
Figure 10b is the friction coefficient curve of test specimen T2. When the speed is kept at 800 rpm, the friction coefficient values are basically the same. The fluctuations in the friction coefficient become larger than that of 45° cone angle.
Figure 10c is the friction coefficient curve of test specimen T3. The fluctuation in the friction coefficient under 500 N is the largest.
Figure 10d is the friction coefficient curve of test specimen T4. When the speed is kept at 800 rpm, the friction coefficient values of 400 N and 500 N are basically the same.
Figure 10 shows the different COF behaviors of four kinds of friction disks with the same velocity. The cone height and angle of the friction disk greatly influence the strength and frequency of the stick-slip phenomenon. With the increase of cone angle, the frequency of stick-slip phenomenon increases. With the increase of cone height, the strength of stick-slip phenomenon decreases.
The pressure of T2 is relatively low. The friction coefficient in the constant speed stage is relatively stable. The pressure of T3 is about 1 MPa, while the friction coefficient is almost equal to T1.
The relative change rate of the friction coefficient is defined as the following Equation (4).
The friction coefficient value of 600 N in the constant speed period is larger than that of 400 N and 500 N. At the same time, the friction coefficient under test conditions S4 (600 N, 800 rpm) is more stable and representative, so the data under S4 is used for comparative analysis in the next test.
Where
and
are the relative change rates of friction coefficient, the maximum friction coefficient, and the average friction coefficient, respectively. The friction coefficients under 600 N of different friction specimens are listed in
Table 7. The relative change rate of friction specimen T2 is the biggest.
4.3. The Friction Coefficient Curves with Different Cone Angles
The friction coefficient curves with different cone angles are given in
Figure 11. In
Figure 11a, the axial force is 600 N, and the cone height is 3 mm. The pressure of T3 and T4 are 1.39 MPa and 0.84 MPa, respectively. The pressure on the conical surface decreases when the cone angle increases. The friction coefficient of T4 is bigger than that of T3. During the constant speed period, the friction coefficient of T3 is more stable. In
Figure 11b, the axial force is 600 N and the cone height is 4 mm. The pressure of T1 and T2 are 0.85 MPa and 0.61 MPa, respectively. During the constant speed phase, the friction coefficient of T1 is bigger than that of T2. The cone angle can affect the contact state. When the load is equal, the smaller cone angle can increase the friction coefficient.
Figure 11a shows that the friction disk with the cone height h = 3 mm has stronger stick-slip phenomenon. When h = 3 mm, the contact area of the friction disk is small, the contact state is unstable, and COF fluctuates obviously. When h = 4 mm, the contact area of the friction disk increases, the stick-slip phenomenon weakens, and the fluctuation of COF decreases.
Compared with
Figure 11a,b, the characteristic of COF has an opposite role when h = 3 mm and h = 4 mm. The main reason is that when h = 3 mm, the contact area is small, the contact state is unstable, and the cone angle has great influence; when h = 4 mm, the contact area is larger, the contact state is more stable, and the influence of height is greater.
4.4. The Friction Coefficient Curves with Different Cone Height
The friction coefficient curves with different cone height are shown in
Figure 12. In
Figure 12a, the cone angle is 45°. The friction coefficient of T1 cone height is lower than that of T3, but it is more stable in the constant speed stage. In
Figure 12b, the cone angle is 60°, the friction coefficient of T2 is smaller than that of T4, but it is more stable during the constant speed period. Friction coefficient curve of 4 mm cone height gives a better dynamic friction coefficient.
Compared with
Figure 12a,b, when the cone angle of friction disk
5°, the friction coefficient decreases slightly with the increase of cone height. When the cone angle of friction disk
0°, the friction coefficient decreases obviously with the increase of cone height.
4.5. Stability of Friction Coefficient of Friction Specimens
The stability of the friction coefficient is defined as the following Equation (5).
where
and
(
) are the stability coefficient and the maximum (minimum) friction coefficient in constant speed phase, respectively.
The friction coefficients under 600 N of different friction specimens are listed in
Table 8.
The stability of the friction specimen T4 is rather poor, T4 had bigger stick-slip phenomenon. The stability coefficient of T1 is 0.118, which is significantly lower than that of T2, T3, and T4. Judging from the stability of the friction disks, T1 is the best.
4.6. Maximum Surface Temperature of Different Specimens under Constant Working Condition
In
Figure 13, maximum surface temperature of different specimens under constant working condition during the 10-s continuous sliding friction condition is given. The axial force is set to 500 N, speed is 800 rpm.
As shown in
Figure 13, the temperature rise of different specimens is 45.17 °C, 41.80 °C, 41.02 °C, and 38.01 °C. It can be seen that the changes of cone angle and cone height have an obvious impact on the surface temperature of friction disk, and the change of cone height has a greater impact on the temperature. Compared with the cone angle, increasing the cone height of the friction disk can produce more heat and better friction effect.


