1. Introduction
Any bodily movement produced by skeletal muscles increasing energy expenditure above a basal level is called physical activity (PA) [
1]. It can be divided into two main categories—exercise and non-exercise PA. The intensity level can classify both as light, moderate, and vigorous. Separation of human activities based on the intensity level is defined as activity classification [
2,
3].
Activity classification can be vision- or sensor-based. There are many constraints for vision-based activity classification, primarily because of privacy and installation cost issues [
4].
From the low-cost and continuous health monitoring perspective, sensor-based human activity classification has become very popular [
5]. For estimating stress parameters in the case of ambulatory and static conditions, sensor-based activity monitoring is a commonly used solution to synchronize physiological data (e.g., ECG and PPG) with activity monitoring sensor data [
6]. Continuous assessment of stress can avoid unexpected accidents, especially for the workers’ life in many heavy industries. Understanding the normal and abnormal ambulatory physiological condition is dependent on the prior and present status of PA [
7,
8,
9].
Many deep learning-based methods, which are complex systems for wearable devices, have been proposed for human activity classification, especially with the University of California, Irvine Human Activity Recognition dataset [
10,
11]. As deep learning has automatic feature extraction capabilities, those methods do not require any manual feature extraction techniques. In most cases, a 1D convolutional neural network and temporal sequence-based long–short term memory neural network had been used for feature extraction and classification for human activity [
12,
13,
14], despite having some constraints for wearable devices in terms of computational complexity [
15]. There are many studies using the conventional machine learning approach where fast feature extraction methods have been proposed to optimize an algorithm with multiple features [
16].
Along with machine learning development, many industries have grown worldwide to develop hardware [
17] and software products to monitor human activity, and Actigraph is one of them. It is a leading provider of wearable physical activity and sleep monitoring solutions for the global scientific community [
18]. Actigraph’s research-grade accelerometry monitors are the most widely used and extensively validated devices of their kind [
19]. Its monitoring solutions have been used in thousands of academic studies worldwide to objectively measure the physical activity, mobility, and sedentary behavior of study participants in real-world and laboratory settings. A flexible and robust software technology platform provides the most comprehensive data monitoring, analysis, and management support in the industry [
20,
21,
22].
Actigraph calculates count values based on activity intensity, and the hip is the best location to calculate the intensity of PA, but its ability to detect body posture is inadequate in a single worn accelerometer [
23]. The commonly used inclinometer measures the angle between the gravity direction and the acceleration vector, but it can detect the posture only with 70% accuracy at best [
24,
25]. In the case of thigh-worn accelerometers, which measure the thigh inclination angle, it can differentiate between sitting and standing with over 90% accuracy. However, differentiation of sitting from laying is difficult because of different orientations for both postures [
26,
27,
28]. A combination of the angle of rotation and inclination for thigh has shown promising results to differentiate sitting from laying [
29]. Multiple accelerometer-based solutions have reached over 98% accuracy in identifying body posture [
30,
31]. However, in the case of a large-scale population, less complex (single-worn) and high feasibility systems are of primary importance besides the ability to provide information on light intensity behavior to the researchers. Obviously, one has to face a trade-off between simple systems and more burdensome and complex systems offering higher accuracy [
32].
Variance is an important parameter for classifying activities. Poincare plot-based activity classification is an investigation aimed to develop a simple variance-based classification method that may be less complex in terms of computational complexity than a deep learning-based system. To the best of our knowledge, there is no research on variance-based activity classification, so this paper was warranted for such investigation. Poincare plot can be a powerful tool for analyzing the variability of the angle derived from a single waist- and chest-mounted accelerometer. A 2D plot can be constructed by plotting consecutive points of angle in time intervals into series on a Cartesian plane. It is usually used for qualitative visualization of heart rate (HR) interval because of its ability to measure the short-term and long-term HR variability. In the determination of physical activity intensity, low (like short-term) and high (like long-term) angle variability analyzing property can be useful, the same as the Actigraph ‘count’ value, to classify activities.
In this paper, we propose a single sensor-based activity classification method where Poincare plots have been introduced to analyze the variance of angle calculated from the raw accelerometer data.
2. Materials and Methods
2.1. Dataset
Two datasets were used in this research. The first one is the Human Activity Recognition dataset, and the second one is the MHealth dataset from the UCI data repository [
33,
34]. In the Human Activity Recognition dataset, light to moderate intensity activities are available (e.g., laying to walking) and vigorous activity like running is not available. Although the MHealth dataset has different data acquisition protocol, it contains vigorous activity (e.g., running). Thus, MHEALTH data were also used in this research.
The experiments of the Human Activity Recognition (HAR) dataset collection were carried out with a group of 30 volunteers within an age bracket of 19–48 years. Each person performed six activities (walking, walking upstairs, walking downstairs, sitting, standing, and laying) while wearing a smartphone (Samsung Galaxy S II) on the waist. Three-axial linear acceleration and three-axial angular velocity were logged at a constant rate of 50 Hz using its embedded accelerometer and gyroscope.
Laying, sitting, and standing data were considered as static activities, and walking, walking up, and walking down were considered as dynamic activities. In the case of the HAR dataset, the first 20 s of data were used in this experiment, because some unexplained jump that may be induced by hardware default has been explained in the limitation section.
In the MHealth dataset, body motion and vital signs were recorded for ten volunteers of diverse profiles while performing several physical activities (e.g., walking, running, and so on). Sensors placed on the subject’s chest, right wrist, and left ankle are used to measure the motion experienced by diverse body parts. The sensor positioned on the chest also provides two-lead ECG measurements, which can potentially be used for basic heart monitoring and examining the effects of exercise from the ECG.
Although the MHealth dataset contain three accelerometers in different body positions, among them, the chest is the only location that is more stable with respect to the waist compared with the wrist and ankle. As the HAR dataset was acquired from a waist-mounted smartphone, to validate the different datasets with the same model, data coherence was an importance consideration. So, only the chest-mounted accelerometer named Shimmer 2 [BUR10] sensor with constant rate of 50 Hz was taken into consideration for the MHealth dataset.
2.2. Proposed Methods
A three-axis accelerometer provides a vector that comprises components of gravity on the local coordinate frame. In the case of the HAR dataset, activity was recorded with an accelerometer in a smartphone (Samsung Galaxy S II). As the smartphone had different initial orientations from person to person for data estimation, normalizing of all the measurements was carried out by keeping the laying data as the reference orientation. This was accomplished by calculating the initial orientation of the z-axis of the accelerometer frame with respect to the gravity vector. After initializing the orientation of the device, the angle (degree) was derived between the gravity and accelerometer vector for every sample. Poincare plot parameters SD1, SD2, and SDRR were calculated for angle values, and parameters were fitted to a support vector machine classifier.
Multi-classification was implemented in three steps. The step by step classification process is shown in
Figure 1.
At first, the classification between static and dynamic activities was done. After that, variants of static and dynamic activities were classified with mean angle and variance analysis. The Actigraph count-based activity classification method was studied for all cases, and all the analyses were accomplished with 10-fold cross-validation with an SVM classifier. In sedentary body posture estimation, more specifically sitting and standing classification, count-based classification is not satisfactory, where an angle-based method can be a better solution.
A comparative study between angle- and count-based activity classification and modification (sitting and standing classification) with the angle-based over count-based method were shown with novel angle variance analysis for human activity recognition.
2.3. Orientation of the Sensor and Angle Calculation with Gravity
The rotation matrix was derived from the laying data of each subject applied to other conditions (sitting and standing) to have a common reference (
Figure 2). It was calculated as shown in Manon et al. [
35].
2.4. Poincare Plot Explanation
Poincare plot is a geometrical representation of a time series in a Cartesian plane. Heart rate dynamic is a nonlinear process, and its pattern can be explained by Poincare plot [
36]. By plotting consecutive points of R-peak (QRS) to R-peak time interval into series on a Cartesian plane, a 2D plot was constructed [
37]. It is extensively used for qualitative visualization of the physiological signal and commonly applied to assess the dynamics of heart rate variability (HRV) [
36,
37,
38].
An ellipse can be fitted to the shape of the Poincare plot. SD1 and SD2, along with semi-minor and semi-major axis, respectively, are used for quantification of the Poincare plot geometry.
The description of SD1 and SD2 in terms of linear statistics shows that the standard descriptors guide the visual inspection of the distribution. In terms of HRV, it reveals a useful visual pattern of the RR interval data by representing both short- and long-term variations of the signal [
39,
40].
We used this concept to determine the non-linearity of angle series for human activity classification purposes with an accelerometer sensor. Poincare plot derived from an angle can also be effective for the classification of variations of dynamic activities like walking and running.
2.5. Feature Extraction
From raw accelerometer data, the angle between the acceleration vector and gravity vector was calculated. The mean angle and Poincare plot parameters of angle were calculated from the angle. These parameters were fitted to the support vector machine classifier to classify human activity. Static and dynamic activities were classified on the basis of the Poincare plot parameter. Classification between static activities was classified on the basis of mean angle and dynamic activities were classified on the basis of Poincare plot parameters. The process for feature extraction is shown in
Figure 3.
2.6. Actigraph Count Calculation Procedure
Several researchers have tried to reproduce the working algorithm of the Actigraph. The validity of the Actigraph for the assessment of physical activity in a population has been extensively studied across many different ages, groups, gender, and patients [
41].
According to Brønd et al., in the calculation of the value that resembles the Actigraph, the count can be generated from raw accelerometer data with the following steps. At first, the raw data were resampled to 30 Hz, and then they were band-passed with a [0.1–5] Hz filter. The band-passed signal was down sampled to 10 Hz. Saturation and dead band were applied to the data such that no acceleration exceeds the maximum absolute value (truncation threshold), and any value lower than the minimum value (dead band) is set to 0, respectively, to avoid any non-human activity. Lastly, the data were divided according to the time window and the summation of the values in each time window is the final activity count [
41]. The Actigraph count calculation process is shown in
Figure 4.
3. Results
3.1. Static and Dynamic Activities’ Classification
Static and dynamic activities were classified from the HAR dataset, where laying, sitting, and standing were considered static activities. Furthermore, walking, walking up, and walking down were considered dynamic activities. The angle derived from raw accelerometer data for all activities and the corresponding Poincare plot is shown in
Figure 5 and
Figure 6.
Poincare plot parameters SD1, SD2, and SDRR were calculated and classified with an SVM classifier with linear kernel, where C = 1 and gamma = ‘scale’. The mean and standard deviation for all activities are shown in
Figure 7 and
Figure 8. The Actigraph count resembles that the value was analyzed where count calculation for static and dynamic activities was considered.
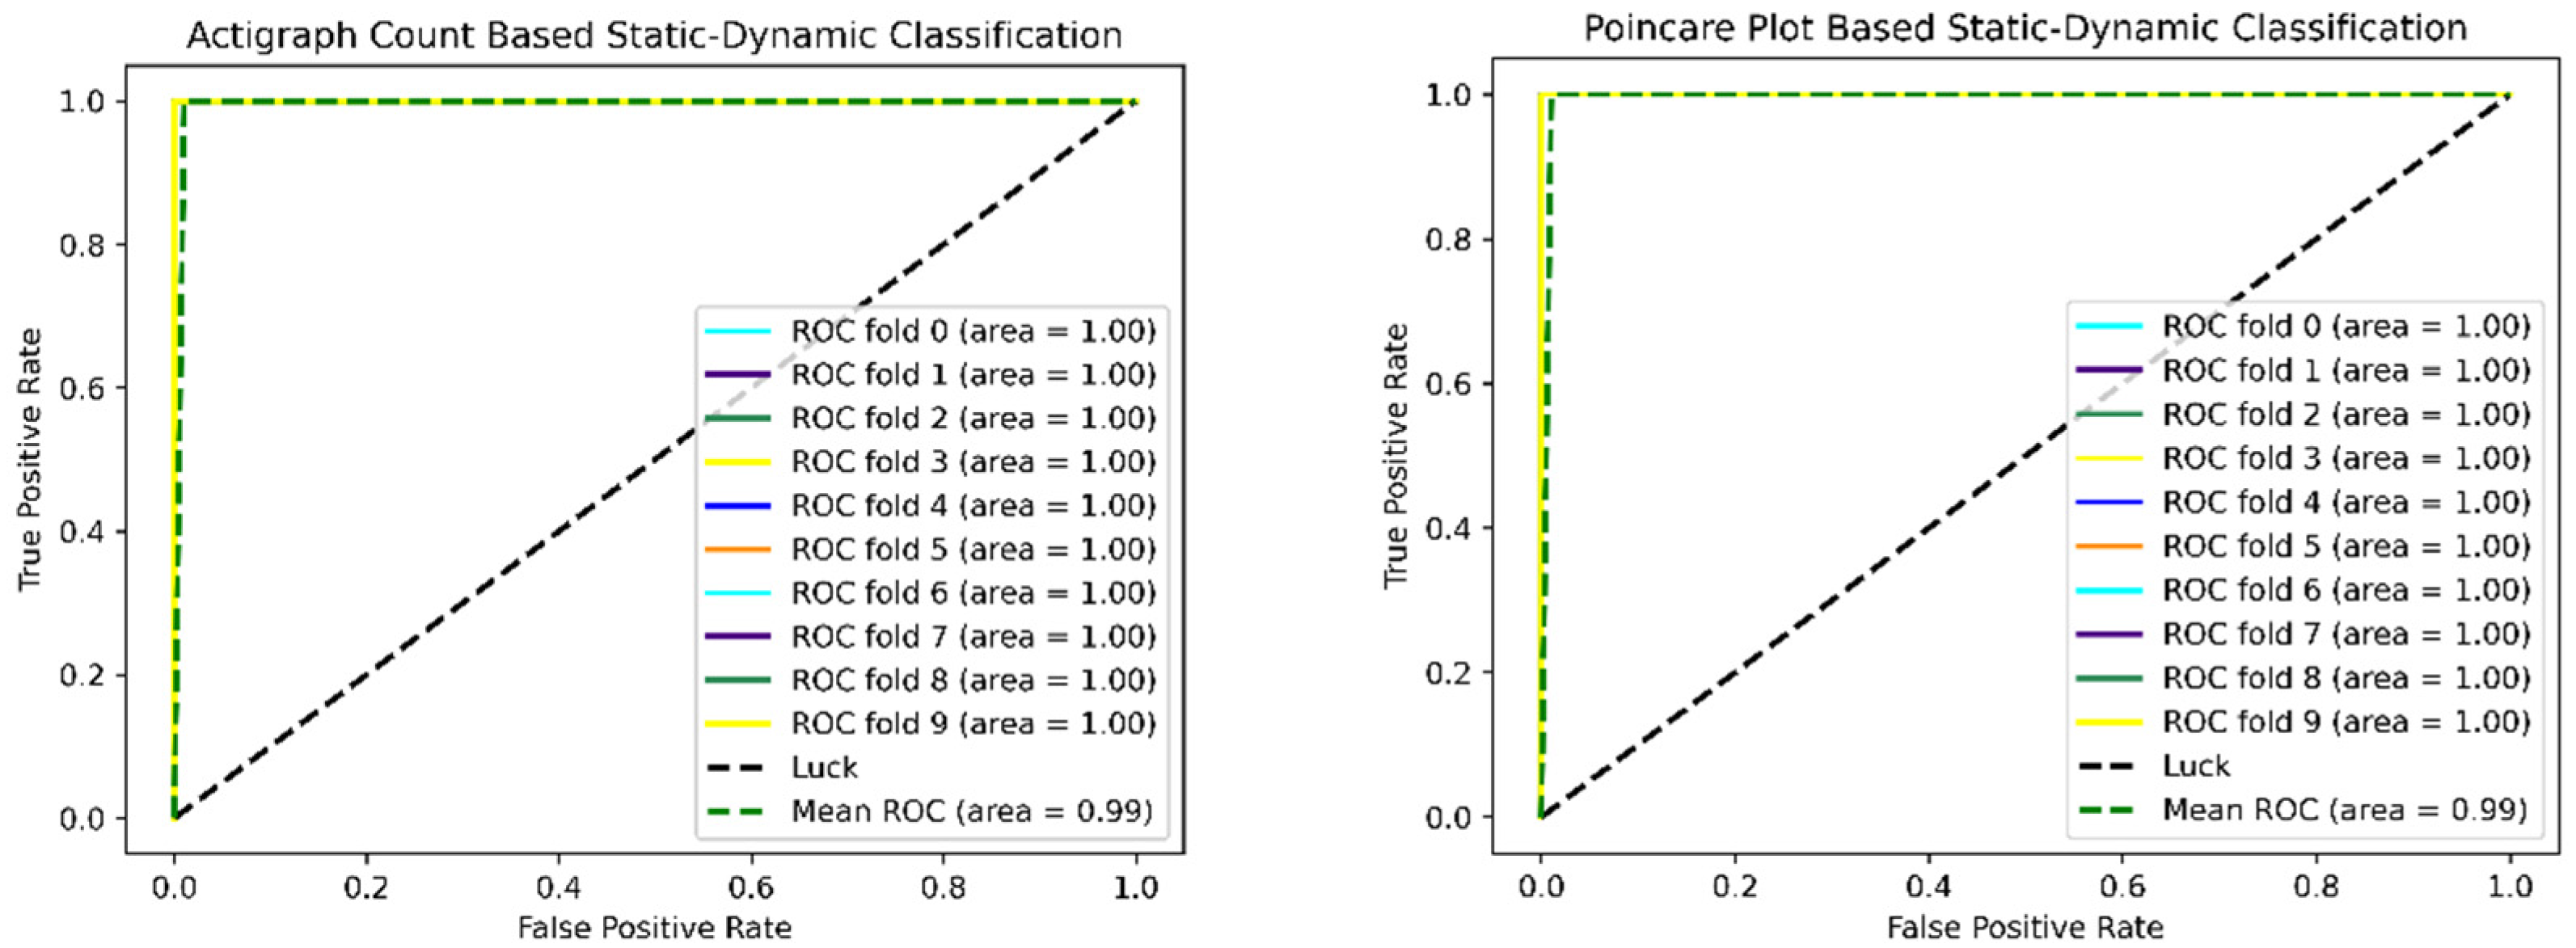
Table 1 shows the result for static and dynamic activities for the angle- and count-based classification system with accuracy (100%), sensitivity (100%), and specificity (100%). The ROC curve for static and dynamic classification with the Actigraph count and Poincare plot-based classification is shown in
Figure 9.
In the case of angle-based classification, SD1, SD2, and SDRR were considered separately and together as a feature to classify. In contrast, the mean counts of X, Y, and Z were considered separately and together.
3.2. Laying and Sitting–Standing Classification
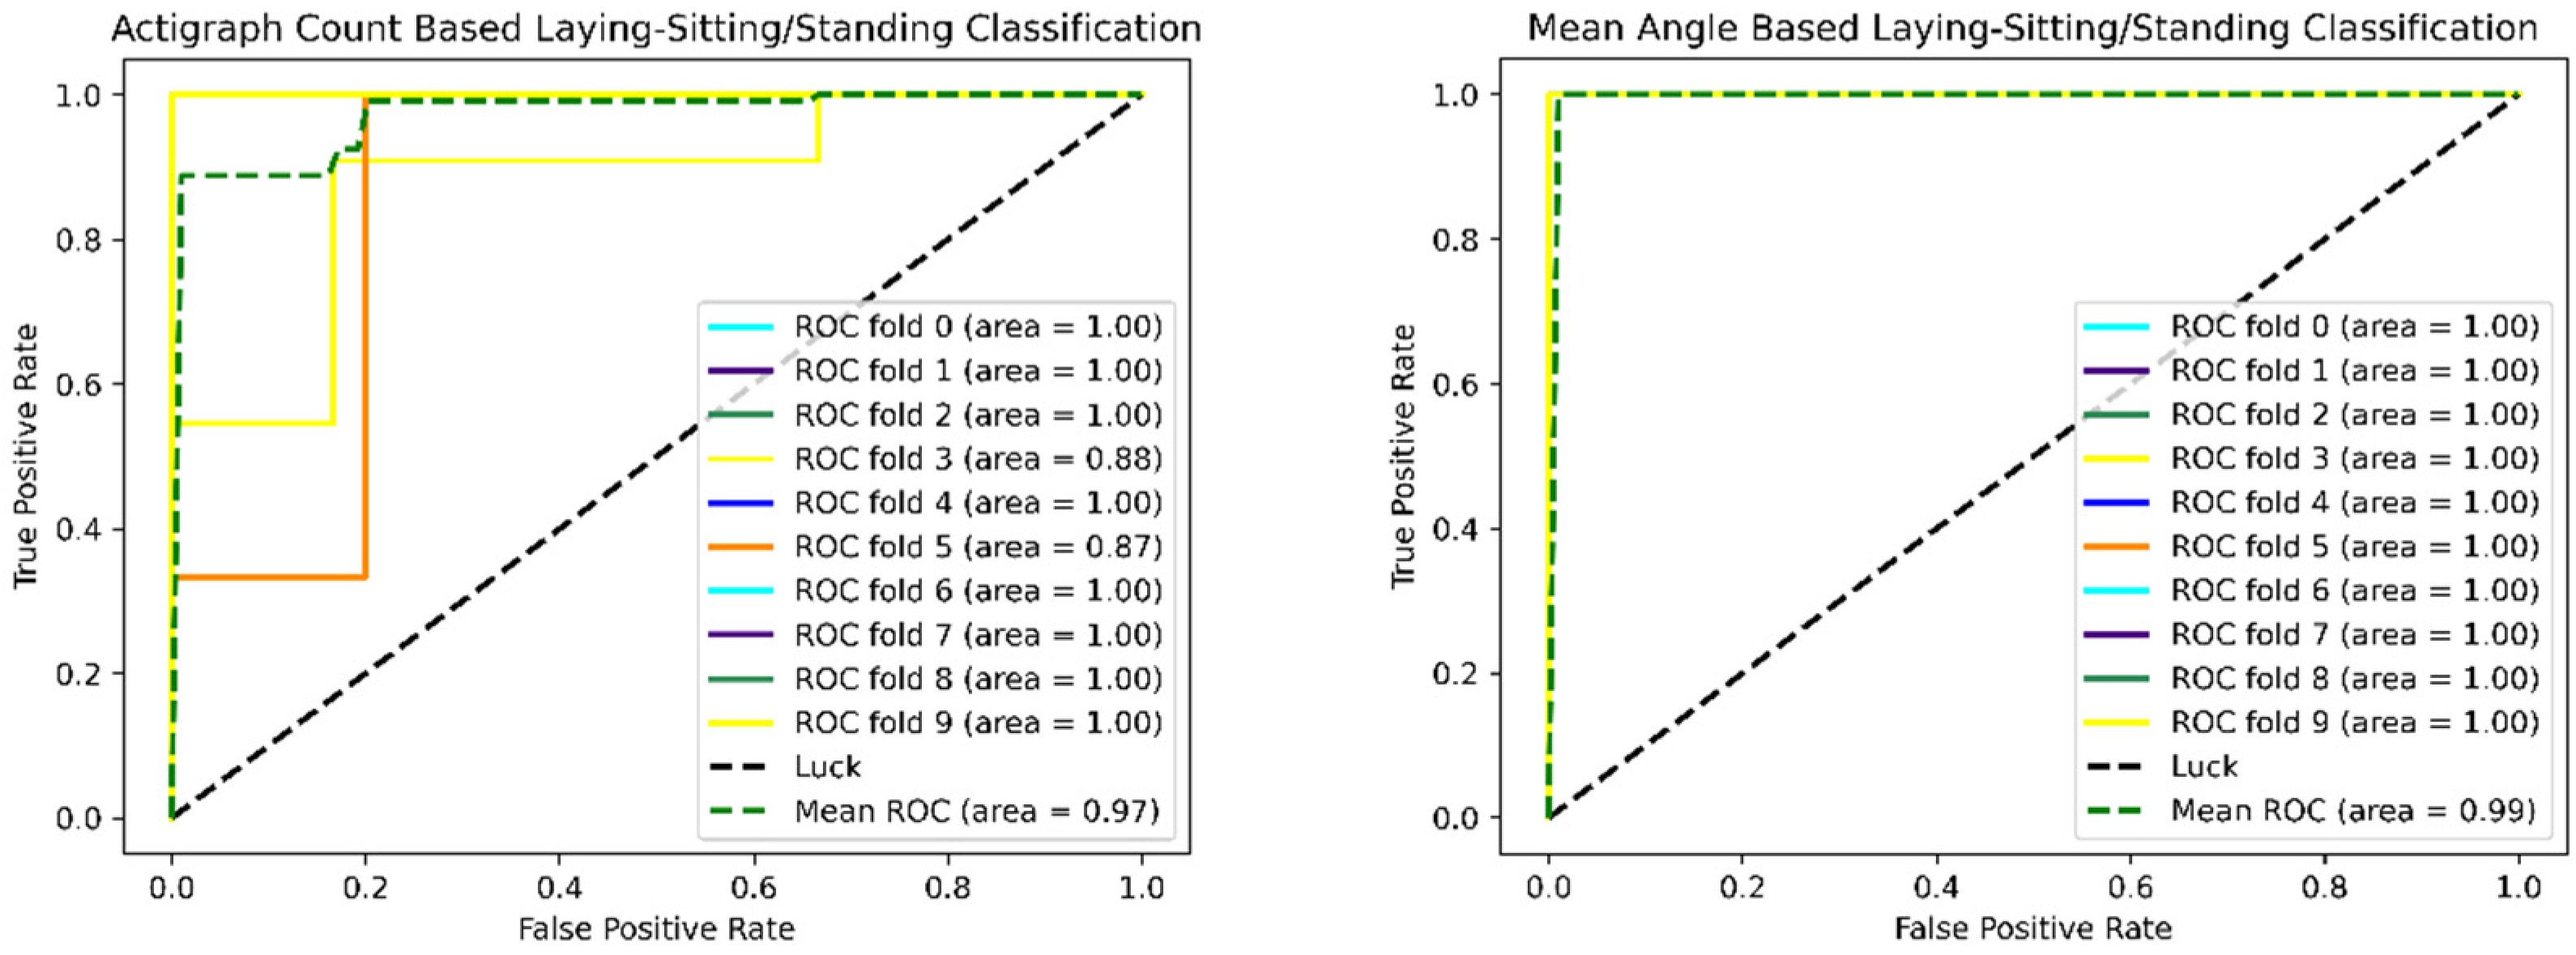
Laying and sitting–standing activities were classified with the mean angle from the static activities. After the initial orientation, where laying data were considered as a reference, it shows the best accuracy (100%), sensitivity (100%), and specificity (100%). Overall, the count-based classification result shows accuracy (98.26%), sensitivity (98.14%), and specificity (98.31%). All the results were analyzed with 10-fold cross-validation. The ROC curve for laying and other static classification with the Actigraph count and mean angle-based classification is shown in
Figure 10.
3.3. Sitting and Standing Classification
Sitting–standing activities were also classified with the mean angle after filtration of laying data from static activities. Mean angle-based classification shows accuracy (88.11%), sensitivity (97.36%), and specificity (82.53%). In the case of the count-based method, the mean count of X, Y, and Z shows accuracy (57.62%), sensitivity (67.85%), and specificity (54.44%) with 10-fold cross-validation. The ROC curve for sitting and standing classification with the Actigraph count and mean angle-based classification is shown in
Figure 11.
3.4. Walking and Running Classification
Angle variance analysis was considered as a medium (walk) to vigorous (run) activity classifier.
Table 2 shows the classification between walking and running activities with count and angle variance analysis. The classification results are shown in
Table 2 for SD1, SD2, and SDRR, as well as count of X, Y, and Z, in separate and combined form. The ROC curve for walking and running classification with the Actigraph count and Poincare plot-based classification is shown in
Figure 12. The mean count of the X, Y, and
Z-axis shows accuracy (100%) with sensitivity (100%) and specificity (100%), whereas SD1, SD2, and SDRR of angle show accuracy (100%) with sensitivity (100%) and specificity (100%).
4. Discussion
In this study, a Poincare plot-based variance analysis was applied to angles derived from raw accelerometer data to classify static and dynamic activities along with their variants (e.g., laying, sitting, and standing for static activities).
In terms of classification between static and dynamic activities, both count- and angle-based classification is evidently accurate. The acceleration variation is reflected significantly when the user is in motion, which thereby increases the variability in accelerometer counts and the angle.
In the case of laying and sitting–standing classification, the results for the mean count of the X-axis show accuracy (98.26%), sensitivity (98.14%), and specificity (98.31%), whereas the combined feature for the mean count of three axes together shows the same results because of standard scaling or normalization. However, the other two axes (Y and Z) do not perform well individually compared with the mean count of the X-axis. However, the results were found without the initial orientation of the senor.
In the case of count-based calculation for static activities, many subjects’ mean count was zero (as the count method calculates the value after minimum vibration). After the initial orientation of the device, the mean angle was found to be a good marker for laying and sitting–standing classification, which is very much obvious from
Figure 6.
In the case of classification between sitting and standing, we hypothesize that standing would induce more postural variability in the accelerometer owing to the balance retraining. Following this hypothesis, the classification between sitting and standing with the angle variance-based method yielded an accuracy of 68.08% with SD1. Eventually, we realized that the mean angle performed better in accuracy (88.11%) with sensitivity (97.39%) and specificity (82.53%). In contrast, the count-based method was performed with accuracy (57.62%), sensitivity (67.85%), and specificity (54.44%).
In terms of vigorous activity classification with walk and run data from the MHealth dataset, count (X, Y, Z) and SD (SD1, SD2, SDRR) were considered individually and jointly for the walking–running classification. The overall count- and variance-based classification accuracy was 100% and 100%, respectively, with five-fold cross-validation for SVM classifiers.
In this paper, we have shown a robust classification of activity using variance features from a body-mounted accelerometer. In comparison with some deep learning architectures in [
42,
43,
44], the overall accuracy was 92.71%, 92.13%, and 92.67% with the 1D convolutional neural network (CNN), CNN-LSTM, and bidirectional LSTM, respectively. In [
45], Bayes classifier is used where the time, frequency, and spatial domain totals of 19 features are extracted. Principal component analysis is applied to reduce the dimension, whereas the overall accuracy for the proposed method is around 96% for all activities without any dimensionality reduction with SD1, SD2, and SDRR. To the best of our knowledge, this is the first study of such kind. Activity classification based on the accelerometer-only feature will enable cheaper and robust applications in telemedicine applications, as well as continuous monitoring of stress signature on humans. Such a classification method will have manifold advantages ranging from health applications to continuous patient monitoring, tracking the stress markers of industry workers. Hence, human activity classification with significant accuracy is warranted.
5. Conclusions and Perspectives
Waist-worn accelerometers can classify activities below a certain intensity threshold (e.g., count) as static behavior, while it is difficult to separate different body postures (e.g., sitting–standing) from each other. As standing may confer some health benefits compared with sitting and laying, it needs to be classified and estimated.
The proposed Poincare plot-based angle variance analysis approach can be a substitute to the Actigraph count-based method (which calculates activity intensity) for both (1) the single waist-worn HAR dataset and (2) the chest-worn MHealth (walk-run) dataset with a tri-axial accelerometer.
In this paper, we showed that our proposed method has good-to-excellent performance in identifying different body postures of sedentary activities as well as moderate (walk) to vigorous (run) activities, which may be deemed less computationally complex and cheaper to implement in wearable devices for ambulatory activity classification platform.
6. Limitations
Some data from sitting were avoided in the activity classification calculation because of random noise, as shown in
Figure 13. In the case of SD calculation, those data resulted in outliers.
In the case of sitting data from
Figure 14, there is a jump in angle value that may be induced by a hardware fault. As a data cleaning approach, we avoided those unexplained jumps as human activity transition is unrealistic in 20 milliseconds (one sample).
Author Contributions
Conceptualization, S.A.; methodology, S.A. and T.A.B.; software, S.A.; validation, S.A.; formal analysis, S.A.; investigation, S.A. and T.A.B.; resources, S.A.; data curation, S.A. and T.K.; writing—original draft preparation, S.A.; writing—review and editing, M.N. and T.A.B.; visualization, S.K. and M.N.; supervision, T.A.B., M.N., and S.K.; project administration, S.K. and M.N. All authors have read and agreed to the published version of the manuscript.
Funding
This research received no external funding.
Institutional Review Board Statement
Not applicable.
Informed Consent Statement
Not applicable.
Data Availability Statement
Conflicts of Interest
The authors declare no conflict of interest.
References
- Chandler, J.; Brazendale, K.; Beets, M.; Mealing, B. Classification of Physical Activity Intensities Using a Wrist-worn Accelerometer in 8–12-year-old Children. Pediatric Obes. 2016, 11, 120–127. [Google Scholar] [CrossRef]
- Colberg, S.R.; Sigal, R.J.; Yardley, J.E.; Riddell, M.C.; Dunstan, D.W.; Dempsey, P.C.; Horton, E.S.; Castorino, K.; Tate, D.F. Physical Activity/Exercise and Diabetes: A Position Statement of the American Diabetes Association. Diabetes Care 2016, 39, 2065–2079. [Google Scholar] [CrossRef]
- Lear, S.A.; Hu, W.; Rangarajan, S.; Gasevic, D.; Leong, D.; Iqbal, R.; Casanova, A.; Swaminathan, S.; Anjana, R.M.; Kumar, R. The Effect of Physical Activity on Mortality and Cardiovascular Disease in 130 000 People from 17 High-Income, Middle-Income, and Low-Income Countries: The PURE Study. Lancet 2017, 390, 2643–2654. [Google Scholar] [CrossRef]
- Chen, L.; Hoey, J.; Nugent, C.D.; Cook, D.J.; Yu, Z. Sensor-Based Activity Recognition. In Proceedings of the IEEE Transactions on Systems, Man, and Cybernetics, Part C (Applications and Reviews), New York, NY, USA, 4 November 2012; IEEE: Piscataway, NJ, USA, 2012. [Google Scholar] [CrossRef]
- Yin, J.; Yang, Q.; Pan, J.J. Sensor-Based Abnormal Human-Activity Detection. In Proceedings of the IEEE Transactions on Knowledge and Data Engineering, Los Alamitos, CA, USA, 5 August 2008; IEEE: Piscataway, NJ, USA, 2008. [Google Scholar] [CrossRef]
- Zhang, Y.; Xiao, H. Bluetooth-Based Sensor Networks for Remotely Monitoring the Physiological Signals of a Patient. In Proceedings of the IEEE Transactions on Information Technology in Biomedicine, Piscataway, NJ, USA, 6 November 2009; IEEE: Piscataway, NJ, USA, 2009. [Google Scholar]
- Leone, A.; Rescio, G.; Siciliano, P.; Papetti, A.; Brunzini, A.; Germani, M. Multi Sensors Platform for Stress Monitoring of Workers in Smart Manufacturing Context. In Proceedings of the 2020 IEEE International Instrumentation and Measurement Technology Conference (I2MTC), Dubrovnik, Croatia, 25–28 May 2020; pp. 1–5. [Google Scholar]
- Ismail, A.R.; Jusoh, N.; Asri, M.A.M.; Zein, R.M.; Rahman, I.A.; Makhtar, N.K.; Mohamed, D. The Factor Affecting Heat Stress in Industrial Workers Exposed to Extreme Heat: A Case Study of Methodology. In Journal of Physics: Conference Series; IOP Publishing: Bristol, UK, 2020; Volume 1630, p. 012001. [Google Scholar]
- Acharya, P.; Boggess, B.; Zhang, K. Assessing Heat Stress and Health among Construction Workers in a Changing Climate: A Review. Int. J. Environ. Res. Public Health 2018, 15, 247. [Google Scholar] [CrossRef]
- Wang, S.; Zhu, X. A Hybrid Deep Neural Networks for Sensor-Based Human Activity Recognition; IEEE: Piscataway, NJ, USA, 2020; pp. 486–491. [Google Scholar]
- Nutter, M.; Crawford, C.H.; Ortiz, J. Design of Novel Deep Learning Models for Real-Time Human Activity Recognition with Mobile Phones; IEEE: Piscataway, NJ, USA, 2018; pp. 1–8. [Google Scholar]
- Nematallah, H.; Rajan, S. Comparative Study of Time Series-Based Human Activity Recognition Using Convolutional Neural Networks; IEEE: Piscataway, NJ, USA, 2020; pp. 1–6. [Google Scholar]
- Tang, Y.; Teng, Q.; Zhang, L.; Min, F.; He, J. Layer-Wise Training Convolutional Neural Networks with Smaller Filters for Human Activity Recognition Using Wearable Sensors. IEEE Sens. J. 2020, 21, 581–592. [Google Scholar] [CrossRef]
- Xia, K.; Huang, J.; Wang, H. LSTM-CNN Architecture for Human Activity Recognition. IEEE Access 2020, 8, 56855–56866. [Google Scholar] [CrossRef]
- Bianchi, V.; Bassoli, M.; Lombardo, G.; Fornacciari, P.; Mordonini, M.; de Munari, I. IoT Wearable Sensor and Deep Learning: An Integrated Approach for Personalized Human Activity Recognition in a Smart Home Environment. IEEE Internet Things J. 2019, 6, 8553–8562. [Google Scholar] [CrossRef]
- Hashim, B.M.; Amutha, R. Human Activity Recognition Based on Smartphone Using Fast Feature Dimensionality Reduction Technique. J. Ambient Intell. Humaniz. Comput. 2020, 12, 2365–2374. [Google Scholar] [CrossRef]
- Nandy, T.; Coutu, R.A.; Ababei, C. Carbon Monoxide Sensing Technologies for Next-Generation Cyber-Physical Systems. Sensors 2018, 18, 3443. [Google Scholar] [CrossRef] [PubMed]
- Aguilar-Farias, N.; Peeters, G.; Brychta, R.J.; Chen, K.Y.; Brown, W.J. Comparing ActiGraph Equations for Estimating Energy Expenditure in Older Adults. J. Sports Sci. 2019, 37, 188–195. [Google Scholar] [CrossRef]
- So, K.; Buckley, P.; Adamson, T.M.; Horne, R.S. Actigraphy Correctly Predicts Sleep Behavior in Infants Who Are Younger than Six Months, When Compared with Polysomnography. Pediatric Res. 2005, 58, 761–765. [Google Scholar] [CrossRef]
- Barnett, A.; van den Hoek, D.; Barnett, D.; Cerin, E. Measuring Moderate-Intensity Walking in Older Adults Using the ActiGraph Accelerometer. BMC Geriatr. 2016, 16, 211. [Google Scholar] [CrossRef]
- Hibbing, P.R.; Lamunion, S.R.; Kaplan, A.S.; Crouter, S.E. Estimating Energy Expenditure with ActiGraph GT9X Inertial Measurement Unit. Med. Sci. Sports Exerc. 2018, 50, 1093–1102. [Google Scholar] [CrossRef] [PubMed]
- Imboden, M.T.; Nelson, M.B.; Kaminsky, L.A.; Montoye, A.H. Comparison of Four Fitbit and Jawbone Activity Monitors with a Research-Grade ActiGraph Accelerometer for Estimating Physical Activity and Energy Expenditure. Br. J. Sports Med. 2018, 52, 844–850. [Google Scholar] [CrossRef]
- Cleland, I.; Kikhia, B.; Nugent, C.; Boytsov, A.; Hallberg, J.; Synnes, K.; McClean, S.; Finlay, D. Optimal Placement of Accelerometers for the Detection of Everyday Activities. Sensors 2013, 13, 9183–9200. [Google Scholar] [CrossRef] [PubMed]
- Bassett, D.R., Jr.; John, D.; Conger, S.A.; Rider, B.C.; Passmore, R.M.; Clark, J.M. Detection of Lying down, Sitting, Standing, and Stepping Using Two ActivPAL Monitors. Med. Sci. Sports Exerc. 2014, 46, 2025–2029. [Google Scholar] [CrossRef] [PubMed]
- Berendsen, B.A.; Hendriks, M.R.; Meijer, K.; Plasqui, G.; Schaper, N.C.; Savelberg, H.H. Which Activity Monitor to Use? Validity, Reproducibility and User Friendliness of Three Activity Monitors. BMC Public Health 2014, 14, 749. [Google Scholar] [CrossRef] [PubMed]
- Grant, P.M.; Ryan, C.G.; Tigbe, W.W.; Granat, M.H. The Validation of a Novel Activity Monitor in the Measurement of Posture and Motion during Everyday Activities. Br. J. Sports Med. 2006, 40, 992–997. [Google Scholar] [CrossRef] [PubMed]
- Kozey-Keadle, S.; Libertine, A.; Lyden, K.; Staudenmayer, J.; Freedson, P.S. Validation of Wearable Monitors for Assessing Sedentary Behavior. Med. Sci. Sports Exerc. 2011, 43, 1561–1567. [Google Scholar] [CrossRef]
- Skotte, J.; Korshøj, M.; Kristiansen, J.; Hanisch, C.; Holtermann, A. Detection of Physical Activity Types Using Triaxial Accelerometers. J. Phys. Act. Health 2014, 11, 76–84. [Google Scholar] [CrossRef]
- Lyden, K.; John, D.; Dall, P.; Granat, M.H. Differentiating Sitting and Lying Using a Thigh-Worn Accelerometer. Med. Sci. Sports Exerc. 2016, 48, 742–747. [Google Scholar] [CrossRef][Green Version]
- Foerster, F.; Fahrenberg, J. Motion Pattern and Posture: Correctly Assessed by Calibrated Accelerometers. Behav. Res. Methods Instrum. Comput. 2000, 32, 450–457. [Google Scholar] [CrossRef]
- Zhang, K.; Werner, P.; Sun, M.; Pi-Sunyer, F.X.; Boozer, C.N. Measurement of Human Daily Physical Activity. Obes. Res. 2003, 11, 33–40. [Google Scholar] [CrossRef] [PubMed]
- Matthews, C.E.; Hagströmer, M.; Pober, D.M.; Bowles, H.R. Best Practices for Using Physical Activity Monitors in Population-Based Research. Med. Sci. Sports Exerc. 2012, 44 (Suppl. 1), S68. [Google Scholar] [CrossRef]
- Anguita, D.; Ghio, A.; Oneto, L.; Parra, X.; Reyes-Ortiz, J.L. A Public Domain Dataset for Human Activity Recognition Using Smartphones. In Proceedings of the 013 proceedings, European Symposium on Artificial Neural Networks, Computational Intelligence and Machine Learning, Bruges, Belgium, 24–26 April 2013. [Google Scholar]
- Banos, O.; Villalonga, C.; Garcia, R.; Saez, A.; Damas, M.; Holgado-Terriza, J.A.; Lee, S.; Pomares, H.; Rojas, I. Design, Implementation and Validation of a Novel Open Framework for Agile Development of Mobile Health Applications. BioMed Eng. Online 2015, 14 (Suppl. 2), S6. [Google Scholar] [CrossRef]
- Kok, M.; Hol, J.D.; Schön, T.B. Using Inertial Sensors for Position and Orientation Estimation. arXiv 2017, arXiv:1704.06053. [Google Scholar]
- Acharya, U.R.; Joseph, K.P.; Kannathal, N.; Lim, C.M.; Suri, J.S. Heart Rate Variability: A Review. Med. Biol. Eng. Comput. 2006, 44, 1031–1051. [Google Scholar] [CrossRef]
- Tulppo, M.P.; Makikallio, T.H.; Seppanen, T.; Airaksinen, J.K.; Huikuri, H.V. Heart Rate Dynamics during Accentuated Sympathovagal Interaction. Am. J. Physiol. Heart Circ. Physiol. 1998, 274, H810–H816. [Google Scholar] [CrossRef]
- Toichi, M.; Sugiura, T.; Murai, T.; Sengoku, A. A New Method of Assessing Cardiac Autonomic Function and Its Comparison with Spectral Analysis and Coefficient of Variation of R–R Interval. J. Auton. Nerv. Syst. 1997, 62, 79–84. [Google Scholar] [CrossRef]
- Tulppo, M.P.; Makikallio, T.; Takala, T.; Seppanen, T.; Huikuri, H.V. Quantitative Beat-to-Beat Analysis of Heart Rate Dynamics during Exercise. Am. J. Physiol. Heart Circ. Physiol. 1996, 271, H244–H252. [Google Scholar] [CrossRef]
- Brennan, M.; Palaniswami, M.; Kamen, P. Do Existing Measures of Poincare Plot Geometry Reflect Nonlinear Features of Heart Rate Variability? IEEE Trans. Biomed. Eng. 2001, 48, 1342–1347. [Google Scholar] [CrossRef] [PubMed]
- Brønd, J.C.; Andersen, L.B.; Arvidsson, D. Generating ActiGraph Counts from Raw Acceleration Recorded by an Alternative Monitor. Med. Sci. Sports Exerc. 2017, 49, 2351–2360. [Google Scholar] [CrossRef] [PubMed]
- Lee, S.-M.; Yoon, S.M.; Cho, H. Human activity recognition from accelerometer data using Convolutional Neural Network. In Proceedings of the 2017 IEEE International Conference on Big Data and Smart Computing (BigComp), Jeju, Korea, 13–16 February 2017; pp. 131–134. [Google Scholar]
- Mutegeki, R.; Han, D.S. A CNN-LSTM Approach to Human Activity Recognition. In Proceedings of the 2020 International Conference on Artificial Intelligence in Information and Communication (ICAIIC), Fukuoka, Japan, 19–21 February 2020; pp. 362–366. [Google Scholar]
- Hernández, F.; Suárez, L.F.; Villamizar, J.; Altuve, M. Human Activity Recognition on Smartphones Using a Bidirectional LSTM Network. In Proceedings of the 2019 XXII Symposium on Image, Signal Processing and Artificial Vision (STSIVA), Bucaramanga, Colombia, 24–26 April 2019; pp. 1–5. [Google Scholar]
- Long, X.; Yin, B.; Aarts, M.R. Single-Accelerometer-Based Daily Physical Activity Classification. In Proceedings of the 2009 Annual International Conference of the IEEE Engineering in Medicine and Biology Society, Minneapolis, MN, USA, 3–6 September 2009; pp. 6107–6110. [Google Scholar] [CrossRef]
Figure 1.
Step by step activity classification process.
Figure 1.
Step by step activity classification process.
Figure 2.
The orientation of the laying data (dotted line) after the multiplication with rotation matrix from unoriented position (solid line).
Figure 2.
The orientation of the laying data (dotted line) after the multiplication with rotation matrix from unoriented position (solid line).
Figure 3.
Feature extraction process.
Figure 3.
Feature extraction process.
Figure 4.
Actigraph count calculation process.
Figure 4.
Actigraph count calculation process.
Figure 5.
Plots of angle between acceleration vector and gravity. The up panel denotes the laying, sitting, standing, and walking angle for the Human Activity Recognition (HAR) dataset and the down panel walking and running angle for the MHealth dataset.
Figure 5.
Plots of angle between acceleration vector and gravity. The up panel denotes the laying, sitting, standing, and walking angle for the Human Activity Recognition (HAR) dataset and the down panel walking and running angle for the MHealth dataset.
Figure 6.
Poincare plot of angle. The left panel denotes laying, sitting, standing, and walking Poincare plot of angle for the HAR dataset and the right panel walking and running Poincare plot of angle for MHealth.
Figure 6.
Poincare plot of angle. The left panel denotes laying, sitting, standing, and walking Poincare plot of angle for the HAR dataset and the right panel walking and running Poincare plot of angle for MHealth.
Figure 7.
(a–c) Bar plot of SD1, SD2, and SDRR, respectively, for laying, sitting, standing, and walking. (d) Bar plot of the mean angle for static activities with the HAR dataset.
Figure 7.
(a–c) Bar plot of SD1, SD2, and SDRR, respectively, for laying, sitting, standing, and walking. (d) Bar plot of the mean angle for static activities with the HAR dataset.
Figure 8.
(a–c) Bar plot of SD1, SD2, and SDRR, respectively, of dynamic activities (walking and running) with the MHealth dataset.
Figure 8.
(a–c) Bar plot of SD1, SD2, and SDRR, respectively, of dynamic activities (walking and running) with the MHealth dataset.
Figure 9.
ROC curve for static and dynamic classification. The left panel denotes the ROC curve for the Actigraph count-based static and dynamic activities’ classification. The right panel denotes the Poincare plot-based static and dynamic activities’ classification.
Figure 9.
ROC curve for static and dynamic classification. The left panel denotes the ROC curve for the Actigraph count-based static and dynamic activities’ classification. The right panel denotes the Poincare plot-based static and dynamic activities’ classification.
Figure 10.
ROC curve for laying and other static classification. The left panel denotes the ROC curve for the Actigraph count-based laying and other static classification. The right panel denotes the mean angle-based static and dynamic activities’ classification.
Figure 10.
ROC curve for laying and other static classification. The left panel denotes the ROC curve for the Actigraph count-based laying and other static classification. The right panel denotes the mean angle-based static and dynamic activities’ classification.
Figure 11.
ROC curve for sitting and standing classification. The left panel denotes the ROC curve for the Actigraph count-based sitting and standing classification. The right panel denotes the mean angle-based static and dynamic activities’ classification.
Figure 11.
ROC curve for sitting and standing classification. The left panel denotes the ROC curve for the Actigraph count-based sitting and standing classification. The right panel denotes the mean angle-based static and dynamic activities’ classification.
Figure 12.
ROC curve for walking and running classification. The left panel denotes the ROC curve for the Actigraph count-based walking and running classification. The right panel denotes the Poincare plot-based walking and running activities’ classification.
Figure 12.
ROC curve for walking and running classification. The left panel denotes the ROC curve for the Actigraph count-based walking and running classification. The right panel denotes the Poincare plot-based walking and running activities’ classification.
Figure 13.
Plot of abnormal sitting angle.
Figure 13.
Plot of abnormal sitting angle.
Figure 14.
Plots of angle with a sudden jump in sitting angle. The up panel denotes angle of laying, sitting, standing, and walking for the HAR dataset after initial orientation and the down panel denotes angle without initial orientation.
Figure 14.
Plots of angle with a sudden jump in sitting angle. The up panel denotes angle of laying, sitting, standing, and walking for the HAR dataset after initial orientation and the down panel denotes angle without initial orientation.
Table 1.
Accuracy with count-based and angle-based classification for the HAR dataset.
Table 1.
Accuracy with count-based and angle-based classification for the HAR dataset.
| Static/Dynamic Classification |
| | | Accuracy (%) | Sensitivity (%) | Specificity (%) |
| Actigraph count | X | 100 | 100 | 100 |
| | Y | 99 | 98 | 100 |
| Z | 98 | 98 | 99 |
| X, Y, Z | 100 | 100 | 100 |
| Poincare plot parameters | SD1 | 100 | 100 | 100 |
| | SD2 | 100 | 100 | 100 |
| SDRR | 100 | 100 | 100 |
| SD1, SD2, SDRR | 100 | 100 | 100 |
| Laying–Sitting/Standing Classification |
| | | Accuracy (%) | Sensitivity (%) | Specificity (%) |
| Actigraph count | X | 98 | 98 | 98 |
| | Y | 71 | 34 | 74 |
| Z | 69 | 66 | 69 |
| X, Y, Z | 98 | 98 | 98 |
| Angle | Mean Angle | 100 | 100 | 100 |
| Sitting-Standing Classification |
| | | Accuracy (%) | Sensitivity (%) | Specificity (%) |
| Actigraph count | X | 48 | 50 | 0 |
| | Y | 55 | 73 | 52 |
| Z | 46 | 48 | 43 |
| X, Y, Z | 57 | 67 | 54 |
| Angle | Mean Angle | 88 | 97 | 82 |
Table 2.
Accuracy with count- and angle variance (Poincare plot)-based classification for the MHealth (walk–run) dataset.
Table 2.
Accuracy with count- and angle variance (Poincare plot)-based classification for the MHealth (walk–run) dataset.
| Walking–Running Classification |
|---|
| | | Accuracy (%) | Sensitivity (%) | Specificity (%) |
|---|
| Actigraph count | X | 100 | 100 | 100 |
| Y | 100 | 100 | 100 |
| Z | 85 | 76 | 100 |
| X, Y, Z | 100 | 100 | 100 |
| Poincare plot parameters | SD1 | 100 | 100 | 100 |
| SD2 | 100 | 100 | 100 |
| SDRR | 100 | 100 | 100 |
| SD1, SD2, SDRR | 100 | 100 | 100 |
| Publisher’s Note: MDPI stays neutral with regard to jurisdictional claims in published maps and institutional affiliations. |
© 2021 by the authors. Licensee MDPI, Basel, Switzerland. This article is an open access article distributed under the terms and conditions of the Creative Commons Attribution (CC BY) license (https://creativecommons.org/licenses/by/4.0/).


