
System for Neural Network Determination of Atrial Fibrillation on ECG Signals with Wavelet-Based Preprocessing


Abstract
:Featured Application
Abstract
1. Introduction
2. Related Research
3. Materials and Methods
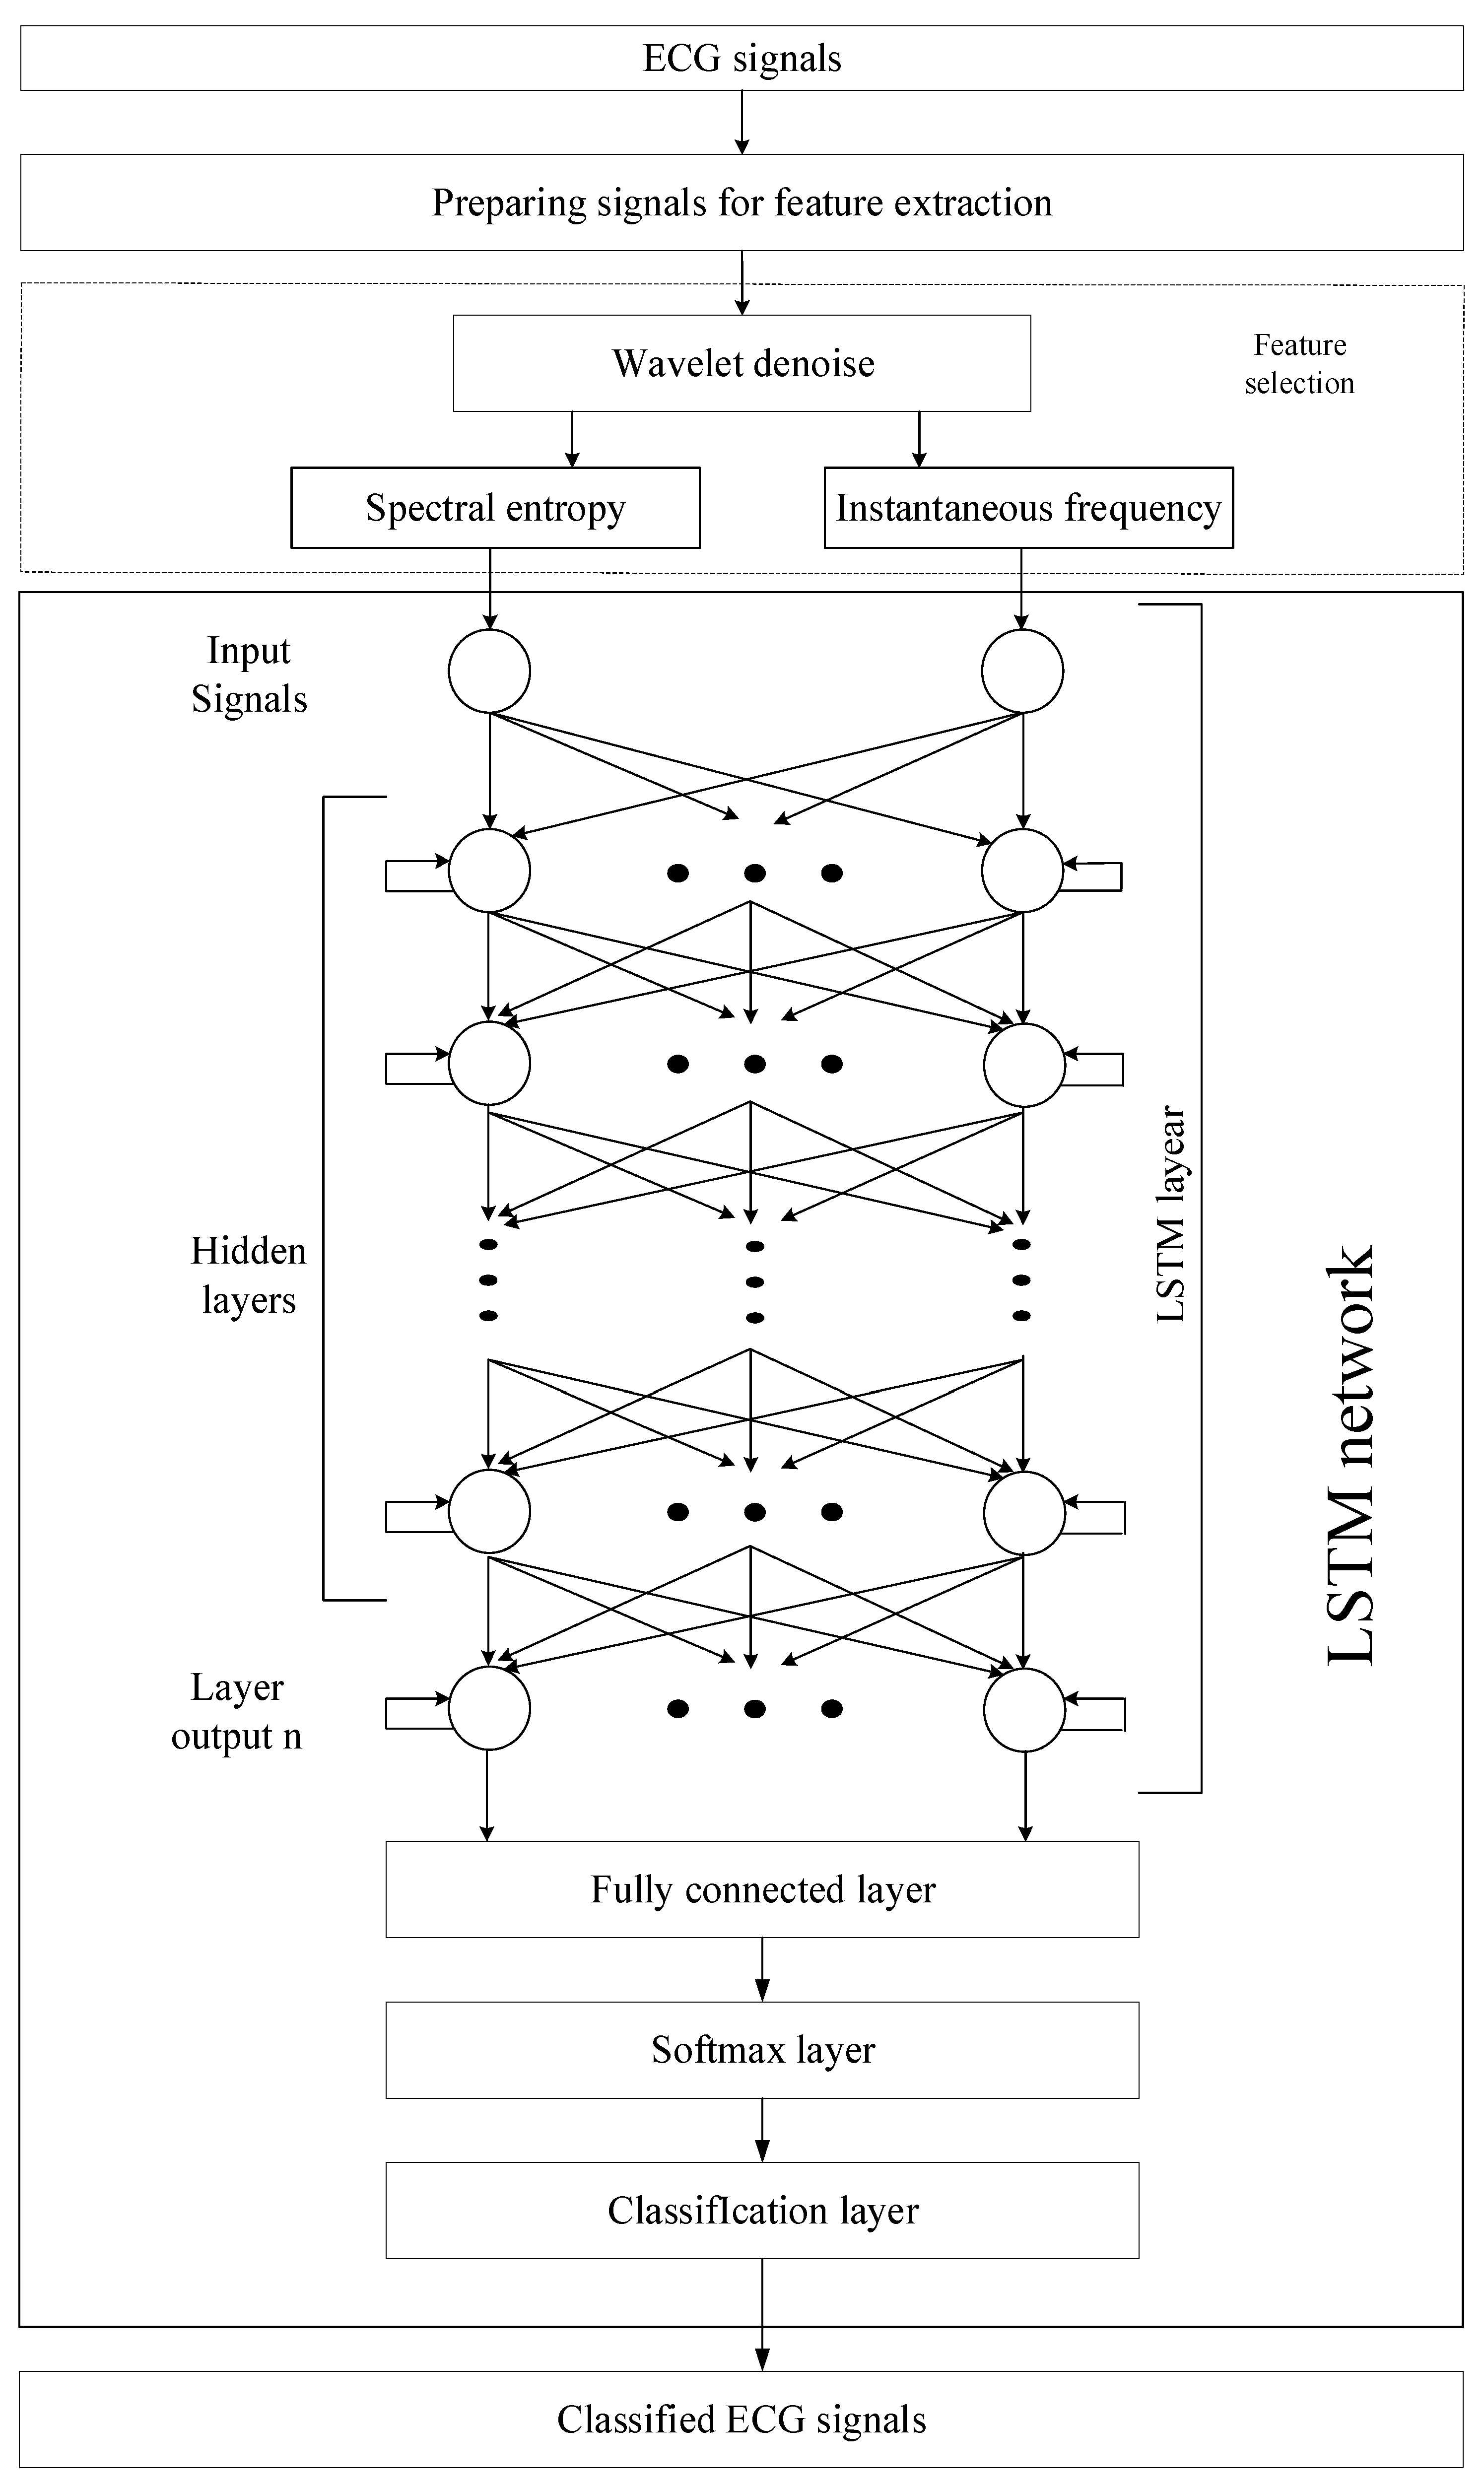
3.1. Neural Network System for Atrial Fibrillation Recognition by ECG Signal
3.2. Method for Pre-Processing of ECG Signals
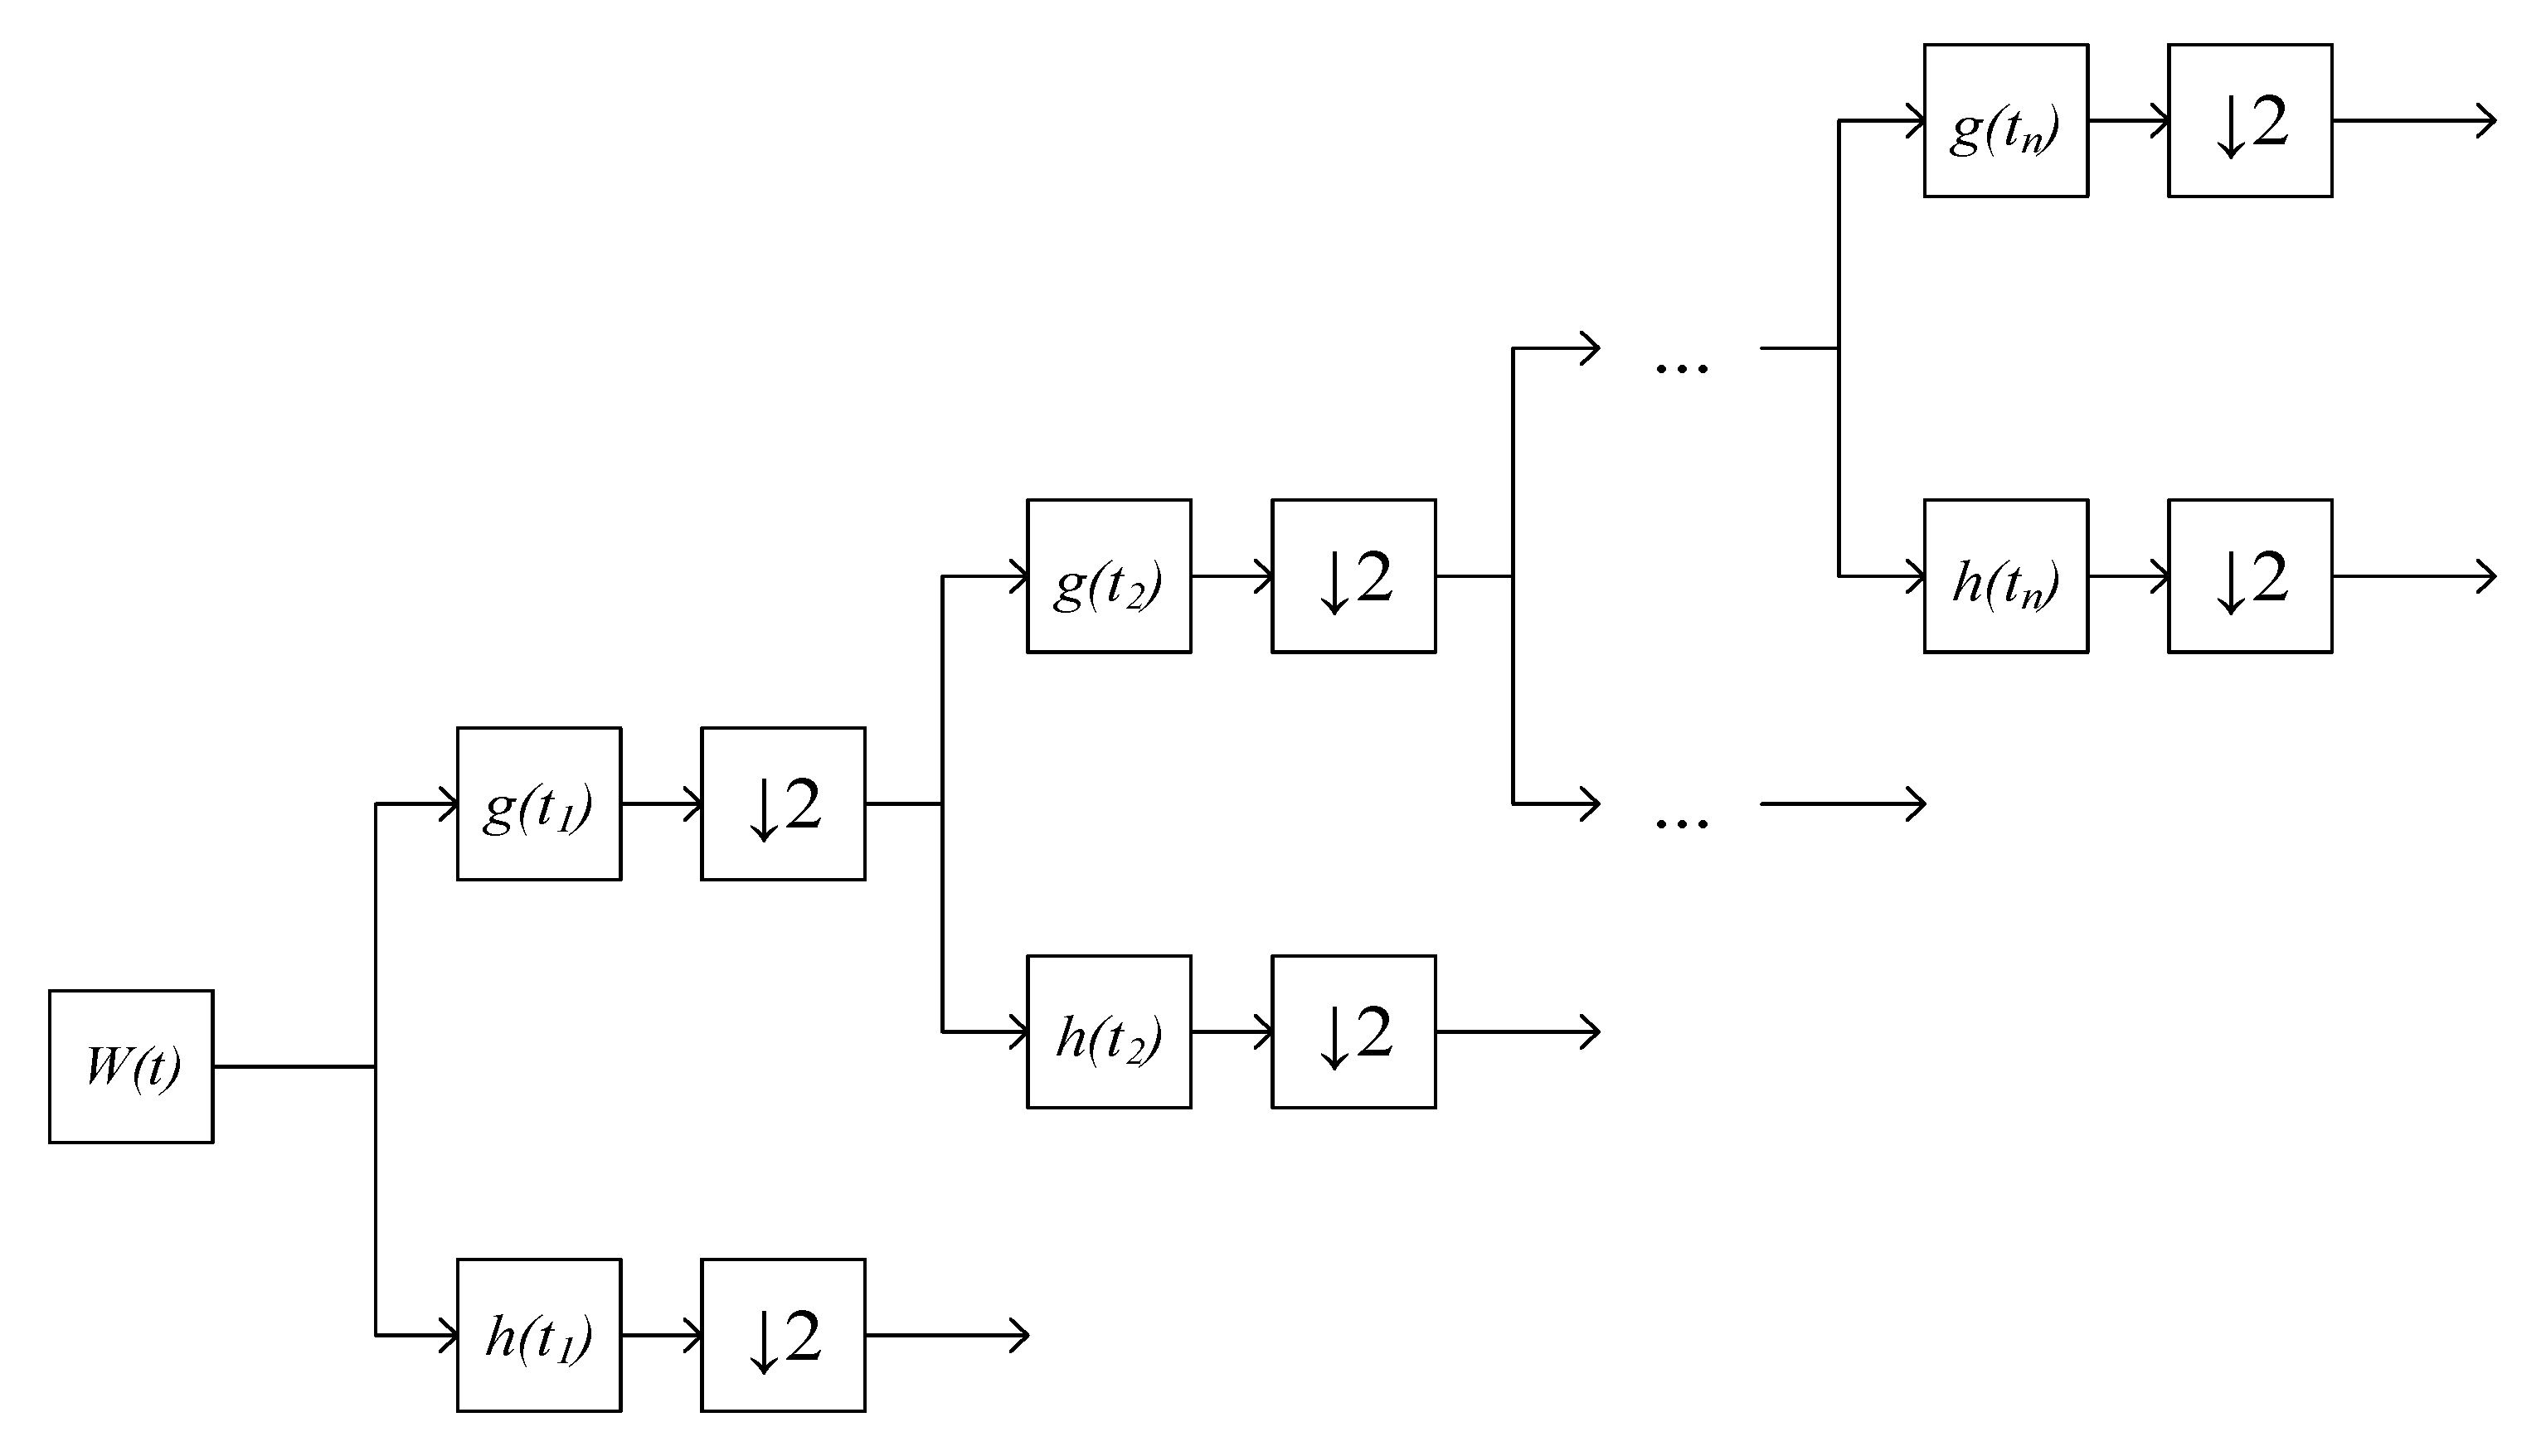
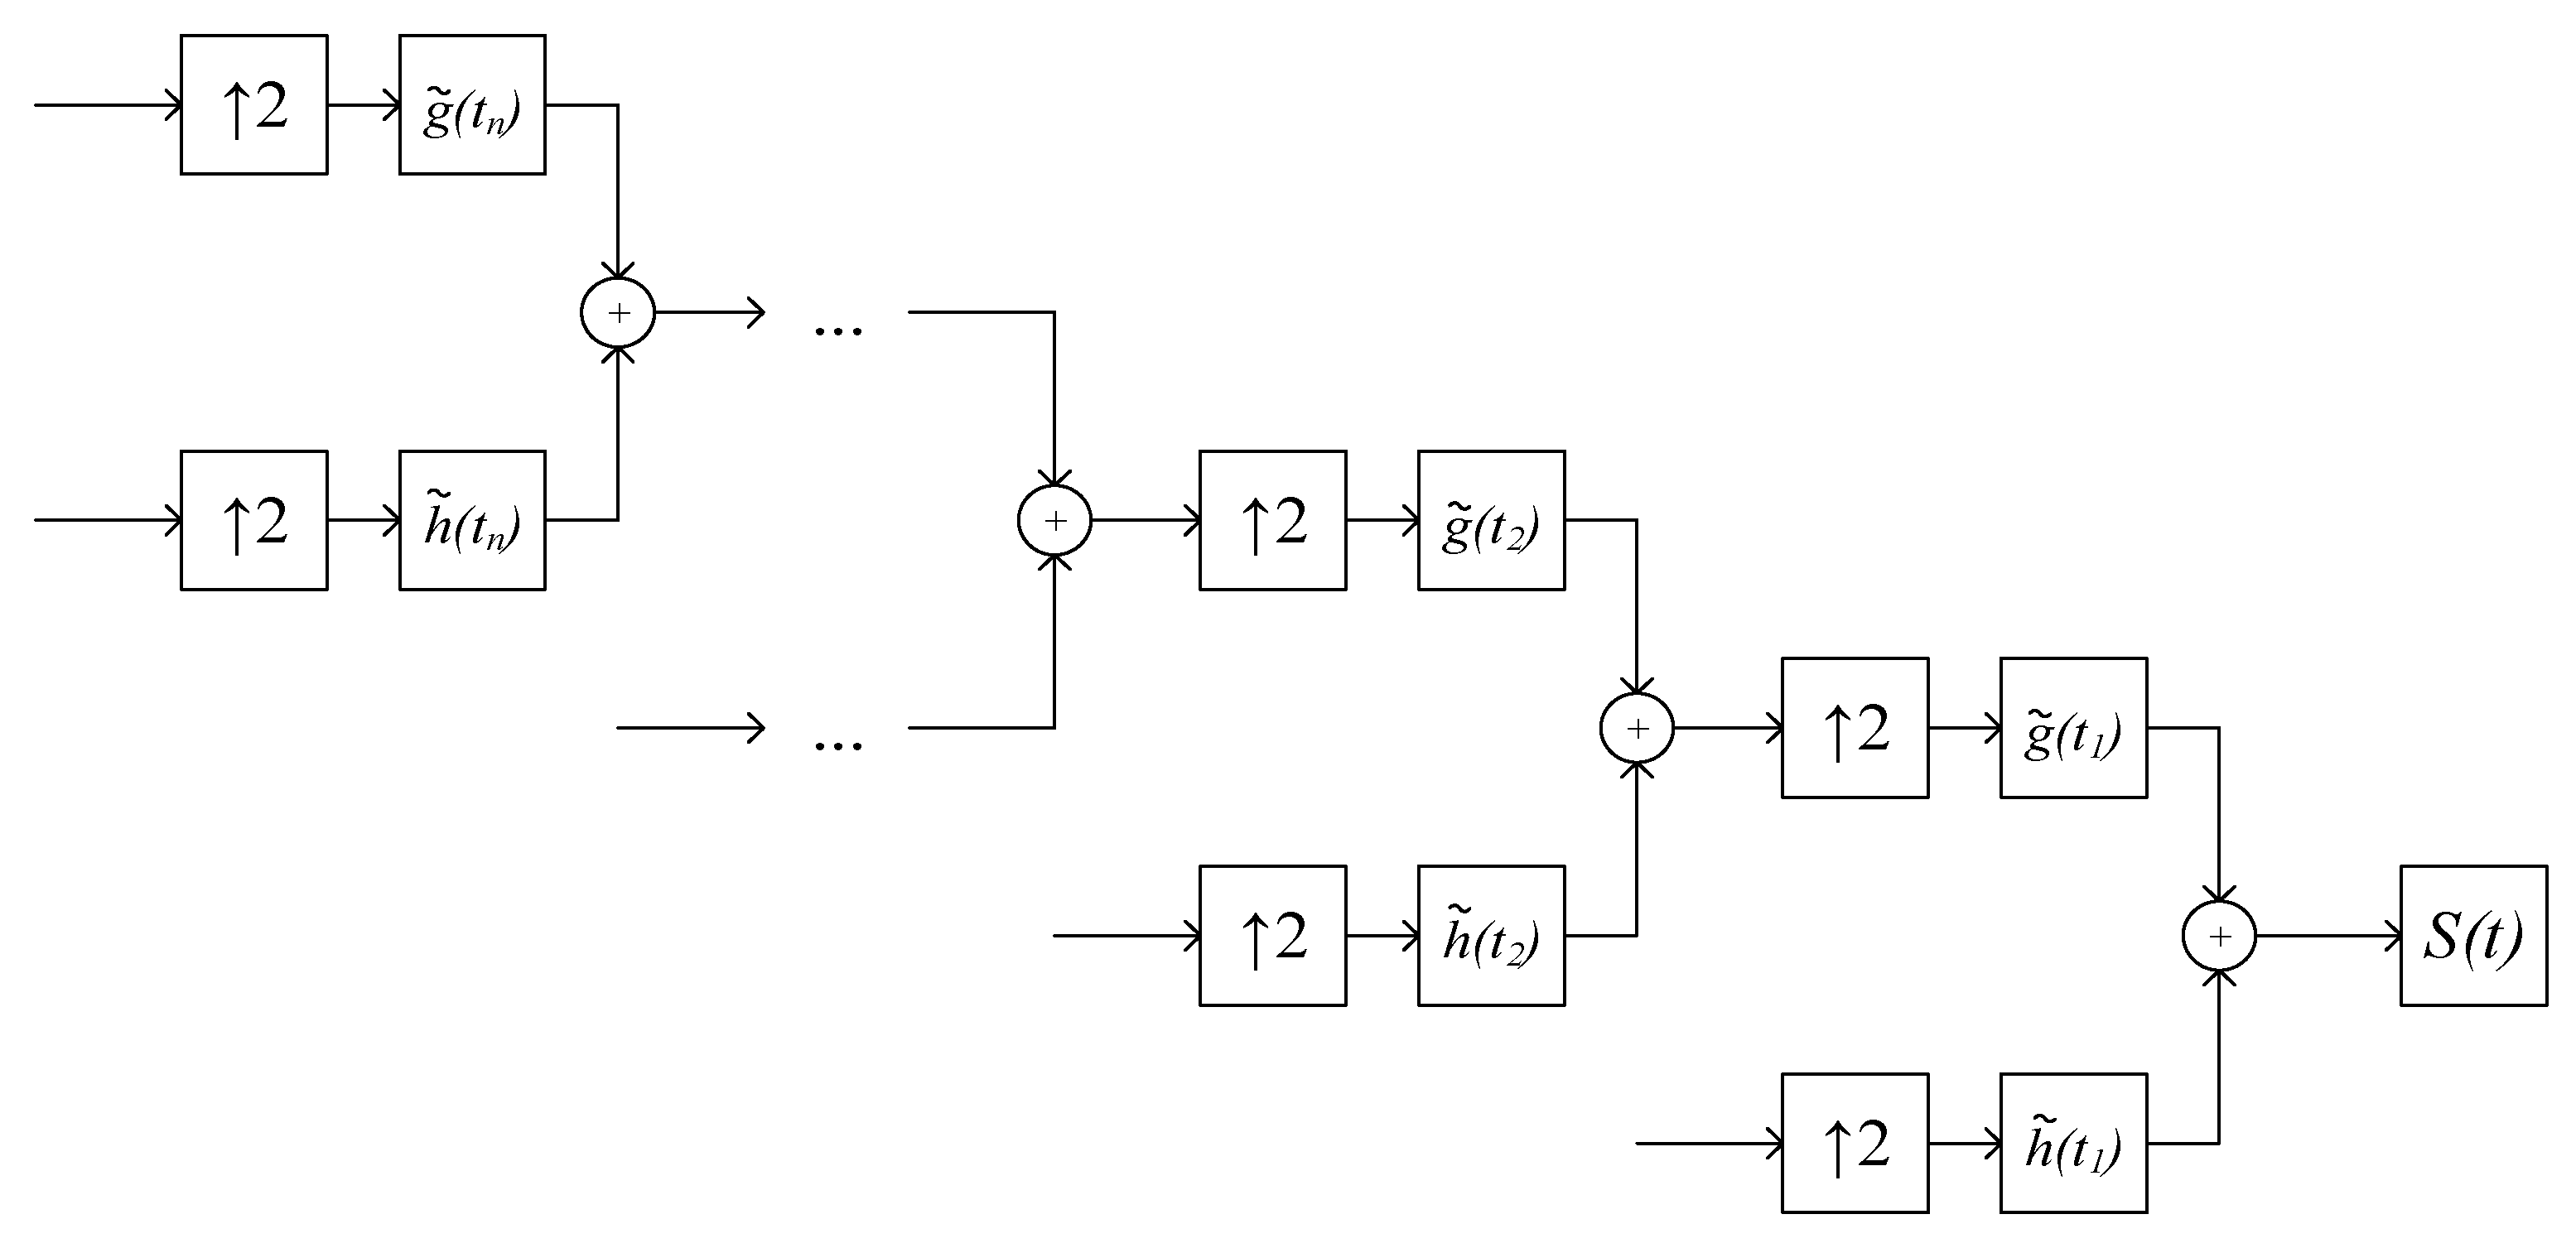
3.3. Removing Noise from ECG Signals Using a Discrete Wavelet Transform
3.4. Isolation of the P-Peak Feature Using Spectral Analysis
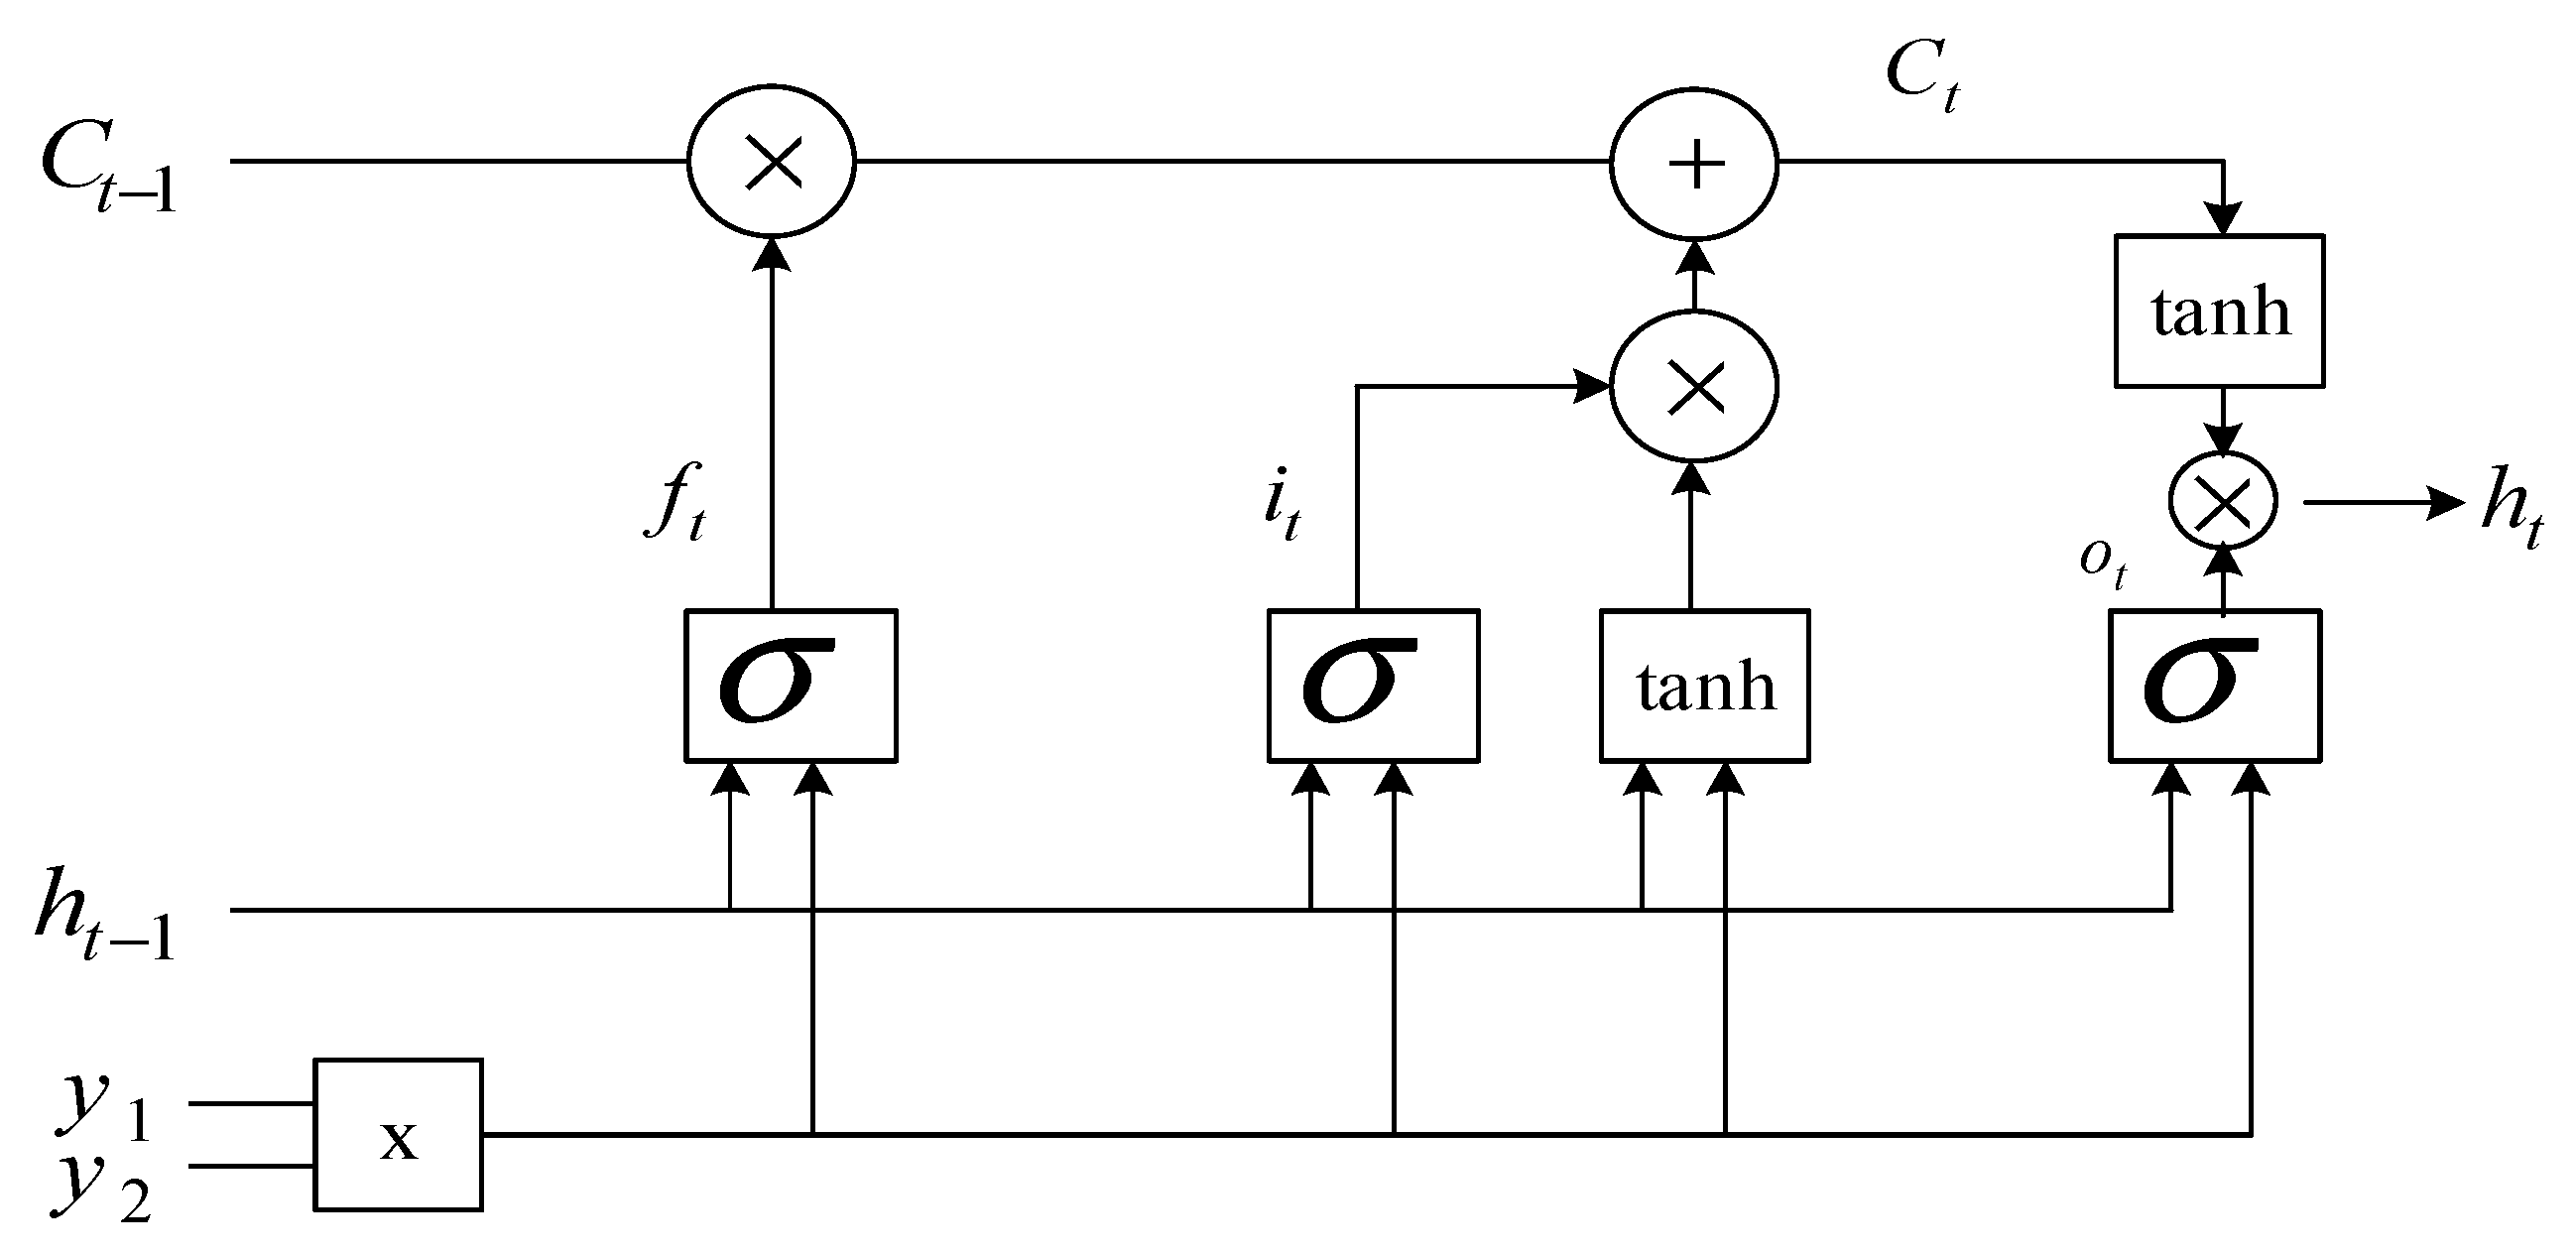
3.5. LSTM Processing of ECG Data
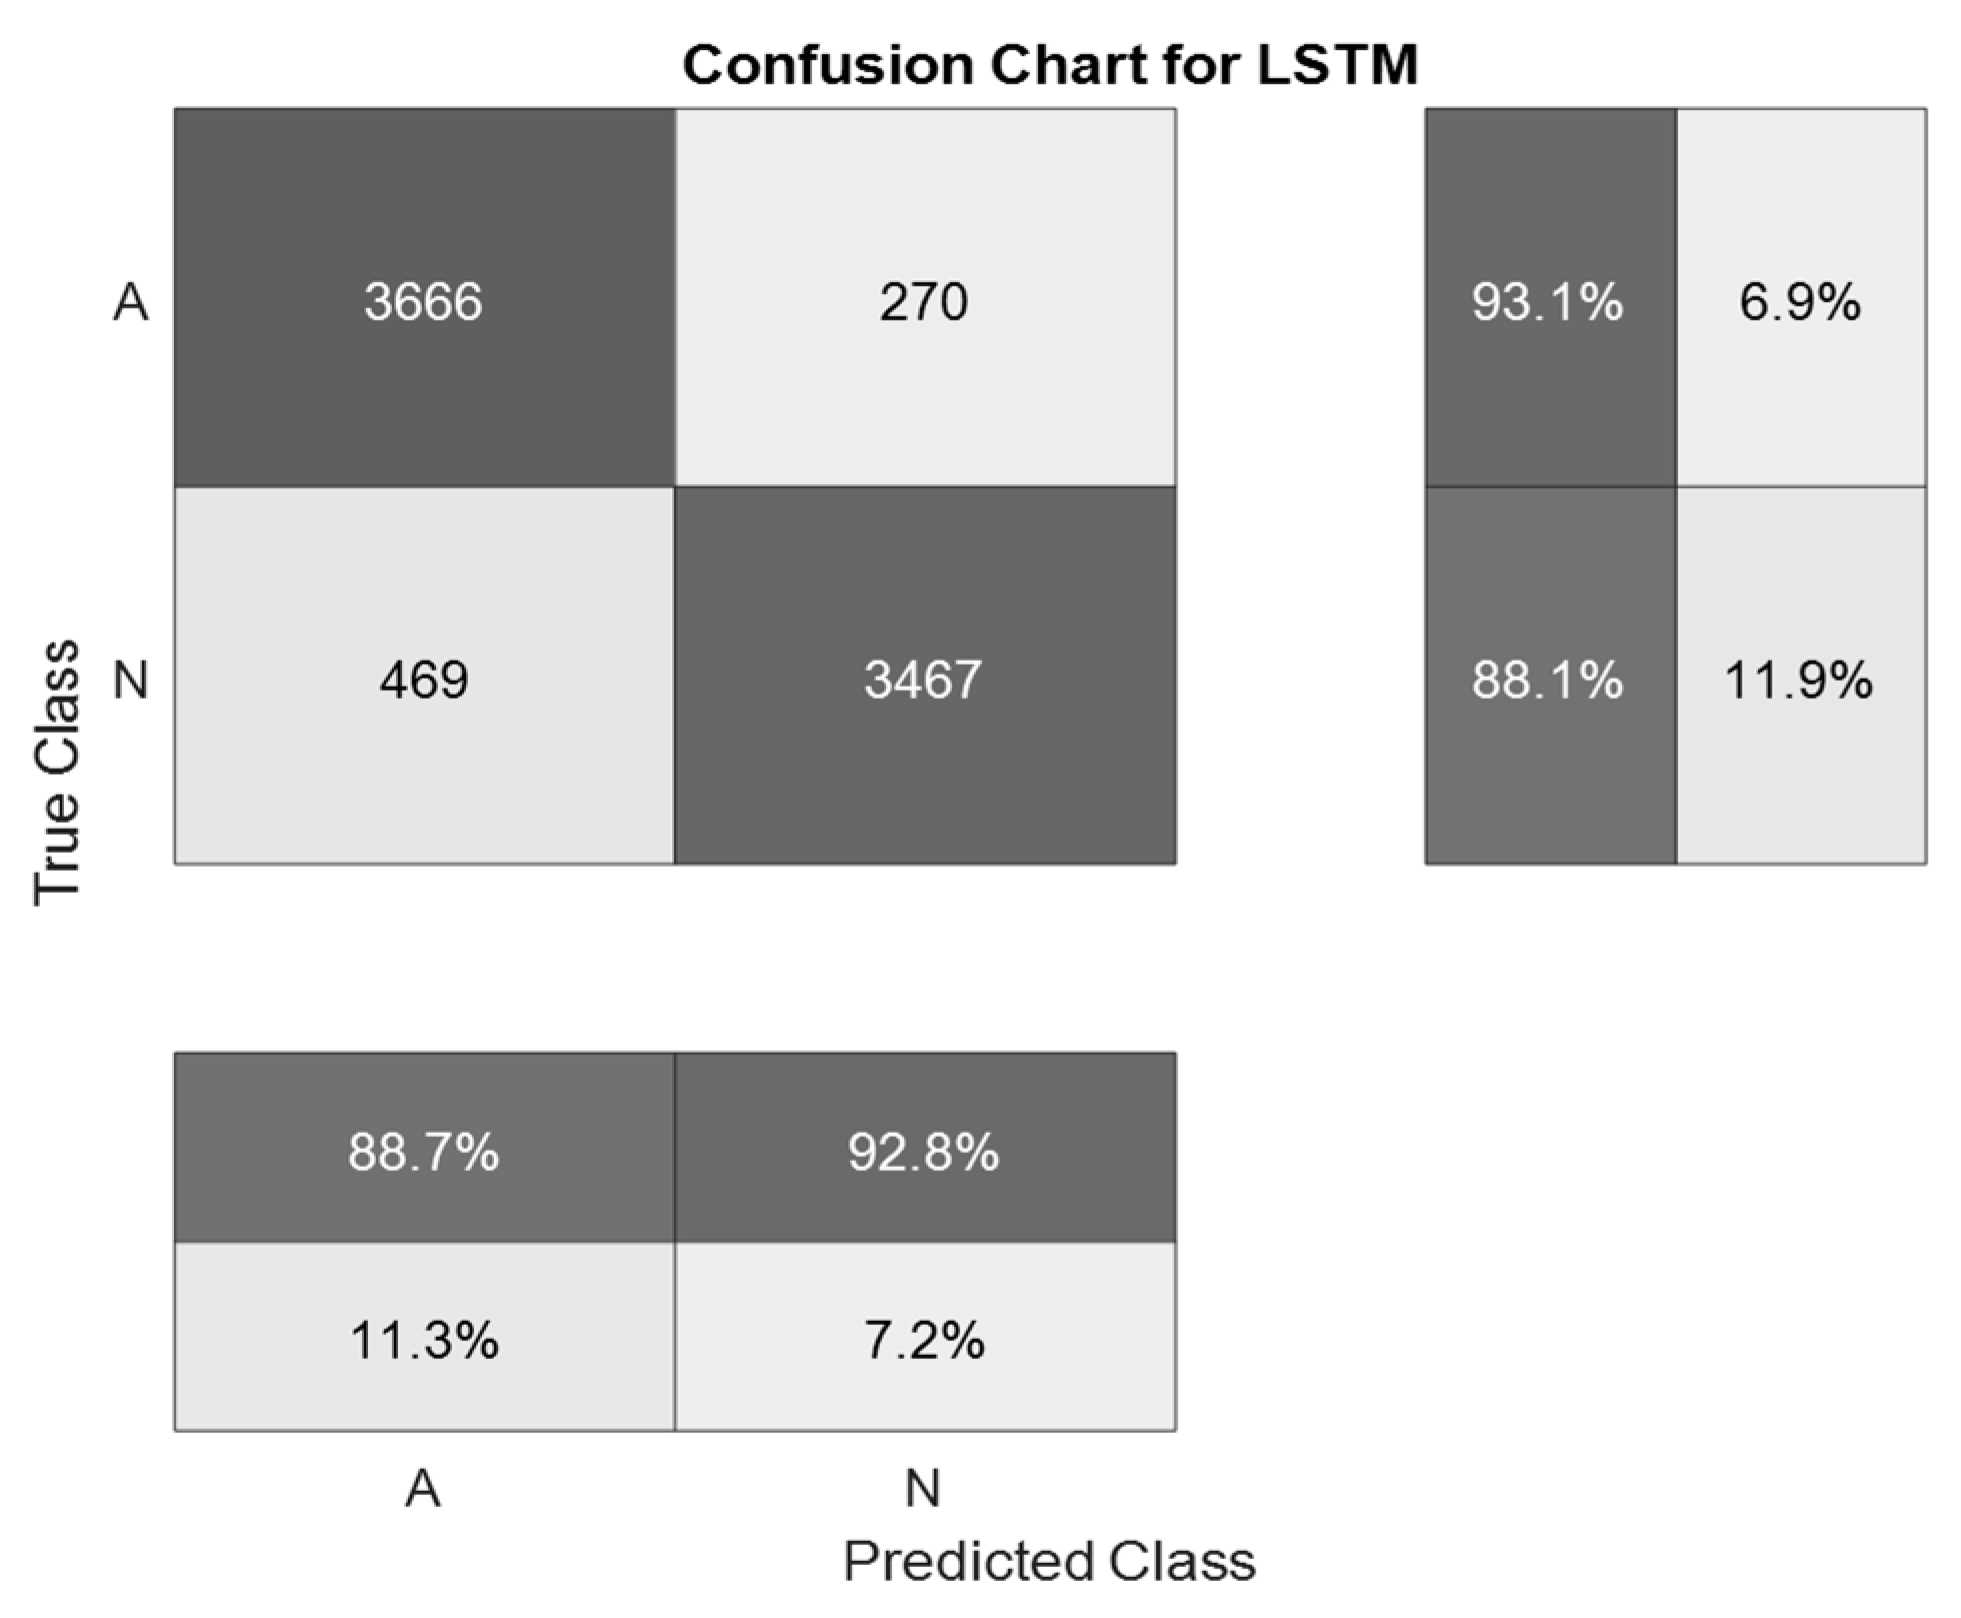
4. Results
5. Discussion
Author Contributions
Funding
Institutional Review Board Statement
Informed Consent Statement
Acknowledgments
Conflicts of Interest
References
- Wang, L.H.; Chen, T.Y.; Lee, S.Y.; Yang, T.H.; Huang, S.Y.; Wu, J.H.; Fang, Q. A wireless ECG acquisition SoC for body sen-sor network. In Proceedings of the 2012 IEEE Biomedical Circuits and Systems Conference (BioCAS), Taiwan, China, 28–30 November 2012; pp. 156–159. [Google Scholar]
- Buxi, D.; Berset, T.; Hijdra, M.; Tutelaers, M.; Geng, D.; Hulzink, J.; Van Noorloos, M.; Romero, I.; Torfs, T.; Van Helleputte, N. Wireless 3-lead ECG system with on-board digital signal processing for ambulatory monitoring. In Proceedings of the 2012 IEEE Biomedical Circuits and Systems Conference (BioCAS), Taiwan, China, 28–30 November 2012; pp. 308–311. [Google Scholar] [CrossRef]
- Martinez, J.P.; Almeida, R.; Olmos, S.; Rocha, A.P.; Laguna, P. A wavelet-based ECG delineator: Evaluation on standard da-tabases. IEEE Trans. Biomed. Eng. 2004, 51, 570–581. [Google Scholar] [CrossRef]
- Halhuber, M.J.; Günther, R.; Ciresa, M. Technique of ECG Recording. In ECG-An Introductory Course A Practical Introduction to Clinical Electrocardiography; Springer: Berlin/Heidelberg, Germany, 1979; pp. 141–145. [Google Scholar]
- Berbari, E.J.; Lander, P. The methods of recording and analysis of the signal averaged ECG. In Signal Averaged Electrocardiography; Springer: Dordrecht, The Netherland, 1993; pp. 49–68. [Google Scholar]
- Thirrunavukkarasu, R.R.; Meeradevi, T.; Ravi, A.; Ganesan, D.; Vadivel, G.P. Detection R Peak in Electrocardiogram Signal Using Daubechies Wavelet Transform and Shannon’s Energy Envelope. In Proceedings of the 2019 5th International Conference on Advanced Computing & Communication Systems (ICACCS), Coimbatore, India, 15–16 March 2019; pp. 1044–1048. [Google Scholar] [CrossRef]
- Lippi, G.; Sanchis-Gomar, F.; Cervellin, G. Global epidemiology of atrial fibrillation: An increasing epidemic and public health challenge. Int. J. Stroke 2020, 16, 217–221. [Google Scholar] [CrossRef] [PubMed]
- Goldberger, A.L.; Goldberger, Z.D.; Shivikin, A. Clinical Electrocardiography: A Simplified Approach E-Book; Elsevier Health Sciences: London, UK, 2017. [Google Scholar]
- Ahuja, A.S. The impact of artificial intelligence in medicine on the future role of the physician. PeerJ 2019, 7, e7702. [Google Scholar] [CrossRef]
- Huang, M.L.; Wu, Y.S. Classification of atrial fibrillation and normal sinus rhythm based on convolutional neural network. Biomed. Eng. Lett. 2020, 10, 183–193. [Google Scholar] [CrossRef]
- Hasan, N.I.; Bhattacharjee, A. Deep Learning Approach to Cardiovascular Disease Classification Employing Modified ECG Signal from Empirical Mode Decomposition. Biomed. Signal Process. Control. 2019, 52, 128–140. [Google Scholar] [CrossRef]
- Yildirim, Ö. A novel wavelet sequence based on deep bidirectional LSTM network model for ECG signal classification. Comput. Biol. Med. 2018, 96, 189–202. [Google Scholar] [CrossRef] [PubMed]
- Faust, O.; Shenfield, A.; Kareem, M.; San, T.R.; Fujita, H.; Acharya, U.R. Automated detection of atrial fibrillation using long short-term memory network with RR interval signals. Comput. Biol. Med. 2018, 102, 327–335. [Google Scholar] [CrossRef] [Green Version]
- Mundhe, P.; Pathrikar, A.K. An overview of implementation of efficient QRS Complex detector with FPGA. Int. J. Adv. Res. Comput. Commun. Eng. 2013, 2, 4041–4043. [Google Scholar]
- Pan, J.; Tompkins, W.J. A real-time QRS detection algorithm. IEEE Trans. Biomed. Eng. 1985, 3, 230–236. [Google Scholar] [CrossRef] [PubMed]
- Zhang, F.; Lian, Y. QRS Detection Based on Multiscale Mathematical Morphology for Wearable ECG Devices in Body Area Networks. IEEE Trans. Biomed. Circuits Syst. 2009, 3, 220–228. [Google Scholar] [CrossRef]
- Abo-Zahhad, M.; Ahmed, S.M.; Zakaria, A. An Efficient Technique for Compressing ECG Signals Using QRS Detection, Estimation, and 2D DWT Coefficients Thresholding. Model. Simul. Eng. 2012, 2012, 1–10. [Google Scholar] [CrossRef]
- Anant, K.S.; Dowla, F.U.; Rodrigue, G.H. Detection of the electrocardiogram P-wave using wavelet analysis. Int. Soc. Opt. Photonics 1994, 2242, 744–750. [Google Scholar] [CrossRef] [Green Version]
- Yang, H.; Bukkapatnam, S.; Komanduri, R. Nonlinear adaptive wavelet analysis of electrocardiogram signals. Phys. Rev. E 2007, 76, 026214. [Google Scholar] [CrossRef] [PubMed]
- Kumar, A.; Komaragiri, R.; Kumar, M. Design of wavelet transform based electrocardiogram monitoring system. ISA Trans. 2018, 80, 381–398. [Google Scholar] [CrossRef]
- Fujita, H.; Cimr, D. Computer Aided detection for fibrillations and flutters using deep convolutional neural network. Inf. Sci. 2019, 486, 231–239. [Google Scholar] [CrossRef]
- Bnou, K.; Raghay, S.; Hakim, A. A wavelet denoising approach based on unsupervised learning model. EURASIP J. Adv. Signal. Process. 2020, 2020, 1–26. [Google Scholar] [CrossRef]
- Chavan, M.S.; Mastorakis, N.; Chavan, M.N.; Gaikwad, M.S. Implementation of SYMLET wavelets to removal of Gaussian additive noise from speech signal. In Proceedings of the Recent Researches in Communications, Automation, Signal Processing, Nano-technology, Astronomy and Nuclear Physics: 10th WSEAS International Conference on Electronics, Hardware, Wireless and Optical Communications (EHAC’11), Cambridge, UK, 20–22 February 2011; p. 37. [Google Scholar]
- Luo, G.; Zhang, D. Wavelet Denoising. Adv. Wavelet Theory Appl. Eng. Phys. Technol. 2012, 634. [Google Scholar] [CrossRef] [Green Version]
- Zarei, A.; Asl, B.M. Automatic Detection of Obstructive Sleep Apnea Using Wavelet Transform and Entropy-Based Features from Single-Lead ECG Signal. IEEE J. Biomed. Health Informatics 2018, 23, 1011–1021. [Google Scholar] [CrossRef]
- Donoho, D.L.; Johnstone, J.M. Ideal adaption by wavelet shrinkage. Biometrika 1994, 81, 425–455. [Google Scholar] [CrossRef]
- Boashash, B. Estimating and interpreting the instantaneous frequency of a signal. I. Fundamentals. Proc. IEEE 1992, 80, 520–538. [Google Scholar] [CrossRef]
- Carson, J.R.; Fry, T.C. Variable Frequency Electric Circuit Theory with Application to the Theory of Frequency-Modulation. Bell Syst. Tech. J. 1937, 16, 513–540. [Google Scholar] [CrossRef]
- Van der Pol, B. The fundamental principles of frequency modulation. J. Inst. Electr. Eng. Part III Radio Commun. Eng. 1946, 93, 153–158. [Google Scholar] [CrossRef]
- Hochreiter, S.; Schmidhuber, J. Long Short-Term Memory. Neural Comput. 1997, 9, 1735–1780. [Google Scholar] [CrossRef]
- PhysioNet Computing in Cardiology Challenge 2017 (CinC Challenge). Available online: http://physionet.org/challenge/2017/ (accessed on 13 March 2021).
- Mahmoodabadi, S.Z.; Ahmadian, A.; Abolhasani, M.D.; Eslami, M.; Bidgoli, J.H. ECG Feature Extraction Based on Multi-resolution Wavelet Transform. In Proceedings of the 2005 IEEE Engineering in Medicine and Biology 27th Annual Conference, Shanghai, China, 1–4 September 2005; pp. 3902–3905. [Google Scholar]
- Andreotti, F.; Carr, O.; Pimentel, M.A.F.; Mahdi, A.; De Vos, M. Comparing Feature Based Classifiers and Convolutional Neural Networks to Detect Arrhythmia from Short Segments of ECG. In Proceedings of the 2017 Computing in Cardiology (CinC), Rennes, France, 24–27 September 2017. [Google Scholar] [CrossRef]
- Billeci, L.; Costi, M.; Lombardi, D.; Chiarugi, F.; Varanini, M. Automatic Detection of Atrial Fibrillation and Other Ar-rhythmias in ECG Recordings Acquired by a Smartphone Device. Electronics 2018, 7, 199. [Google Scholar] [CrossRef] [Green Version]
- Wang, J.; Li, W. Atrial Fibrillation Detection and ECG Classification based on CNN-BiLSTM. arXiv 2020, arXiv:2011.06187. [Google Scholar]
- Jin, Y.; Qin, C.; Huang, Y.; Zhao, W.; Liu, C. Multi-domain modeling of atrial fibrillation detection with twin attentional convolutional long short-term memory neural networks. Knowl. Based Syst. 2020, 193, 105460. [Google Scholar] [CrossRef]
- Zheng, Z.; Chen, Z.; Hu, F.; Zhu, J.; Tang, Q.; Liang, Y. An automatic diagnosis of arrhythmias using a combination of CNN and LSTM technology. Electronics 2020, 9, 121. [Google Scholar] [CrossRef] [Green Version]


| Number of DWT Levels | Number of Samples on the ECG Signal |
|---|---|
| 1 | |
| 2 | |
| … | … |
| n |
| Wavelet | Learning Outcome, % |
|---|---|
| symlet 2 | 66.1 |
| symlet 3 | 71.0 |
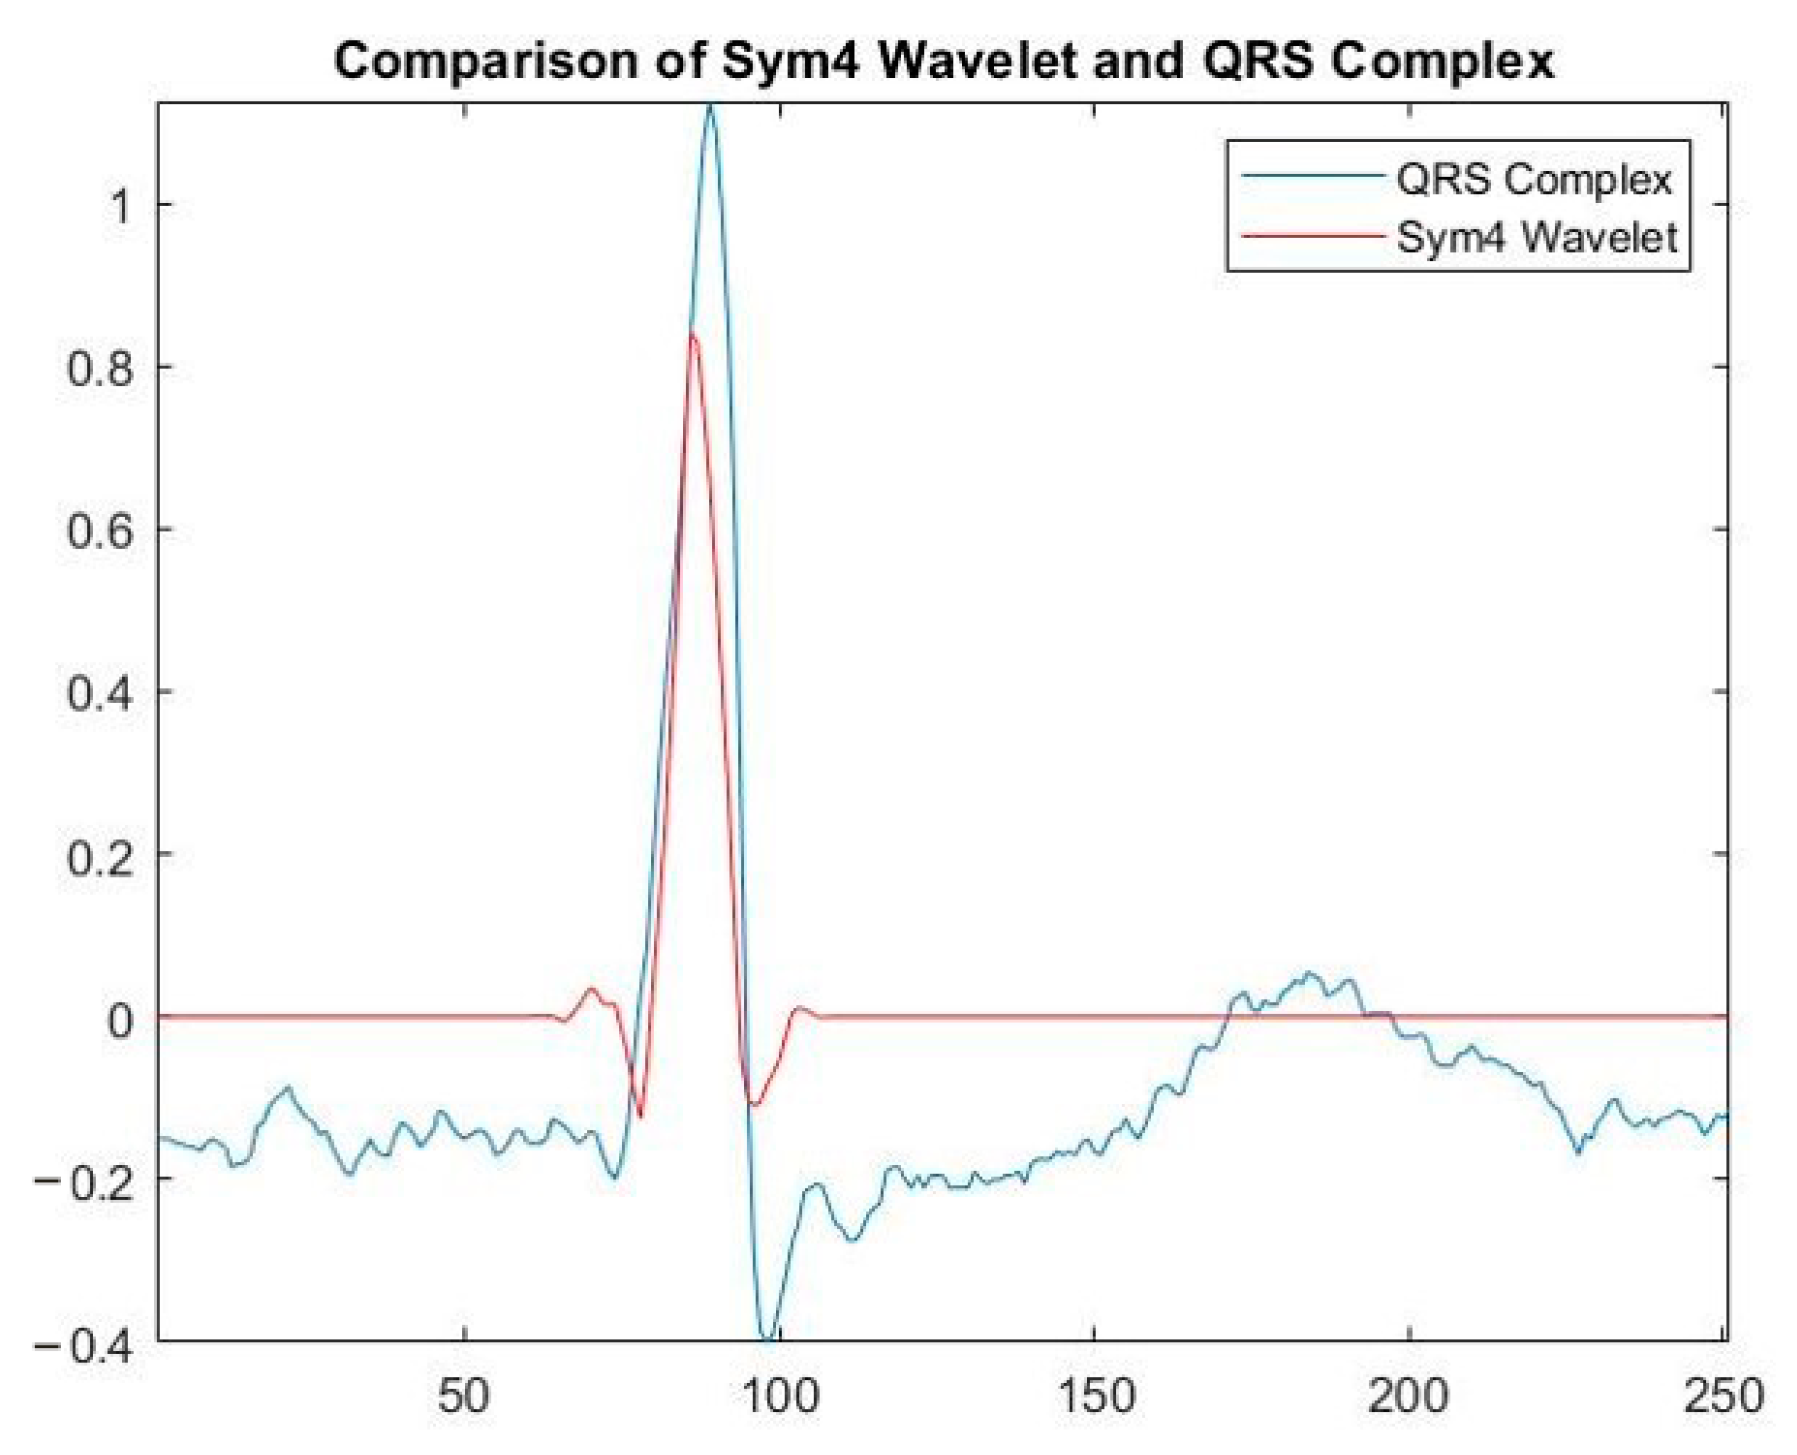
| symlet 4 | 78.0 |
| symlet 5 | 87.5 |
| symlet 6 | 82.1 |
| ECG Processing Method | Accuracy of Atrial Fibrillation Recognition on the ECG Signal, % | |
|---|---|---|
| Known methods | One-dimensional LSTM without signal preprocessing | 53.8 |
| A standard example offered in MatLab2020b environment | 70.2 | |
| [33] | 79.0 | |
| [34] | 83.0 | |
| [35] | 82.0 | |
| Proposed methods | First simulation | 87.5 |
| Second simulation | 87.4 | |
Publisher’s Note: MDPI stays neutral with regard to jurisdictional claims in published maps and institutional affiliations. |
© 2021 by the authors. Licensee MDPI, Basel, Switzerland. This article is an open access article distributed under the terms and conditions of the Creative Commons Attribution (CC BY) license (https://creativecommons.org/licenses/by/4.0/).
Share and Cite
Lyakhov, P.; Kiladze, M.; Lyakhova, U. System for Neural Network Determination of Atrial Fibrillation on ECG Signals with Wavelet-Based Preprocessing. Appl. Sci. 2021, 11, 7213. https://doi.org/10.3390/app11167213
Lyakhov P, Kiladze M, Lyakhova U. System for Neural Network Determination of Atrial Fibrillation on ECG Signals with Wavelet-Based Preprocessing. Applied Sciences. 2021; 11(16):7213. https://doi.org/10.3390/app11167213
Chicago/Turabian StyleLyakhov, Pavel, Mariya Kiladze, and Ulyana Lyakhova. 2021. "System for Neural Network Determination of Atrial Fibrillation on ECG Signals with Wavelet-Based Preprocessing" Applied Sciences 11, no. 16: 7213. https://doi.org/10.3390/app11167213
APA StyleLyakhov, P., Kiladze, M., & Lyakhova, U. (2021). System for Neural Network Determination of Atrial Fibrillation on ECG Signals with Wavelet-Based Preprocessing. Applied Sciences, 11(16), 7213. https://doi.org/10.3390/app11167213