
Estimating the Probability Distribution of Construction Project Completion Times Based on Drum-Buffer-Rope Theory


Abstract
1. Introduction and Literature Review
2. Theory of Constraints
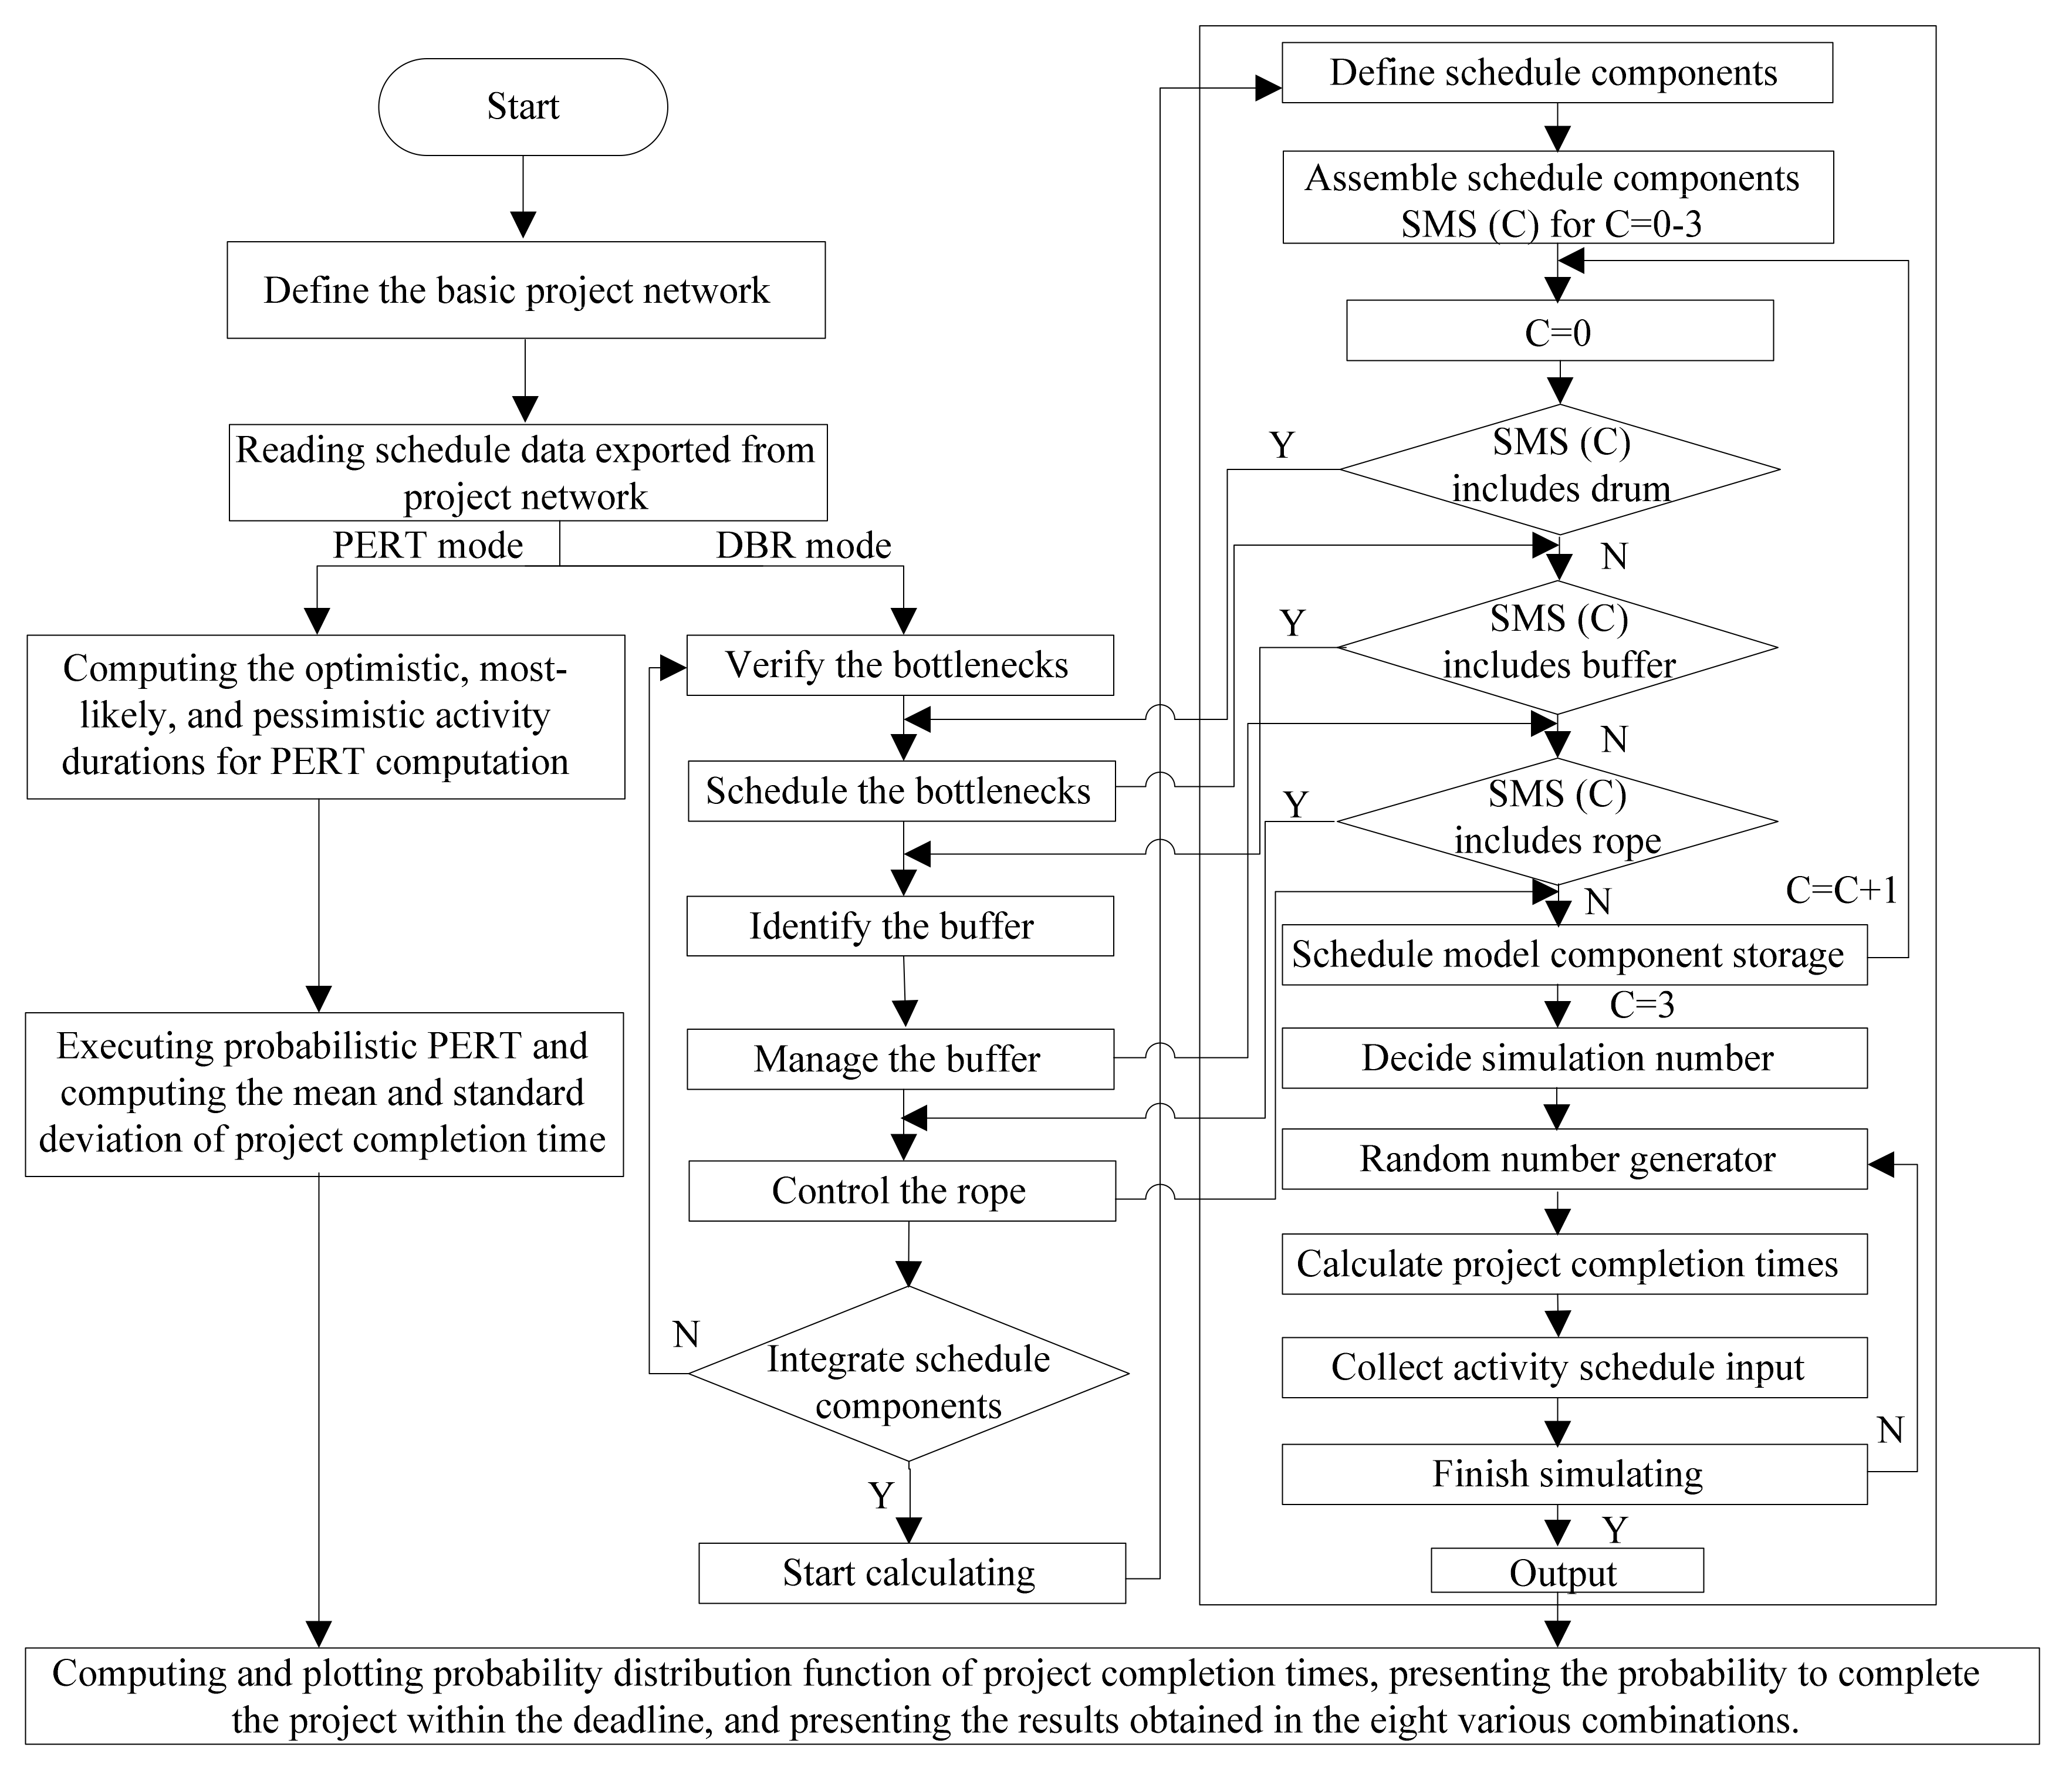
3. Method
3.1. Identification and Scheduling of the Bottleneck Operations
3.1.1. Identification the Bottleneck Operations
- (1)
- Project duration is influenced by the major critical path of which the total time difference is zero or minimum. If duration on the critical path does not match the schedule, it makes the start time of subsequent activities and project completion time change.
- (2)
- When the DBR schedule management technique is applied in the process of compiling a project schedule, since the bottleneck operations must limit operation, which reduces the certainty of project completion time, the bottleneck operation must exist in the critical path. The degree of uncertain operational time can be used as the selection standard of bottleneck operations. In other words, the greater the standard deviation of the operation time that is given, the higher possibility that it may be the bottleneck operation.
- (3)
- Sometimes the critical path is not only one, and each critical path may have a chance to have an effect on distribution of construction, in addition to considering the standard deviation of operation duration, selecting the bottleneck operations also needs to take into account the standard deviation of critical path completion duration at the same time.
- (4)
- When there are several bottlenecks in a project network, the impact of the operation near the convergence point is higher than other operations, and the operation closest to the convergence point should be chosen.
3.1.2. Scheduling of the Bottleneck Operations
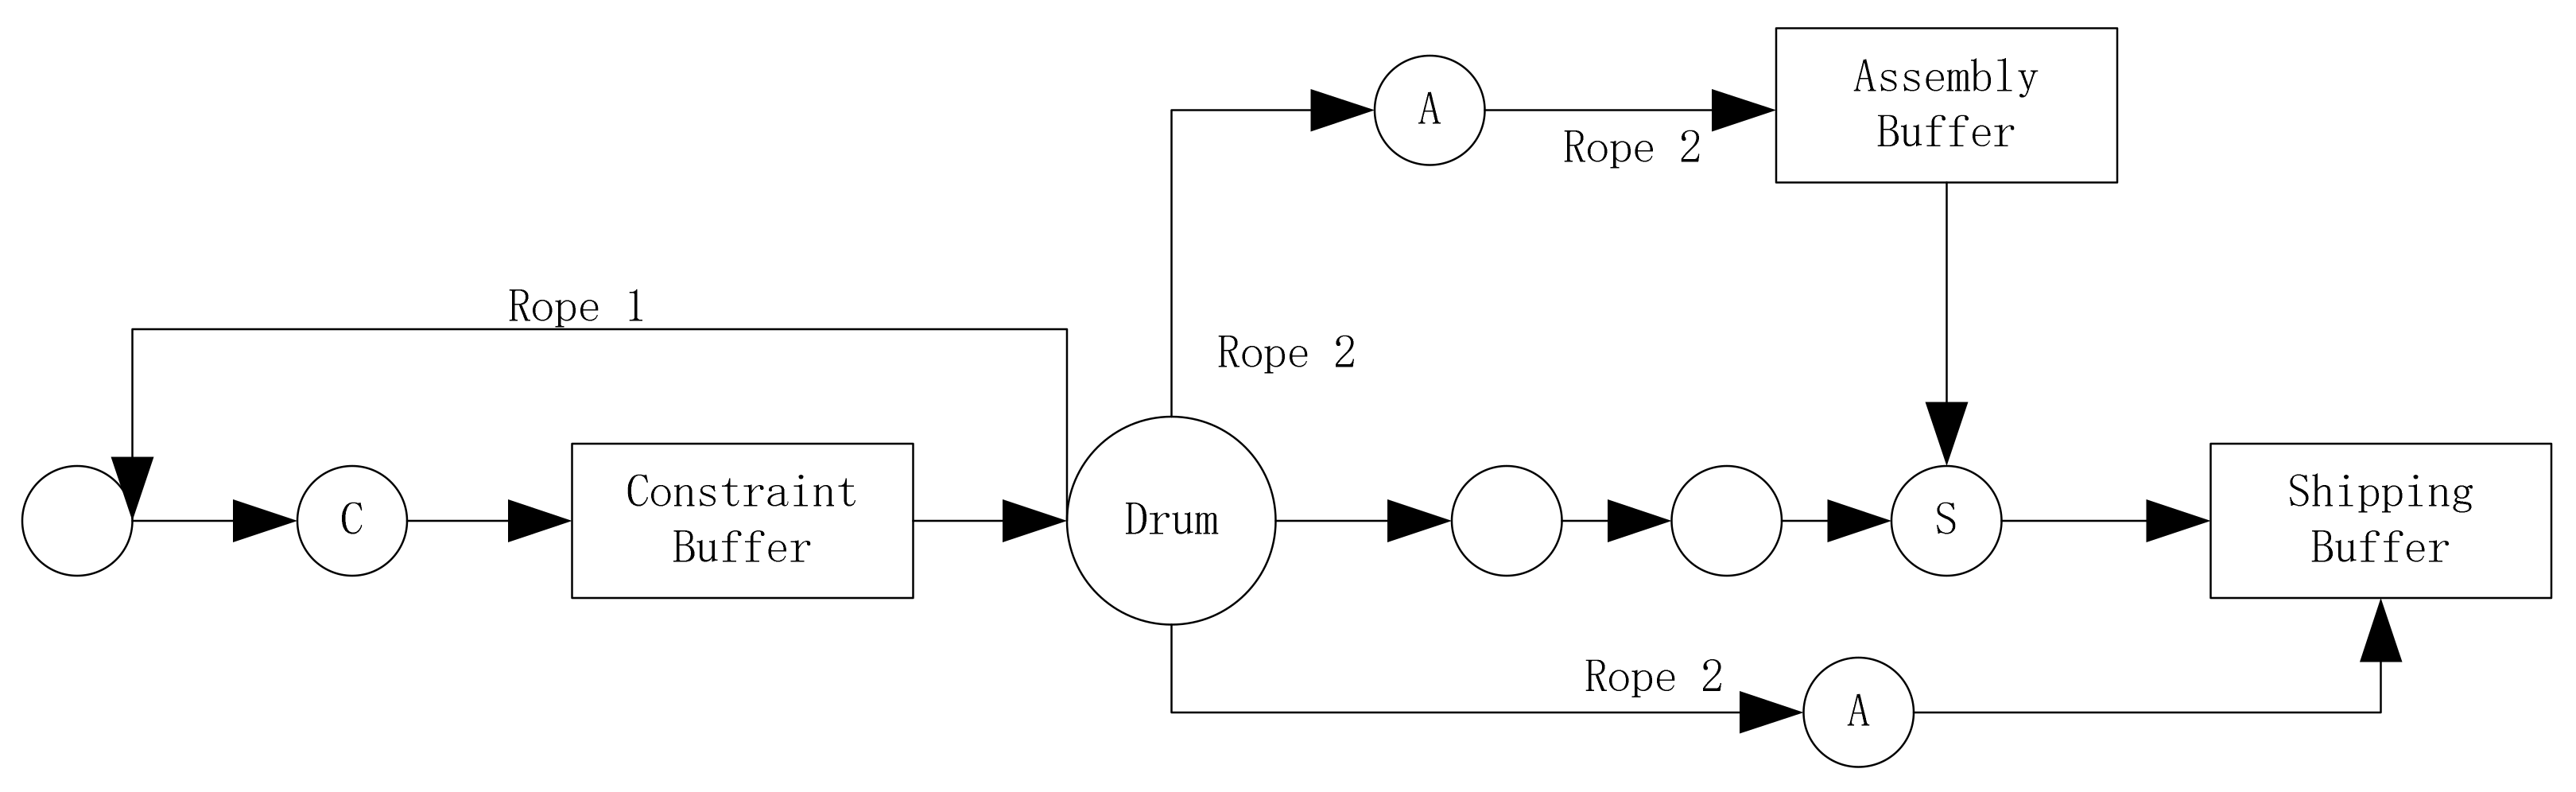
3.2. Determine Buffer Time of Bottleneck Activities
- = Constraint buffer (CB) time;
- = Assembly buffer (AB) time;
- = Shipping buffer (SB) time;
- = Pessimistic duration all predecessor activities of constraint buffer;
- = Expected duration of all predecessor activities of constraint buffer;
- = Pessimistic duration of all predecessor activities of assembly buffer;
- = Expected duration of all predecessor activities of assembly buffer;
- = Pessimistic duration of all predecessor activities of shipping buffer;
- = Expected duration of all predecessor activities of shipping buffer;
- = Set of predecessor activities of constraint buffer;
- = Set of predecessor activities assembly buffer;
- = Set of predecessor activities shipping buffer.
- = Buffer time of activity before the bottleneck buffer;
- = Buffer time of activity before assembly buffer;
- = Buffer time of predecessor activity before shipping buffer;
- = Expected project duration;
- = Pessimistic duration of predecessor activity before constraint buffer;
- = Pessimistic duration of predecessor activity before assembly buffer;
- = Pessimistic duration of predecessor activities of before shipping buffer.
- = Pessimistic duration without buffer time of predecessor activity before CB;
- = Pessimistic duration without buffer time of predecessor activity before AB;
- = Pessimistic duration without buffer time of predecessor activity before SB.
3.3. Constraint Buffer Management of Activities
- = Expected duration of all predecessor activities of CB without the buffer time;
- = Start time of activity ;
- = Optimistic duration of activity ;
- = Most possible duration of activity ;
- = Pessimistic duration without buffer time of predecessor activity before constraint time.
3.4. Simulation of Construction Project Scheduling in DBR Model
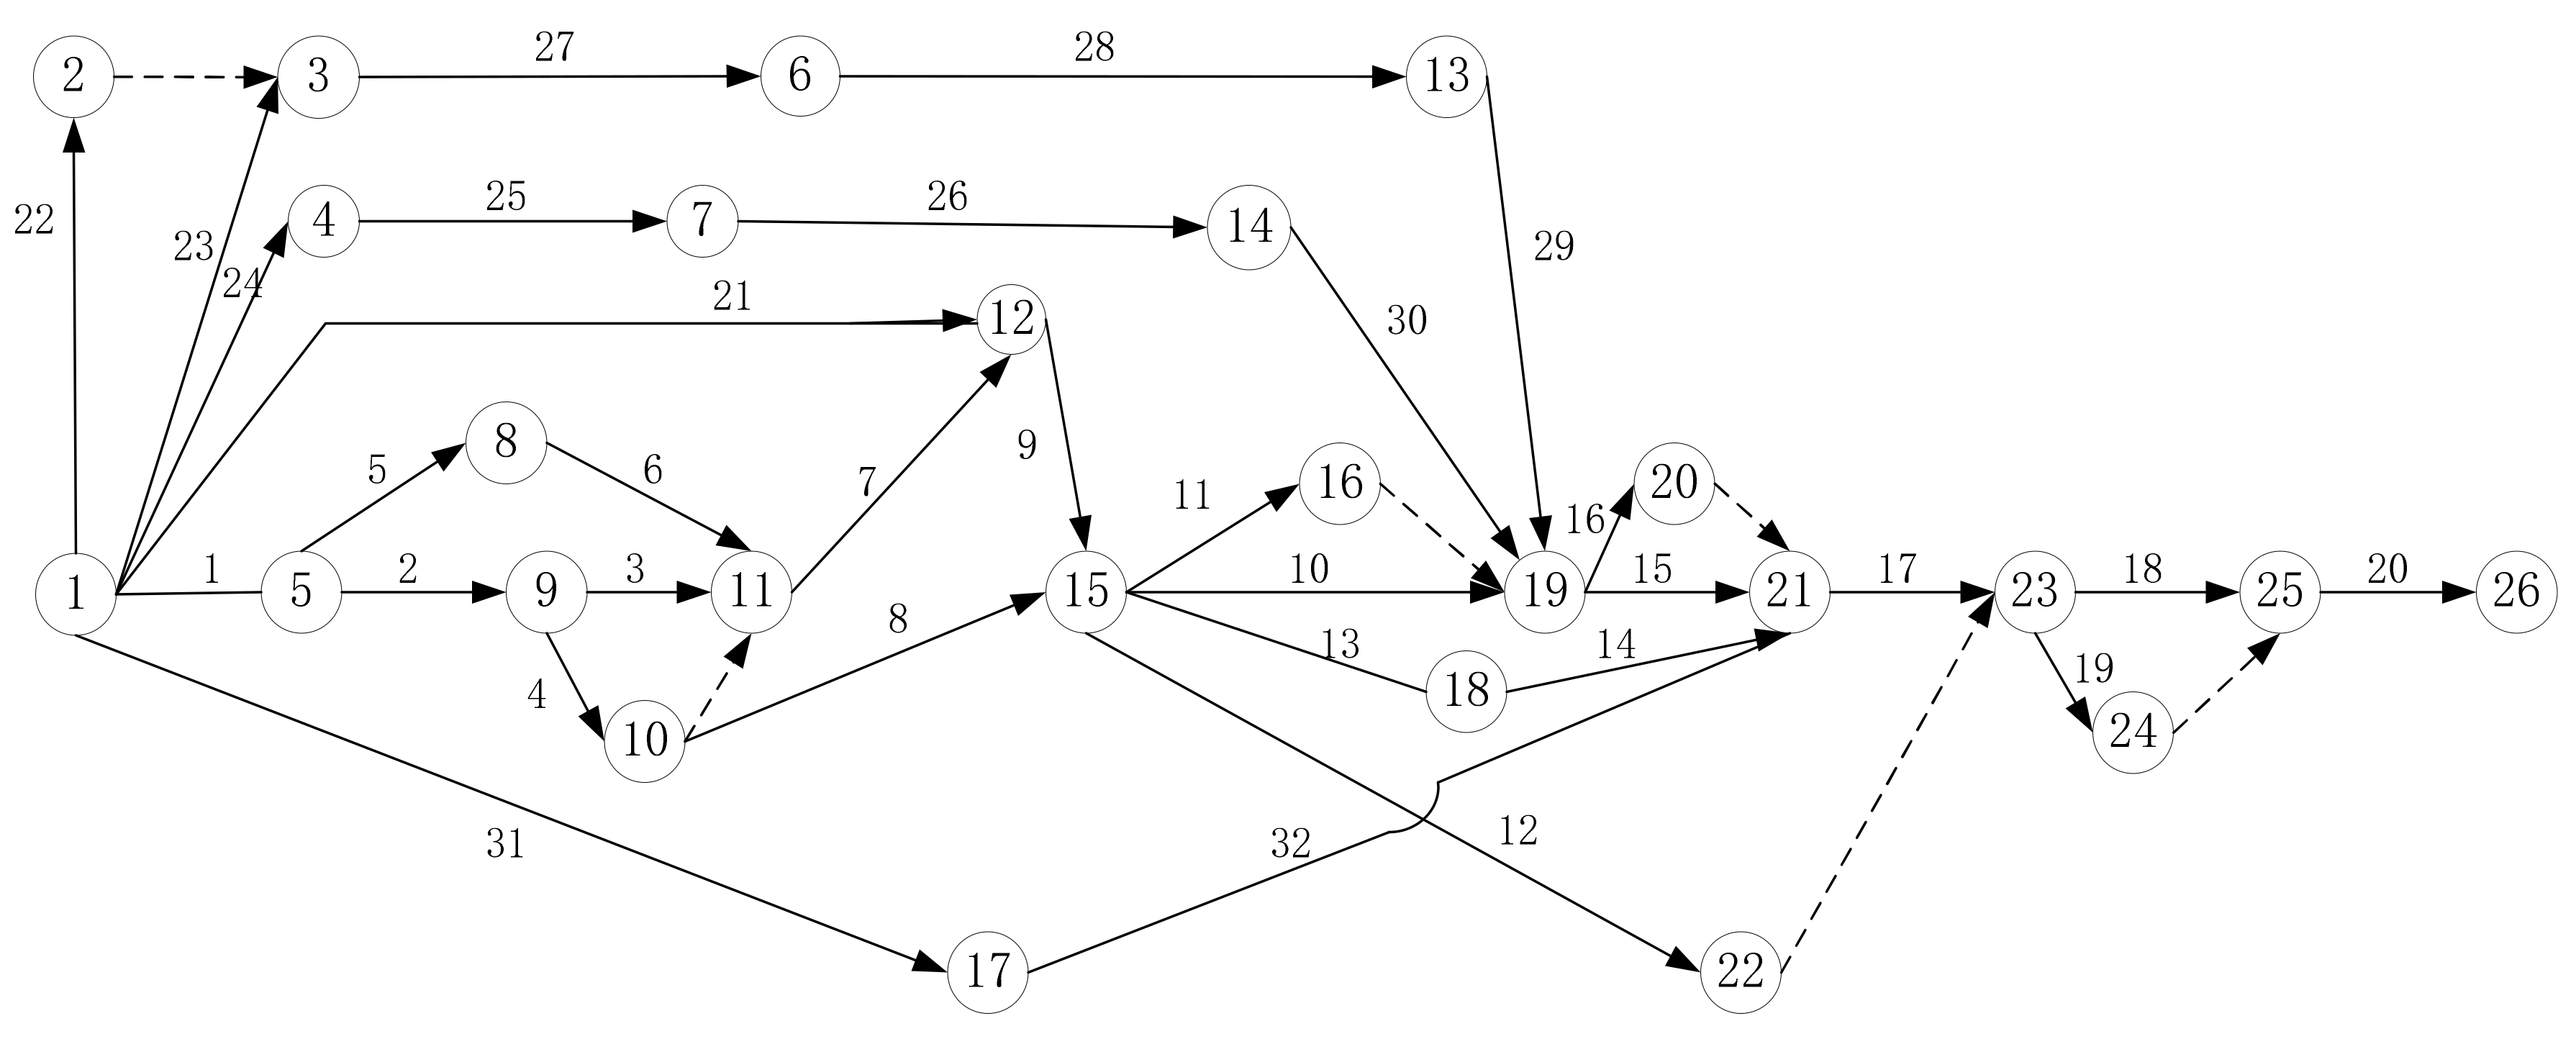
4. Empirical Examples
4.1. Background
4.2. Case Analysis
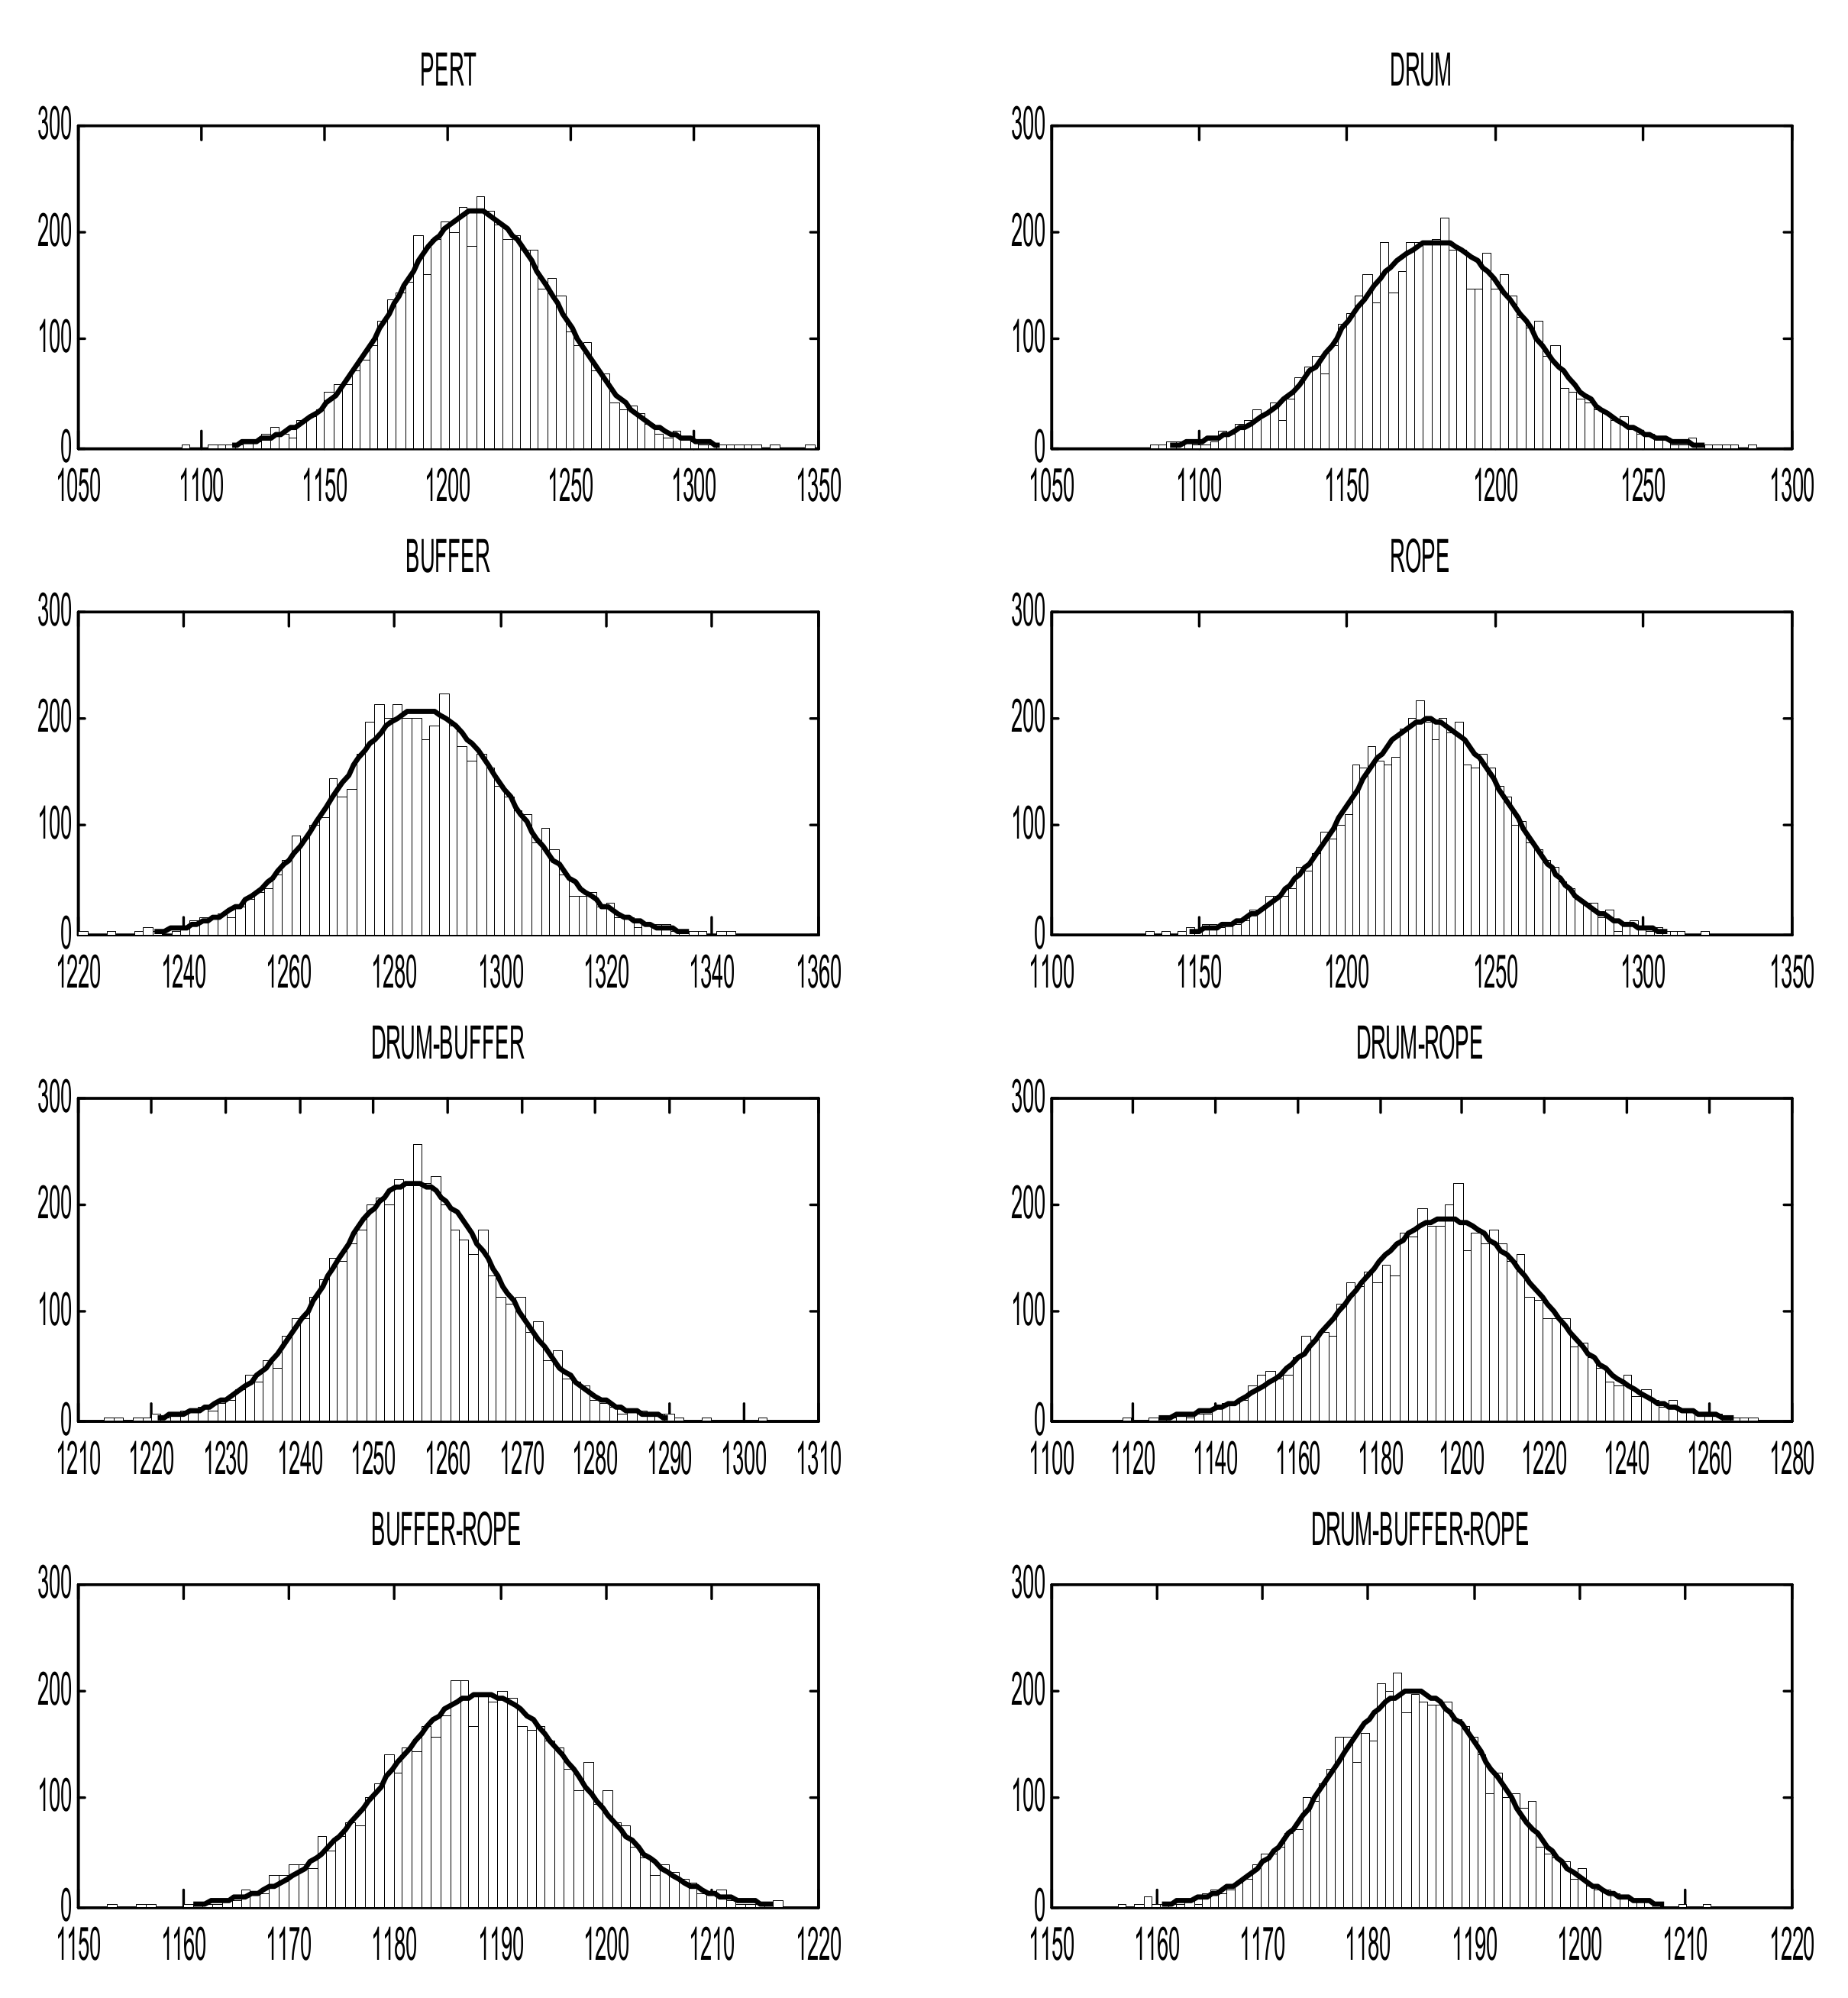
4.3. Results and Discussion
5. Conclusions
Author Contributions
Funding
Institutional Review Board Statement
Informed Consent Statement
Data Availability Statement
Acknowledgments
Conflicts of Interest
References
- Wu, D.; Li, J.; Xia, T.; Bao, C.; Zhao, Y. A multi-objective optimization method considering process risk correlation for project risk response planning. Inf. Sci. 2018, 467, 282–295. [Google Scholar] [CrossRef]
- Bao, C.; Wu, D.; Li, J. A Knowledge-Based Risk Measure from the Fuzzy Multicriteria Decision-Making Perspective. IEEE Trans. Fuzzy Syst. 2019, 27, 1126–1138. [Google Scholar] [CrossRef]
- Zhang, Y.; Zuo, F. Selection of risk response actions considering risk dependency. Kybernetes 2016, 45, 1652–1667. [Google Scholar] [CrossRef]
- Ahmad, Z.; Thaheem, M.J.; Maqsoom, A. Building information modeling as a risk transformer: An evolutionary insight into the project uncertainty. Automat. Constr. 2018, 92, 103–119. [Google Scholar] [CrossRef]
- Li, G.L.; Abbasi, A.; Minchael, J.R. A simulation-based risk interdependency network model for project risk assessment. Decis. Support. Syst. 2021, 148, 113602. [Google Scholar]
- Izmailova, A.; Kornevaa, D.; Kozhemiakinb, A. Project Management Using the Buffers of Time and Resources. Procedia Soc. Behav. Sci. 2016, 235, 189–197. [Google Scholar] [CrossRef]
- Sackey, S.; Kim, B.S. Schedule Risk Analysis using a Proposed Modified Variance and Mean of the Original Program Evaluation and Review Technique Model. KSCE J. Civ. Eng. 2019, 23, 1484–1492. [Google Scholar] [CrossRef]
- Hermans, B.; Leus, R. Scheduling Markovian PERT networks to maximize the net present value: New results. Oper. Res. Lett. 2018, 46, 240–244. [Google Scholar] [CrossRef]
- Noemie, B.; Izack, C. A robust optimization approach for the multi-mode resource-constrained project scheduling problem. Eur. J. Oper. Res. 2021, 291, 457–470. [Google Scholar]
- Jie, S.; Martens, A.; Mario, V. Using Schedule Risk Analysis with resource constraints for project control. Eur. J. Oper. Res. 2021, 288, 736–752. [Google Scholar]
- Sin, T.; Wei, L.; Bing, H.; Hon, L. Debottlenecking cogeneration systems under process variations: Multi-dimensional bottleneck tree analysis with neural network ensemble. Energy 2021, 215, 119168. [Google Scholar]
- Mukund, S.; Anders, S.; Azam, S.M.; Jon, B. A generic hierarchical clustering approach for detecting bottlenecks in manufacturing. J. Manuf. Syst. 2020, 55, 143–158. [Google Scholar]
- Miklos, H.; Bokor, O. The Effects of Different Activity Distributions on Project Duration in PERT Networks. Procedia Soc. Behav. Sci. 2014, 119, 766–775. [Google Scholar]
- Lee, D.E.; Arditi, D.; Son, C.B. The probability distribution of project completion times in simulation-based scheduling. KSCE J. Civ. Eng. 2013, 17, 638–645. [Google Scholar] [CrossRef]
- Poshdar, M. A Probabilistic-Based Method to Determine Optimum Size of Project Buffer in Construction Schedules. J. Constr. Eng. Manag. 2016, 142. [Google Scholar] [CrossRef]
- Kuklan, H. Project planning and control: An enhanced PERT network. Int. J. Proj. Manag. 1993, 11, 87–92. [Google Scholar] [CrossRef]
- Ben-Haim, Y.; Laufer, A. Robust Reliability of Projects with Activity-Duration Uncertainty. J. Constr. Eng. Manag. 1998, 124, 125–132. [Google Scholar] [CrossRef]
- Al-Momani, A.H. Construction delay: A quantitative analysis. Int. J. Proj. Manag. 2000, 18, 51–59. [Google Scholar] [CrossRef]
- Cottrell, W.D. Simplified program evaluation and review technique (PERT). J. Constr. Eng. Manag. 1999, 125, 16–22. [Google Scholar] [CrossRef]
- Leonardo, A.d.V.G.; Henry, L.V.; Ana, L.F.F. Playing chess or playing poker? Assessment of uncertainty propagation in open innovation projects. Int. J. Proj. Manag. 2021, 39, 154–169. [Google Scholar]
- Lin, L.; Müller, R.; Zhu, F.; Liu, H. Choosing suitable project control modes to improve the knowledge integration under different uncertainties. Int. J. Proj. Manag. 2019, 37, 896–911. [Google Scholar] [CrossRef]
- Tsai, W.H.; Lai, S.Y. Green Production Planning and Control Model with ABC under Industry 4.0 for the Paper Industry. Sustainability 2018, 10, 2932. [Google Scholar] [CrossRef]
- Goldratt, E.M. Critical Chain; The North River Press Publishing Corporation: Great Barrington, MA, USA, 1997. [Google Scholar]
- Cook, D.P. A simulation comparison of traditional JIT and TOC manufacturing systems in a flow shop with bottlenecks. Prod. Invent. Manag. J. 1994, 35, 73–78. [Google Scholar]
- Blackstone, J.H.; Gardiner, L.R.; Gardiner, S.C. A framework for the systemic control of organizations. Int. J. Prod. Res. 1997, 35, 597–609. [Google Scholar] [CrossRef]
- Gardiner, S.C.; Blackstone John, H., Jr.; Gardiner Lorraine, R. Drum-buffer-rope and buffer management: Impact on production management study and practices. Int. J. Oper. Prod. Manag. 1993, 13, 68–78. [Google Scholar] [CrossRef]
- Spencer, M.S.; Cox, J.F. Optimum Production Technology (OPT) and the Theory of Constraints (TOC)—Analysis and Genealogy. Int. J. Prod. Res. 1995, 33, 1495–1504. [Google Scholar] [CrossRef]
- Wu, S.Y.; Morris, J.S.; Gordon, T.M. A Simulation Analysis of the Effectiveness of Drum-Buffer-Rope Scheduling in Furniture Manufacturing. Comput. Ind. Eng. 1994, 26, 757–764. [Google Scholar] [CrossRef]
- Steyn, H. Project management applications of the theory of constraints beyond critical chain scheduling. Int. J. Proj. Manag. 2002, 20, 75–80. [Google Scholar] [CrossRef]
- Van de Vonder, S. The use of buffers in project management: The trade-off between stability and makespan. Int. J. Prod. Econ. 2005, 97, 227–240. [Google Scholar] [CrossRef]
- Hu, X.; Cui, N.; Demeulemeester, E.; Bie, L. Incorporation of activity sensitivity measures into buffer management to manage project schedule risk. Eur. J. Oper. Res. 2016, 249, 717–727. [Google Scholar] [CrossRef]
- Zhang, J.; Song, X.; Diaz, E. Project buffer sizing of a critical chain based on comprehensive resource tightness. Eur. J. Oper. Res. 2016, 248, 174–182. [Google Scholar] [CrossRef]
- Bie, L.; Cui, N.; Zhang, X. Buffer sizing approach with dependence assumption between activities in critical chain scheduling. Int. J. Prod. Res. 2012, 50, 7343–7356. [Google Scholar] [CrossRef]
- Goldratt, E.M.; Cox, J. The Goal: A Process of Ongoing Improvement; North River Press: Great Barrington, MA, USA, 1992. [Google Scholar]
- Şimşit, Z.T.; Günay, N.S.; Vayvay, Ö. Theory of Constraints: A Literature Review. Procedia Soc. Behav. Sci. 2014, 150, 930–936. [Google Scholar] [CrossRef]
- Hammad, M.W.; Abbasi, A.; Ryan, M.J. Developing a Novel Framework to Manage Schedule Contingency Using Theory of Constraints and Earned Schedule Method. J. Constr. Eng. Manag. 2018, 144, 225–236. [Google Scholar] [CrossRef]
- Umble, M.M. Analyzing Manufacturing Problems Using V-A-T Analysis. ProdInvent. Manag. J. 1992, 33, 55–60. [Google Scholar]
- Ye, T.; Han, W. Determination of buffer sizes for drum-buffer-rope (DBR)-controlled production systems. Int. J. Prod. Res. 2008, 46, 2827–2844. [Google Scholar] [CrossRef]
- Thurer, M. Drum-buffer-rope and workload control in High-variety flow and job shops with bottlenecks: An assessment by simulation. Int. J. Prod. Econ. 2017, 188, 116–127. [Google Scholar] [CrossRef]
- Izmailova, A.; Kornevaa, D.; Kozhemiakinb, A. Project Management with Theory of Constraints. Procedia Soc. Behav. Sci. 2016, 229, 96–103. [Google Scholar] [CrossRef][Green Version]
- Randm, G.K. Critical chain: The theory of constraints applied to project management. Int. J. Proj. Manag. 2000, 18, 173–177. [Google Scholar] [CrossRef]
- Xie, X.-M.; Yang, G.; Lin, C. Software development projects IRSE buffer settings and simulation based on critical chain. J. China Univ. Posts Telecommun. 2010, 17 (Suppl. 1), 100–106. [Google Scholar] [CrossRef]
- Tukel, O.I.; Rom, W.O.; Eksioglu, S.D. An investigation of buffer sizing techniques in critical chain scheduling. Eur. J. Oper. Res. 2004, 172, 401–416. [Google Scholar] [CrossRef]
- Demmy, W.S.; Demmy, B.S. Drum-buffer-rope scheduling and pictures for the yearbook. ProdInvent. Manag. J. 1994, 35, 45–47. [Google Scholar]
- Slusarczyk, A. A comparison of buffer sizing techniques in the critical chain method case study. J. Autom. Mob. Robot. Intell. Syst. 2013, 7, 43–56. [Google Scholar]
- Wei, C.-C.; Liub, P.-H.; Tsaic, Y.-C. Resource-constrained project management using enhanced theory of constraint. Int. J. Proj. Manag. 2002, 20, 561–567. [Google Scholar] [CrossRef]
- Schragenheim, E.R.B. Buffer Management: A Diagnostic Tool for Production Control. ProdInvent. Manag. J. 1991, 32, 74–79. [Google Scholar]
- Ronen, B.; Starr, M.K. Synchronized Manufacturing as in Opt—From Practice to Theory. Comput. Ind. Eng. 1990, 18, 585–600. [Google Scholar] [CrossRef]
- Cohen, I.; Mandelbaum, A.; Shtub, A. Multi-Project Scheduling and Control: A Process-Based Comparative Study of the Critical Chain Methodology and Some Alternatives. Proj. Manag. J. 2004, 35, 39–50. [Google Scholar] [CrossRef]
- Kock, A.; Schulz, B.; Kopmann, J.; Gemünden, H.G. Project portfolio management information systems’ positive influence on performance—The importance of process maturity. Int. J. Proj. Manag. 2020, 38, 229–241. [Google Scholar] [CrossRef]
- Papadonikolaki, E.; van Oel, C.; Kagioglou, M. Organising and Managing boundaries: A structurational view of collaboration with Building Information Modelling (BIM). Int. J. Proj. Manag. 2019, 37, 378–394. [Google Scholar] [CrossRef]
- Pinedo, M.; Zacharias, C.; Zhu, N. Scheduling in the service industries: An overview. J. Syst. Sci. Syst. Eng. 2015, 24, 1–48. [Google Scholar] [CrossRef]
- Drechsler, A.; Breth, S. How to go global: A transformative process model for the transition towards globally distributed software development projects. Int. J. Proj. Manag. 2019, 37, 941–955. [Google Scholar] [CrossRef]
- Budayan, C.; Dikmen, I.; Birgonul, M.T.; Ghaziani, A. A Computerized Method for Delay Risk Assessment Based on Fuzzy Set Theory using MS Project™. KSCE J. Civ. Eng. 2018, 22, 2714–2725. [Google Scholar] [CrossRef]
- Cobb, B.R.; Alan, W.J.; Rumi, R. Accurate lead time demand modeling and optimal inventory policies in continuous review systems. Int. J. Prod. Econ. 2015, 163, 124–136. [Google Scholar] [CrossRef]
- Hazır, Ö. A review of analytical models, approaches and decision support tools in project monitoring and control. Int. J. Proj. Manag. 2015, 33, 808–815. [Google Scholar] [CrossRef]
- Akbar, H.; Mandurah, S. Project-conceptualisation in technological innovations: A knowledge-based perspective. Int. J. Proj. Manag. 2014, 32, 759–772. [Google Scholar] [CrossRef]


| Number | Activity Item | Precedence Relation | Duration Estimation (a, m, b)/Day | Activity Expected Duration | Standard Deviation (Day) | Variance |
|---|---|---|---|---|---|---|
| 1 | Excavation of dam abutment above water on two banks (above ▽1901) | - | 170,230,260 | 225 | 15 | 225 |
| 2 | Closure dike filling and foundation pit drainage | 1 | 40,55,70 | 55 | 5 | 25 |
| 3 | Foundation pit excavation | 2 | 50,70,90 | 70 | 6.67 | 44.44 |
| 4 | Foundation excavation of cutoff wall beside dam | 2 | 30,40,55 | 40.83 | 4.17 | 17.36 |
| 5 | Seepage construction of upstream and downstream enclosing wall | 1 | 40,55,60 | 53.33 | 3.33 | 11.11 |
| 6 | Filling construction of upstream and downstream cofferdam | 5 | 30,45,50 | 43.33 | 3.33 | 11.11 |
| 7 | Silicon pouring of toe slab and foundation (below ▽1901) | 3,4,6 | 8,15,25 | 15.50 | 2.83 | 8.03 |
| 8 | Silicon pouring of cutoff wall beside dam | 4 | 55,70,90 | 70.83 | 5.83 | 34.03 |
| 9 | Filling construction of temporary section of upstream dam (below ▽1955) | 7,21 | 140,165,185 | 164.17 | 7.5 | 56.25 |
| 10 | Filling construction of temporary section of down-stream dam (below ▽1955) | 8,9 | 130,150,185 | 152.5 | 9.17 | 84.03 |
| 11 | Backfilling of gully at axis on left bank | 8,9 | 90,120,145 | 119.17 | 9.17 | 84.03 |
| 12 | Masonry beside dam | 8,9 | 455,495,560 | 499.17 | 17.5 | 306.25 |
| 13 | Silicon pouring of panel of first stage | 8,9 | 45,60,80 | 60.83 | 5.83 | 34.03 |
| 14 | Water stopping installation on surface | 13 | 45,60,75 | 60 | 5 | 25 |
| 15 | Whole section filling from▽1955 to dam crest | 10,11 29,30 | 160,195,215 | 192.5 | 9.17 | 84.03 |
| 16 | Filling of slope body in front of dam (below ▽1940) | 10,11 29,30 | 100,120,145 | 120.83 | 7.5 | 56.25 |
| 17 | Silicon pouring of panel of second stage | 14,1516,32 | 75,90,115 | 91.67 | 6.67 | 44.44 |
| 18 | Construction of parapet wall and road on dam crest | 12,17 | 85,120,150 | 119.17 | 10.83 | 117.36 |
| 19 | Demolition of downstream cofferdam | 12,17 | 70,90,115 | 90.83 | 7.5 | 56.25 |
| 20 | Filling and masonry on dam crest | 18,19 | 48,60,75 | 60.5 | 4.5 | 20.25 |
| 21 | Bolt-concrete support of dam abutment on two banks | - | 280,330,400 | 333.33 | 20 | 400 |
| 22 | Construction of helper system in this contract section | - | 135,165,195 | 165 | 10 | 100 |
| 23 | Transformation of machining system of cushion material | - | 85,105,115 | 103.33 | 5 | 25 |
| 24 | Borrow Area Planning and road construction in II zone of water ditch | - | 25,30,45 | 31.67 | 3.33 | 11.11 |
| 25 | Peeling of gravel soil and strong decomposed rock | 24 | 100,120,145 | 120.83 | 7.5 | 56.25 |
| 26 | Mining and blasting test of transition material | 25 | 12,15,20 | 15.33 | 1.33 | 1.78 |
| 27 | Machining of test material in cushion | 22,23 | 35,45,50 | 44.17 | 2.5 | 6.25 |
| 28 | Machining of cushion material in first stage | 27 | 48,60,80 | 61.33 | 5.33 | 28.44 |
| 29 | Machining of cushion material in second stage | 28 | 105,135,160 | 134.17 | 9.17 | 84.03 |
| 30 | Mining of transition material and cushion material | 26 | 195,240,280 | 239.17 | 14.17 | 200.69 |
| 31 | Grouting test | 72,90,118 | 91.67 | 7.67 | 58.78 | |
| 32 | Grouting and pouring of toe slab on left and right banks | 31 | 300,360,420 | 360 | 20 | 400 |
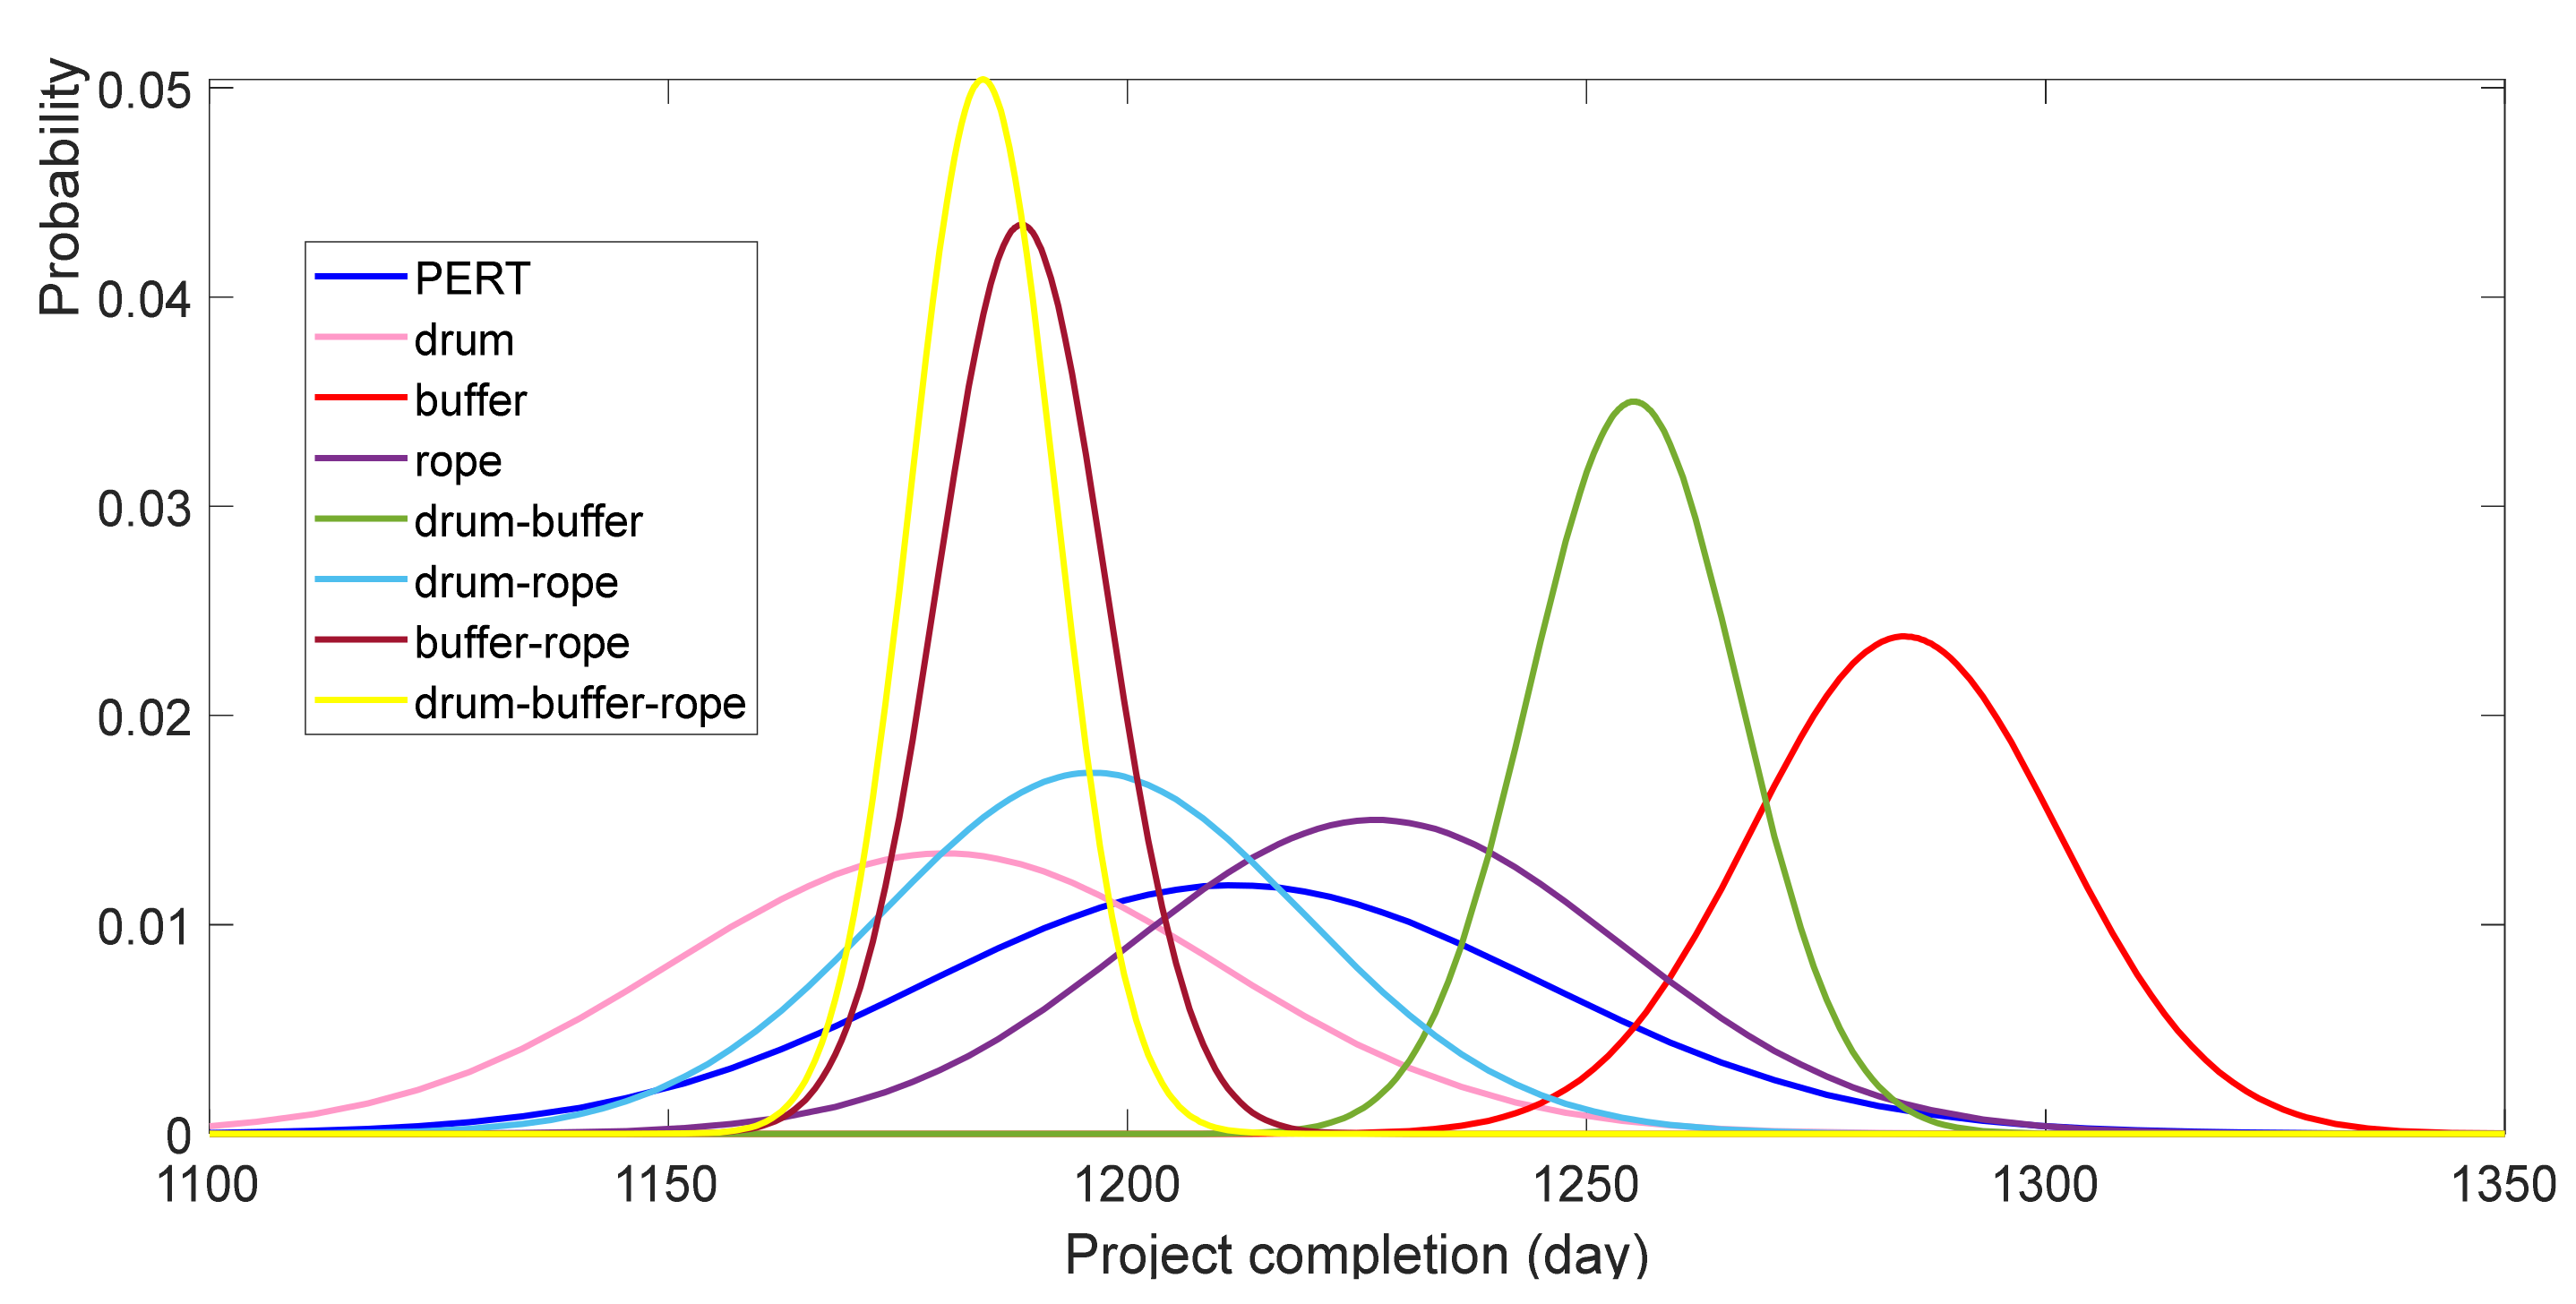
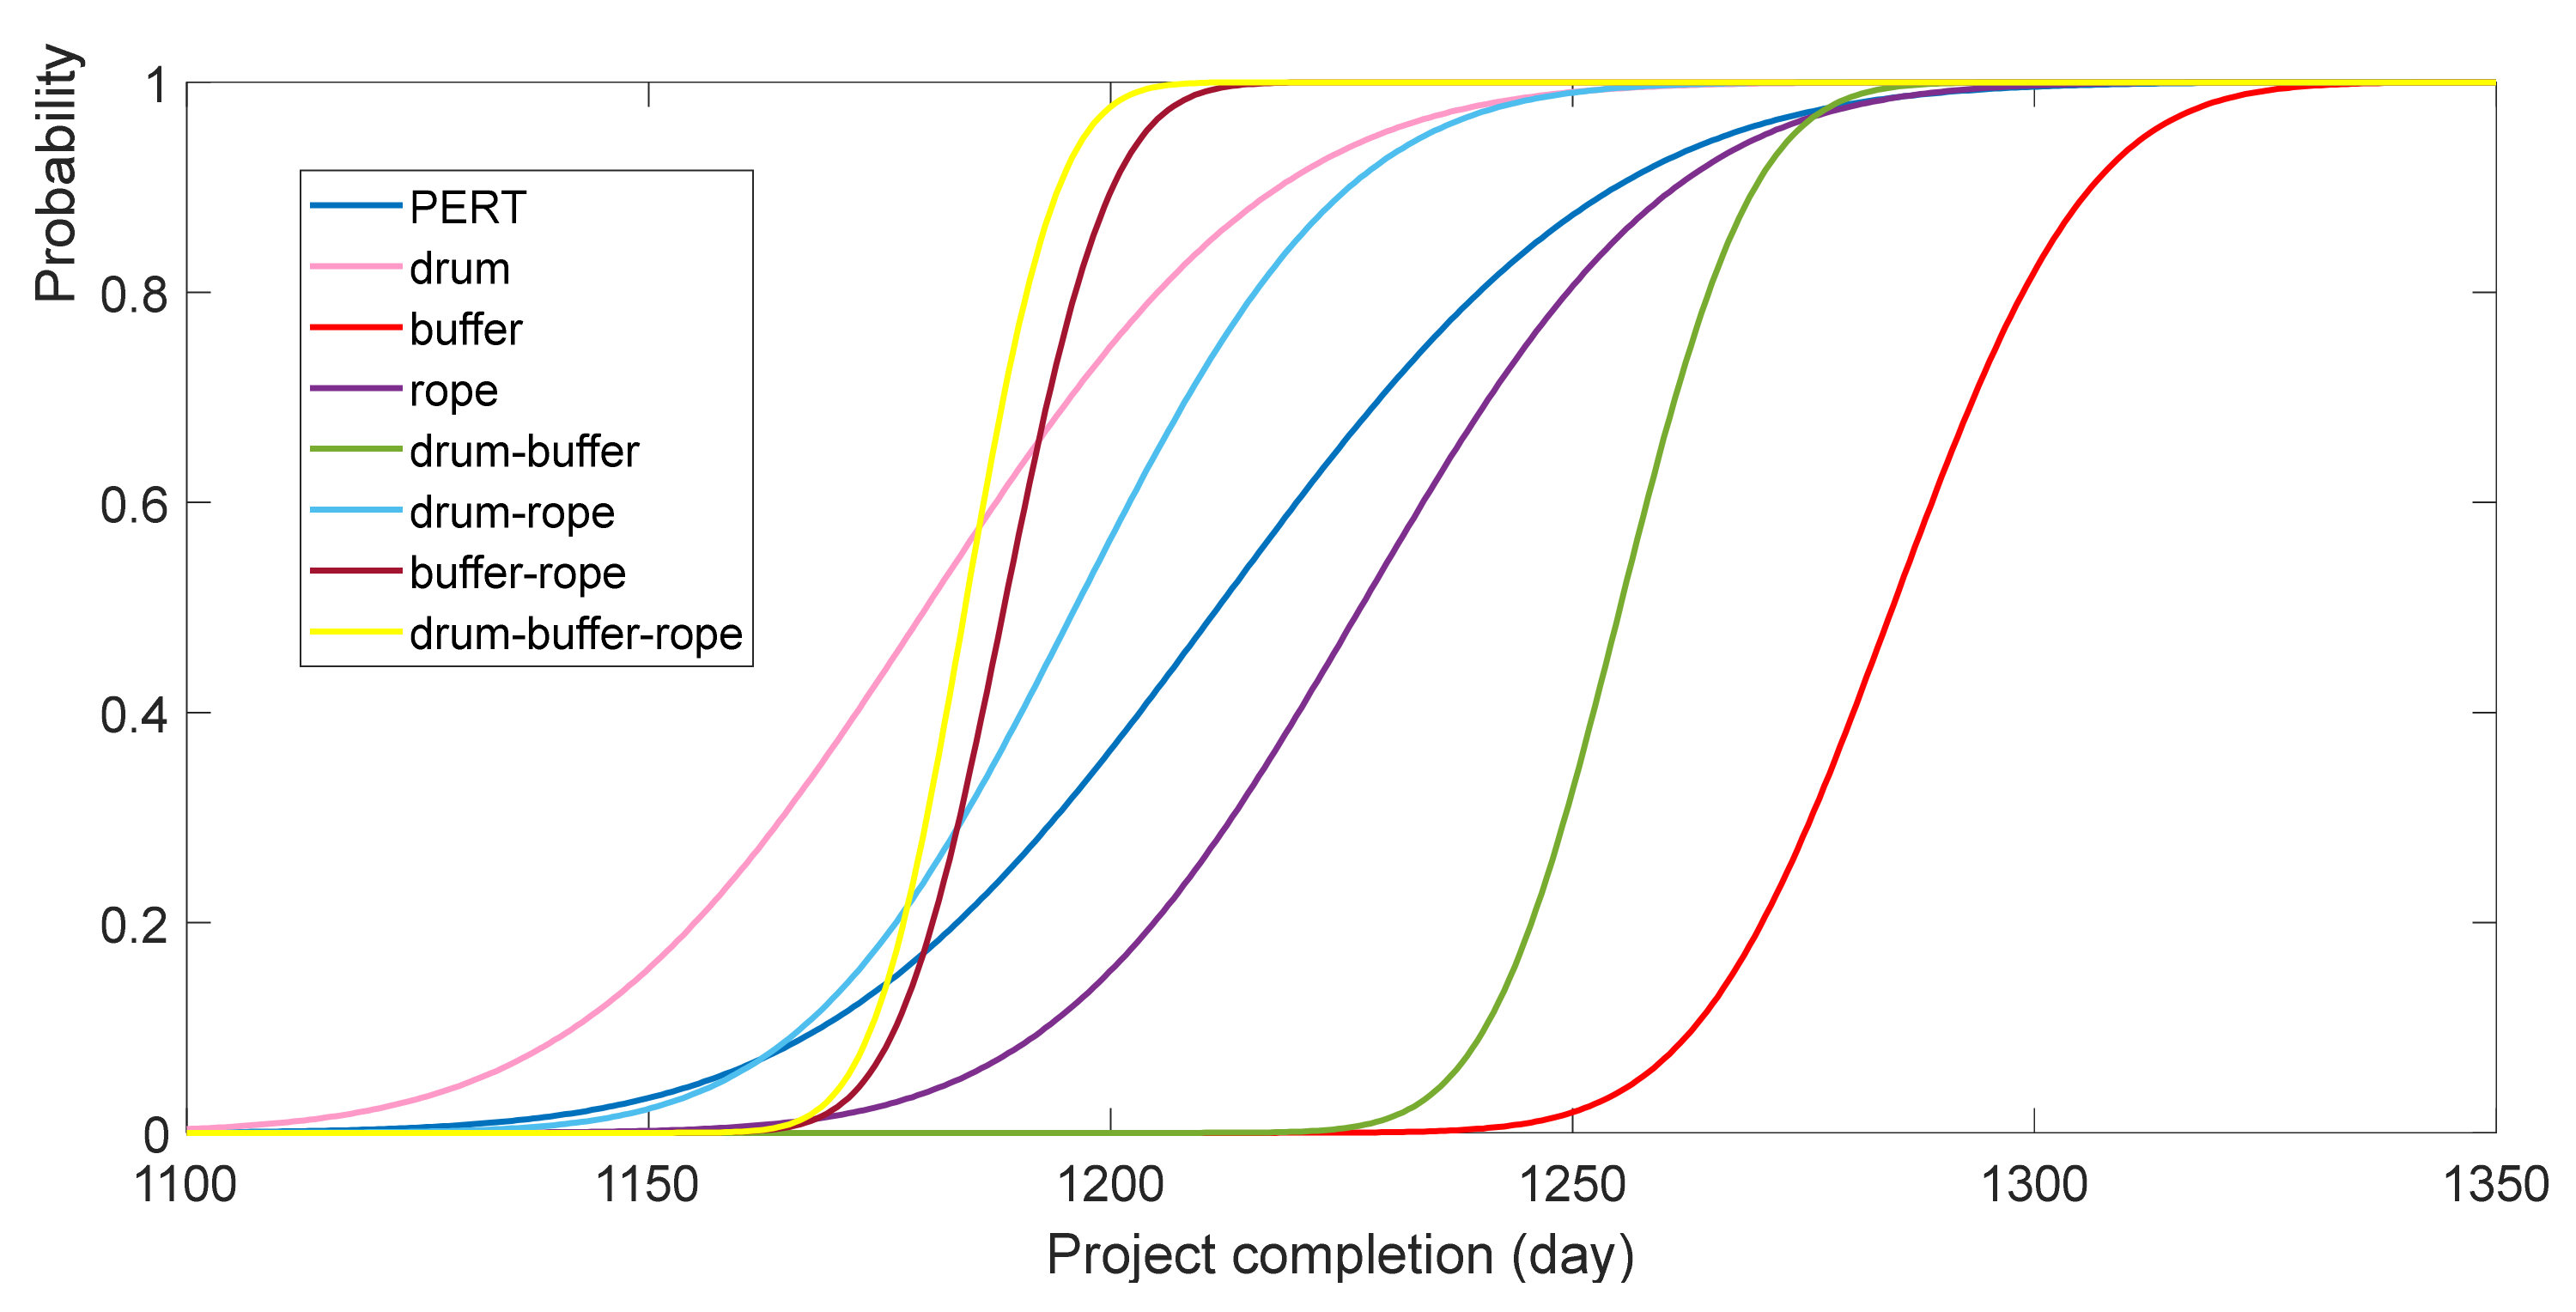
| Number | Control Elements of Progress Schedule | Average Completion Period | Standard Deviation | The Most Optimistic Completion Time | The Most Pessimistic Completion Time | Uncertainty Reducing Compared with PERT |
|---|---|---|---|---|---|---|
| 1 | PERT | 1211.63 | 33.56 | 1092.29 | 1348.92 | - |
| 2 | drum | 1180.04 | 29.76 | 1083.51 | 1288.12 | 3.8 |
| 3 | buffer | 1284.64 | 16.78 | 1220.30 | 1344.39 | 16.78 |
| 4 | rope | 1227.07 | 26.59 | 1132.12 | 1322.37 | 6.97 |
| 5 | drum-buffer | 1255.15 | 11.40 | 1213.72 | 1303.21 | 22.16 |
| 6 | drum-rope | 1196.19 | 23.11 | 1117.47 | 1271.83 | 10.45 |
| 7 | buffer-rope | 1188.46 | 9.18 | 1152.89 | 1216.75 | 24.38 |
| 8 | drum-buffer-rope | 1184.25 | 7.92 | 1156.38 | 1212.46 | 25.64 |
Publisher’s Note: MDPI stays neutral with regard to jurisdictional claims in published maps and institutional affiliations. |
© 2021 by the authors. Licensee MDPI, Basel, Switzerland. This article is an open access article distributed under the terms and conditions of the Creative Commons Attribution (CC BY) license (https://creativecommons.org/licenses/by/4.0/).
Share and Cite
Liu, X.; Shen, L.; Zhang, K. Estimating the Probability Distribution of Construction Project Completion Times Based on Drum-Buffer-Rope Theory. Appl. Sci. 2021, 11, 7150. https://doi.org/10.3390/app11157150
Liu X, Shen L, Zhang K. Estimating the Probability Distribution of Construction Project Completion Times Based on Drum-Buffer-Rope Theory. Applied Sciences. 2021; 11(15):7150. https://doi.org/10.3390/app11157150
Chicago/Turabian StyleLiu, Xun, Le Shen, and Kun Zhang. 2021. "Estimating the Probability Distribution of Construction Project Completion Times Based on Drum-Buffer-Rope Theory" Applied Sciences 11, no. 15: 7150. https://doi.org/10.3390/app11157150
APA StyleLiu, X., Shen, L., & Zhang, K. (2021). Estimating the Probability Distribution of Construction Project Completion Times Based on Drum-Buffer-Rope Theory. Applied Sciences, 11(15), 7150. https://doi.org/10.3390/app11157150