Article

Interface Direct Shear Tests on JEZ-1 Mars Regolith Simulant

1
Institut de Recherche en Génie Civil et Mécanique (GeM), Ecole Centrale de Nantes, UMR 6183 CNRS, 1 Rue de la Noë, CEDEX 3, 44321 Nantes, France
2
Research Institute of Highway Ministry of Transport, Beijing 100088, China
3
Shandong Electrical Power Supply & Transformation Engineering Co., Ltd., No. 1000 Meili Road, Huaiyin District, Jinan 250022, China
4
Department of Civil and Environmental Engineering, University of Perugia, 06125 Perugia, Italy
*
Author to whom correspondence should be addressed.
Appl. Sci. 2021, 11(15), 7052; https://doi.org/10.3390/app11157052
Submission received: 2 July 2021 / Revised: 27 July 2021 / Accepted: 29 July 2021 / Published: 30 July 2021

Abstract

:
The mechanical behaviors of Martian regolith-structure interfaces are of great significance for the design of rover, development of excavation tools, and construction of infrastructure in Mars exploration. This paper presents an experimental investigation on the properties of a Martian regolith simulant (JEZ-1) through one-dimensional oedometer test, direct shear test, and interface direct shear tests between JEZ-1 and steel plates with different roughness. Oedometer result reveals that the compression and swelling indexes of the JEZ-1 are quite low, thus it is a less compressible and lower swelling soil. The cohesion and adhesion of JEZ-1 are lower than 5 kPa. The values of the internal friction angle range from 39.7° to 40.6°, and the interface friction angles are 16.7° to 36.2° for the smooth and rough interface. Furthermore, the direct shear and interface direct shear results indicate that the interface friction angles are lower than the internal friction angles of JEZ-1 and increase close to the internal friction angles with increasing interface roughness.

1. Introduction

The National Aeronautics and Space Administration (NASA) launched the Mars 2020 Perseverance Rover mission on 30 July 2020, the Perseverance Rover landed on Jezero Crater, Mars on 18th February 2021. The main job of Mars 2020 Perseverance Rover on Jezero Crater is seeking signs of ancient microbial life, and gathering samples of rock and regolith (i.e., broken rock and soil) for a possible return mission to Earth in the future for detailed analysis. The Perseverance rover is equipped with a drill to collect core samples of Martian rock and soil, then store them in sealed tubes to be brought back to Earth by a future mission.
Martian simulants are widely used for testing rovers and other instruments for Mars exploration, due to the fact that no rock or soil has been returned to Earth from Mars. Several typical Martian soil simulants have been designed and reported in the literature. For instance, Johnson Space Center JSC Mars-1 is the most remarkable Martian simulant [1]. Other important Mars simulants are Mojave Mars Simulant (MMS) [2] and its updated version MMS-1. However, the three simulants are no longer available outside of NASA [3]. Mars Global Simulant-1 (MGS-1) was developed by the University of Central Florida as an open mineralogical standard to precisely represent Martian global basaltic regolith [3]. Johnson Space Center-Rocknest (JSC-RN) is a new Martian simulant that was manufactured and utilized by NASA’s Advanced Exploration Systems (AES) ISRU project, for experiments of water extraction from Martian soil [4]. However, these simulants reported above tend to be suitable for certain uses, but inappropriate for others [3].
This research mainly investigated the interface direct shear responses of a Martian simulant named JEZ-1, to provide the first insight into understanding the geotechnical characteristics of the Martian soil. It is a Jezero Crater simulant developed by the CLASS Exolith Lab at the University of Central Florida, in preparation for the Mars 2020 Perseverance Rover mission. JEZ-1 is specifically designed for the scientists and engineers looking to learn more about the landing site (Jezero Crater) of the Perseverance Rover and the scientific research that can be done there. The direct shear test is applicable to understand the mechanical behavior of Martian regolith, especially under different stress or strain conditions (e.g., large strains or critical state), according to [5,6,7,8]. The parameters of cohesion/adhesion and (interface) friction angle obtained from the direct shear test are fundamental information for the design of rover (e.g., landing systems and wheels) that is in contact with the Martian soil [7,9]. The test results in this paper will help pave the way for future human exploration of Mars.

2. Materials

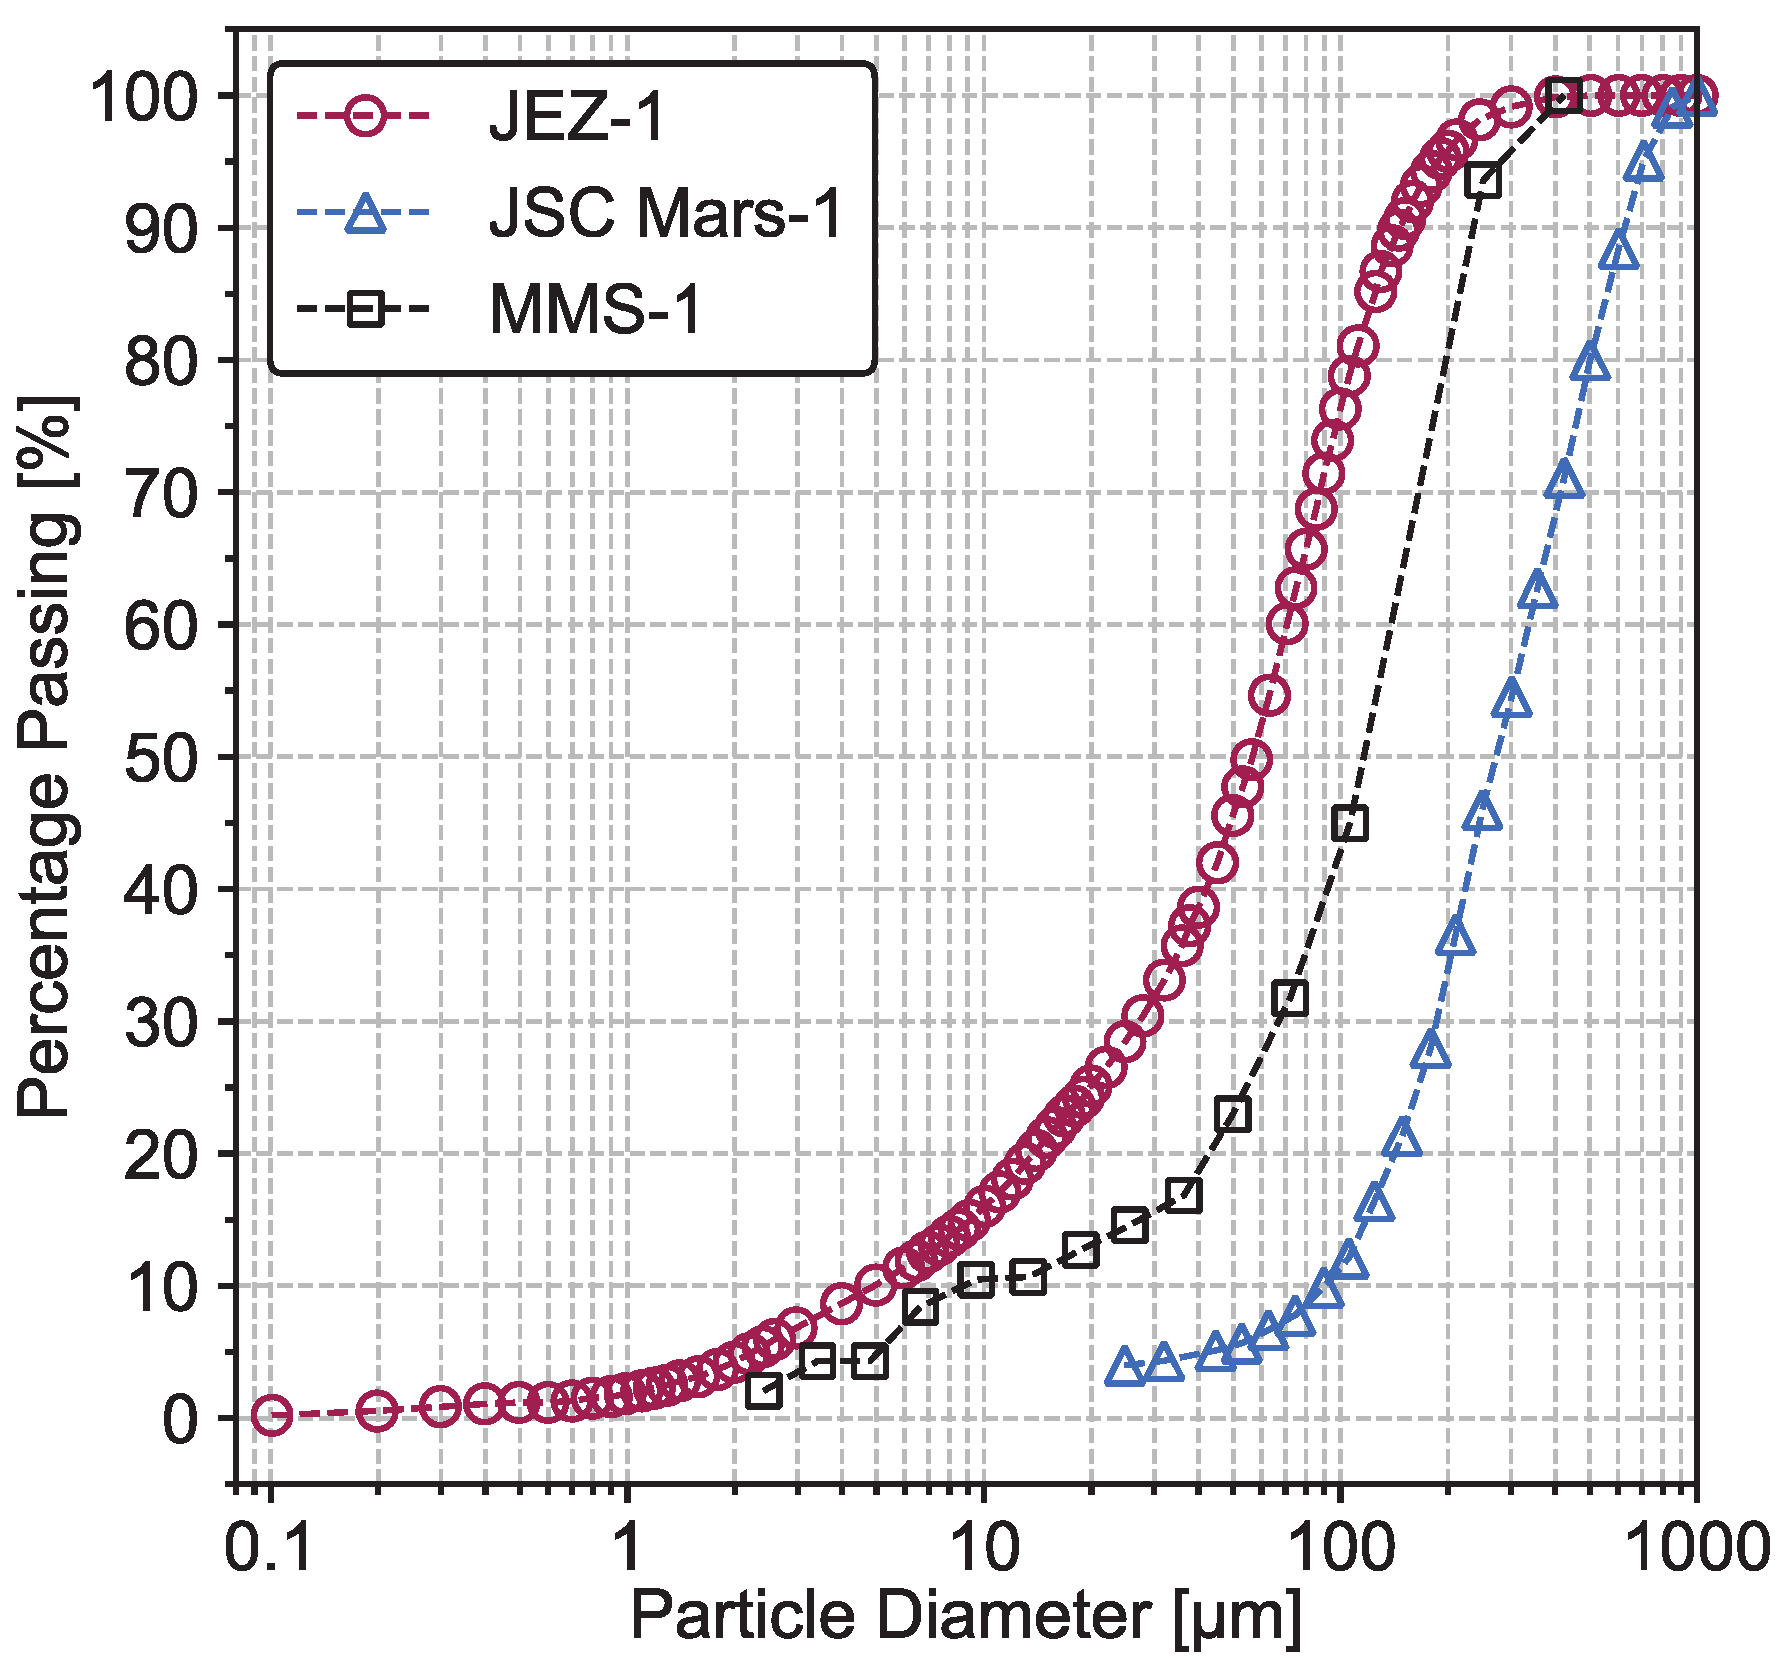
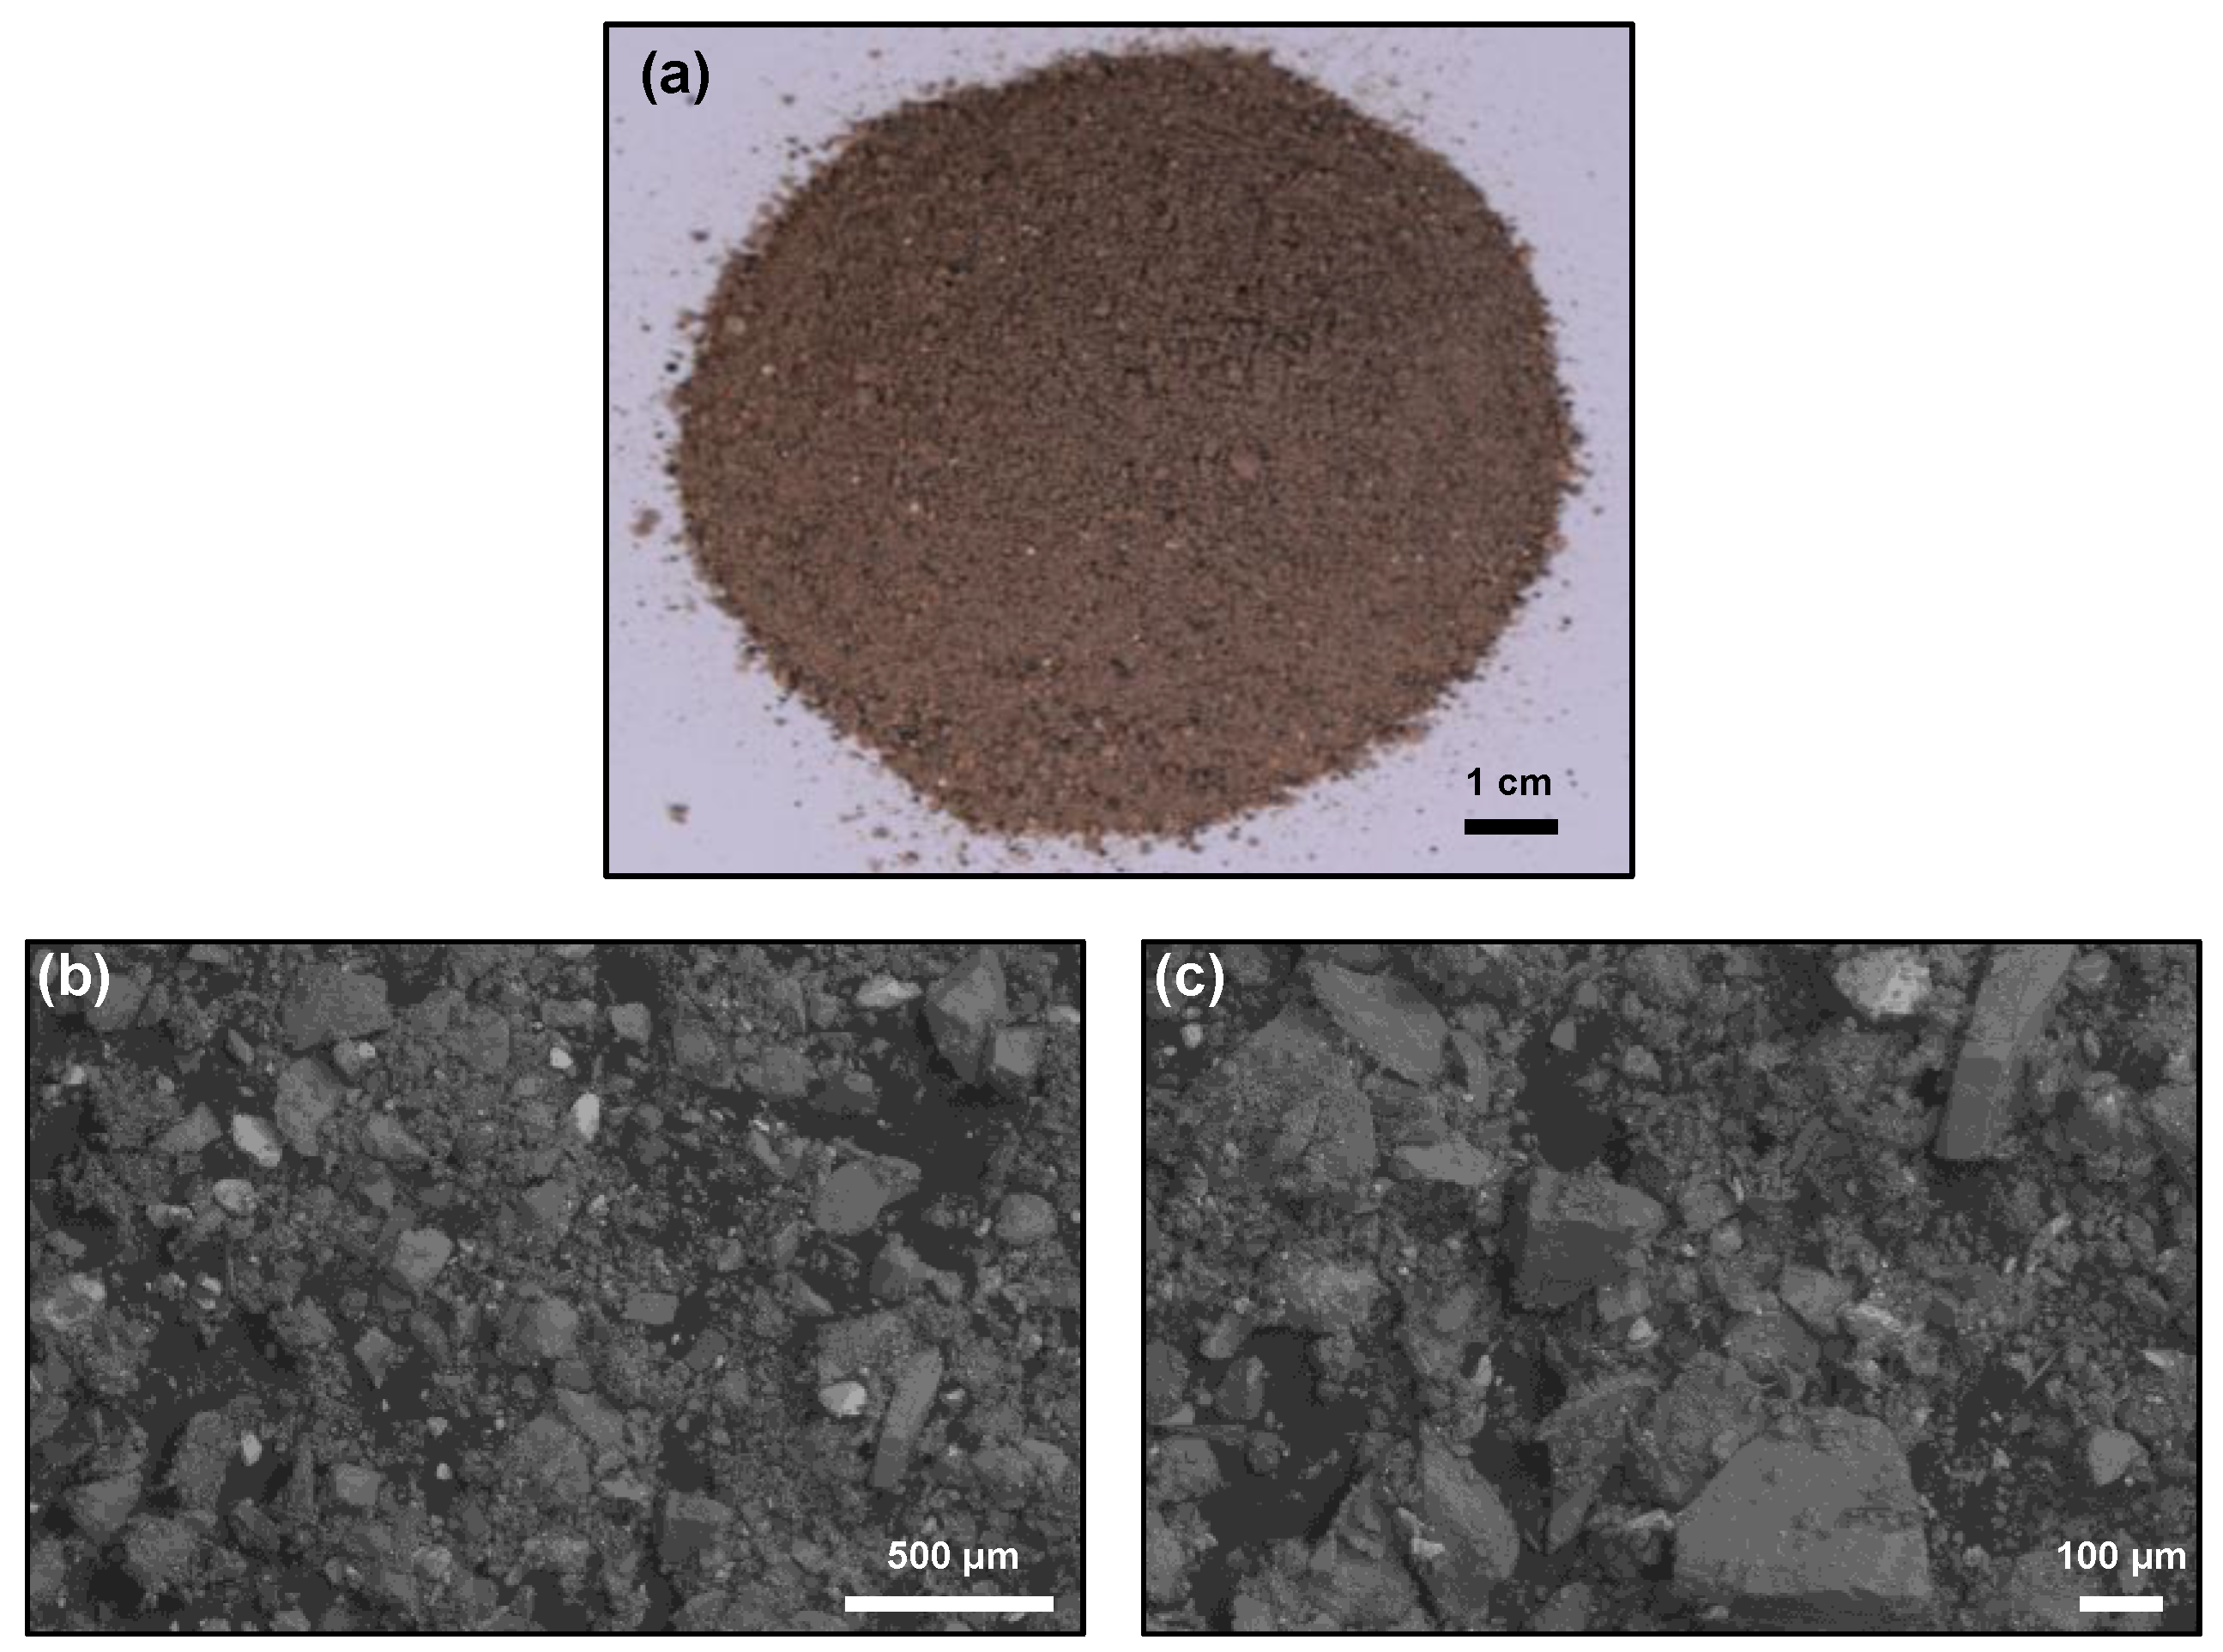
2.1. JEZ-1 Mars Regolith Simulant
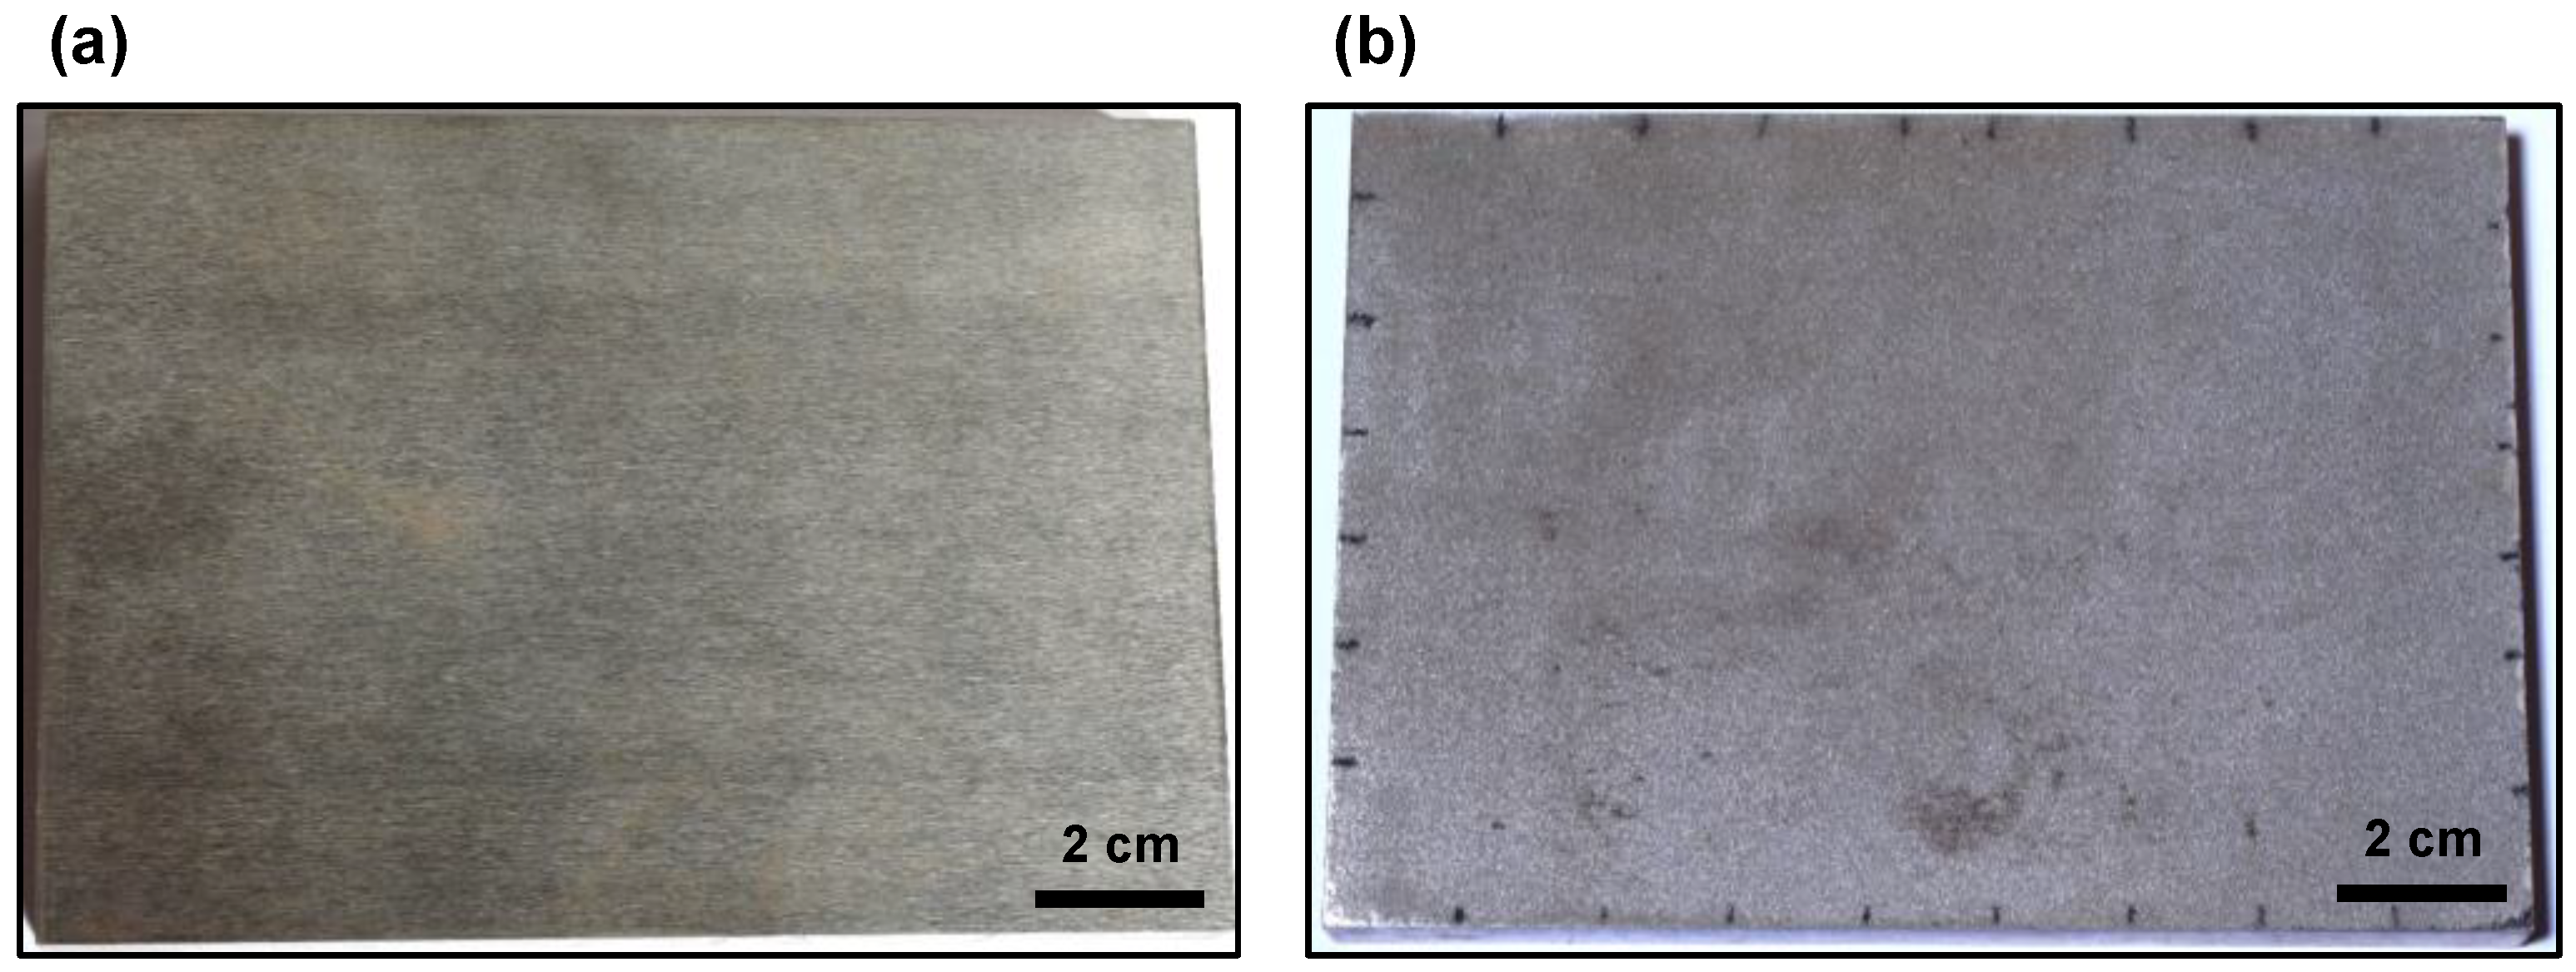
A Mars Jezero Crater Delta simulant JEZ-1 was selected for the research of the Martian regolith-structure interface. The Jezero Crater Delta Simulant (JEZ-1) was designed by the CLASS Exolith Lab at the University of Central Florida to simulate anticipated materials in the Jezero Crater Deltas that are now being investigated by the NASA Mars 2020 Perseverance Rover. In general, the mineralogy, chemistry, and grain size distribution of the regolith throughout the Jezero deltas are likely variable. The simulant is made up of MGS-1 mineralogy [3], smectite clay, Mg-carbonate, and additional olivine (Table 1), which have been detected in the Jezero Crater Delta deposits by orbital remote sensing. The other mineral components and major bulk elemental chemistry are presented in Table 1 and Table 2, respectively.
The primary shape and particle size of the simulant JEZ-1 can be seen from photograph in Figure 1a. The particle size ranges between <0.04 μm and 500 μm, which is composed of angular and sub-angular shapes from SEM images that are provided in Figure 1b,c. The grain size distribution curves of JEZ-1 and another two previous stimulants (i.e., JSC Mars-1 and MMS-1) are provided in Figure 2. From the grain size distribution test, the effective grain size (d10) of JEZ-1 is 4.9 μm and the coefficient of uniformity (Cu) is equal to 14.3, indicating that JEZ-1 is a well-graded Martian simulant. The mean grain size (d50) of JEZ-1 is 57.2 μm, lower than the d50 values of JSC Mars-1 (200 μm) and MMS-1 (120 μm), according to the data from [7,8]. This highlights that JEZ-1 has finer grains than the other two simulants (i.e., JSC Mars-1 and MMS-1), in agreement with the fact that the Jezero Crater Delta contains clays, as revealed by the Mars Reconnaissance Orbiter’s CRISM instrument. Clays only form in the presence of water, it is the reason why Jezero Crater Delta can provide a great place for the scientific goal of the Mars 2020 mission. It aims at seeking a potentially habitable environment that may possess preserved signs of ancient microbial life. For example, scientists have found that clays exist in the Mississippi River Delta on Earth, where microbial life has been found embedded in the rock. Moreover, from other laboratory test results, the uncompressed bulk density of JEZ-1 is 1.54 g/cm3. The maximum void ratio (emax) and minimum void ratio (emin) are 0.798 and 0.381, respectively.
Like other Martian soil simulants [4], the JEZ-1 represents an unconsolidated material as well, however, a more cohesive state can be obtained by compacting with various pressures.

2.2. Steel Plate

Two steel plates with different roughness (i.e., smooth and rough) are used as the structural material in the Martian simulant-structure interface, as presented in Figure 3. The size of the steel plates is 140 mm × 100 mm × 11 mm. In this study, the rough steel plate is made by gluing a 2 mm thick layer of the mixture of epoxy resin and Fontainebleau sand (30 g of epoxy resin per 100 g of sand passing from the sieve of 0.63 mm). While no sand is glued on the smooth plate.
The roughness of the steel plates is measured along with two directions of the plate surface (shear direction and perpendicular to the shear direction). The roughness parameters of arithmetic average height (Ra) and largest peak-to-valley height (Rmax) are summarized in Table 3. The Ra values of the smooth and rough steel plates are 1.0 μm and 45.1 μm, respectively, as shown in Table 3. The Rmax values of the smooth and rough steel plates are 7.9 μm and 277.0 μm, respectively (Table 3). Normalized roughness (Rn) is used for evaluating the interface roughness, in agreement with the literature [10,11,12,13,14,15,16]:
R n = R max d 50
The Rn values of the smooth and rough steel plates are 0.14 and 4.86 (Table 3).

3. Experimental Setup

3.1. Oedometer Test

A one-dimensional oedometer test was performed on a dry JEZ-1 simulant, aiming to provide a first insight into its properties of compressibility. The effective vertical stress loading steps were 12.5 kPa, 25 kPa, 50 kPa, 100 kPa, 200 kPa, 400 kPa, 800 kPa, finally unloaded to 50 kPa, which is similar to [15,17]. The initial sample height and corresponding deformation were measured before and during the test, respectively.

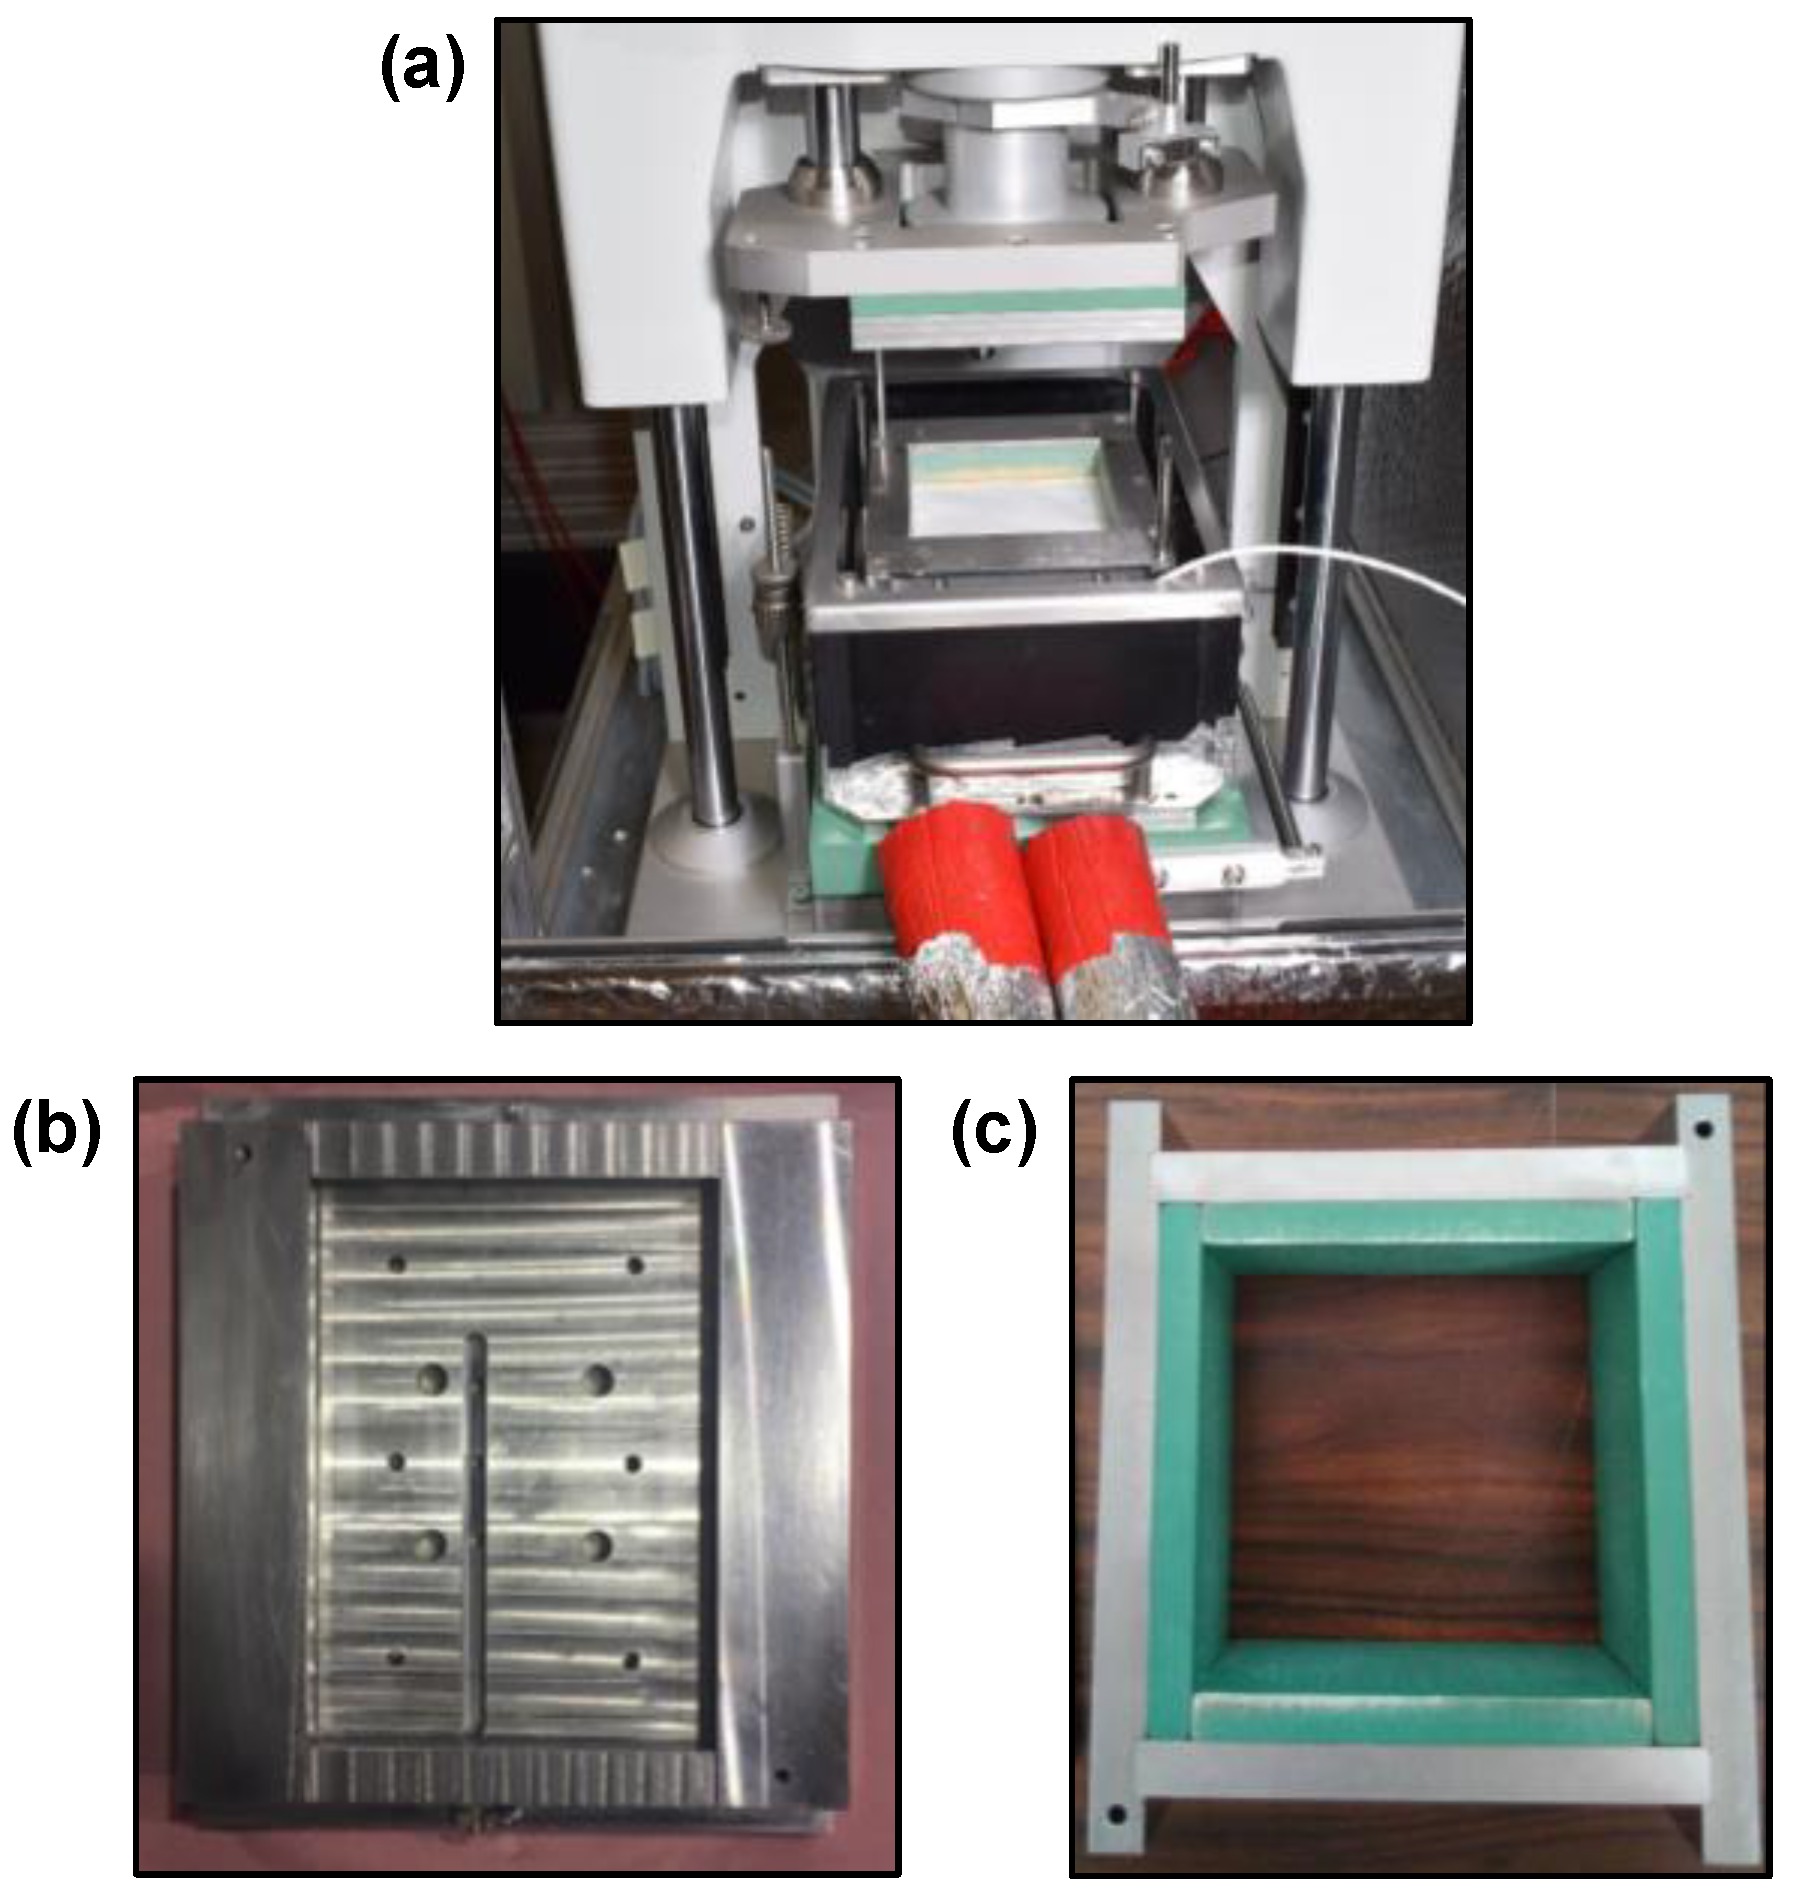
3.2. Interface Direct Shear Test

In this paper, the mechanical behavior of the interface between JEZ-1 simulant and steel is investigated by a novel interface direct shear device (Figure 4a). This interface direct shear apparatus has the capability of conducting shear tests under different loading conditions. It was employed to perform experiments and to characterize the mechanical parameters of the soil-structure interface in the laboratory [11,15,17,18,19]. The interface direct shear box is divided into two parts, i.e., the upper and the bottom parts (Figure 4b,c). The dimension of the upper part is 100 mm × 100 mm and can contain a JEZ-1 sample with a maximum initial height of 50 mm. The bottom part has a dimension of 140 mm × 100 mm × 11 mm in order to accommodate the steel plate. More details about the interface direct shear apparatus are available in [15].
The experimental program presented in this section consisted of two phases: (1) direct shear, and (2) interface direct shear. Direct shear tests on the JEZ-1 simulant were firstly performed with the interface machine to get the shear results of soil-soil. Three direct shear tests were performed at normal stresses of 25, 50, and 75 kPa. The normal stresses for the interface direct shear tests with smooth and rough plates are 25, 50, 75, and 100 kPa. After the consolidation phase on the sample had been finished, a displacement-controlled shear was performed with a shearing rate of 0.5 mm/min to a maximum horizontal displacement of 10 mm.
The samples for the (interface) direct shear tests were prepared by the dry tamping method rather than other sample preparation techniques, such as wet tamping [20,21,22], slurry deposition [15,17,23,24,25,26,27,28], due to the water was not considered in this paper. The average initial sample height for direct shear and interface direct tests are 31.59 mm and 27.58 mm, respectively. Since very loose or very dense Martian regolith is not likely to encounter in the in-situ conditions, the average values of density (ρa) and relative density (Dr) are 1.84 g/cm3 and 86.28%, therefore all the samples for the two kinds of shear tests are dense [6,8,29].

4. Results

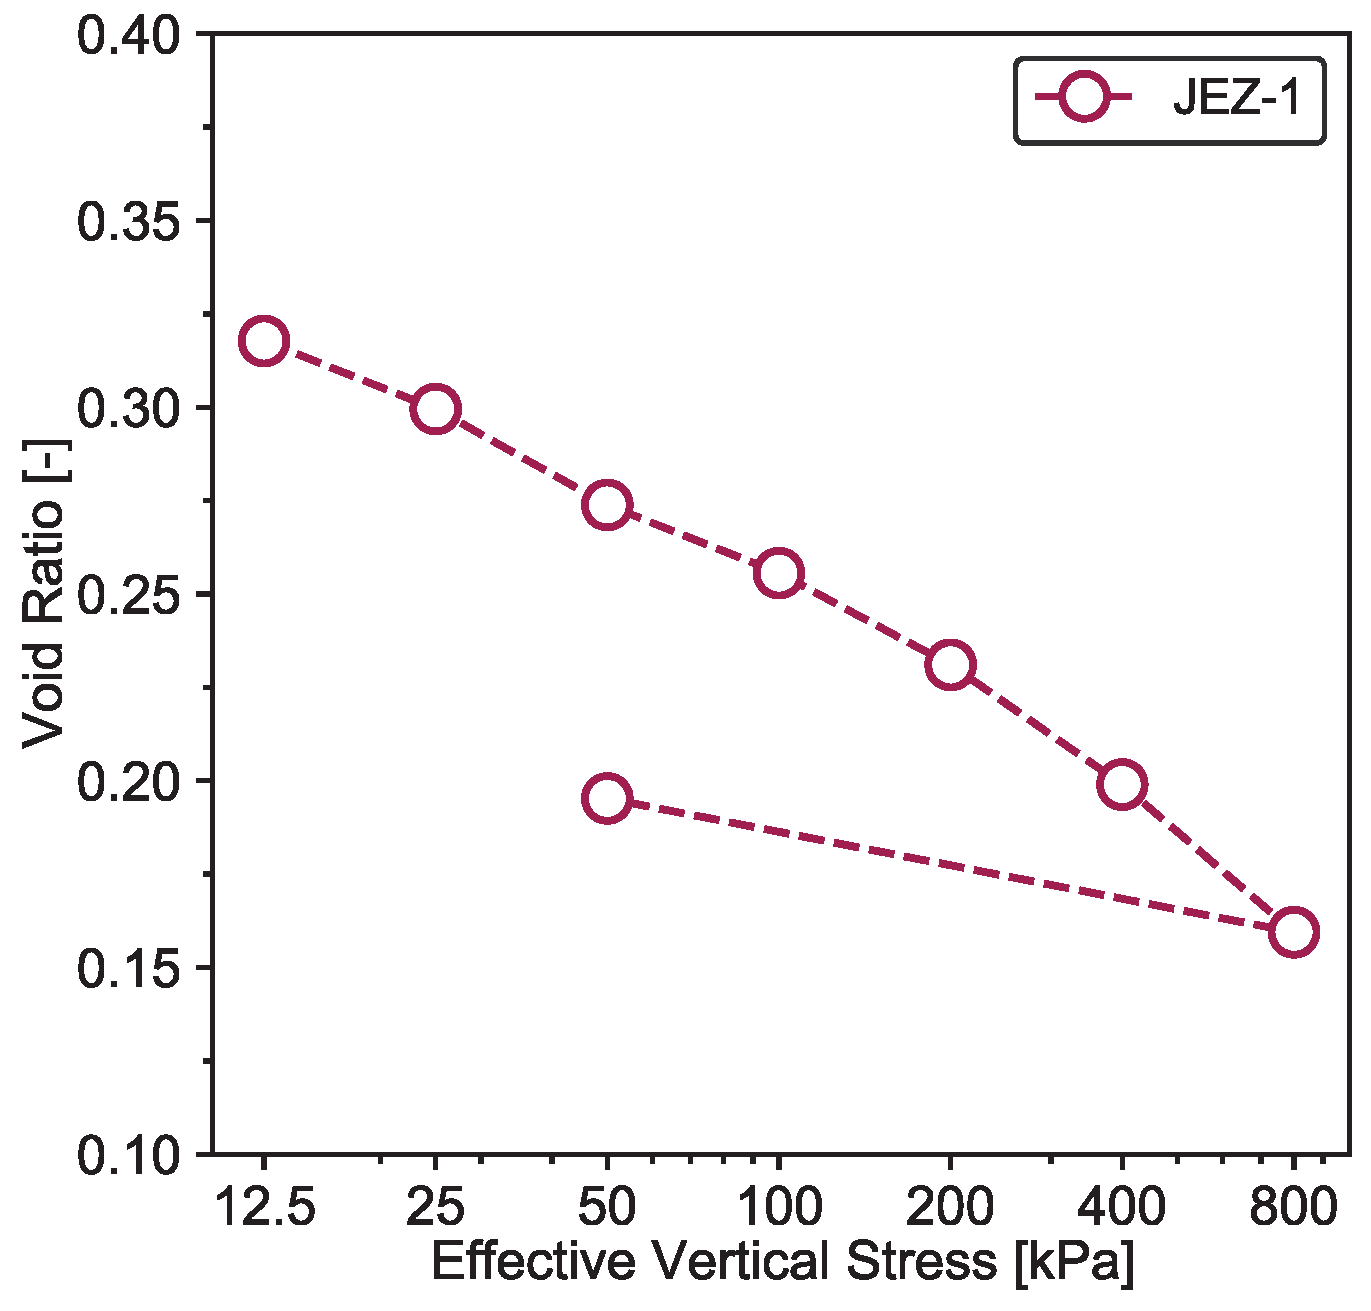
4.1. Oedometric Response

Knowing the load-settlement relationship of the Martian simulant shed light on the design of a Rover or excavation tools [29]. So far, it is clear that there is a lack of data on the compression index (Cc) and swelling index (Cs) of Martian simulants in the literature.
The void ratios as functions of the effective vertical stresses are plotted in Figure 5. From the straight-line part of the compressibility curve, the compression index (Cc) is determined as:
C c = e 1 e 2 log σ v 2 log σ v 1
where e1 is the void ratio at effective vertical stresses of σ v 1 , and e2 is the void ratio at effective vertical stresses of σ v 2 . The swelling index (Cs) of the JEZ-1 simulant can be obtained from the data on the unloading line:
C s = e 1 e 2 log σ v 2 log σ v 1
The Cc is 0.131 and the Cs is 0.030, which are calculated with the oedometric data of JEZ-1 in Figure 5. Both compression and swelling indexes of the JEZ-1 are quite low, indicating that it is a less compressible and lower swelling soil.

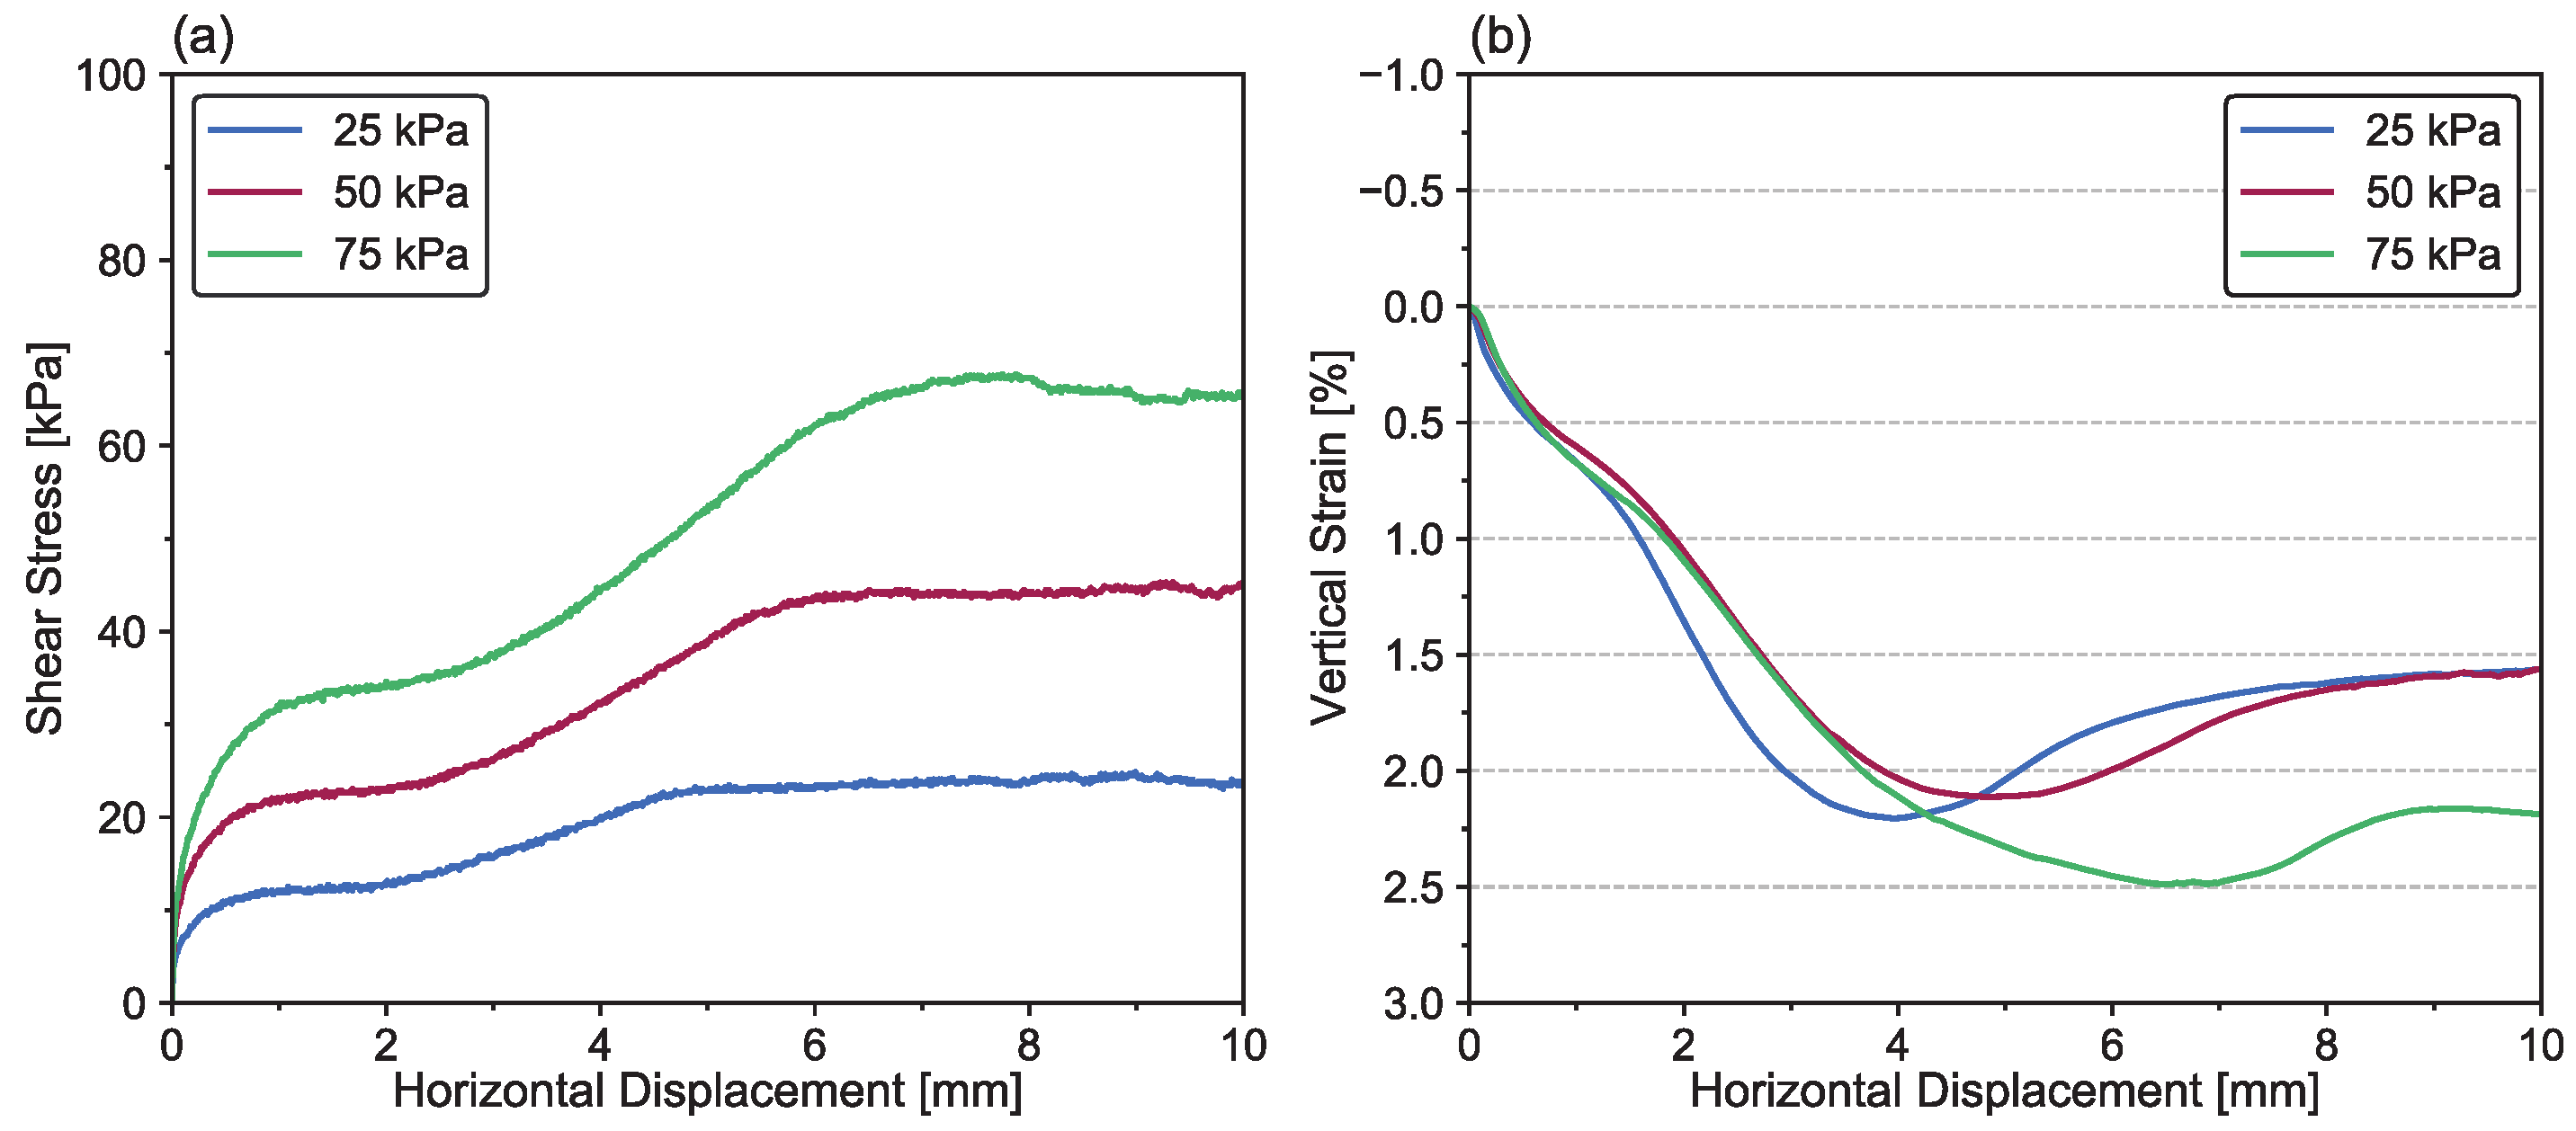
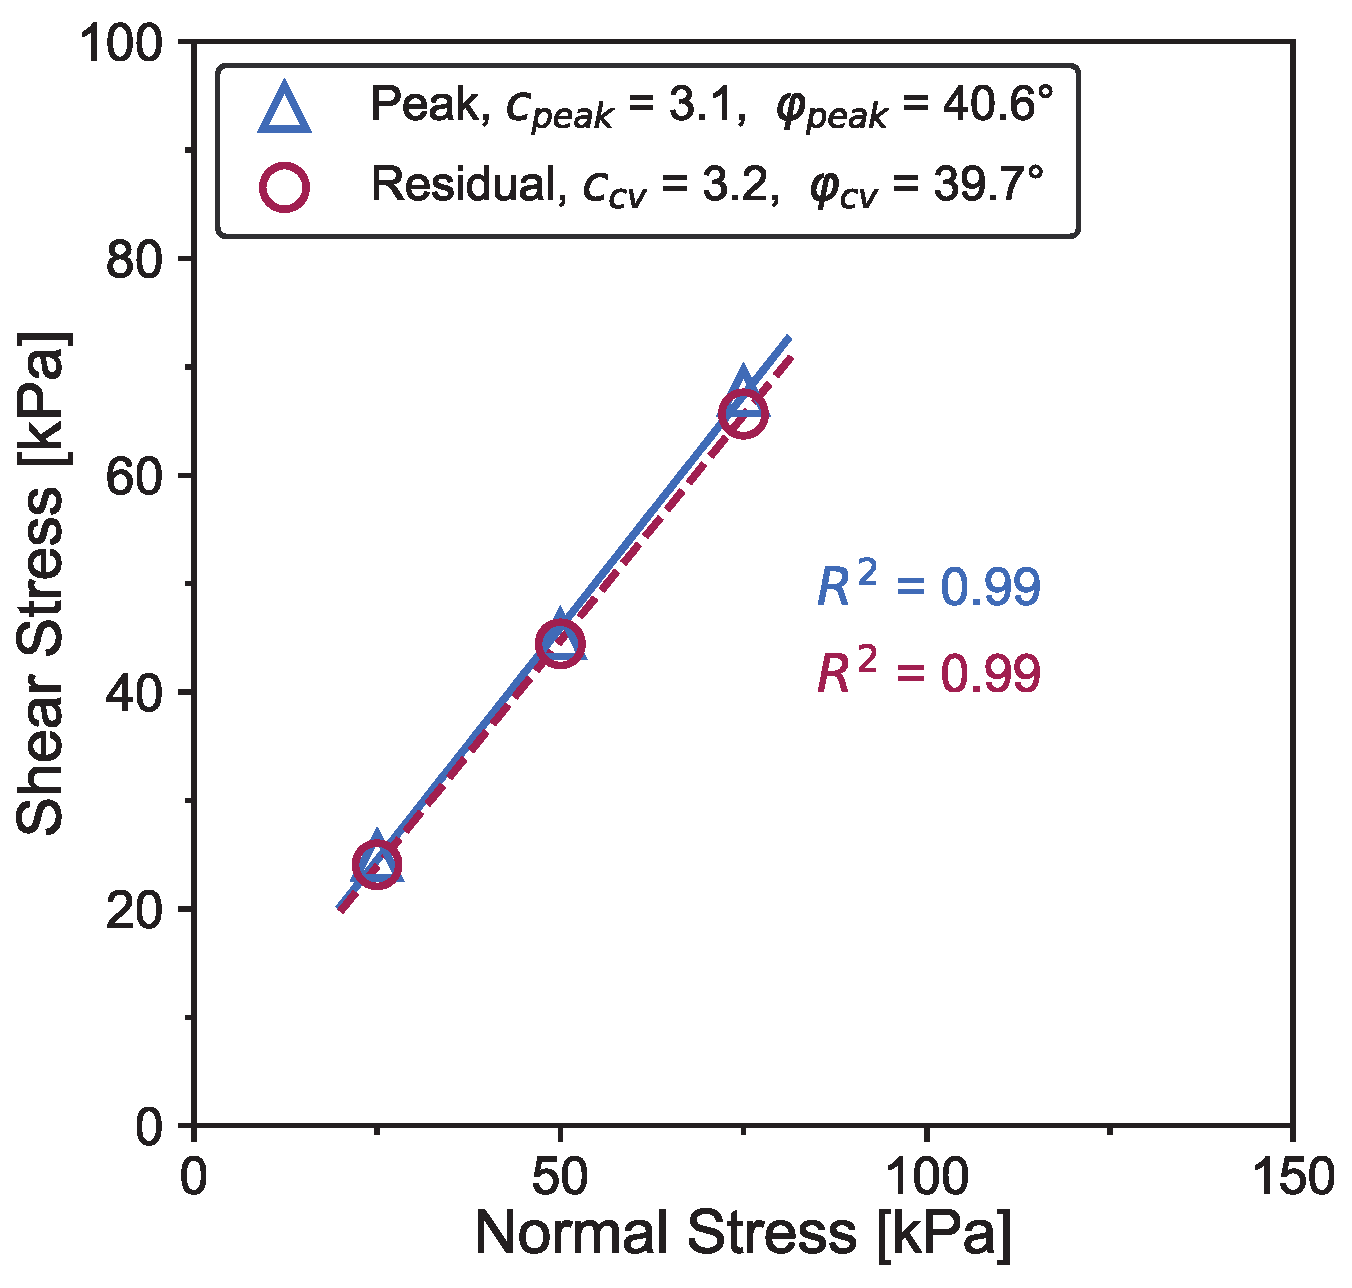
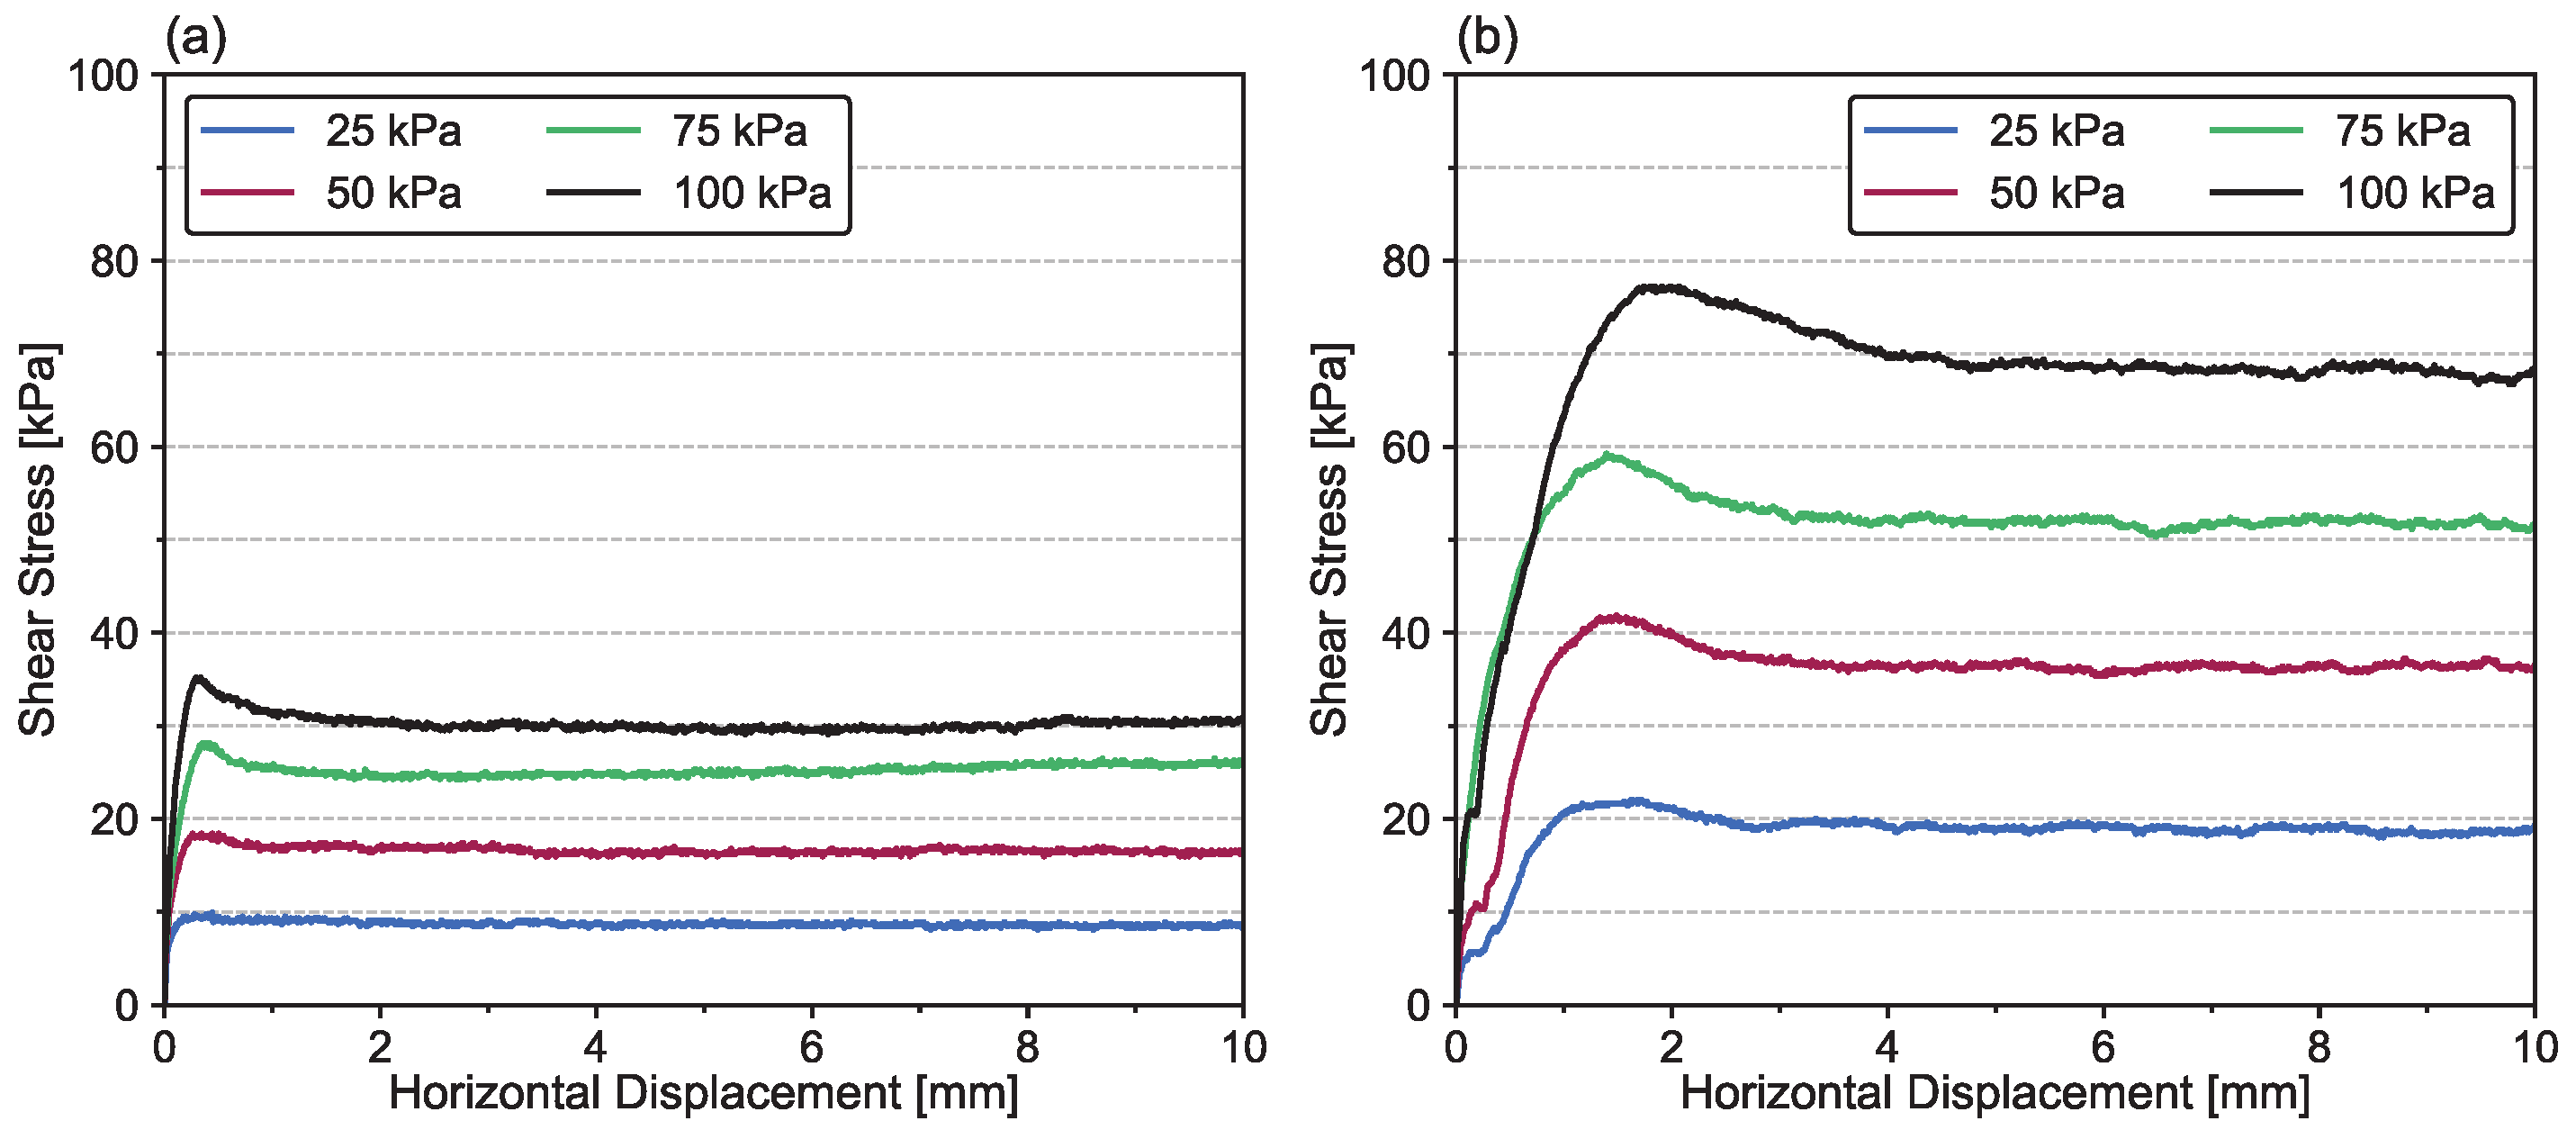
4.2. Direct Shear Tests

The direct shear tests were carried out on the dense specimens at different normal stresses (i.e., 25, 50, and 75 kPa), to find the cohesion and internal friction angle of JEZ-1. Figure 6a presents the shear stress responses of JEZ-1, direct shearing under a larger normal stress mobilizes larger shear stresses. The shear stress curves show a sharp increase then gradually go up to maximum finally to a constant volume state, due to the space between the upper (100 mm × 100 mm) and the bottom (140 mm × 100 mm) shear boxes, and the small holes on the bottom part of the shear box [15]. The JEZ-1 grains that go to the space and small holes mentioned above will result in a decrease on the sample density. Figure 6b presents the normal strain as a function of shear displacement. The curves of normal strain show contraction firstly then dilation.
A simplified linear envelope is considered since the tests presented here were performed at neither quite low nor very high normal stresses, at which both the influence of dilation and particles crush were limited [7]. The linear-fitted envelopes are plotted in Figure 7. Peak and residual internal friction angles of the JEZ-1 are determined from the envelopes, as shown in Figure 7. JEZ-1 exhibits peak (φpeak) and residual (φcv) internal friction angles of 40.6° and 39.7°, respectively. In addition, the peak (cpeak) and residual (ccv) cohesions are smaller than 4 kPa (see Figure 7).
Table 4 presents the cohesion and internal friction angles derived from direct shear tests and compares these values with published results of other typical Martian simulants (JSC Mars-1 and MMS-1). JEZ-1 simulant is characterized with higher peak (3.1 kPa) and residual (3.2 kPa) cohesion than JSC Mars-1 (1.14 kPa and 0.87 kPa). However, MMS-1 has a peak cohesion of 15 kPa, which is considerably higher than the one of JEZ-1. The peak internal friction angle (φpeak = 40.6°) of JEZ-1 is lower than JSC Mars-1 (48.8°) and MMS-1 (46.0°) with 8.2° and 5.4°. While the φcv values between the three simulants are quite close (Table 4), with a slight difference range between 0.2° and 1.4°.
The cohesions of JEZ-1 are in agreement with the values obtained from in-situ tests from Spirit Rover (1~15 kPa), and Opportunity Rover (1~5 kPa), see [30,31]. With regard to the internal friction angles, JEZ-1 has much higher values than the in-situ results (about 20°) from both Spirit and Opportunity Rovers [30,31].

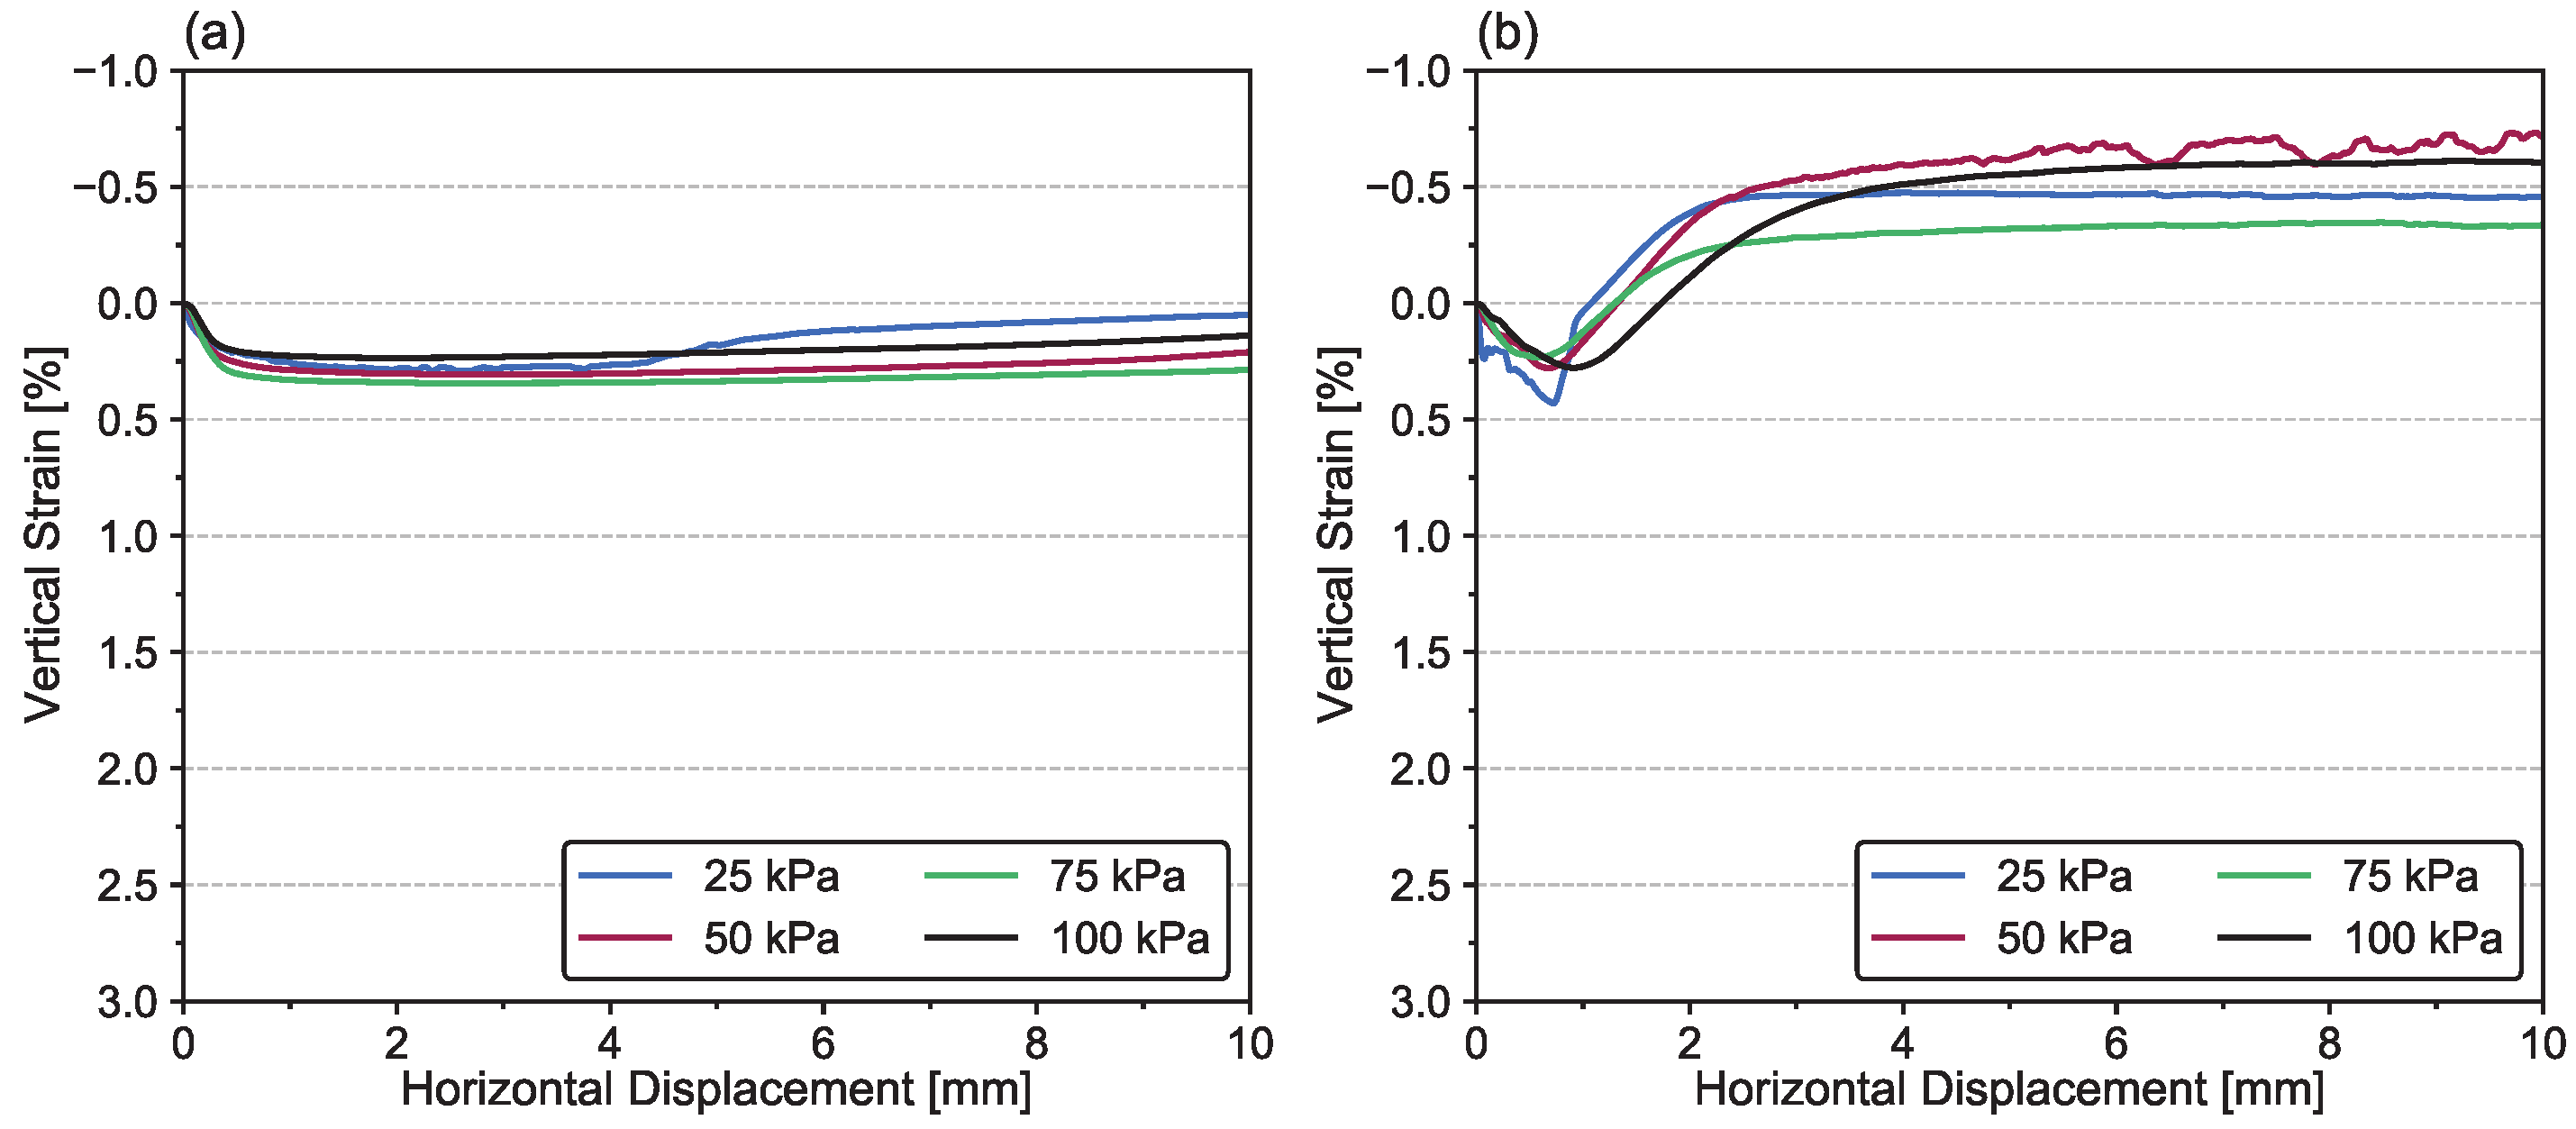
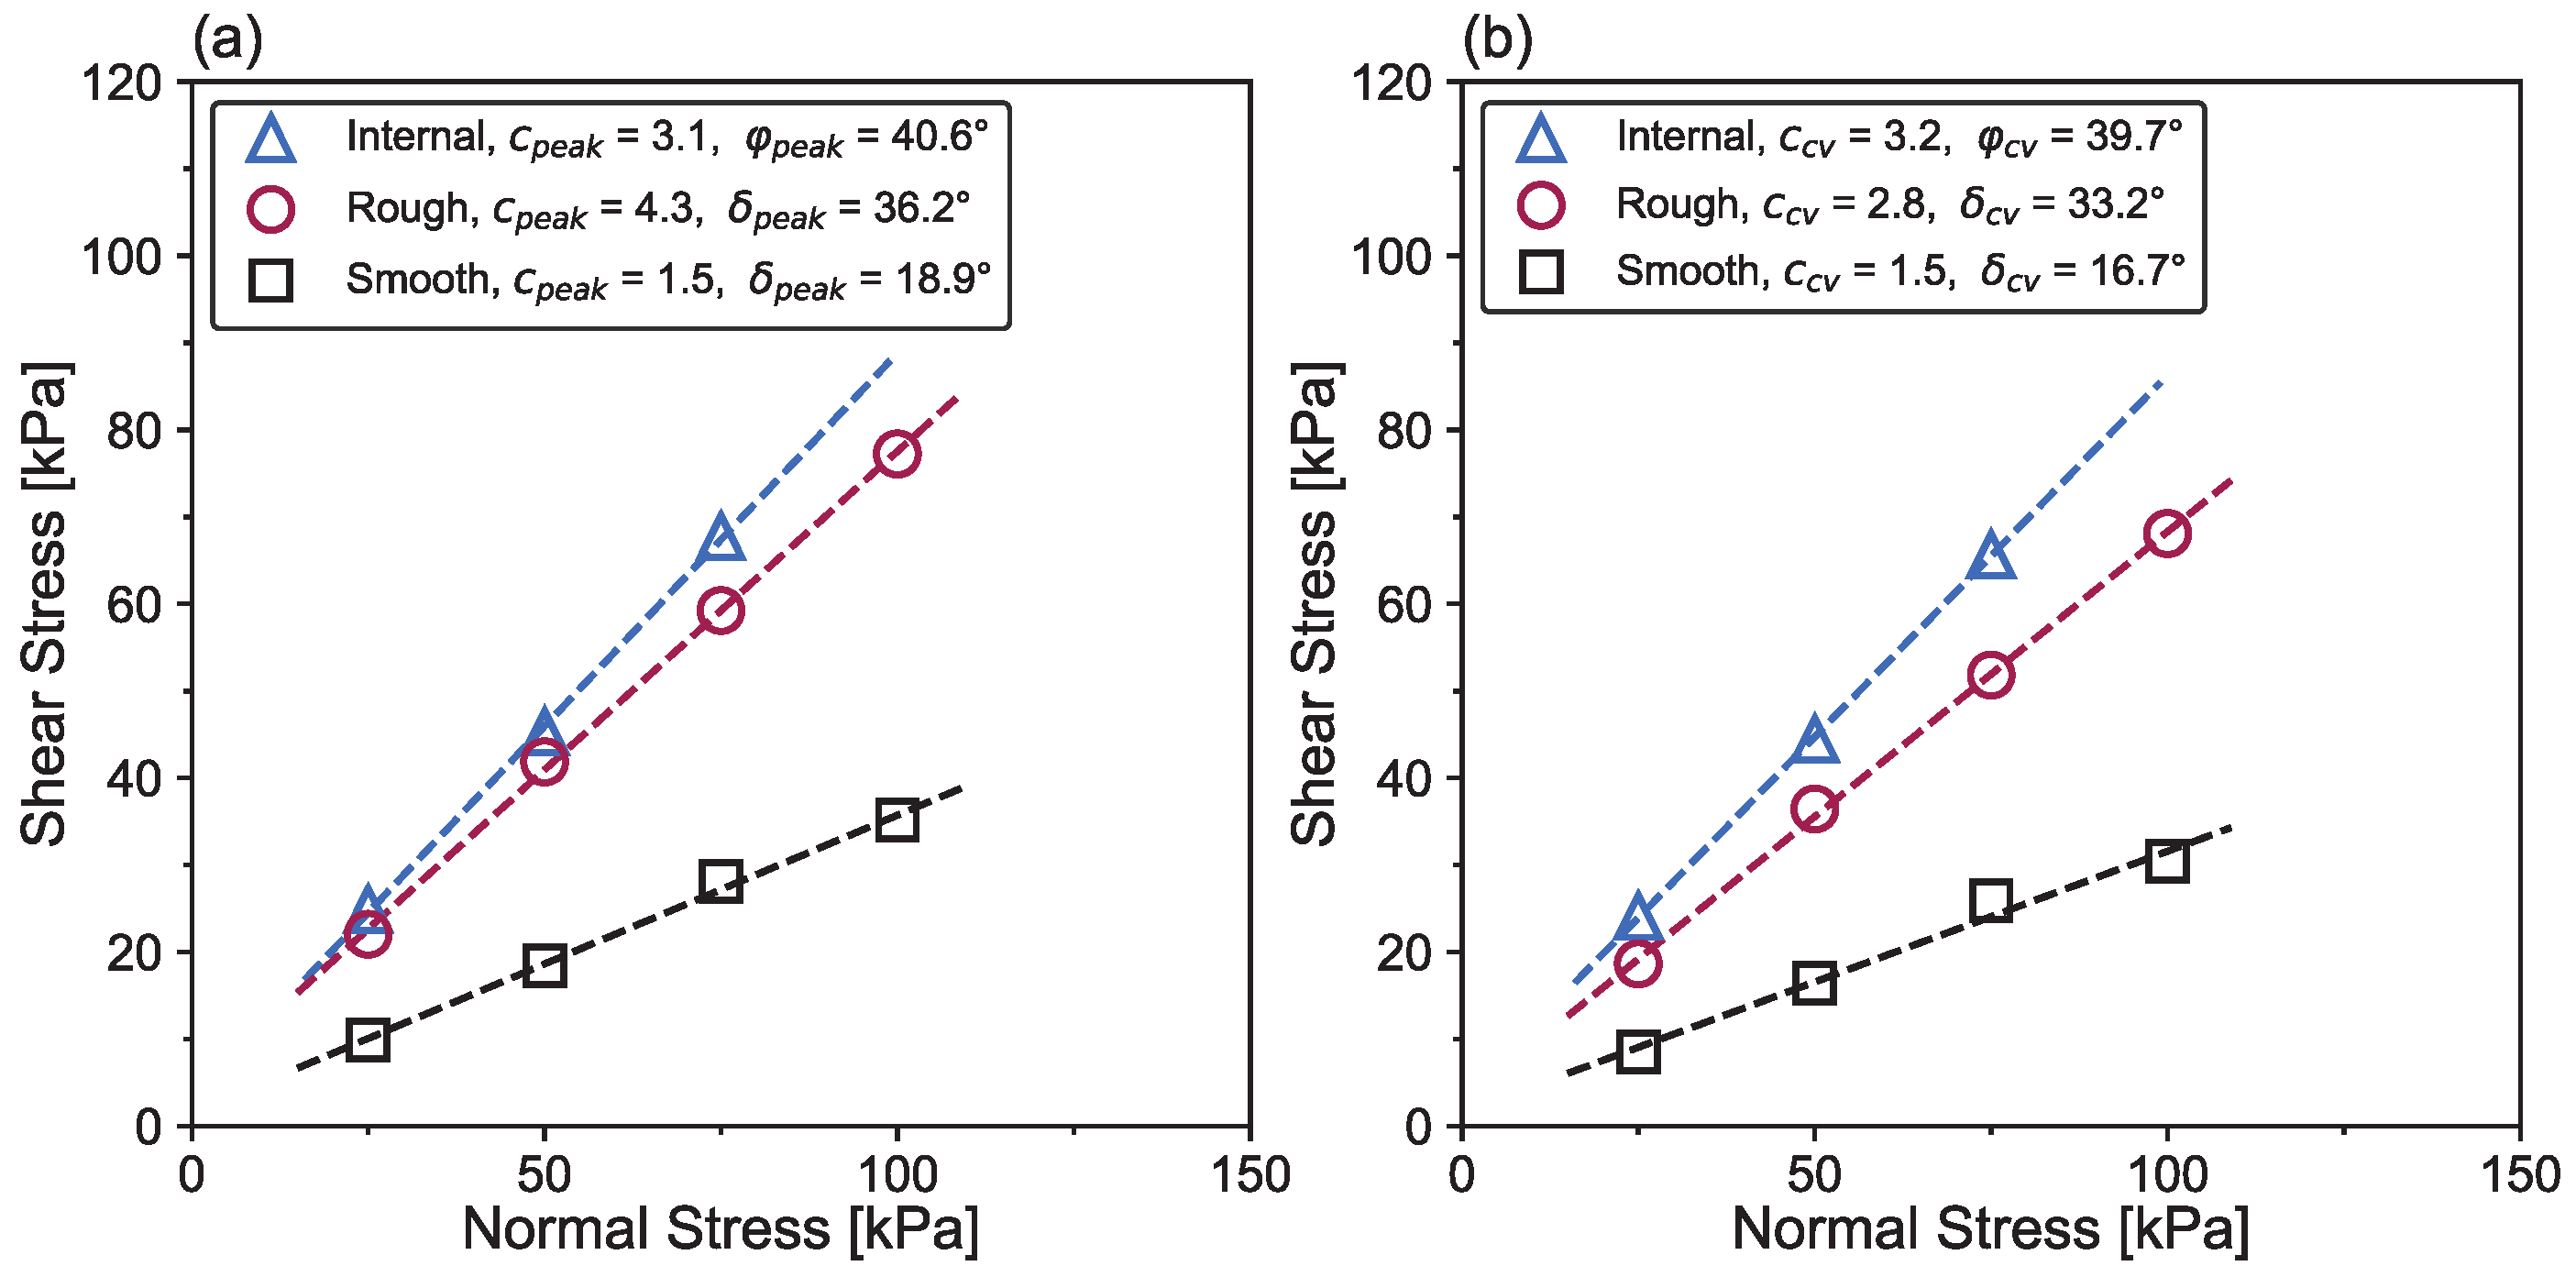
4.3. Interface Direct Shear Response

The interface direct shear characteristics are influenced by different factors such as sample density, shearing velocity, temperature, or interface roughness [11,15,19,32,33]. This paper investigated the mechanical response of the JEZ-1 simulant-steel interface under two roughness conditions: smooth and rough. The interface shearing results in terms of shear stress versus horizontal displacement are given in Figure 8. Under both smooth and rough steel surfaces, the mobilized shear stresses increase significantly with increasing normal stresses. Larger peak and residual shear stresses are mobilized with increasing surface roughness from smooth to rough at each normal stress (Figure 8). The peak and residual shear stresses are reached at larger horizontal displacement in the case of a rough surface rather than the smooth one.
Figure 9 compares the vertical strain as a function of normal stress and horizontal displacement during interface shearing. In the smooth interface test, the normal strain curves show contraction then slight dilation (Figure 9a). While for the rough interface, the curves experience contraction then larger dilation (Figure 9b).
All the tests on JEZ-1 simulant-steel interface for the two considered roughness are summarized in the Mohr plane in Figure 10 and compared with the results of soil-soil. The peak and residual adhesions (i.e., cpeak and ccv), as well as peak and residual interface friction angles (i.e., δpeak and δcv) are obtained from the linear envelopes in Figure 10. The cpeak values of the smooth and rough interface are 1.5 kPa and 4.3 kPa, and the ccv values are 1.5 kPa and 2.8 kPa, respectively. The cpeak of the rough interface is somewhat higher than the one of internal cpeak, which is likely due to the contact between the JEZ-1 grains and the steel grooves that is caused by the sample preparation, however, the difference is only 1.2 kPa. All the interface ccv values are lower than the cohesion of JEZ-1 (3.2 kPa). The cohesion and adhesion of JEZ-1 in this paper are lower than 5 kPa, in accordance with the in-situ data from wheel trenches or wheel scuffs [8,9].
The peak interface friction angles (δpeak) are 18.9° and 36.2°, for the smooth and rough interfaces (Figure 10a). Figure 10b indicates that the residual interface friction angles of the smooth and rough interfaces, δcv, are 16.7° and 33.2°, respectively. All δpeak and δcv values are lower than the φpeak and φcv of JEZ-1 (i.e., 40.6° and 39.7°), indicating that the shearing occurs in the interface zone rather than in the soil.
The peak and residual interface friction angles versus normalized interface roughness are plotted in Figure 11, though the data points are limited. The results indicate that the interface friction angles get close to the internal friction angles when shearing against rougher steel plate (Figure 11), in agreement with Earth soils-structure interface results [34,35].

5. Conclusions

This paper aims at understanding the basic mechanical response of JEZ-1 Martian simulant, the characteristics of soil-soil and soil-steel interface have been investigated by direct shear tests in a laboratory. Based on the obtained results in this study, the main findings are concluded as follows:
  • The compressibility and swelling index of JEZ-1 are quite low;
  • Both the peak and residual cohesion of JEZ-1 are <4 kPa. The peak (φpeak) and critical (φcv) internal friction angles are 40.6° and 39.7°, respectively;
  • The adhesion of the interface between JEZ-1 and smooth/rough steel are lower than 5 kPa;
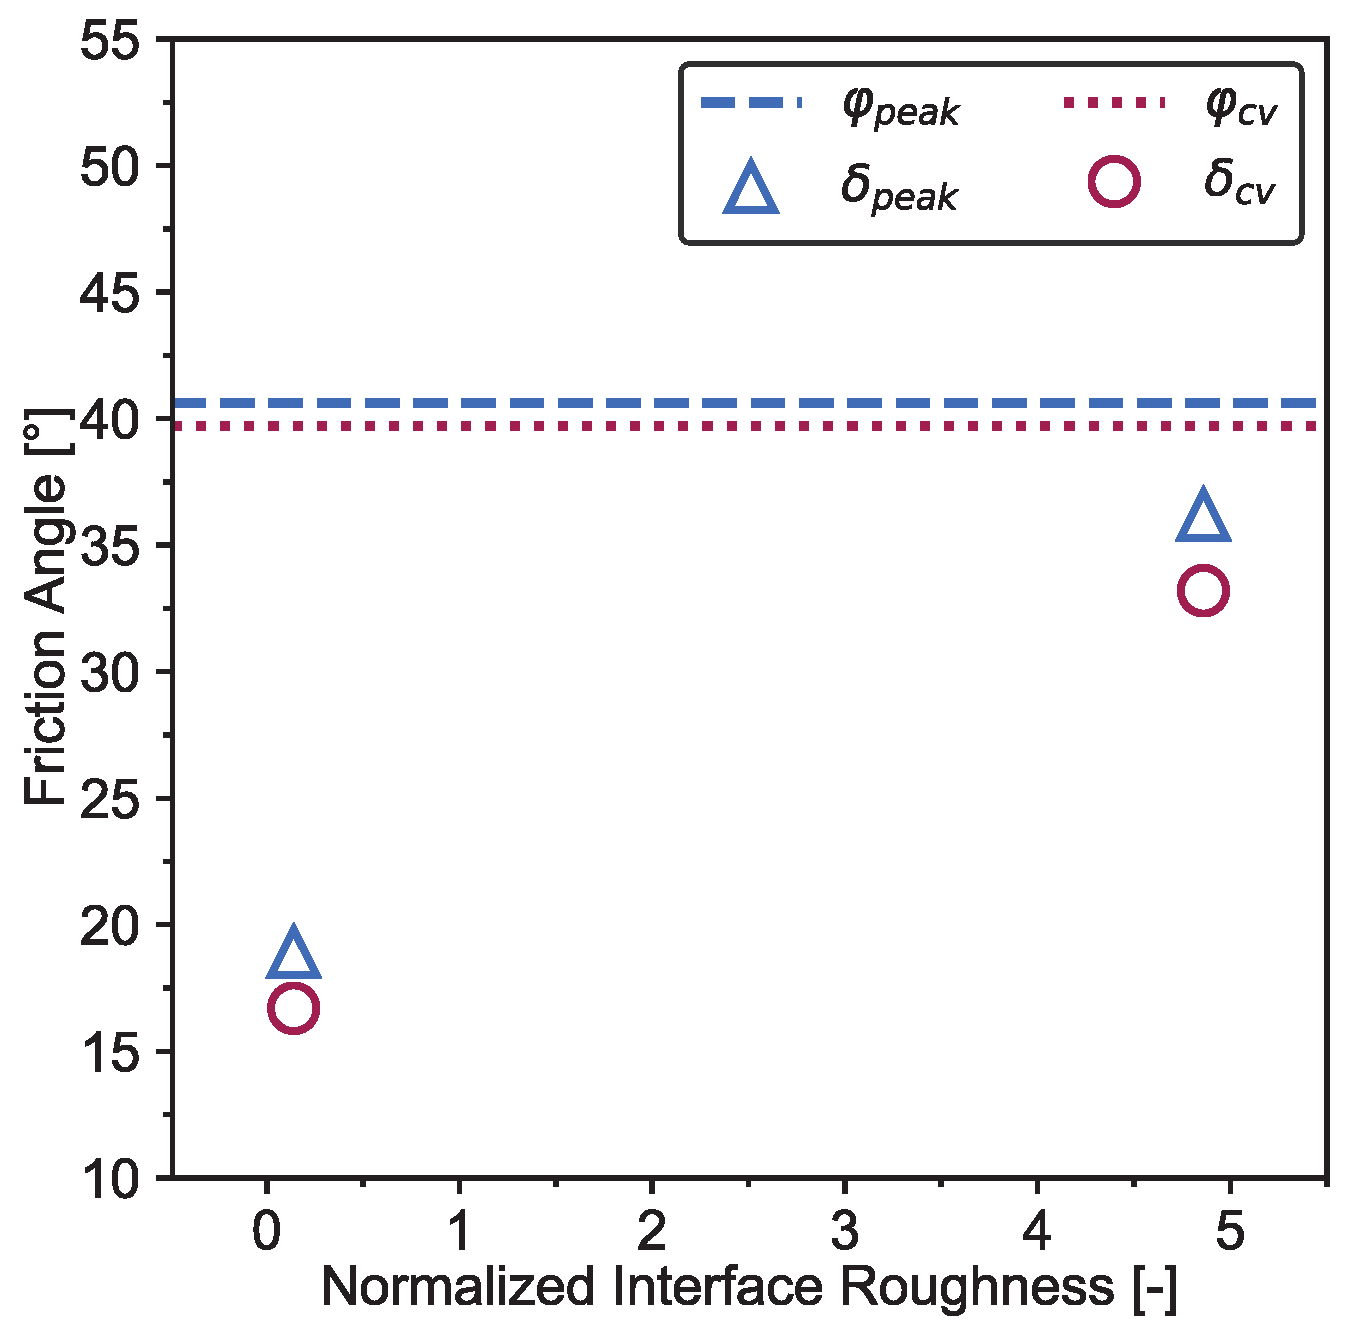
  • The peak interface friction angles (δpeak) are 18.9° and 36.2°, and the residual interface friction angles (δcv) are 16.7° and 33.2°, respectively, for the smooth and rough interfaces;
  • The interface friction angles (δ) are lower than the internal friction angles (φ) of JEZ-1. The δ gets close to the φ when increasing the interface roughness.
The interface results can provide information on Mars rover design, excavation tool determination as well as infrastructure development. Moreover, in the future, the interface results should be compared to the in-situ values of Jezero Crater Delta that are obtained by the Perseverance Rover. More geotechnical properties of the JEZ-1 Martian simulant need to be further investigated thoroughly.

Author Contributions

Conceptualization, methodology, data curation, writing-original draft preparation, K.Y. and J.L. (Jiaxing Lin); formal analysis, J.L. (Jiangxin Liu) and K.Y.; writing-review and editing, J.L. (Jiangxin Liu), J.L. (Jiaxing Lin), A.-R.V., K.O. and E.D.F.; All authors have read and agreed to the published version of the manuscript.

Funding

This research was funded by Research Institute of Highway Ministry of Transport.

Institutional Review Board Statement

Not applicable.

Informed Consent Statement

Not applicable.

Data Availability Statement

All data generated or used during the study appear in the submitted article.

Acknowledgments

The authors gratefully acknowledge Kevin Cannon, Jillian Gloria and Zoe Landsman for their important help.

Conflicts of Interest

The authors declare that they have no conflict of interest.

References

  1. Allen, C.C.; Morris, R.V.; Jager, K.M.; Golden, D.; Lindstrom, D.J.; Lindstrom, M.M.; Lockwood, J.P. Martian regolith simulant JSC Mars-1. In Proceedings of the Lunar and Planetary Science Conference, Houston, TX, USA, 16–20 March 1998; p. 1690. [Google Scholar]
  2. Peters, G.H.; Abbey, W.; Bearman, G.H.; Mungas, G.S.; Smith, J.A.; Anderson, R.C.; Douglas, S.; Beegle, L.W. Mojave Mars simulant—Characterization of a new geologic Mars analog. Icarus 2008, 197, 470–479. [Google Scholar] [CrossRef]
  3. Cannon, K.M.; Britt, D.T.; Smith, T.M.; Fritsche, R.F.; Batcheldor, D. Mars global simulant MGS-1: A Rocknest-based open standard for basaltic martian regolith simulants. Icarus 2019, 317, 470–478. [Google Scholar] [CrossRef] [Green Version]
  4. Clark, J.; Archer, P.; Gruener, J.; Ming, D.; Tu, V.; Niles, P.; Mertzman, S. JSC-Rocknest: A large-scale Mojave Mars Simulant (MMS) based soil simulant for in-situ resource utilization water-extraction studies. Icarus 2020, 351, 113936. [Google Scholar] [CrossRef]
  5. Perko, H.A.; Nelson, J.D.; Green, J.R. Mars soil mechanical properties and suitability of Mars soil simulants. J. Aerosp. Eng. 2006, 19, 169–176. [Google Scholar] [CrossRef]
  6. Iai, M.; Luna, R. Direct shear tests on JSC-1A lunar regolith simulant. J. Aerosp. Eng. 2011, 24, 433–441. [Google Scholar] [CrossRef]
  7. David Frost, J.; Martinez, A. Interface Shear Response of JSC-1A, GRC-3, and JSC-Mars1 Regolith Simulants. J. Aerosp. Eng. 2018, 31, 04018003. [Google Scholar] [CrossRef]
  8. Fujikawa, T.; Newson, T.; Ahmed, A.; Safdar, M. Assessment of the Geo-Mechanical Properties of Mojave Mars Simulant-1 (MMS-1) Soil. In Proceedings of the Geotechnical Engineering in the XXI Century: Lessons Learned and Future Challenges: Proceedings of the XVI Pan-American Conference on Soil Mechanics and Geotechnical Engineering (XVI PCSMGE), Cancun, Mexico, 17–20 November 2019; p. 268. [Google Scholar]
  9. Sullivan, R.; Anderson, R.; Biesiadecki, J.; Bond, T.; Stewart, H. Cohesions and friction angles of Martian regolith from MER wheel trenches and wheel scuffs. In Proceedings of the Lunar and Planetary Science Conference, Woodlands, TX, USA, 1–5 March 2010; p. 1879. [Google Scholar]
  10. Uesugi, M.; Kishida, H. Frictional resistance at yield between dry sand and mild steel. Soils Found. 1986, 26, 139–149. [Google Scholar] [CrossRef] [Green Version]
  11. Vasilescu, A.-R. Design and Execution of Energy Piles: Validation by In-Situ and Laboratory Experiments. Ph.D. Thesis, École centrale de Nantes, Nantes, France, 2019. [Google Scholar]
  12. Maghsoodi, S.; Cuisinier, O.; Masrouri, F. Thermo-mechanical behaviour of clay-structure interface. In Proceedings of the E3S Web of Conferences, Glasgow, UK, 25 June 2019; p. 10002. [Google Scholar]
  13. Maghsoodi, S.; Cuisinier, O.; Masrouri, F. Comportement thermo-mécanique de l’interface sable-structure. In Proceedings of the 17th European Conference on Soil Mechanics and Geotechnical Engineering, Reykjavík, Iceland, 1–6 September 2019. [Google Scholar]
  14. Maghsoodi, S. Thermo-Mechanical Behavior of Soil-Structure Interface under Monotonic and Cyclic Loads in the Context of Energy Geostructures. Ph.D. Thesis, Université de Lorraine, Nancy, France, 2020. [Google Scholar]
  15. Yin, K. Influence of Clay Fraction on the Mechanical Behavior of a Soil-Concrete Interface. Ph.D. Thesis, École Centrale de Nantes, Nantes, France, 2021. [Google Scholar]
  16. Hu, L.; Pu, J. Testing and modeling of soil-structure interface. J. Geotech. Geoenviron. Eng. 2004, 130, 851–860. [Google Scholar] [CrossRef]
  17. Yin, K.; Liu, J.; Vasilescu, A.-R.; Di Filippo, E.; Othmani, K. A Procedure to Prepare Sand–Clay Mixture Samples for Soil–Structure Interface Direct Shear Tests. Appl. Sci. 2021, 11, 5337. [Google Scholar] [CrossRef]
  18. Vasilescu, A.R.; Fauchille, A.-L.; Dano, C.; Kotronis, P.; Manirakiza, R.; Gotteland, P. Impact of temperature cycles at soil-concrete interface for energy piles. In Proceedings of the International Symposium on Energy Geotechnics, Lausanne, Switzerland, 25–28 September 2018; pp. 35–42. [Google Scholar]
  19. Vasilescu, R.; Yin, K.; Fauchille, A.-L.; Kotronis, P.; Dano, C.; Manirakiza, R.; Gotteland, P. Influence of thermal cycles on the deformation of soil-pile interface in energy piles. In Proceedings of the E3S Web of Conferences, Glasgow, UK, 25 June 2019; p. 13004. [Google Scholar]
  20. Vaid, Y.P.; Sivathayalan, S.; Stedman, D. Influence of specimen-reconstituting method on the undrained response of sand. Geotech. Test. J. 1999, 22, 187–195. [Google Scholar]
  21. Sze, H.; Yang, J. Failure modes of sand in undrained cyclic loading: Impact of sample preparation. J. Geotech. Geoenviron. Eng. 2014, 140, 152–169. [Google Scholar] [CrossRef] [Green Version]
  22. Raghunandan, M.; Juneja, A.; Hsiung, B. Preparation of reconstituted sand samples in the laboratory. Int. J. Geotech. Eng. 2012, 6, 125–131. [Google Scholar] [CrossRef]
  23. Kuerbis, R.; Vaid, Y. Sand sample preparation-the slurry deposition method. Soils Found. 1988, 28, 107–118. [Google Scholar] [CrossRef] [Green Version]
  24. Wang, S.; Luna, R.; Stephenson, R.W. A slurry consolidation approach to reconstitute low-plasticity silt specimens for laboratory triaxial testing. Geotech. Test. J. 2011, 34, 288–296. [Google Scholar]
  25. Bendahmane, F.; Marot, D.; Alexis, A. Experimental parametric study of suffusion and backward erosion. J. Geotech. Geoenviron. Eng. 2008, 134, 57–67. [Google Scholar] [CrossRef]
  26. Krage, C.P.; Price, A.B.; Lukas, W.G.; DeJong, J.T.; DeGroot, D.J.; Boulanger, R.W. Slurry Deposition Method of Low-Plasticity Intermediate Soils for Laboratory Element Testing. Geotech. Test. J. 2020, 43, 1269–1285. [Google Scholar] [CrossRef]
  27. Yin, K.; Fauchille, A.-L.; Othmani, K.; Sciarra, G.; Kotronis, P.; Benoit, Y.; Bertrand, F.; Branchu, S. Influence of sample preparation on the multi scale structure of sand-clay mixtures. In Proceedings of the E3S Web of Conferences, Glasgow, UK, 25 June 2019; p. 01007. [Google Scholar]
  28. Maghsoodi, S.; Cuisinier, O.; Masrouri, F. Thermal effects on one-way cyclic behaviour of clay-structure interface. In Proceedings of the E3S Web of Conferences, La Jolla, CA, USA, 18 November 2020; p. 05001. [Google Scholar]
  29. Zeng, X.; He, C.; Oravec, H.; Wilkinson, A.; Agui, J.; Asnani, V. Geotechnical properties of JSC-1A lunar soil simulant. J. Aerosp. Eng. 2010, 23, 111–116. [Google Scholar] [CrossRef]
  30. Arvidson, R.E.; Anderson, R.; Bartlett, P.; Bell, J.; Blaney, D.; Christensen, P.R.; Chu, P.; Crumpler, L.; Davis, K.; Ehlmann, B. Localization and physical properties experiments conducted by Spirit at Gusev Crater. Science 2004, 305, 821–824. [Google Scholar] [CrossRef] [PubMed] [Green Version]
  31. Arvidson, R.; Anderson, R.; Bartlett, P.; Bell, J.; Christensen, P.; Chu, P.; Davis, K.; Ehlmann, B.; Golombek, M.; Gorevan, S. Localization and physical property experiments conducted by Opportunity at Meridiani Planum. Science 2004, 306, 1730–1733. [Google Scholar] [CrossRef] [PubMed]
  32. Pra-ai, S. Behaviour of soil-structure interfaces subjected to a large number of cycles. Application to Piles. Ph.D. Thesis, Université de Grenoble, Grenoble, France, 2013. [Google Scholar]
  33. Martinez, A.; Stutz, H.H. Rate effects on the interface shear behaviour of normally and overconsolidated clay. Géotechnique 2019, 69, 801–815. [Google Scholar] [CrossRef]
  34. Tsubakihara, Y.; Kishida, H.; Nishiyama, T. Friction between cohesive soils and steel. Soils Found. 1993, 33, 145–156. [Google Scholar] [CrossRef] [Green Version]
  35. Chen, X.; Zhang, J.; Xiao, Y.; Li, J. Effect of roughness on shear behavior of red clay-concrete interface in large-scale direct shear tests. Can. Geotech. J. 2015, 52, 1122–1135. [Google Scholar] [CrossRef]
Figure 1. Photograph of Martian regolith simulant JEZ-1: (a) typical particles; and representative SEM images of JEZ-1 with magnification of: (b) ×50, (c) ×100.
Applsci 11 07052 g001
Figure 2. Grain size distribution curves of JEZ-1, JSC Mars-1 and MMS-1.
Applsci 11 07052 g002
Figure 3. Steel plates for the interface direct shear test: (a) smooth and (b) rough surfaces.
Applsci 11 07052 g003
Figure 4. Interface direct shear apparatus: (a) loading frame, (b) bottom shear box and (c) upper shear box.
Applsci 11 07052 g004
Figure 5. Void ratio as a function of the effective vertical stress.
Applsci 11 07052 g005
Figure 6. Direct shear test results of JEZ-1: (a) shear stress and (b) vertical strain as a function of horizontal displacement.
Applsci 11 07052 g006
Figure 7. Peak and residual failure envelopes from direct shear tests of JEZ-1.
Applsci 11 07052 g007
Figure 8. Shear stress as a function of horizontal displacement from interface direct shear test on JEZ-1-steel plate: (a) smooth and (b) rough surfaces.
Applsci 11 07052 g008
Figure 9. Vertical strain as a function of horizontal displacement from interface direct shear test on JEZ-1-steel plate: (a) smooth and (b) rough surfaces.
Applsci 11 07052 g009
Figure 10. Summary of (a) peak and (b) residual failure envelopes for the three direct shear tests (soil-soil, smooth, and rough interfaces).
Applsci 11 07052 g010
Figure 11. Interface friction angles as a function of normalized interface roughness, compared to internal friction angles of JEZ-1.
Applsci 11 07052 g011
Table 1. Mineralogy of JEZ-1 (results from Exolith Lab).
Componentwt.%Componentwt.%
Olivine32.0Plagioclase16.0
Glass-rich basalt13.5Pyroxene12.0
Mg-carbonate11.0Smectite6.0
Mg-sulfate2.4Ferrihydrite2.1
Hydrated silica1.8Magnetite1.1
Anhydrite1.0Fe-carbonate0.8
Hematite0.3--
Table 2. Bulk major element chemistry of JEZ-1 (XRF results from Exolith Lab).
Componentwt.%Componentwt.%
SiO244.2TiO20.2
Al2O311.3Cr2O30.3
FeOT9.5MnO0.1
MgO25.9CaO3.5
Na2O1.9K2O0.3
P2O50.6SO32.1
Table 3. Roughness parameters of the steel plates.
Plate NumberRa (μm)Rmax (μm)d50 (μm)Rn (-)Surface Rough
#11.07.9570.14Smooth
#245.1277574.86Rough
Table 4. Cohesion and internal friction angle of Mars simulants.
Name of Mars Simulantcpeak (kPa)ccv (kPa)φpeak (°)φcv (°)Reference
JEZ-13.13.240.639.7This paper
JSC-Mars1.140.8748.841.1[7]
MMS-115-46.039.9[8]
Publisher’s Note: MDPI stays neutral with regard to jurisdictional claims in published maps and institutional affiliations.

