
Physarum-Inspired Bicycle Lane Network Design in a Congested Megacity


Abstract
1. Introduction
2. Physarum Polycephalum and Tasks Inspired by It
2.1. Review of Natural Physarum Polycephalum and Relevant Works
2.2. Network Development Model of Physarum Polycephalum
- Step 1: Initialize the environment.
- Step 2: Measure flux through individual links, based on edges’ pressures.
- Step 3: Update the conductivity of individual links, based on flux through it.
- Step 4: Return the network with links having appropriate conductivity.
3. Physarum-Inspired Bicycle Lane Network Design
3.1. Problem Statement: BLN Design Considering Feasible Routes
3.2. Physarum-Inspired BLN Design Method
3.2.1. Initialization
3.2.2. Conductivity Update of Individual Links
3.2.3. Final Network Construction
- Case 1: For i.e., , link eij is considered in the network if .
- Case 2: For i.e., , link eij is considered in the network even when the entire network is not traversable without it.
3.2.4. Complete Algorithm of BLN Design
| Algorithm 1 Physarum-inspired Bicycle Lane Network Design (p,L,h) |
| // p is a 1D pressure matrix, where pi denotes pressure of individual node i // L is a n × n matrix, Lij denotes the length of link eij between node i and node j // h is a n × n matrix, hij denotes the hinder value of link eij between node i and node j // ε is the viscosity value, N is total number of nodes, and μ is the conductivity decay //δ is a threshold value of conductibility // MaxItrn is the Maximum Number of Iteration as the termination criteria // D is a n × n matrix, Dij denotes the conductivity between node i and node j // Q is a n × n matrix, Qij denotes the flux between node i and node j Set links’ initial conductivity Dij according to Equations (4) and (5) Normalize links’ conductivity according to Equation (12) Calculate accumulated pressure of each individual nodes Pi according to Equations (6) and (7) For itr = 1: MaxItrn do //Flux Update For i = 1: N do For j = i + 1: N do Qij ← Dij × (Pi + Pj) / Lij // Using Equation (8) end for end for //Conductivity Update For i = 1: N do For j = i + 1: N do end for Normalize links’ conductivity according to Equation (12) itr ← itr + 1 end for // Bicycle Lane Network Construction BLN = [ ] // Empty For i = 1: N do For j = i + 1: N do If ) || (Traversal discontinued without eij) // Include the link in the network end if end for end for return BLN |
4. Computational Experiments
4.1. Mobility Problems and BLN Prospects in a Congested Mega City: Dhaka as a Case Study
4.2. Experimental Settings of Proposed BLN Design for Dhaka City
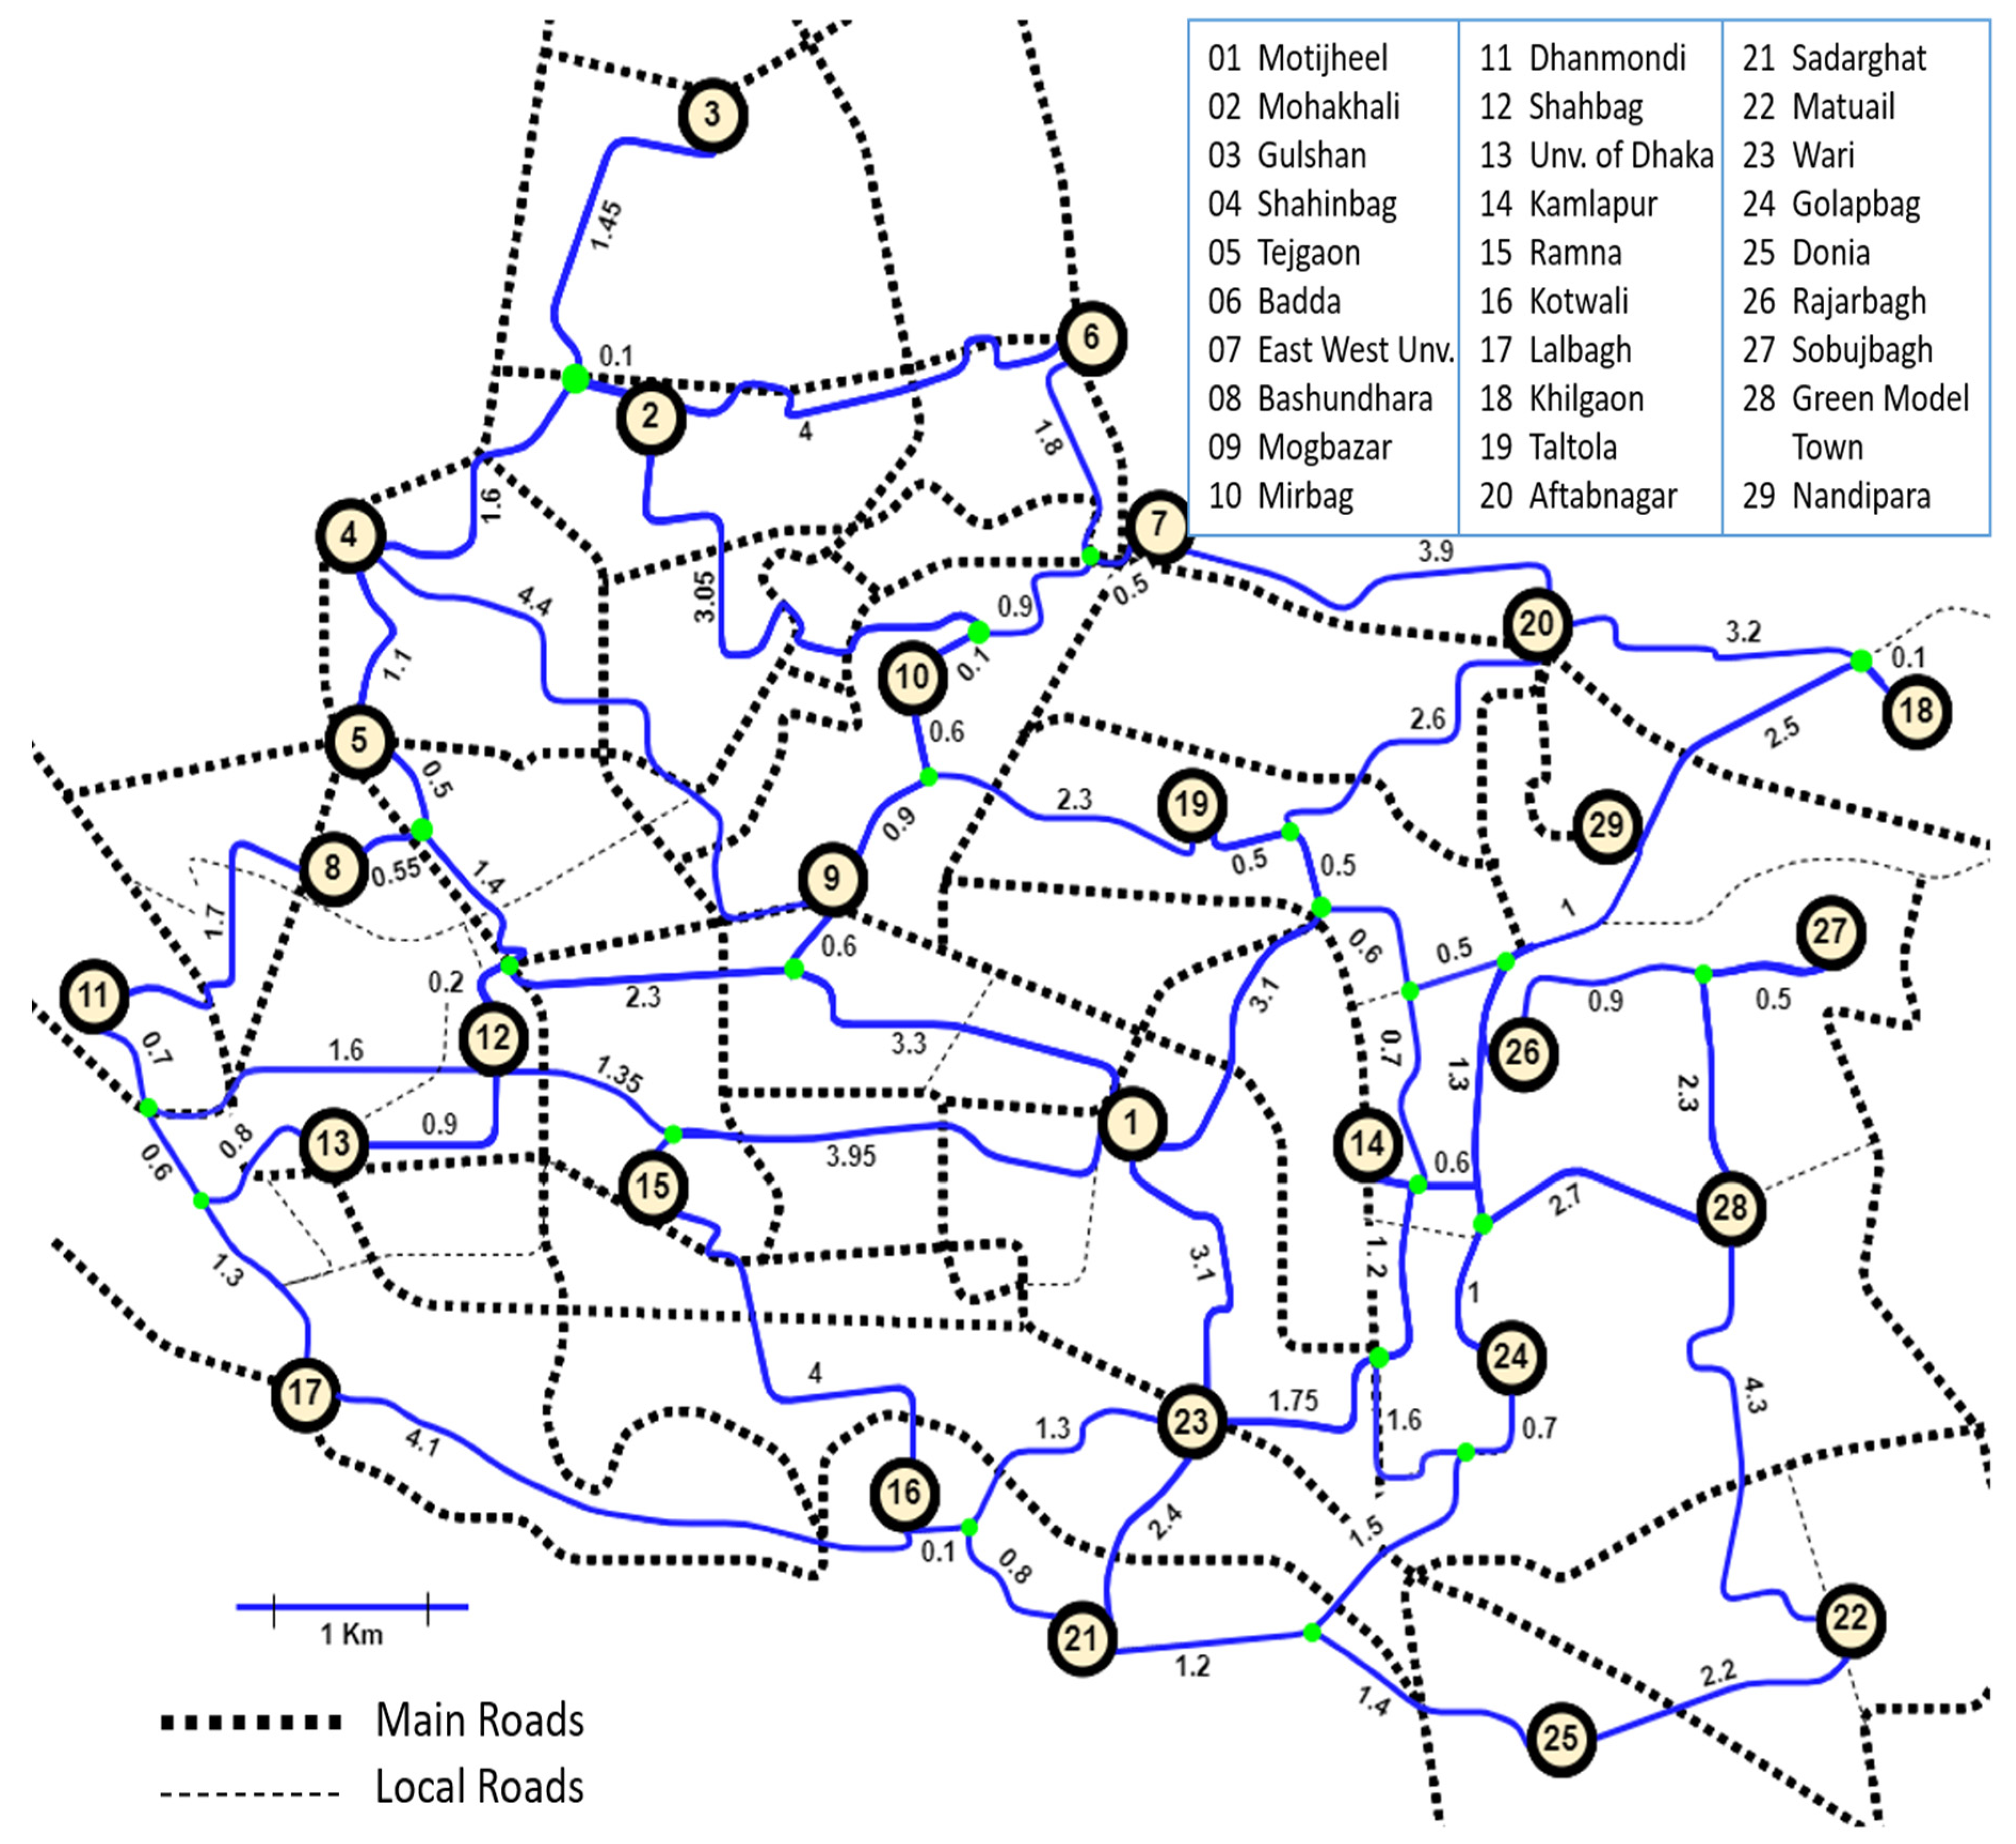
4.3. Test Case 1: BLN for Central Dhaka Area
4.3.1. BLN Design Solution for Central Dhaka
4.3.2. Effectiveness Measure of BLN Design for Central Dhaka
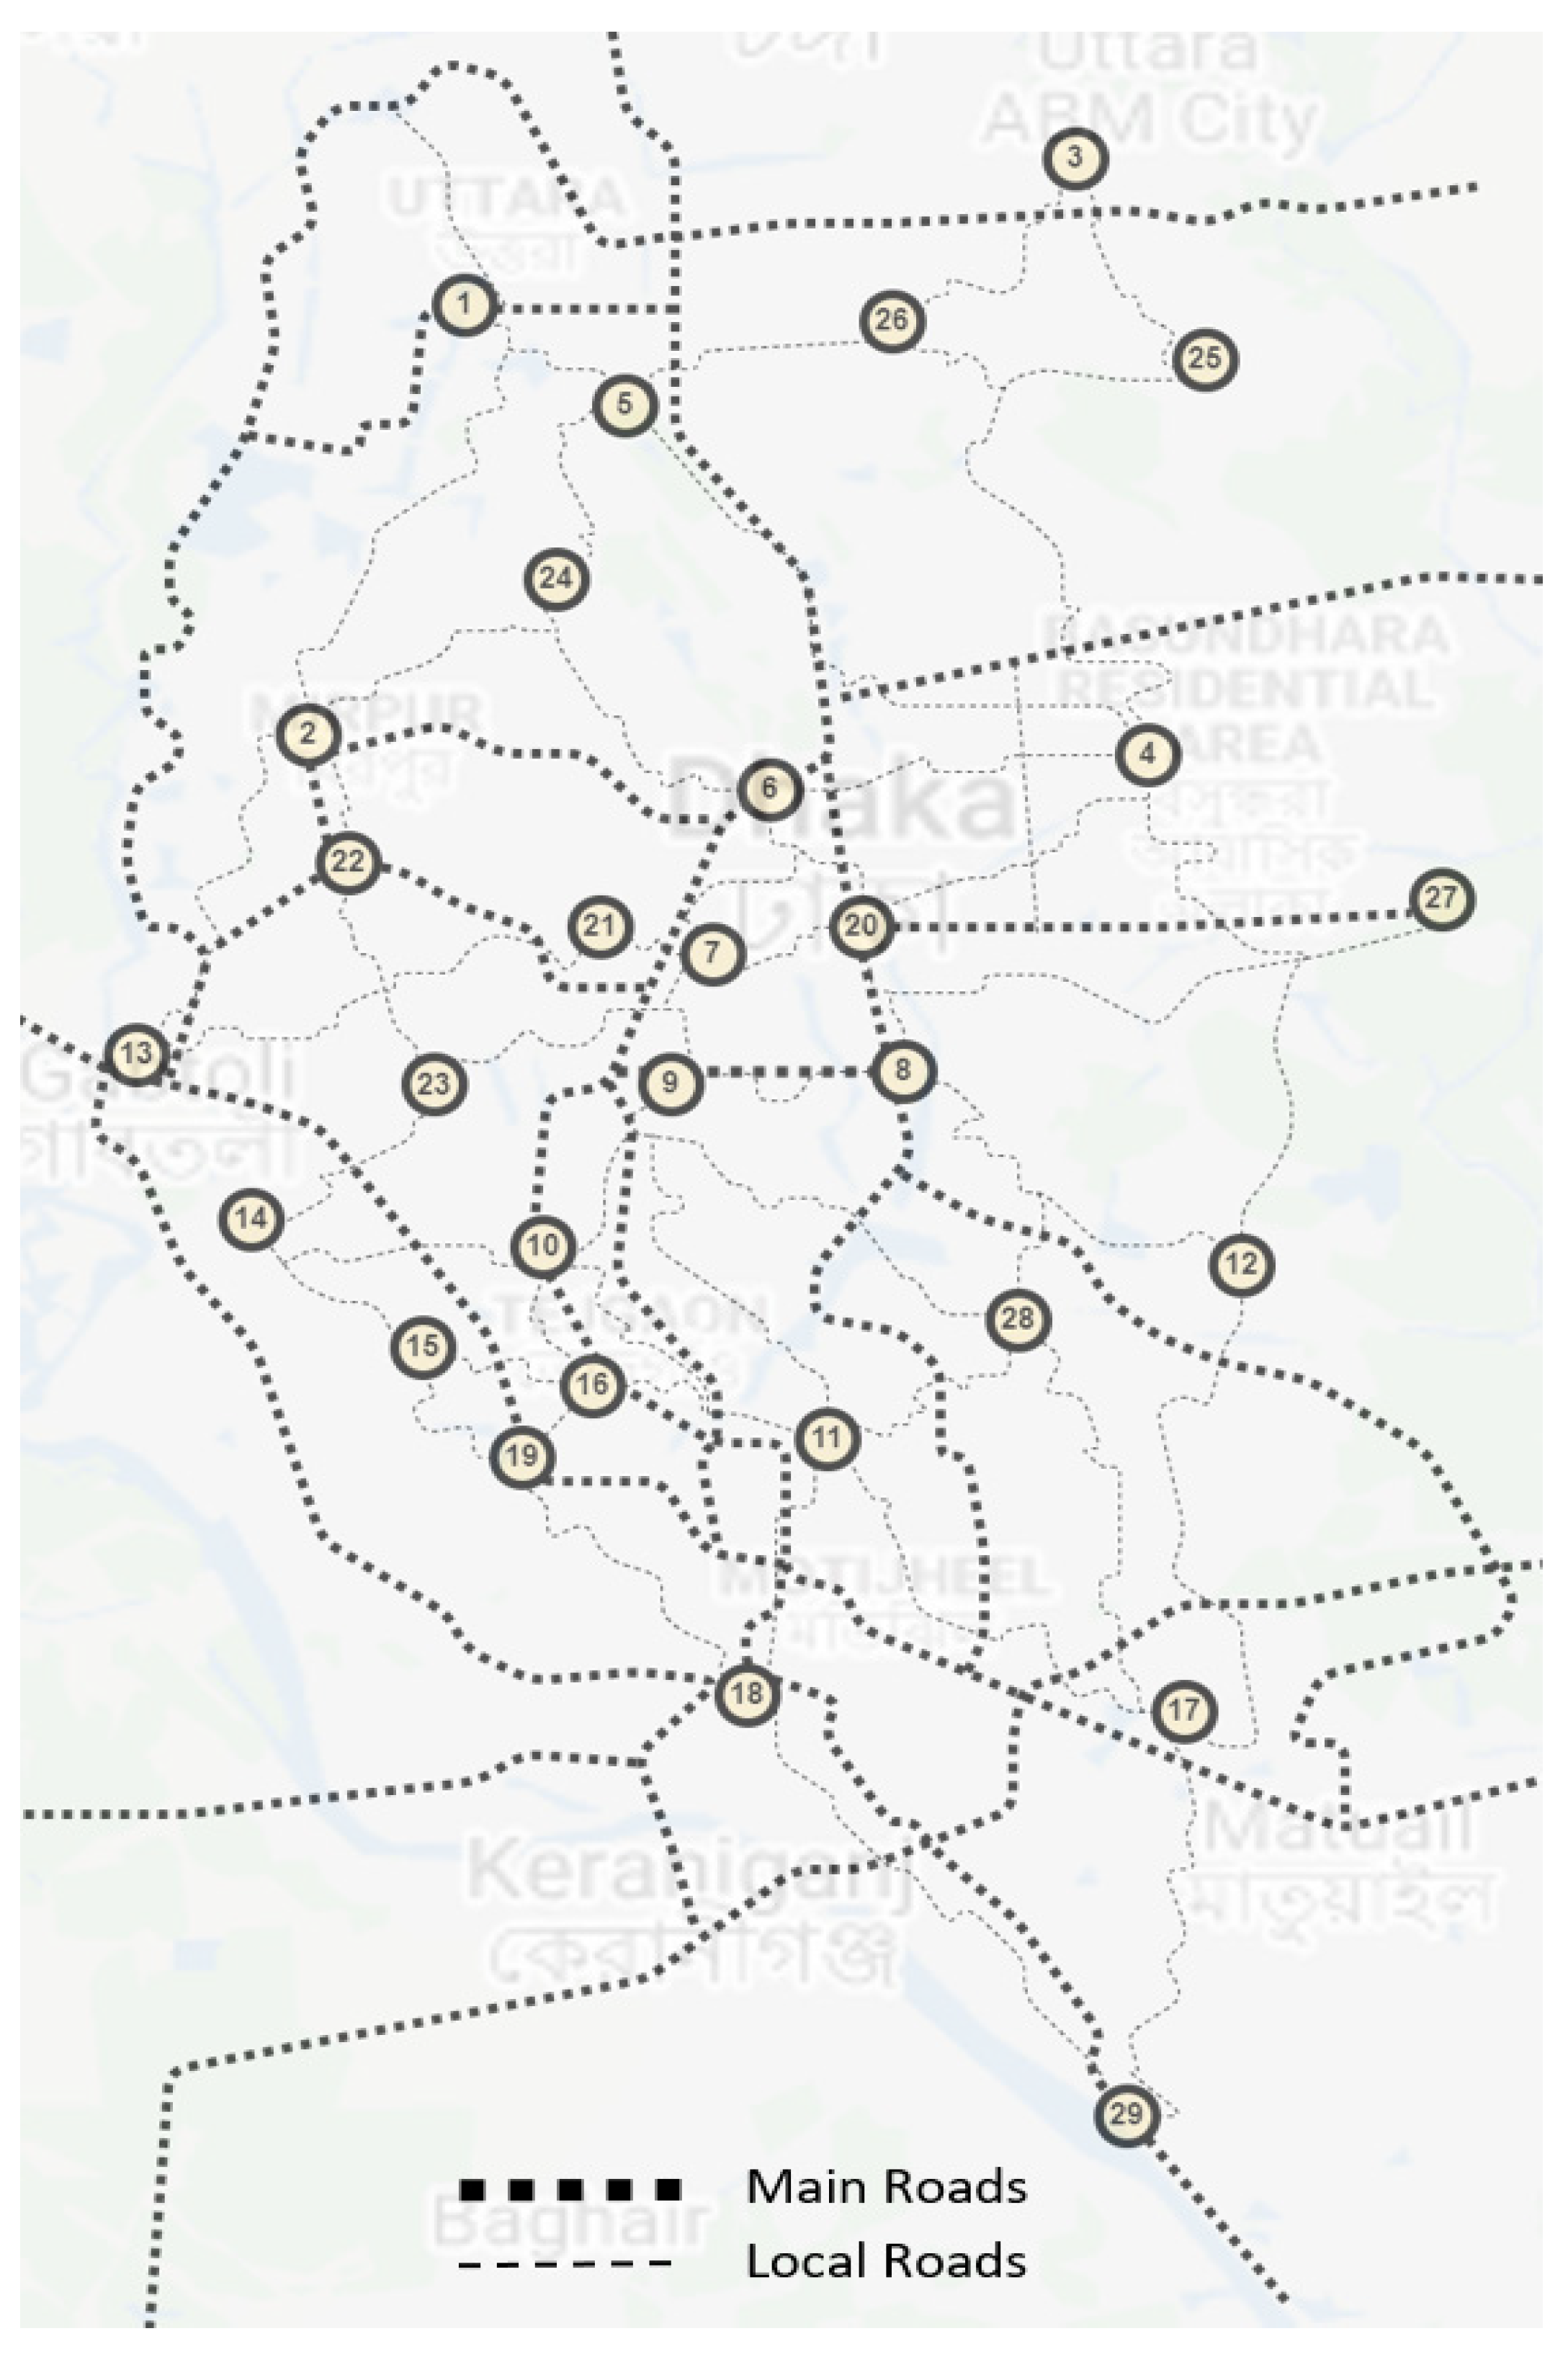
4.4. Test Case 2: BLN Design for Entire Dhaka City
4.4.1. BLN Design Solution for the Entire Dhaka City Area
4.4.2. Effectiveness Measure of eBLN in the Entire Dhaka City Area
4.5. Environmental Impacts of a BLN on Dhaka City
5. Discussion
6. Conclusions
Author Contributions
Funding
Institutional Review Board Statement
Informed Consent Statement
Acknowledgments
Conflicts of Interest
References
- Merriman, P. Mobility; Elsevier: Amsterdam, The Netherlands, 2009; pp. 134–143. [Google Scholar] [CrossRef]
- Mohan, D. Road safety in less-motorized environments: Future concerns. Int. J. Epidemiol. 2002, 31, 527–532. [Google Scholar] [CrossRef]
- Schwedhelm, A.; Li, W.; Harms, L.; Adriazola-Steil, C. Biking Provides a Critical Lifeline During the Coronavirus Crisis. World Resour. Inst. 2020, 1–9. Available online: https://www.wri.org/insights/biking-provides-critical-lifeline-during-coronavirus-crisis (accessed on 17 April 2020).
- Abdelaal, M.R.M.A. Green Mobility as an Approach for Sustainable Urban Planning. Int. J. Innov. Res. Sci. Eng. Technol. 2015, 4, 6949–6959. [Google Scholar] [CrossRef]
- Harisankar, M.; Biju, C.A. Bicycles for Green Mobility in Urban Areas; CRC Press: Boca Raton, FL, USA, 2018; pp. 1043–1050. [Google Scholar] [CrossRef]
- International Society for Physical Activity and Health. Non communicable disease prevention: Investments that Work for Physical Activity. Br. J. Sports Med. 2012, 46, 709–712. [Google Scholar] [CrossRef] [PubMed]
- Harrabin, R. Coronavirus: Boom Time for Bikes as Virus Changes Lifestyles. BBC Online News, 7 May 2020. Available online: https://www.bbc.com/news/business-52564351 (accessed on 7 May 2020).
- Nikitas, A.; Tsigdinos, S.; Karolemeas, C.; Kourmpa, E.; Bakogiannis, E. Cycling in the Era of COVID-19: Lessons Learnt and Best Practice Policy Recommendations for a More Bike-Centric Future. Sustainability 2021, 13, 4620. [Google Scholar] [CrossRef]
- Aeppel, T. Wary of Public Transport, Coronavirus-Hit Americans turn to Bikes. Reuters 2020. Available online: https://www.reuters.com/article/us-health-coronavirus-usa-bikes/wary-of-public-transport-coronavirus-hit-americans-turn-to-bikes-idUSKBN21Z1BX (accessed on 30 April 2021).
- Schweitzer, F.; Rosé, H.; Ebeling, W.; Weiss, O. Optimization of road networks using evolutionary strategies. Evol. Comput. 1997, 5, 419–438. [Google Scholar] [CrossRef] [PubMed]
- Akhand, M.A.H.; Shill, P.C.; Sabuj, M.S.; Afrin, Z.; Rahman, M.M.H. A PSO based transportation network design optimization of the mega city Dhaka. In Proceedings of the 2015 International Conference on Electrical Engineering and Information Communication Technology (ICEEICT), Savar, Bangladesh, 21–23 May 2015; IEEE: Piscataway, NJ, USA, 2015; pp. 1–7. [Google Scholar] [CrossRef]
- Babazadeh, A.; Poorzahedy, H.; Nikoosokhan, S. Application of particle swarm optimization to transportation network design problem. J. King Saud Univ. Sci. 2011, 23, 293–300. [Google Scholar] [CrossRef]
- Farahani, R.Z.; Miandoabchi, E.; Szeto, W.Y.; Rashidi, H. A review of urban transportation network design problems. Eur. J. Oper. Res. 2013, 229, 281–302. [Google Scholar] [CrossRef]
- Rahman, F.; Rashid, M.U. Walkers and Hawkers of Footpath: A Design Proposal for Hawkers of Farmgate Area, Dhaka. Int. J. Archit. Eng. Constr. 2020, 9, 1–11. [Google Scholar] [CrossRef]
- Vallverdú, J.; Castro, O.; Mayne, R.; Talanov, M.; Levin, M.; Baluška, F.; Gunji, Y.; Dussutour, A.; Zenil, H.; Adamatzky, A. Slime mould: The fundamental mechanisms of biological cognition. BioSystems 2018, 165, 57–70. [Google Scholar] [CrossRef]
- Ray, S.K.; Valentini, G.; Shah, P.; Haque, A.; Reid, C.R.; Weber, G.F.; Garnier, S. Information transfer during food choice in the slime mold Physarum polycephalum. Front. Ecol. Evol. 2019, 7, 1–11. [Google Scholar] [CrossRef]
- Alim, K.; Andrew, N.; Pringle, A.; Brenner, M.P. Mechanism of signal propagation in Physarum polycephalum. Proc. Natl. Acad. Sci. USA 2017, 114, 5136–5141. [Google Scholar] [CrossRef]
- Oettmeier, C.; Brix, K.; Döbereiner, H.-G. Physarum polycephalum—A new take on a classic model system. J. Phys. D Appl. Phys. 2017, 50, 413001. [Google Scholar] [CrossRef]
- Johannson, A.; Zou, J. A Slime Mold Solver for Linear Programming Problems. In How the World Computes; Springer: Berlin/Heidelberg, Germany, 2012; pp. 344–354. [Google Scholar] [CrossRef]
- Oettmeier, C. Slime mold on the rise: The physics of Physarum polycephalum. J. Phys. D Appl. Phys. 2020, 53, 310201. [Google Scholar] [CrossRef]
- Nakagaki, T.; Yamada, H.; Tóth, Á. Maze-solving by an amoeboid organism. Nature 2000, 407, 470. [Google Scholar] [CrossRef] [PubMed]
- Nakagaki, T.; Yamada, H.; Tóth, Á. Path finding by tube morphogenesis in an amoeboid organism. Biophys. Chem. 2001, 92, 47–52. [Google Scholar] [CrossRef]
- Tero, A.; Kobayashi, R.; Nakagaki, T. A mathematical model for adaptive transport network in path finding by true slime mold. J. Theor. Biol. 2007, 244, 553–564. [Google Scholar] [CrossRef]
- Tero, A.; Yumiki, K.; Kobayashi, R.; Saigusa, T.; Nakagaki, T. Flow-network adaptation in Physarum amoebae. Theory Biosci. 2008, 127, 89–94. [Google Scholar] [CrossRef] [PubMed]
- Reid, C.R.; Latty, T.; Dussutour, A.; Beekman, M. Slime mold uses an externalized spatial ‘memory’ to navigate in complex environments. Proc. Natl. Acad. Sci. USA 2012, 109, 17490–17494. [Google Scholar] [CrossRef]
- Aono, M.; Zhu, L.; Hara, M. Amoeba-based neurocomputing for 8-city traveling salesman problem. Int. J. Unconv. Comput. 2011, 7, 463–480. [Google Scholar]
- Jones, J.; Adamatzky, A. Computation of the travelling salesman problem by a shrinking blob. Nat. Comput. 2014, 13, 1–16. [Google Scholar] [CrossRef]
- Whiting, J.G.H.; Costello, B.P.J.d.; Adamatzky, A. Slime mould logic gates based on frequency changes of electrical potential oscillation. Biosystems 2014, 124, 21–25. [Google Scholar] [CrossRef]
- Adamatzky, A.; Schubert, T. Slime mold microfluidic logical gates. Mater. Today 2014, 17, 86–91. [Google Scholar] [CrossRef]
- Tsuda, S.; Aono, M.; Gunji, Y.-P. Robust and emergent Physarum logical-computing. Biosystems 2004, 73, 45–55. [Google Scholar] [CrossRef]
- Tero, A.; Takagi, S.; Saigusa, T.; Ito, K.; Bebber, D.P.; Fricker, M.D.; Yumiki, K.; Kobayashi, R.; Nakagaki, T. Rules for Biologically Inspired Adaptive Network Design. Science 2010, 327, 439–442. [Google Scholar] [CrossRef]
- Adamatzky, A.; Alonso-Sanz, R. Rebuilding Iberian motorways with slime mould. BioSystems 2011, 105, 89–100. [Google Scholar] [CrossRef]
- Adamatzky, A.; Martínez, G.J.; Chapa-Vergara, S.V.; Asomoza-Palacio, R.; Stephens, C.R. Approximating Mexican highways with slime mould. Nat. Comput. 2011, 10, 1195–1214. [Google Scholar] [CrossRef][Green Version]
- Adamatzky, A. The World’s Colonization and Trade Routes Formation as Imitated by Slime Mould. Int. J. Bifurc. Chaos 2012, 22, 1230028. [Google Scholar] [CrossRef]
- Becker, M. Design of fault tolerant networks with agent-based simulation of Physarum polycephalum. In Proceedings of the 2011 IEEE Congress of Evolutionary Computation (CEC), New Orleans, LA, USA, 5–8 June 2011; IEEE: Piscataway, NJ, USA, 2011; pp. 285–291. [Google Scholar] [CrossRef]
- Adamatzky, A.; Yang, X.-S.; Zhao, Y.-X. Slime mould imitates transport networks in China. Int. J. Intell. Comput. Cybern. 2013, 6, 232–251. [Google Scholar] [CrossRef]
- Gao, C.; Lan, X.; Zhang, X.; Deng, Y. A Bio-Inspired Methodology of Identifying Influential Nodes in Complex Networks. PLoS ONE 2013, 8, e66732. [Google Scholar] [CrossRef] [PubMed]
- Zhang, X.; Zhang, Y.; Zhang, Z.; Mahadevan, S.; Adamatzky, A.; Deng, Y. Rapid Physarum Algorithm for shortest path problem. Appl. Soft Comput. 2014, 23, 19–26. [Google Scholar] [CrossRef]
- Zhang, X.; Adamatzky, A.; Chan, F.T.S.; Deng, Y.; Yang, H.; Yang, X.S.; Tsompanas, M.A.I.; Sirakoulis, G.C.; Mahadevan, S. A biologically inspired network design model. Sci. Rep. 2015, 5, 1–14. [Google Scholar] [CrossRef] [PubMed]
- Gao, C.; Zhang, X.; Yue, Z.; Wei, D. An Accelerated Physarum Solver for Network Optimization. IEEE Trans. Cybern. 2020, 50, 765–776. [Google Scholar] [CrossRef] [PubMed]
- Ahmed, S.; Nahiduzzaman, K.M.; Hasan, M.M.U. Dhaka, Bangladesh: Unpacking challenges and reflecting on unjust transitions. Cities 2018, 77, 142–157. [Google Scholar] [CrossRef]
- Haider, A.A. Traffic jam: The ugly side of Dhaka’s development. The Daily Star, 13 May 2018. Available online: https://www.thedailystar.net/opinion/society/traffic-jam-the-ugly-side-dhakas-development-1575355 (accessed on 19 July 2021).
- Bangladesh Sangbad Sangstha, Dhaka. Traffic Jam in Dhaka Eats up 3.2 m Working Hrs Everyday: WB. The Daily Star, 19 July 2017. Available online: https://www.thedailystar.net/city/dhaka-traffic-jam-congestion-eats-32-million-working-hours-everyday-world-bank-1435630 (accessed on 17 March 2017).
- Rissel, C. Health Benefits of Cycling; University of Adelaide Press: Adelaide, Australia, 2015; pp. 43–62. [Google Scholar] [CrossRef]
- Oja, P.; Titze, S.; Bauman, A.; de Geus, B.; Krenn, P.; Reger-Nash, B.; Kohlberger, T. Health benefits of cycling: A systematic review. Scand. J. Med. Sci. Sports 2011, 21, 496–509. [Google Scholar] [CrossRef]
- Boufous, S.; Hatfield, J.; Grzebieta, R. The impact of environmental factors on cycling speed on shared paths. Accid. Anal. Prev. 2018, 110, 171–176. [Google Scholar] [CrossRef] [PubMed]
- Schleinitz, K.; Petzoldt, T.; Franke-Bartholdt, L.; Krems, J.; Gehlert, T. The German Naturalistic Cycling Study—Comparing cycling speed of riders of different e-bikes and conventional bicycles. Saf. Sci. 2017, 92, 290–297. [Google Scholar] [CrossRef]
- Sun, Y. Physarum-inspired Network Optimization: A Review. arXiv 2017, arXiv:1712.02910. [Google Scholar]


| Sl | Location | Traffic Pressure | Sl | Location | Traffic Pressure |
|---|---|---|---|---|---|
| 01 | Motijheel | 9 | 16 | Kotwali | 3 |
| 02 | Mohakhali | 8 | 17 | Lalbagh | 4 |
| 03 | Gulshan | 5 | 18 | Khilgaon | 6 |
| 04 | Shahinbag | 8 | 19 | Taltola | 3 |
| 05 | Tejgaon | 9 | 20 | Aftabnagar | 4 |
| 06 | Badda | 4 | 21 | Sadarghat | 5 |
| 07 | East West Unv. | 5 | 22 | Matuail | 8 |
| 08 | Bashundhara | 5 | 23 | Wari | 7 |
| 09 | Mogbazar | 5 | 24 | Golapbag | 5 |
| 10 | Mirbag | 5 | 25 | Donia | 3 |
| 11 | Dhanmondi | 7 | 26 | Rajarbagh | 5 |
| 12 | Shahbag | 9 | 27 | Sobujbagh | 5 |
| 13 | Unv. of Dhaka | 9 | 28 | Green Model Town | 4 |
| 14 | Kamlapur | 8 | 29 | Nandipara | 6 |
| 15 | Ramna | 5 |
| Destination Node Point | Optimal Routes | Distance (km) | Estimated Travel Time (min) |
|---|---|---|---|
| 2 | 1-9-10-2 | 8.6 | 30.7 |
| 3 | 1-9-10-2-3 | 9.8 | 34.4 |
| 4 | 1-9-4 | 8.3 | 29.9 |
| 5 | 1-5 | 7.5 | 27.5 |
| 6 | 1-9-10-7-6 | 8.2 | 29.6 |
| 7 | 1-9-10-7 | 6.9 | 25.7 |
| 8 | 1-8 | 7.6 | 27.7 |
| 9 | 1-9 | 3.9 | 16.7 |
| 10 | 1-9-10 | 5.4 | 18.2 |
| 11 | 1-12-11 | 7.6 | 33.5 |
| 12 | 1-12 | 5.3 | 20.9 |
| 13 | 1-12-13 | 6.2 | 23.6 |
| 14 | 1-14 | 4.4 | 18.2 |
| 15 | 1-15 | 4.1 | 17.2 |
| 16 | 1-23-16 | 4.5 | 18.5 |
| 17 | 1-23-16-17 | 8.1 | 29.3 |
| 18 | 1-29-18 | 7.8 | 28.4 |
| 19 | 1-19 | 4.1 | 17.3 |
| 20 | 1-20 | 6.2 | 23.6 |
| 21 | 1-23-21 | 5.5 | 21.5 |
| 22 | 1-23-21-25-22 | 10.3 | 35.9 |
| 23 | 1-23 | 3.6 | 10.8 |
| 24 | 1-23-24 | 7.2 | 26.5 |
| 25 | 1-23-21-25 | 8.1 | 29.3 |
| 26 | 1-26 | 4.9 | 19.7 |
| 27 | 1-26-27 | 6.3 | 23.9 |
| 28 | 1-14-28 | 7.9 | 28.7 |
| 29 | 1-29 | 5.2 | 23.3 |
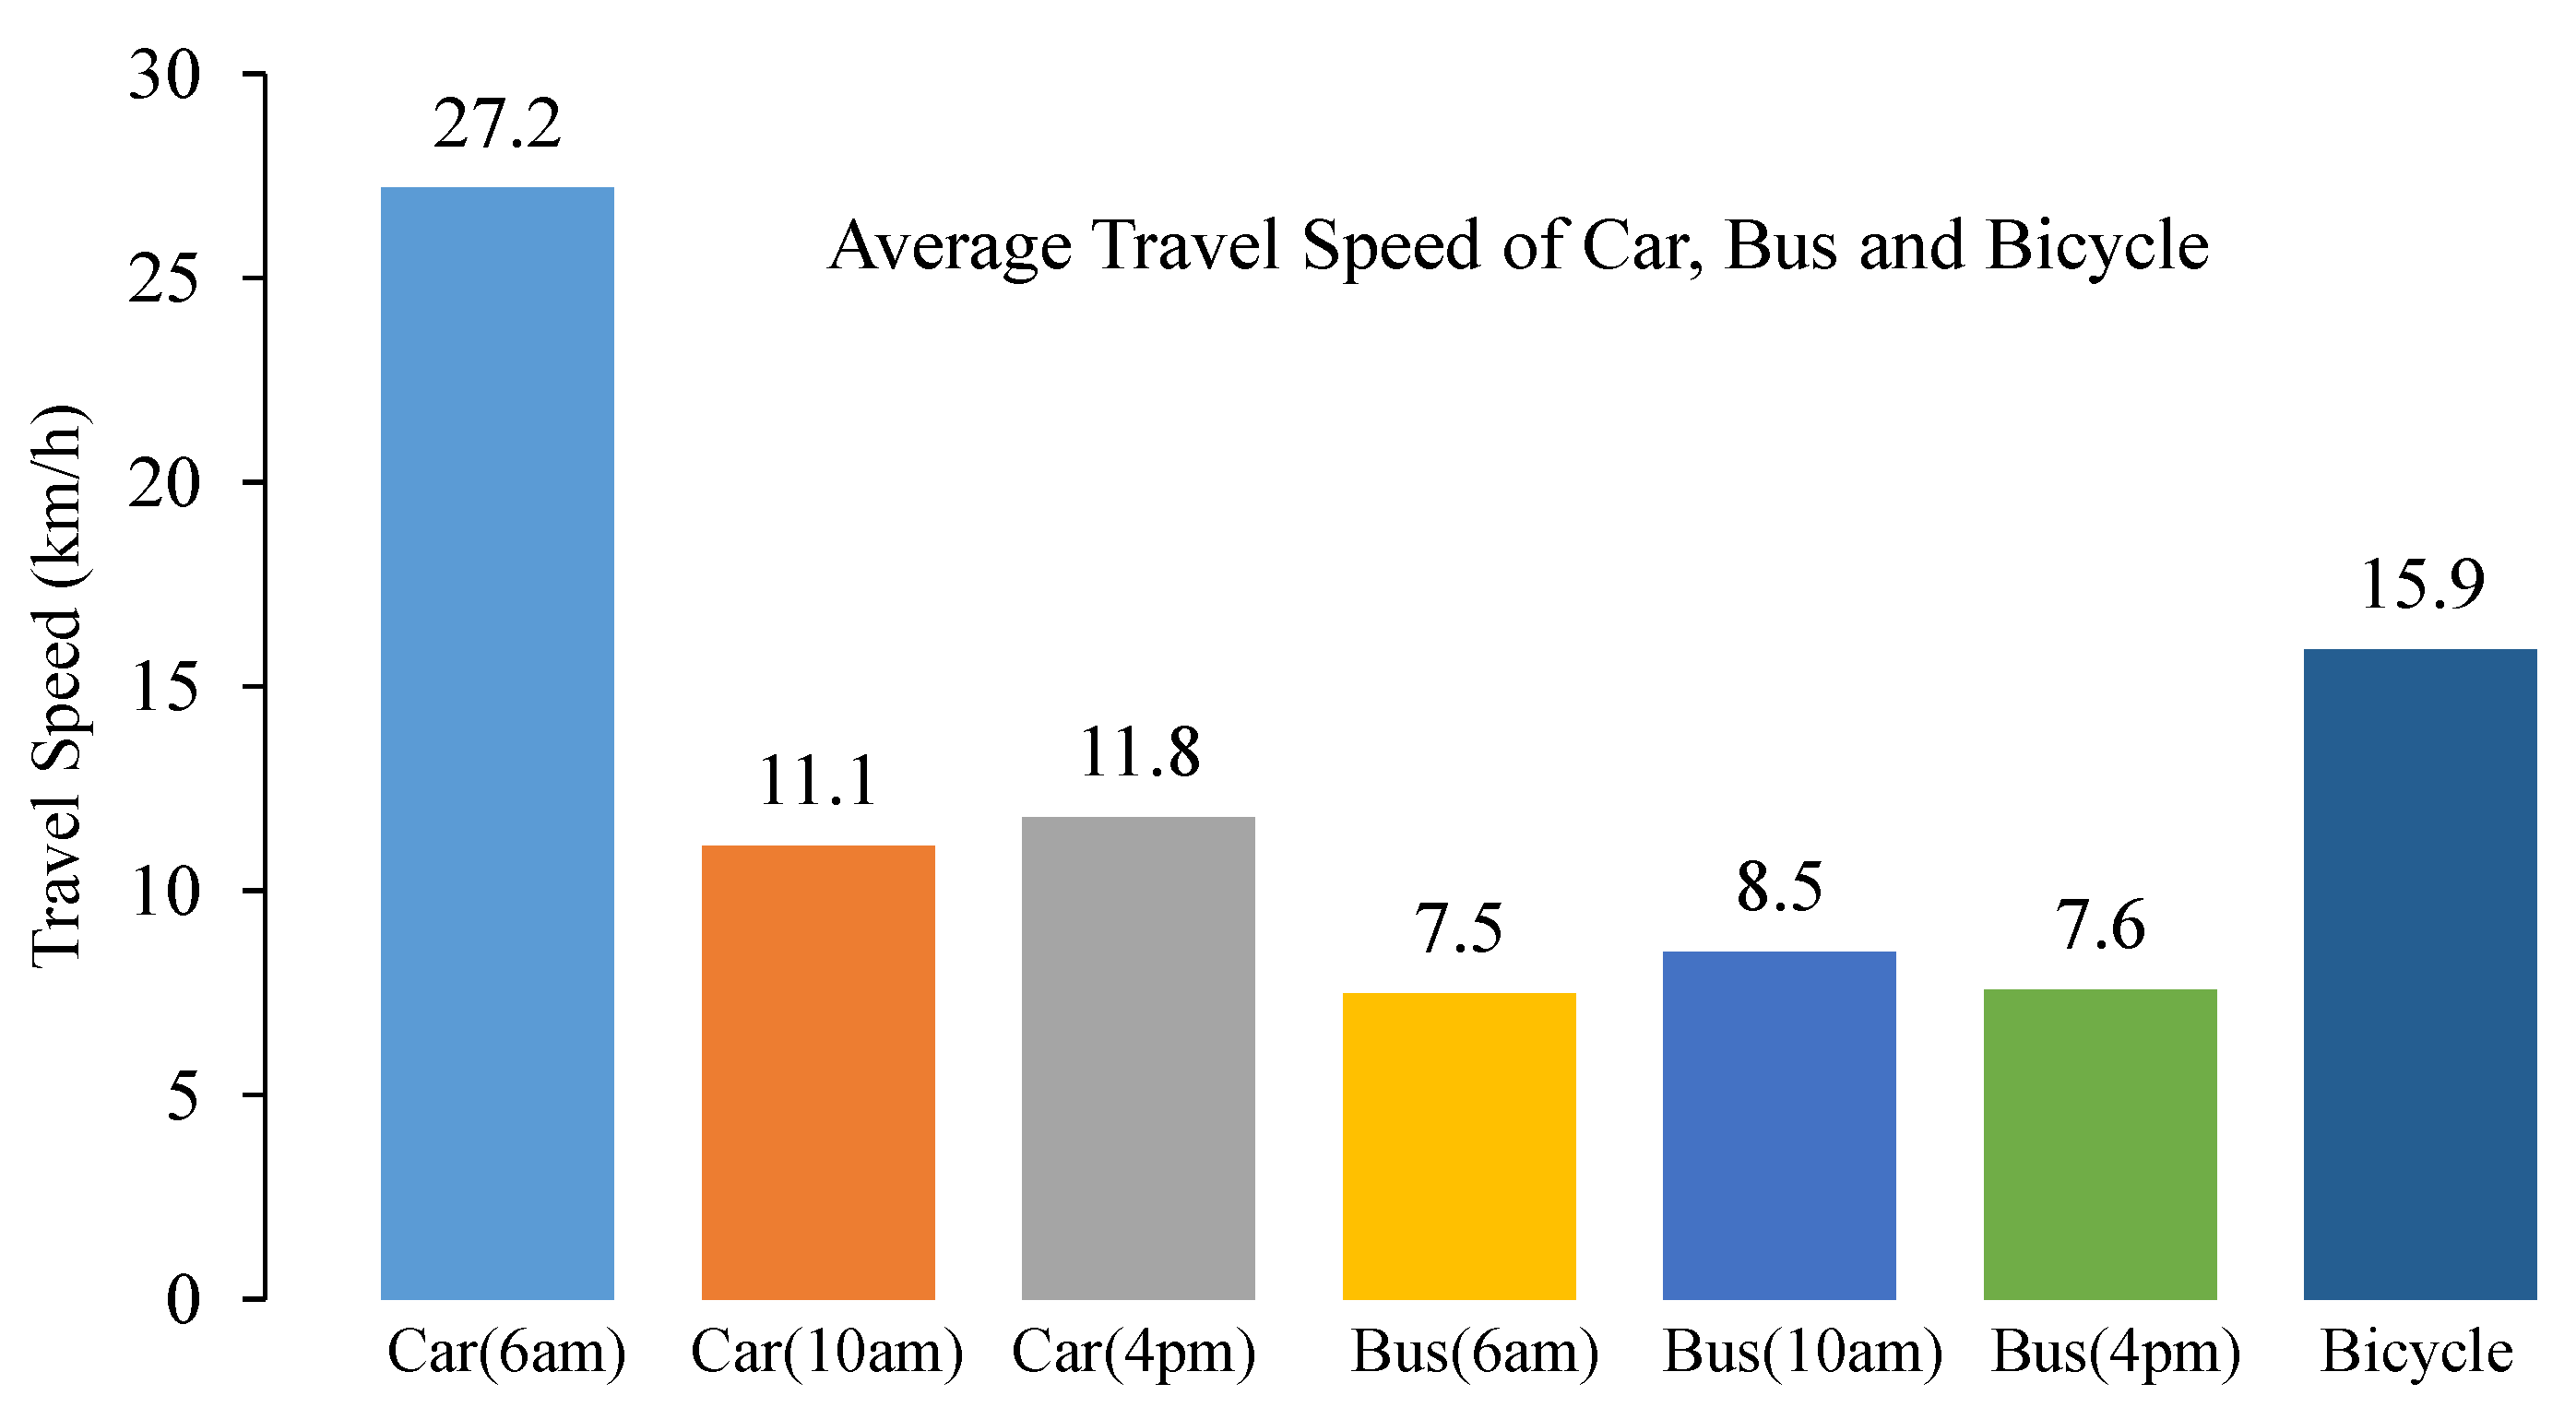
| Destination Node Point | Distance Using Motor Vehicle (km) | Time Required by Car, Taxicab or Motorbike (min) | Time Required by Bus | Travel by Bicycle through Proposed BLN | |||||
|---|---|---|---|---|---|---|---|---|---|
| 6 a.m. | 10 a.m. | 4 p.m. | 6 a.m. | 10 a.m. | 4 p.m. | Distance (km) | Time (min) | ||
| 2 | 8.6 | 18 | 39 | 36 | 62 | 56 | 61 | 8.6 | 30.7 |
| 3 | 8.9 | 19 | 42 | 39 | 65 | 60 | 65 | 9.8 | 34.4 |
| 4 | 7.1 | 14 | 33 | 30 | 53 | 50 | 53 | 8.3 | 29.9 |
| 5 | 5.2 | 12 | 27 | 26 | 38 | 37 | 38 | 7.5 | 27.5 |
| 6 | 7.6 | 15 | 36 | 36 | 48 | 41 | 48 | 8.2 | 29.6 |
| 7 | 7.2 | 14 | 34 | 35 | 48 | 41 | 48 | 6.9 | 25.7 |
| 8 | 5.1 | 11 | 24 | 24 | 32 | 31 | 32 | 7.6 | 27.7 |
| 9 | 3.6 | 9 | 18 | 15 | 38 | 32 | 36 | 3.9 | 16.7 |
| 10 | 4.2 | 10 | 20 | 18 | 42 | 35 | 40 | 5.4 | 18.2 |
| 11 | 6.1 | 12 | 30 | 30 | 41 | 36 | 41 | 7.6 | 33.5 |
| 12 | 4.2 | 9 | 23 | 23 | 27 | 25 | 27 | 5.3 | 20.9 |
| 13 | 4.1 | 10 | 24 | 21 | 31 | 29 | 31 | 6.2 | 23.6 |
| 14 | 2.5 | 5 | 12 | 11 | 21 | 16 | 21 | 4.4 | 18.2 |
| 15 | 3.2 | 8 | 18 | 18 | 26 | 23 | 26 | 4.1 | 17.2 |
| 16 | 3.2 | 8 | 27 | 33 | 39 | 34 | 37 | 4.5 | 18.5 |
| 17 | 6.4 | 13 | 33 | 30 | 52 | 47 | 52 | 8.1 | 29.3 |
| 18 | 7.2 | 14 | 53 | 48 | 82 | 74 | 82 | 7.8 | 28.4 |
| 19 | 3.0 | 8 | 21 | 18 | 43 | 37 | 42 | 4.1 | 17.3 |
| 20 | 11.0 | 24 | 42 | 38 | 64 | 56 | 64 | 6.2 | 23.6 |
| 21 | 3.9 | 9 | 36 | 36 | 40 | 35 | 38 | 5.5 | 21.5 |
| 22 | 8.3 | 18 | 33 | 30 | 61 | 56 | 61 | 10.3 | 35.9 |
| 23 | 2.5 | 6 | 21 | 21 | 30 | 25 | 30 | 3.6 | 10.8 |
| 24 | 5.1 | 12 | 28 | 27 | 47 | 39 | 44 | 7.2 | 26.5 |
| 25 | 5.7 | 13 | 29 | 27 | 48 | 42 | 47 | 8.1 | 29.3 |
| 26 | 4.7 | 11 | 29 | 29 | - | - | - | 4.9 | 19.7 |
| 27 | 6.4 | 15 | 34 | 32 | 33 | 27 | 32 | 6.3 | 23.9 |
| 28 | 5.8 | 12 | 42 | 39 | - | - | - | 7.9 | 28.7 |
| 29 | 5.4 | 12 | 33 | 33 | 72 | 63 | 71 | 5.2 | 23.3 |
| Sum | 156.2 | 341 | 841 | 803 | 1183 | 1047 | 1167 | 183.3 | 690.3 |
| Sl | Location | Traffic Pressure | Sl | Location | Traffic Pressure |
|---|---|---|---|---|---|
| 01 | Uttara | 10 | 16 | Shahbag | 3 |
| 02 | Mirpur | 8 | 17 | Matuail | 4 |
| 03 | Uttara ABM City | 5 | 18 | Kotwali/Sadarghat | 6 |
| 04 | Bashundhara R/A | 8 | 19 | New Market | 2 |
| 05 | Khilkhet | 5 | 20 | Baridhara | 4 |
| 06 | Cantonment | 4 | 21 | Banani | 5 |
| 07 | Gulshan | 5 | 22 | Monipur | 8 |
| 08 | Badda | 5 | 23 | Sher-E-Bangla Nagar | 7 |
| 09 | Mohakhali | 5 | 24 | Airport | 5 |
| 10 | Tejgaon | 5 | 25 | Poradia | 2 |
| 11 | Motijheel | 7 | 26 | Madarbari | 3 |
| 12 | Khilgaon | 9 | 27 | Beraid | 5 |
| 13 | Gabtoli | 6 | 28 | NutanPara | 4 |
| 14 | Mohammadpur | 10 | 29 | Pagla Rail station | 6 |
| 15 | Dhanmondi | 5 |
| Destination Node Point | Optimal Routes | Distance (km) | Estimated Travel Time (min) |
|---|---|---|---|
| 1 | 7-6-24-5-1 | 15.7 | 36.3 |
| 2 | 7-21-22-2 | 9.9 | 24.8 |
| 3 | 7-20-4-25-3 | 21.8 | 48.6 |
| 4 | 7-20-4 | 9.0 | 23.0 |
| 5 | 7-6-24-5 | 11.9 | 28.8 |
| 6 | 7-6 | 4.0 | 7.9 |
| 8 | 7-20-8 | 3.2 | 6.3 |
| 9 | 7-9 | 2.2 | 9.3 |
| 10 | 7-9-10 | 6.0 | 17.0 |
| 11 | 7-9-11 | 10.6 | 26.2 |
| 12 | 7-20-8-12 | 9.0 | 18.1 |
| 13 | 7-21-13 | 9.4 | 23.9 |
| 14 | 7-23-14 | 7.3 | 19.6 |
| 15 | 7-9-10-15 | 11.6 | 28.1 |
| 16 | 7-9-10-16 | 10.7 | 26.4 |
| 17 | 7-9-11-17 | 15.6 | 36.2 |
| 18 | 7-9-11-18 | 14.8 | 34.6 |
| 19 | 7-9-10-16-19 | 11.9 | 24.7 |
| 20 | 7-20 | 2.1 | 4.2 |
| 21 | 7-21 | 1.8 | 8.5 |
| 22 | 7-21-22 | 7.3 | 19.7 |
| 23 | 7-23 | 4.1 | 13.1 |
| 24 | 7-6-24 | 8.6 | 22.1 |
| 25 | 7-20-4-25 | 18.7 | 42.4 |
| 26 | 7-6-24-5-26 | 15.5 | 36.0 |
| 27 | 7-20-27 | 11.2 | 22.4 |
| 28 | 7-9-28 | 9.4 | 23.8 |
| 29 | 7-9-11-18-29 | 22.0 | 49.0 |
| Destination Node Point | Distance Using Motor Vehicle (km) | Time Required by Car, Taxicab or Motorbike (min) | Time Required by Bus | Travel by eBike through Proposed eBLN | |||||
|---|---|---|---|---|---|---|---|---|---|
| 6 a.m. | 10 a.m. | 4 p.m. | 6 a.m. | 10 a.m. | 4 p.m. | Distance (km) | Time (min) | ||
| 1 | 14.0 | 24 | 42 | 45 | 79 | 74 | 78 | 15.7 | 36.3 |
| 2 | 7.5 | 16 | 33 | 36 | 52 | 47 | 52 | 9.9 | 24.8 |
| 3 | 18.2 | 40 | 75 | 75 | - | - | - | 21.8 | 48.6 |
| 4 | 10.2 | 22 | 42 | 36 | - | - | - | 9.0 | 23.0 |
| 5 | 8.7 | 12 | 24 | 24 | 50 | 45 | 49 | 11.9 | 28.8 |
| 6 | 4.0 | 7 | 21 | 20 | 41 | 33 | 40 | 4.0 | 7.9 |
| 8 | 4.7 | 8 | 30 | 27 | 40 | 35 | 37 | 3.2 | 6.3 |
| 9 | 3.5 | 7 | 24 | 22 | 41 | 36 | 41 | 2.2 | 9.3 |
| 10 | 5.5 | 10 | 25 | 24 | 44 | 38 | 43 | 6.0 | 17.0 |
| 11 | 9.1 | 18 | 45 | 42 | 73 | 60 | 65 | 10.6 | 26.2 |
| 12 | 12.0 | 40 | 60 | 57 | 79 | 76 | 79 | 9.0 | 18.1 |
| 13 | 9.7 | 22 | 44 | 45 | 71 | 60 | 65 | 9.4 | 23.9 |
| 14 | 8.3 | 14 | 36 | 33 | 57 | 47 | 52 | 7.3 | 19.6 |
| 15 | 8.7 | 16 | 33 | 36 | 64 | 57 | 62 | 11.6 | 28.1 |
| 16 | 8.0 | 16 | 39 | 39 | 57 | 52 | 57 | 10.7 | 26.4 |
| 17 | 16.6 | 30 | 63 | 60 | 111 | 101 | 107 | 15.6 | 36.2 |
| 18 | 11.4 | 24 | 62 | 60 | 76 | 68 | 73 | 14.8 | 34.6 |
| 19 | 8.7 | 18 | 42 | 42 | 62 | 55 | 60 | 11.9 | 24.7 |
| 20 | 2.2 | 5 | 12 | 11 | 28 | 26 | 27 | 2.1 | 4.2 |
| 21 | 2.3 | 5 | 17 | 15 | - | - | - | 1.8 | 8.5 |
| 22 | 6.8 | 20 | 36 | 33 | 58 | 53 | 58 | 7.3 | 19.7 |
| 23 | 6.6 | 12 | 24 | 23 | 52 | 48 | 51 | 4.1 | 13.1 |
| 24 | 8.7 | 12 | 24 | 24 | 52 | 47 | 52 | 8.6 | 22.1 |
| 25 | 15.9 | 30 | 68 | 71 | - | - | - | 18.7 | 42.4 |
| 26 | 14.7 | 30 | 63 | 60 | - | - | - | 15.5 | 36.0 |
| 27 | 8.5 | 14 | 36 | 33 | - | - | - | 11.2 | 22.4 |
| 28 | 10.2 | 24 | 63 | 60 | 78 | 75 | 78 | 9.4 | 23.8 |
| 29 | 19.1 | 35 | 80 | 75 | 119 | 109 | - | 22.0 | 49.0 |
| Sum | 263.8 | 531 | 1163 | 1128 | 1384 | 1242 | 1226 | 285.2 | 681.3 |
Publisher’s Note: MDPI stays neutral with regard to jurisdictional claims in published maps and institutional affiliations. |
© 2021 by the authors. Licensee MDPI, Basel, Switzerland. This article is an open access article distributed under the terms and conditions of the Creative Commons Attribution (CC BY) license (https://creativecommons.org/licenses/by/4.0/).
Share and Cite
Akhand, M.A.H.; Habib, M.A.; Kamal, M.A.S.; Siddique, N. Physarum-Inspired Bicycle Lane Network Design in a Congested Megacity. Appl. Sci. 2021, 11, 6958. https://doi.org/10.3390/app11156958
Akhand MAH, Habib MA, Kamal MAS, Siddique N. Physarum-Inspired Bicycle Lane Network Design in a Congested Megacity. Applied Sciences. 2021; 11(15):6958. https://doi.org/10.3390/app11156958
Chicago/Turabian StyleAkhand, M. A. H., Md. Ahsan Habib, Md Abdus Samad Kamal, and Nazmul Siddique. 2021. "Physarum-Inspired Bicycle Lane Network Design in a Congested Megacity" Applied Sciences 11, no. 15: 6958. https://doi.org/10.3390/app11156958
APA StyleAkhand, M. A. H., Habib, M. A., Kamal, M. A. S., & Siddique, N. (2021). Physarum-Inspired Bicycle Lane Network Design in a Congested Megacity. Applied Sciences, 11(15), 6958. https://doi.org/10.3390/app11156958