Article

Effects of Pile Installation on Existing Tunnels Using Model Test and Numerical Analysis with Medium Density Sand

1
Future Infrastructure Research Center, Korea Institute of Civil Engineering and Building Technology, 283, Goyangdae-ro, Ilsanseo-gu, Goyang-si 10223, Korea
2
Department of Civil Engineering, Seoul National University of Science and Technology, 232 Gongneung-ro, Nowon-gu, Seoul 01811, Korea
*
Author to whom correspondence should be addressed.
Appl. Sci. 2021, 11(15), 6904; https://doi.org/10.3390/app11156904
Submission received: 18 June 2021 / Revised: 21 July 2021 / Accepted: 26 July 2021 / Published: 27 July 2021
(This article belongs to the Special Issue Advanced Numerical Simulations in Geotechnical Engineering)

Abstract

:
Vital underground structures such as sewers, power transmission lines, subways, and underpasses are potentially vulnerable to adverse effects from aboveground construction. In this study, the influence of pile installation on nearby existing tunnels was investigated. Both a laboratory model test and finite-element numerical analysis were conducted. Twelve different combinations of horizontal and vertical offsets between the pile and the tunnel were investigated. Different surcharge loads (allowable and ultimate) were also considered. In this way, the appropriate separation distance between the existing tunnel and the piles was established for sandy, medium-compaction soil. Although this study considers simple ground conditions, it facilitates safe construction by confirming the appropriate separation distance and comparing the areas that cannot be penetrated by the structures of each standard.

1. Introduction

Ground-space constraints in urban areas have led to the use of underground spaces for transportation, water supply, sewage, and power transmission. Extensive research has been conducted on how underground-space utilization and tunnel excavation affect structures already present aboveground. However, the converse question of how development aboveground affects existing underground structures has also recently begun to attract attention, in part because of the increased surface-level demolition and reconstruction of aging buildings.
Figure 1 illustrates the aging of the infrastructure in South Korea, where more than half of all public facilities were constructed before 1981 [1]. Private housing is also aging: of the 449,064 houses in Seoul in 2017, as many as 167,019 (i.e., 37.2%) are classified as old. When aboveground structures age and are reconstructed, the proximity of (often younger) underground facilities to the construction and demolition sites must be considered.
Several studies of the influence of surface construction on existing subterranean structures and the surrounding ground have been published. Yao et al. [2] used centrifuge tests to monitor the deformation of an existing tunnel lining due to pile loading; they found less deformation at larger pile–tunnel separation distances. They also found that an increase in the length of the pile had a significant influence on the lining, regardless of tunnel size and excavation depth.
Salim et al. [3] studied the effect on an existing concrete tunnel lining of concrete piles in sandy soil with relative densities of 50 and 70%. They confirmed that increases in the relative density and the tunnel–pile separation distance have significant influence on the tunnel lining.
Lueprasert et al. [4] numerically analyzed the deformation of a tunnel with a vertical pile–tunnel offset of 3.0 Dt (where Dt is the outer diameter of the tunnel) at the top of the tunnel, varying the horizontal offset from 0.5 to 4.5 m under soft-clay and stiff-clay soil conditions. They found that the positions of the pile tips and the stiffness of the ground layer are the main factors determining the deformation of the tunnel: when the horizontal pile–tunnel offset was 0.5 m, the deformation of the tunnel increased to −2.0 Dt in stiff clay and −4.0 Dt in soft clay. Several other studies on the mutual behavior of pile, tunnel, and ground have been reported, as research continues into safer construction in complex urban areas [5,6,7,8].
Numerical analysis is widely used in the research of tunnels and piles, because it can apply various conditions that cannot be otherwise applied in the field. Afsharhasani et al. [9] studied the effect of competent caliche layers on the capacity measurement of axially loaded drilled shafts using the Osterberg test. In this study, Osterberg test data were used to calibrate the numerical model using Plaxis, a finite element analysis software. Jeon et al. [10] studied the interactive behavior of a shielded TBM tunnel and a single pile by 3D finite element numerical analysis and observed that the behavior of the pile was significantly affected by the relative position of the tunnel and the pile.
Various countries and institutions have established standard safety zones for construction around tunnels (Table 1). The London Underground Limited (LUL) in the UK proposed a clearance of 3 m for bored piles and 15 m for driven piles installed around a tunnel. The Japanese Society of Soil Mechanics and Foundation Engineering has set a horizontal protection width of 0.5 m around tunnels, as well as a 5 m vertical safety zone [11]. In Korea, the Seoul Metropolitan Rapid Transit Corporation has designated 4–6 m from the outside of the tunnel as a non-construction zone and a distance of up to twice the tunnel diameter (2.0 D) as a zone where partial construction is possible, depending on adjacent structures, surcharge loads, and soil conditions [12]. As shown in Table 1, Busan City, Korea, established five zones during the construction of Busan Subway Line 1 (A: area that cannot be penetrated by structures; B: area in which only temporary equipment can be installed during construction; C: area in which soil-arresting work can be performed; D: area where three ground floors and one underground floor, or five or less underground floors, are allowed; E: no restriction). Table 1 summarizes the areas that cannot be penetrated by structures in each country.
In this study, the effect of pile installation, according to the offset, was studied using a model test and a numerical analysis. The results obtained were compared with domestic and foreign standards to determine whether the current standards are appropriate.

2. Laboratory Model Test

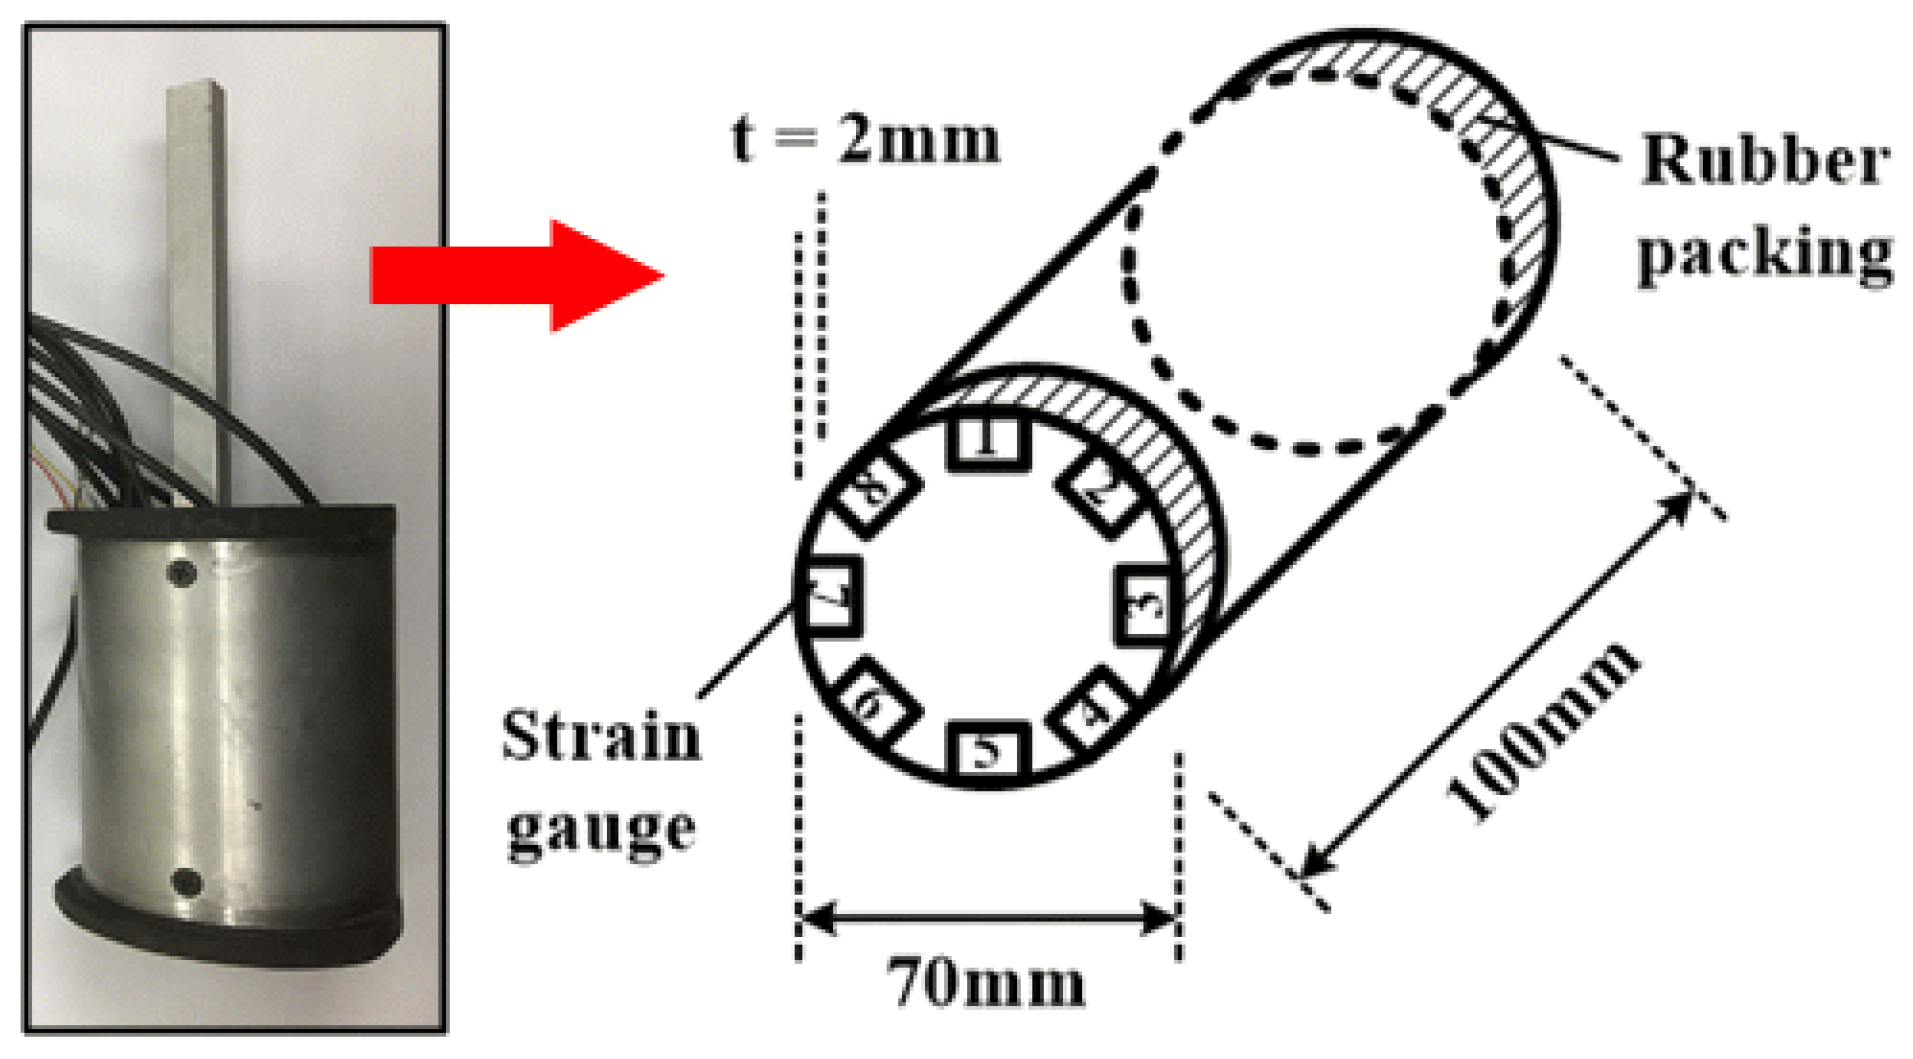
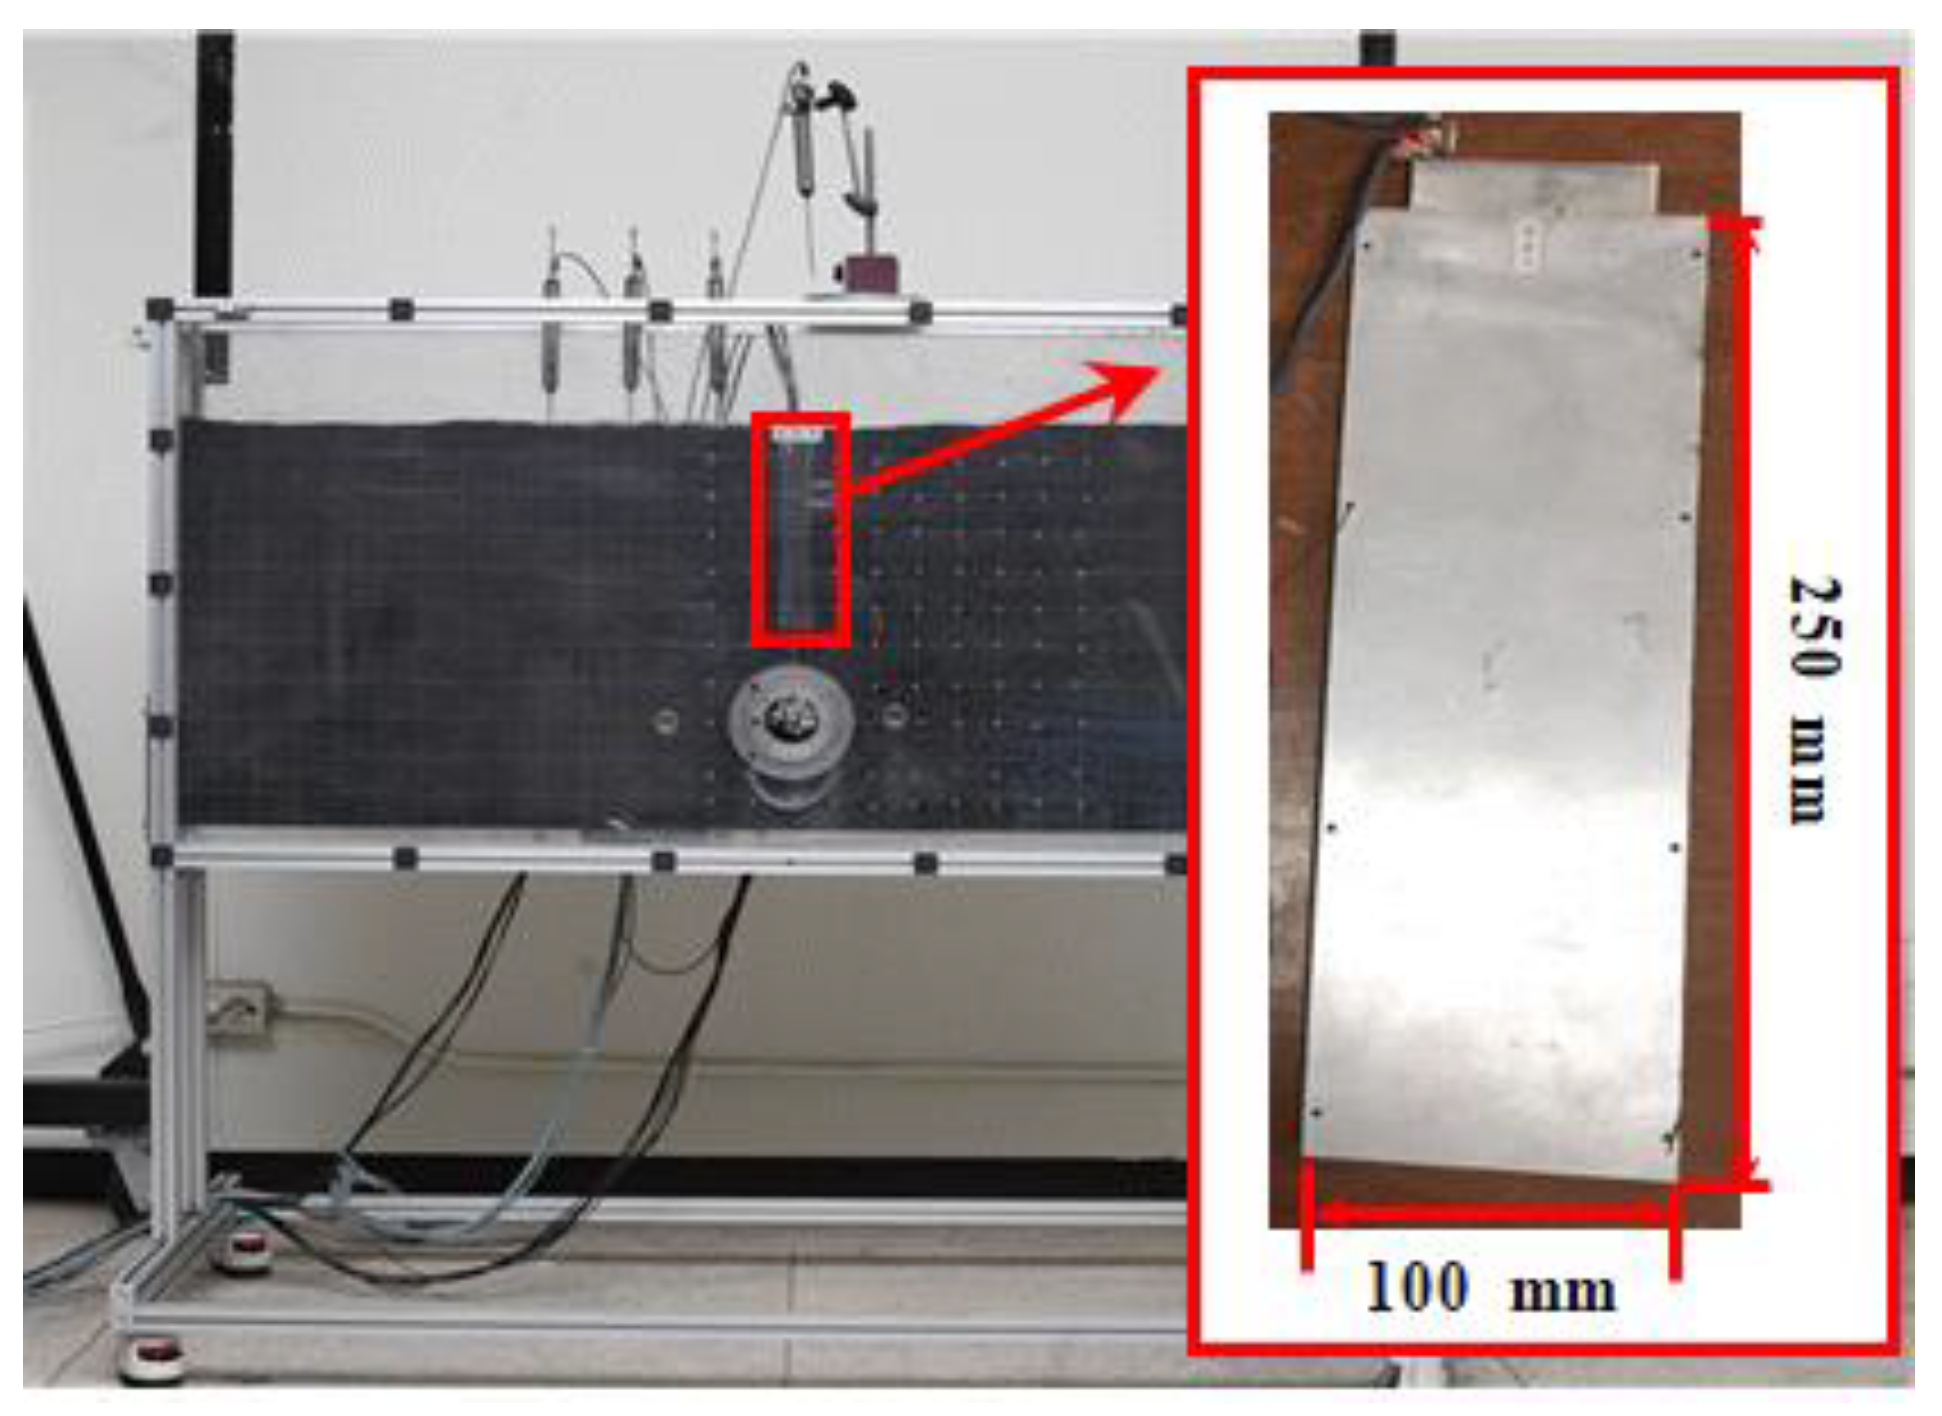
2.1. Model Test Equipment

The chamber used for the laboratory model test is shown in Figure 2. Its dimensions were 1500 mm × 100 mm × 700 mm (width × depth × height). It had an aluminum frame with front and rear acrylic plates. On the acrylic plates, 50 mm × 50 mm grids were engraved to allow the deformation of the prepared soil to be observed with the naked eye. A hole with a diameter of 100 mm was prepared at the center of the chamber for the installation of the model tunnel. The loading device could move to the left or right of the chamber. It could apply loading through a connection to a shallow foundation, a single pile, or grouped piles.
The literature contains several studies that used a sand-pouring device to generate uniform sandy soil in model chambers [13,14,15,16]. In this study, a 1500 mm × 100 mm (width × height) sand-pouring device was used (Figure 3 and Figure 4). The lever on the left side of the device was used to control the pouring of sand. The height of the device was adjusted with a hoist according to the height of the sand accumulated in the chamber so that the relative density of the sandy soil inside the chamber could be held constant.
The model tunnel (Figure 5) was fabricated using a 70 mm diameter aluminum cylinder. It corresponded to a 10 m tunnel at 1/150 scale. Owing to the conditions of the test, the stiffness of the tunnel support and lining according to the tunnel standard specifications [17] and tunnel design standards [18] could not be reflected in the model. The thickness of the aluminum model tunnel (2 mm) was chosen to withstand the weight of the sandy soil and the surcharge loads. Rubber was attached to both ends of the model tunnel to prevent the loss of sandy soil inside the chamber. Eight strain gauges were attached to the model tunnel in all directions to measure the deformation of the tunnel.
A pile made of aluminum was embedded in the sandy soil during the test. In general, a single steel pile has a size corresponding to approximately 1/10 of the tunnel size and has a diameter between 500 and 1200 mm. As shown in Figure 6, a single pile of size 7 mm × 100 mm × 250 mm (width × depth × height) was used in the test, and a 1/150 scale effect was applied. The load was increased using the loading device, and the behavior of the existing tunnel and surrounding ground under the influence of the pile was measured.

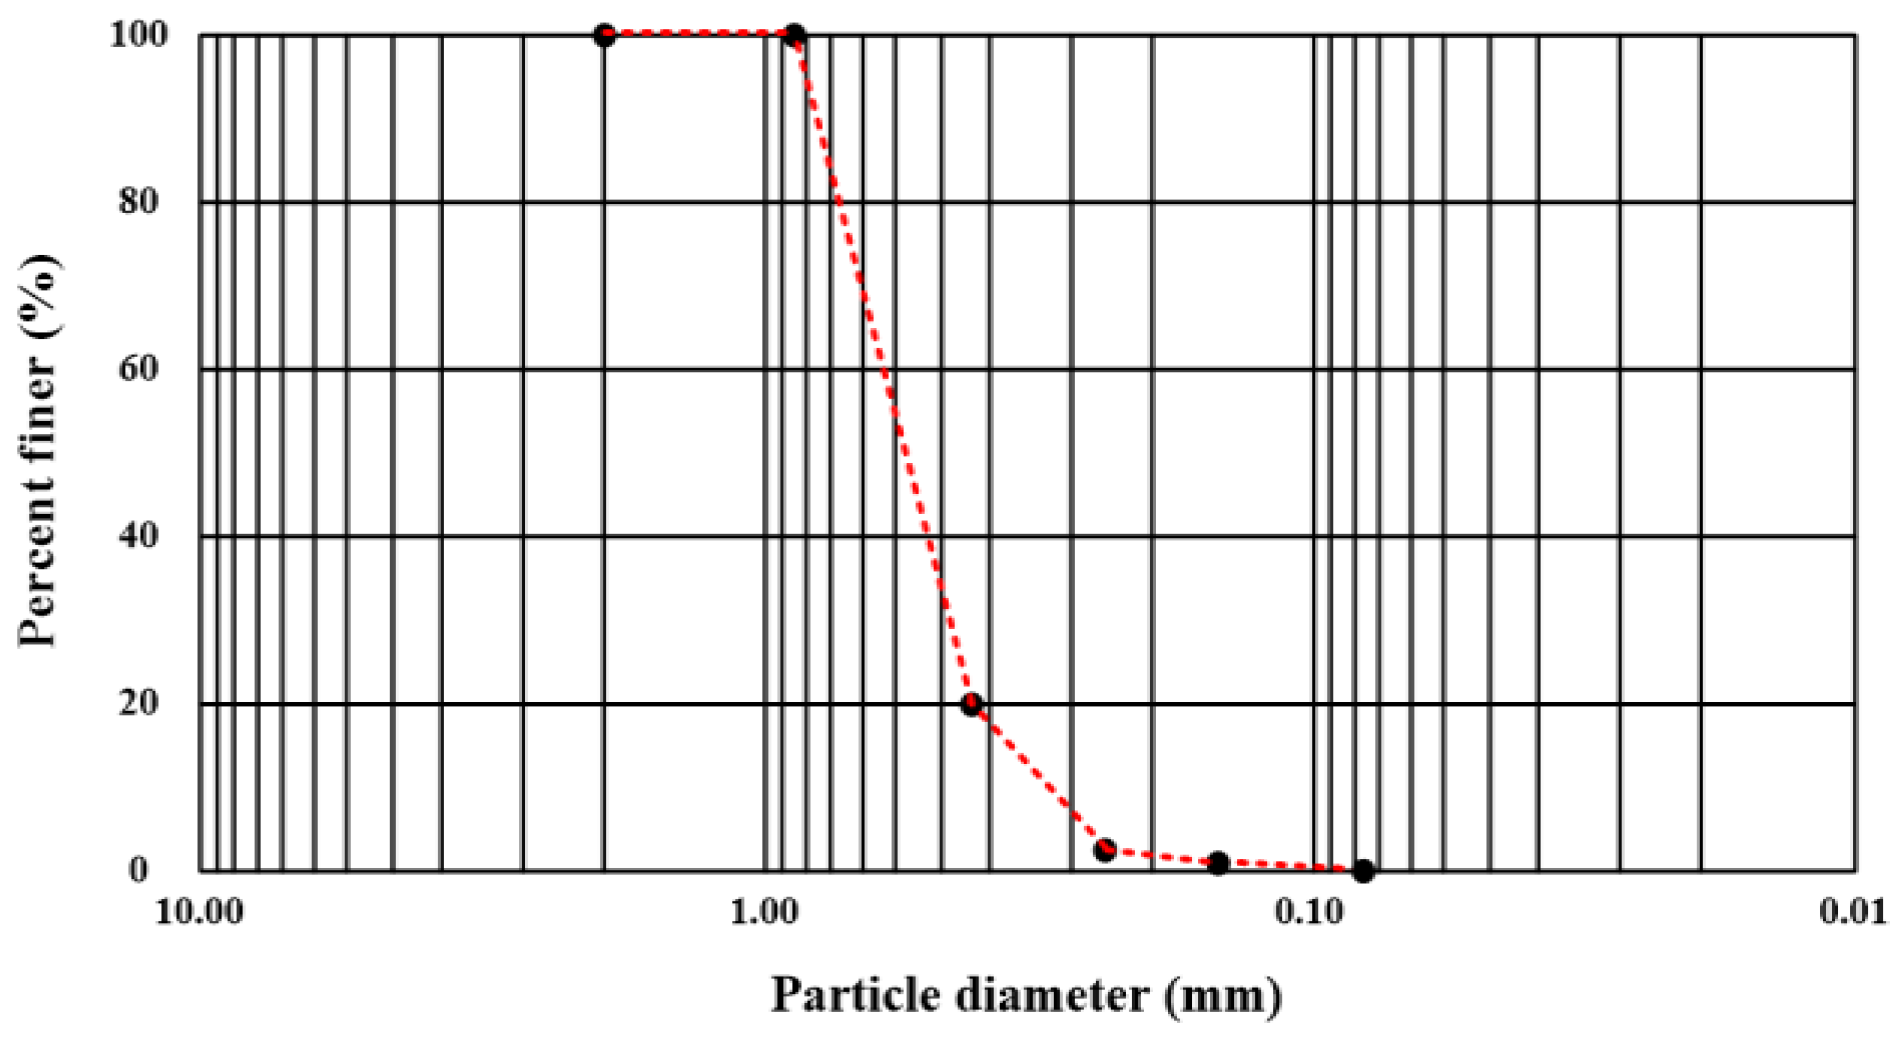
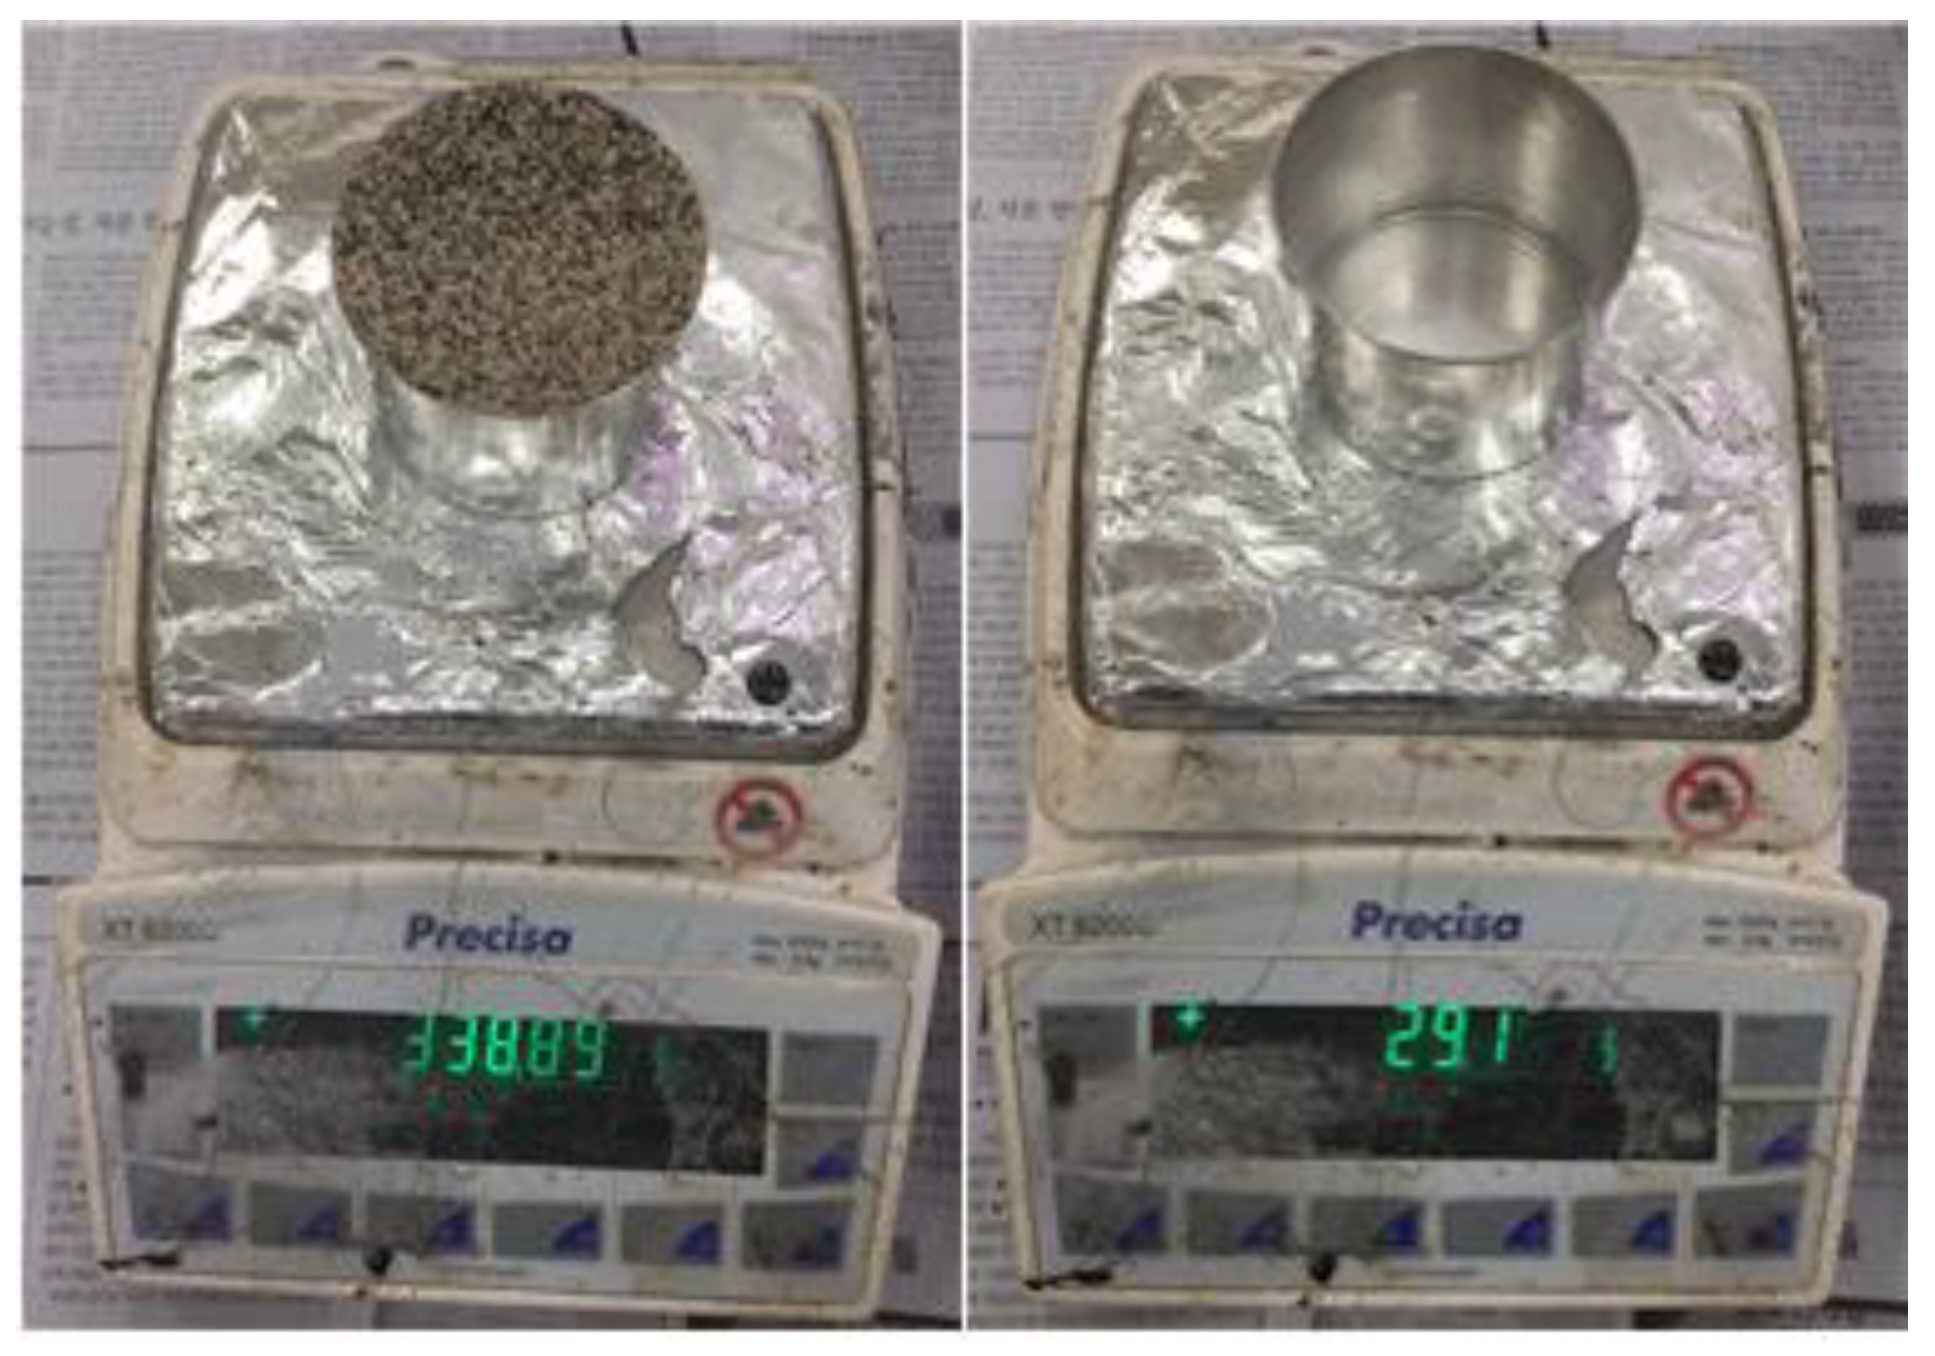
2.2. Pretest for the Laboratory Model Test

Joomunjin standard sand was used in this study to measure the relative density of sandy soil. Jumunjin sand is the standard sand used for research in Korea. Many experiments and continuous studies on material properties have been conducted using this sand. Hence, in this study, model tests were performed using this sand. The particle size distribution curve of the Joomunjin standard sand is shown in Figure 7. The particle size distribution of the sand was uniform. A uniformity coefficient (Cu) of 1.93 and a curvature coefficient (Cc) of 1.09 were observed, with grain-size distribution D10 = 0.331 mm, D30 = 0.480 mm, and D60 = 0.639 mm. The characteristics of the Joomunjin standard sand are as follows [19]:
It has a silicon dioxide (SiO2) content 4–8% higher than that of other sand.
It is made of quartz, but is whiter, harder, and more resistant to fire than quartzite.
It is a natural silica sand, smoother than that from other areas, and retains its original shape, making it suitable for use in filtration and molding.
It contains few impurities, and its transparency is much higher than that of silica sand from other areas.
Distinguishing between dense and loose sand is important for understanding sand behavior [20]. In general, the volume of loose sand decreases under shear force, whereas the volume of dense sand expands. In this study, uniform sandy soil was prepared during the laboratory model test using the sand pouring device, and the relative density of the soil was measured using a moisture-based technique: the unit dry weight was found using the volume of the moisture can and the measured weight of the sand (Figure 8), and the relative density was calculated by referring to the cyclic-triaxial-test measurements of Kim et al. [21] (Table 2). The relative density is
D r = e m a x e e m a x e m i n × 100 ( % ) = γ d m a x γ d × γ d γ d m i n γ d m a x γ d × 100 ( % ) ,
where e is the void ratio and γd is the unit dry weight.
The average relative density of sandy soil in this study was calculated to be 52.67% (Table 3). Cheon et al. [22] have classified soil conditions according to the relative density of sandy soil, as shown in Table 4. Based on their classification, the soil conditions in this study were determined to be medium. Since the relative density was close to the loose state under medium conditions, it was assumed that the soil would exhibit shrinkage. Numerical analysis was conducted based on the fully-non-associated-flow rule, which does not consider the dilatancy angle.
Eight strain gauges were calibrated and attached to the inside of the tunnel to investigate its behavioral characteristics. For tunnel calibration, the changing strain gauge values were measured with a data logger and a computer using the load control method (LCM), which directly applies a load to the tunnel. Load was applied to the crown of the tunnel, and the following equations were derived using the applied load and the strain gauge values. The eight equations were matched with the eight strain gauges, as shown in Figure 5. Figure 9 shows the calibration results obtained by converting the strain measured using each strain gauge into a force. A linear regression analysis was conducted as follows:
y = 132.14x − 0.619 (R2 = 0.9861),
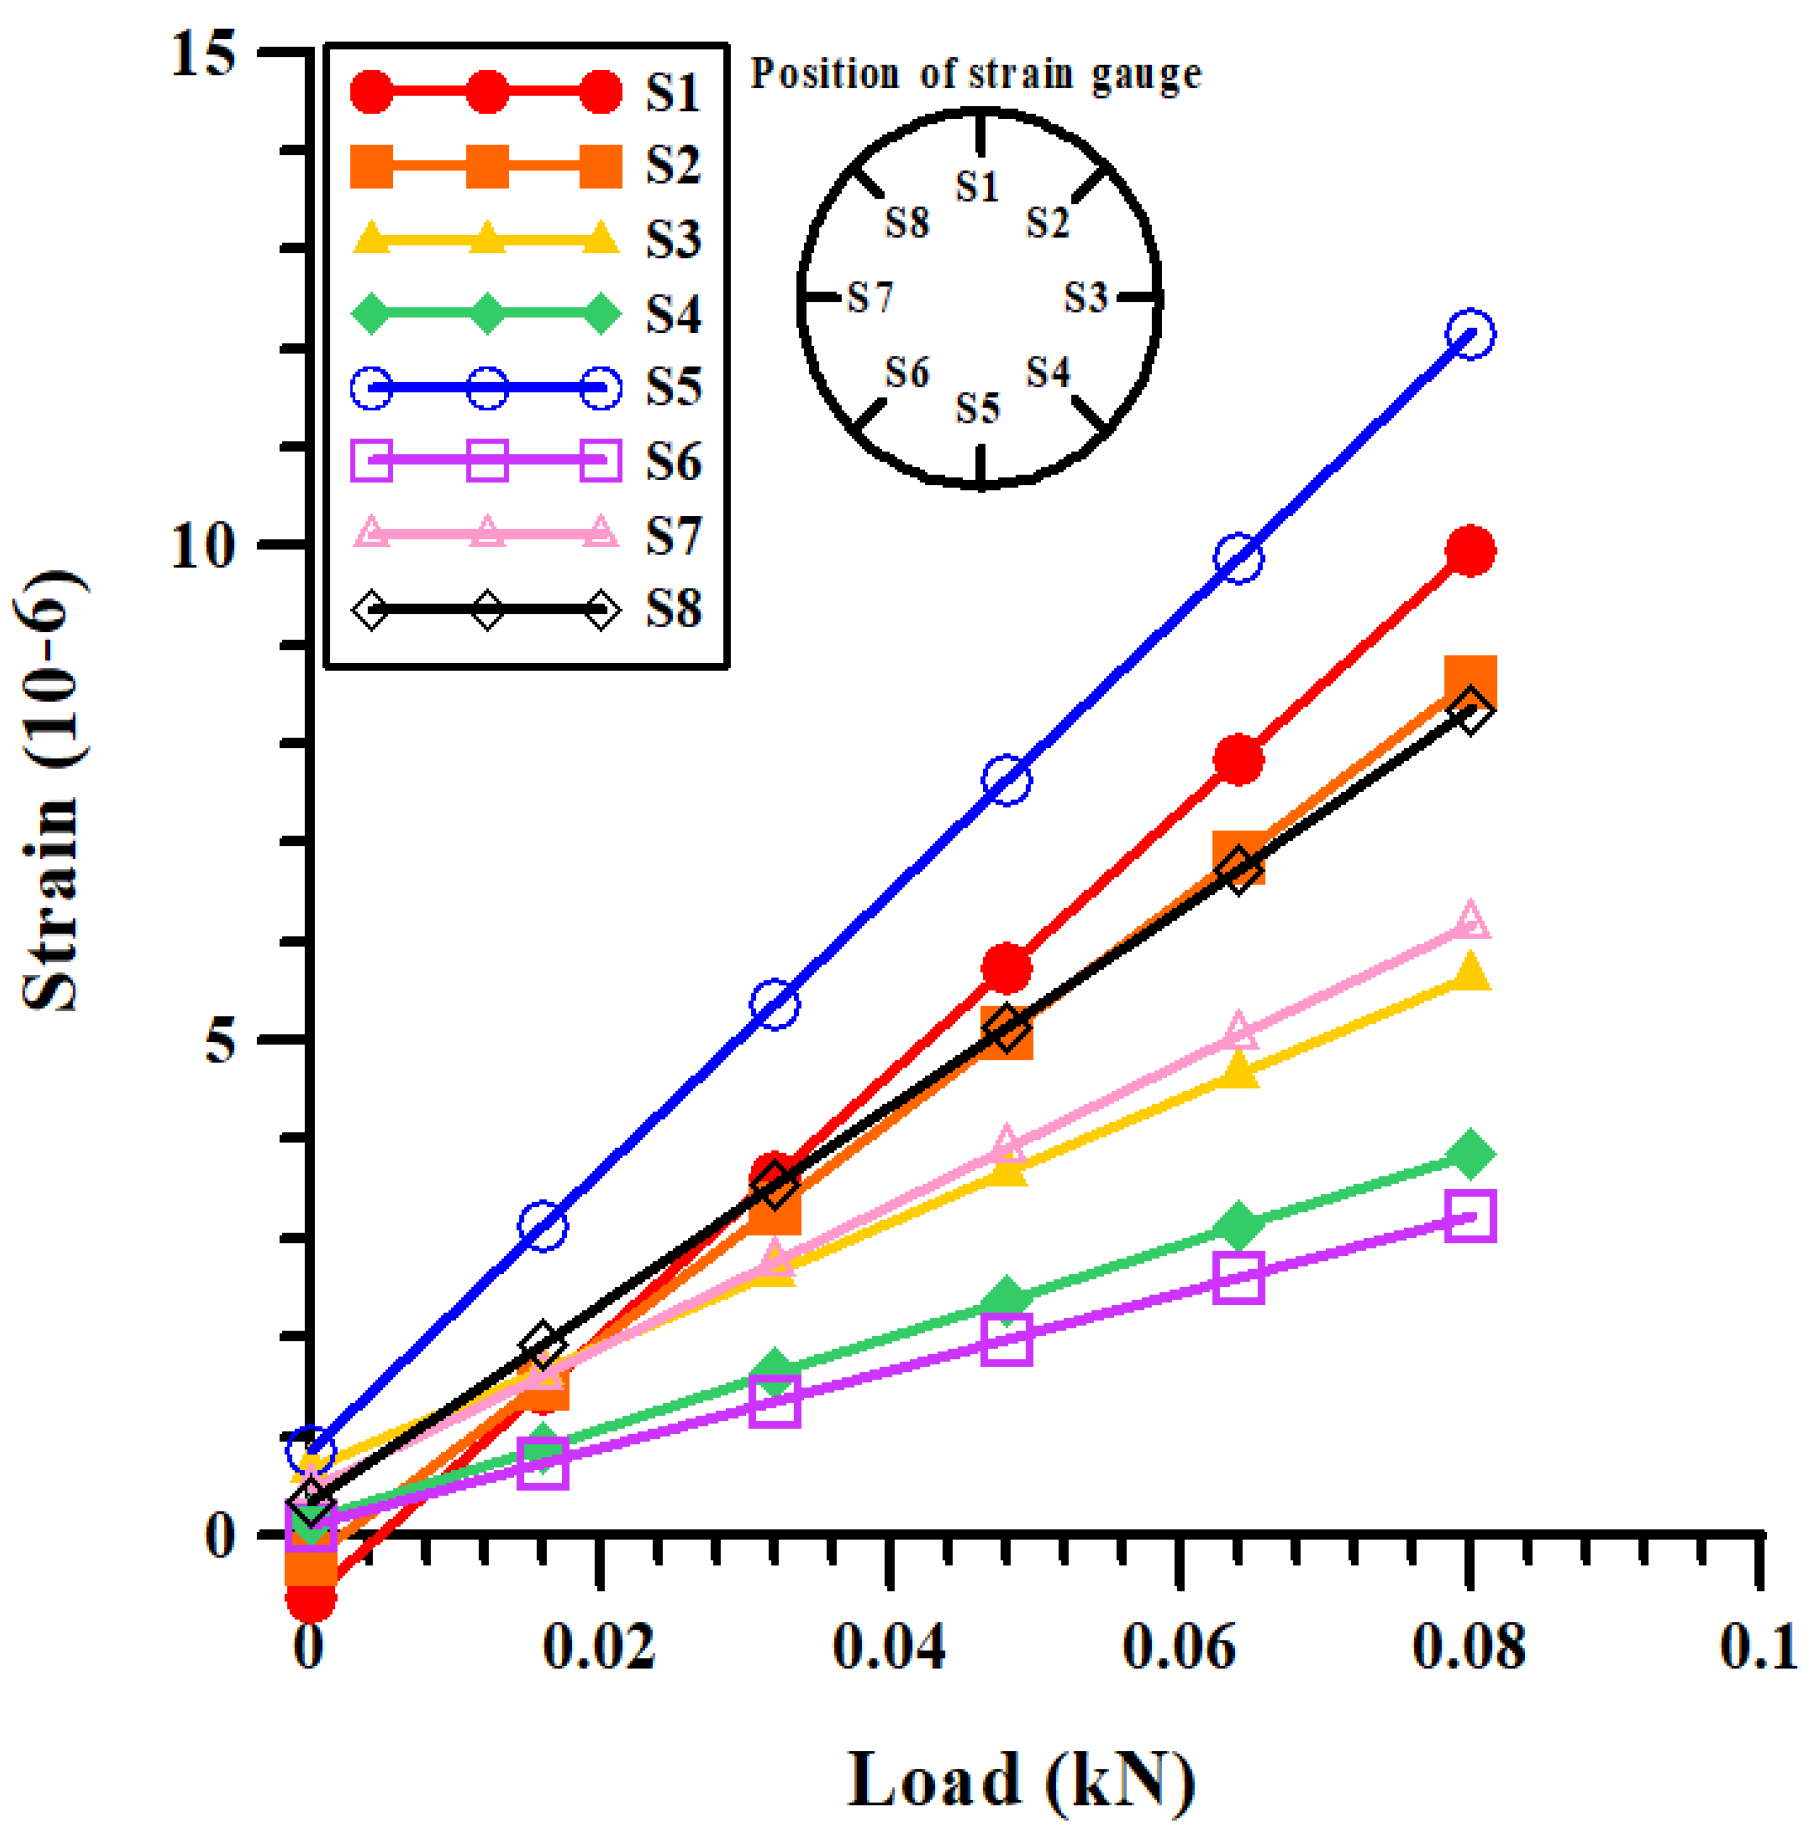
y = 110.71x + 0.2381 (R2 = 0.9924),
y = 52.5x + 0.6667 (R2 = 0.9292),
y = 46.429x + 0.1429 (R2 = 0.9657),
y = 141.07x + 0.8571 (R2 = 0.9536),
y = 39.286x + 0.0952 (R2 = 0.9429),
y = 71.429x + 0.4762 (R2 = 0.9796),
y = 100x + 0.3333 (R2 = 0.9882).
To obtain the surcharge loads acting on the pile during the model test, the relationship between the load and settlement was expressed in a P–S curve using LCM. The P–S curve was obtained by gradually increasing the load using a weight after connecting the model pile to the loading device. An ultimate load of 0.18 kN was obtained following Bulter et al. [23], and an allowable load of 0.06 kN was calculated considering a safety factor of 3. Figure 10 shows the P–S curve for the settlement according to the cumulative load.

2.3. Laboratory Model Test Procedure

In this study, a laboratory model test was conducted for 12 cases based on vertical pile–tunnel offsets of 1.0 D, 2.0 D, and 3.0 D and horizontal pile–tunnel offsets of 0 D, 1.0 D, 2.0 D, and 3.0 D (Figure 11). In the names of the cases, the first number represents the vertical offset, and the second number represents the horizontal offset.
The calibration results above, as well as the allowable and ultimate loads obtained from the P–S curve, were applied to the 12 cases. The laboratory model test was divided into a preparation step, a test step, and a calculation step. In the preparation step, sandy soil was prepared in the chamber, and the parameters of the model tunnel and model pile were set. In addition, a linear variable differential transformer (LVDT) was installed to measure surface settlement, and the strain gauges of the model tunnel were connected to the data logger. In the test step, surcharge loads (allowable and ultimate loads) were applied to the model pile in sequence, and the surface settlement and strain gauge values of the model tunnel were measured. Finally, in the calculation step, the data obtained in the test step were converted and analyzed to complete the laboratory model test. Figure 12 shows each step of the test procedure.

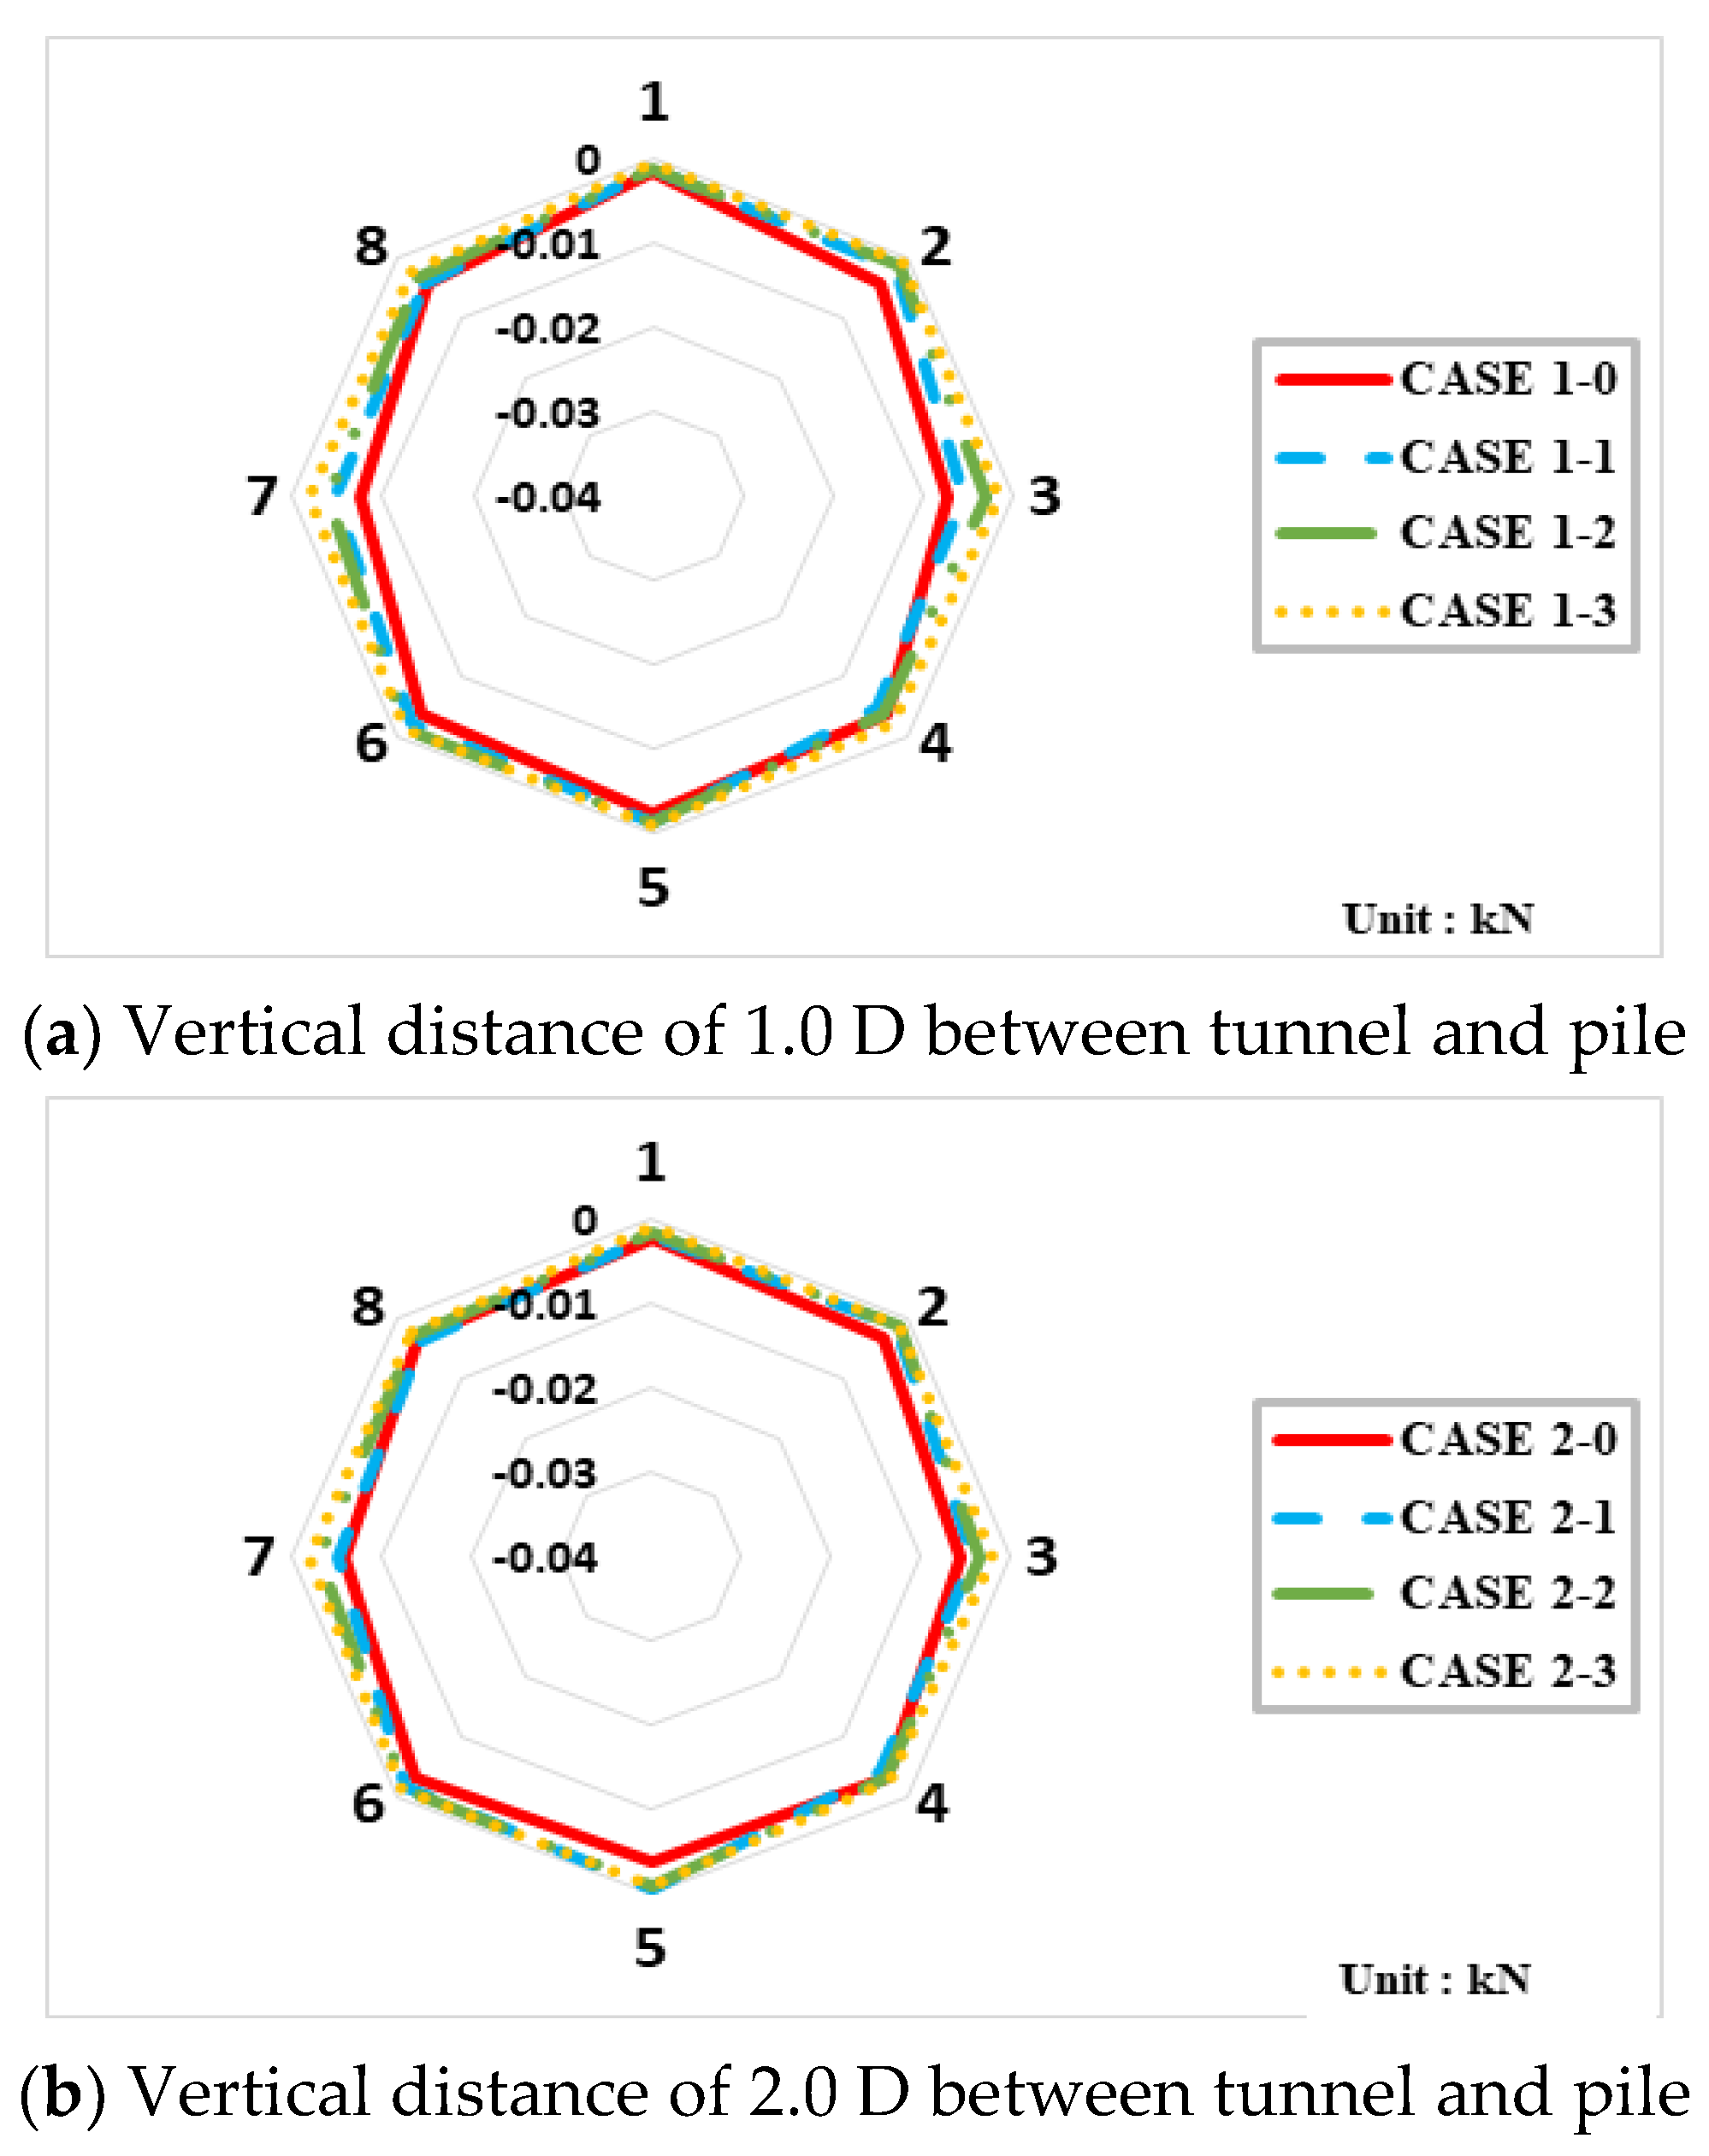
2.4. Laboratory Model Test Results

Figure 13 and Figure 14 show the results of converting the strains measured using the strain gauges when loading was applied to the pile into axial forces based on the results obtained during tunnel calibration. When the allowable load was applied to the pile at a vertical offset of 1.0 D, the axial force tended to be concentrated on the side wall of the tunnel as the horizontal offset increased. It was found that the influence of the horizontal offset decreased when the vertical offset was 2.0 D or higher; this was most obvious when the ultimate load was applied to the pile. As the vertical offset increased, the difference in the axial force acting on the tunnel for each horizontal offset significantly decreased.
The axial forces acting on the tunnel were quantitatively compared for each case. Relative to that for case 1-0, the axial force for cases 1-1, 1-2, and 1-3 were reduced by 8.6, 22.7, and 58.6% at the crown and by 24.1, 59.6, and 80.3% at the side wall. When the vertical offset increased, the reductions were 11.9, 24.9, and 65.0% (when the vertical offset was 2.0 D) and 10.7, 34.0, and 68.9% (when the vertical offset was 3.0 D) at the crown and 25.0, 33.6, and 60.4% (2.0 D) and 15.6, 30.3, and 47.4% (3.0 D) at the side wall. The axial forces acting on the crown and side wall of the tunnel also sharply decreased according to the horizontal pile–tunnel offset (Figure 15).
When the ultimate load was applied to the pile, the axial force tended to be concentrated on the side wall, as it was when the allowable load was applied. The axial force showed a tendency to gradually decrease as the horizontal offset increased (Figure 16). Compared to case 1-0, cases 1-1, 1-2, and 1-3 were lower by 9.8, 27.7, and 54.4% at the crown and 29.0, 47.7, and 71.9% at the side wall. Compared to case 2-0, cases 2-1, 2-2, and 2-3 showed decreases of 7.9, 16.9, and 55.5% at the crown and 8.6, 19.2, and 50.7% at the side wall. Compared to case 3-0, cases 3-1, 3-2, and 3-3 were reduced by 15.9, 23.6, and 47.4% at the crown and 14.4, 20.6, and 52.0% at the side wall. Therefore, attention needs to be paid to the crown and side wall of the tunnel when a pile is close to the area immediately above the tunnel to ensure that the separation distance is appropriate.

3. Numerical Analysis

3.1. Numerical Modeling

Numerical analysis was conducted under the same conditions as the laboratory model test. This study used Bentley’s PLAXIS 3D (ver. 21.01.00.479), which can conduct an overall geotechnical analysis (including the deformation and safety of soil and rock as well as the interaction between structures and the ground) based on the finite element method [24].
The numerical model simulated a pile and tunnel of the same size as those in the laboratory test in a 500 × 700 mm soil section (Figure 17). An allowable load of 0.06 kN and an ultimate load of 0.18 kN were applied to the pile. A numerical analysis was conducted for the 12 cases shown in Figure 11.
The plain strain condition was applied in the same manner as in the laboratory model test. If 3D modeling is applied at the actual scale, the pile may be represented either as a series of single piles or as a single pile with the equivalent properties of grouped piles along the z-axis direction of the pile. According to Kwon et al. [25], in the case of grouped piles, the bearing capacity of the piles decreases because the stress sheared to the soil by the piles is overlapped by the grouped-pile effect. Thus, a numerical analysis will be conducted in the future separating the case in which a single pile is installed in the z-axis direction from that in which the condition of grouped piles is considered.
Additional analyses were conducted according to the geometry of the pile. Figure 18 shows the modeling and mesh used for the numerical analysis. The boundary condition of the ground was fixed for both ends of the sides and the bottom, and the ground area (size) was modeled to express sufficient deformation of the structure and the ground. Triangular meshes formed densely around the tunnel and pile, and the mesh was loosened as it moved away from the structure to enable smooth calculation. The density of the triangular mesh was increased in the area surrounding the tunnel and pile to provide more detail.

3.2. Materials Properties for Numerical Analysis

The accuracy of the numerical ground analysis results depends on the reliability of the input soil parameters in the mathematical soil-constitutive model, and determining the material properties is a very important process [26]. In this study, the Mohr-Coulomb model and elastic model were used for the soil and pile. The relative density was taken from the laboratory model test, while the other material parameters were taken from the literature. Table 5 shows the material properties of sandy soil according to [27,28,29,30,31].
An interface element with interface factor Rinter = 0.7 was used to simulate the slip between the soil and structure.

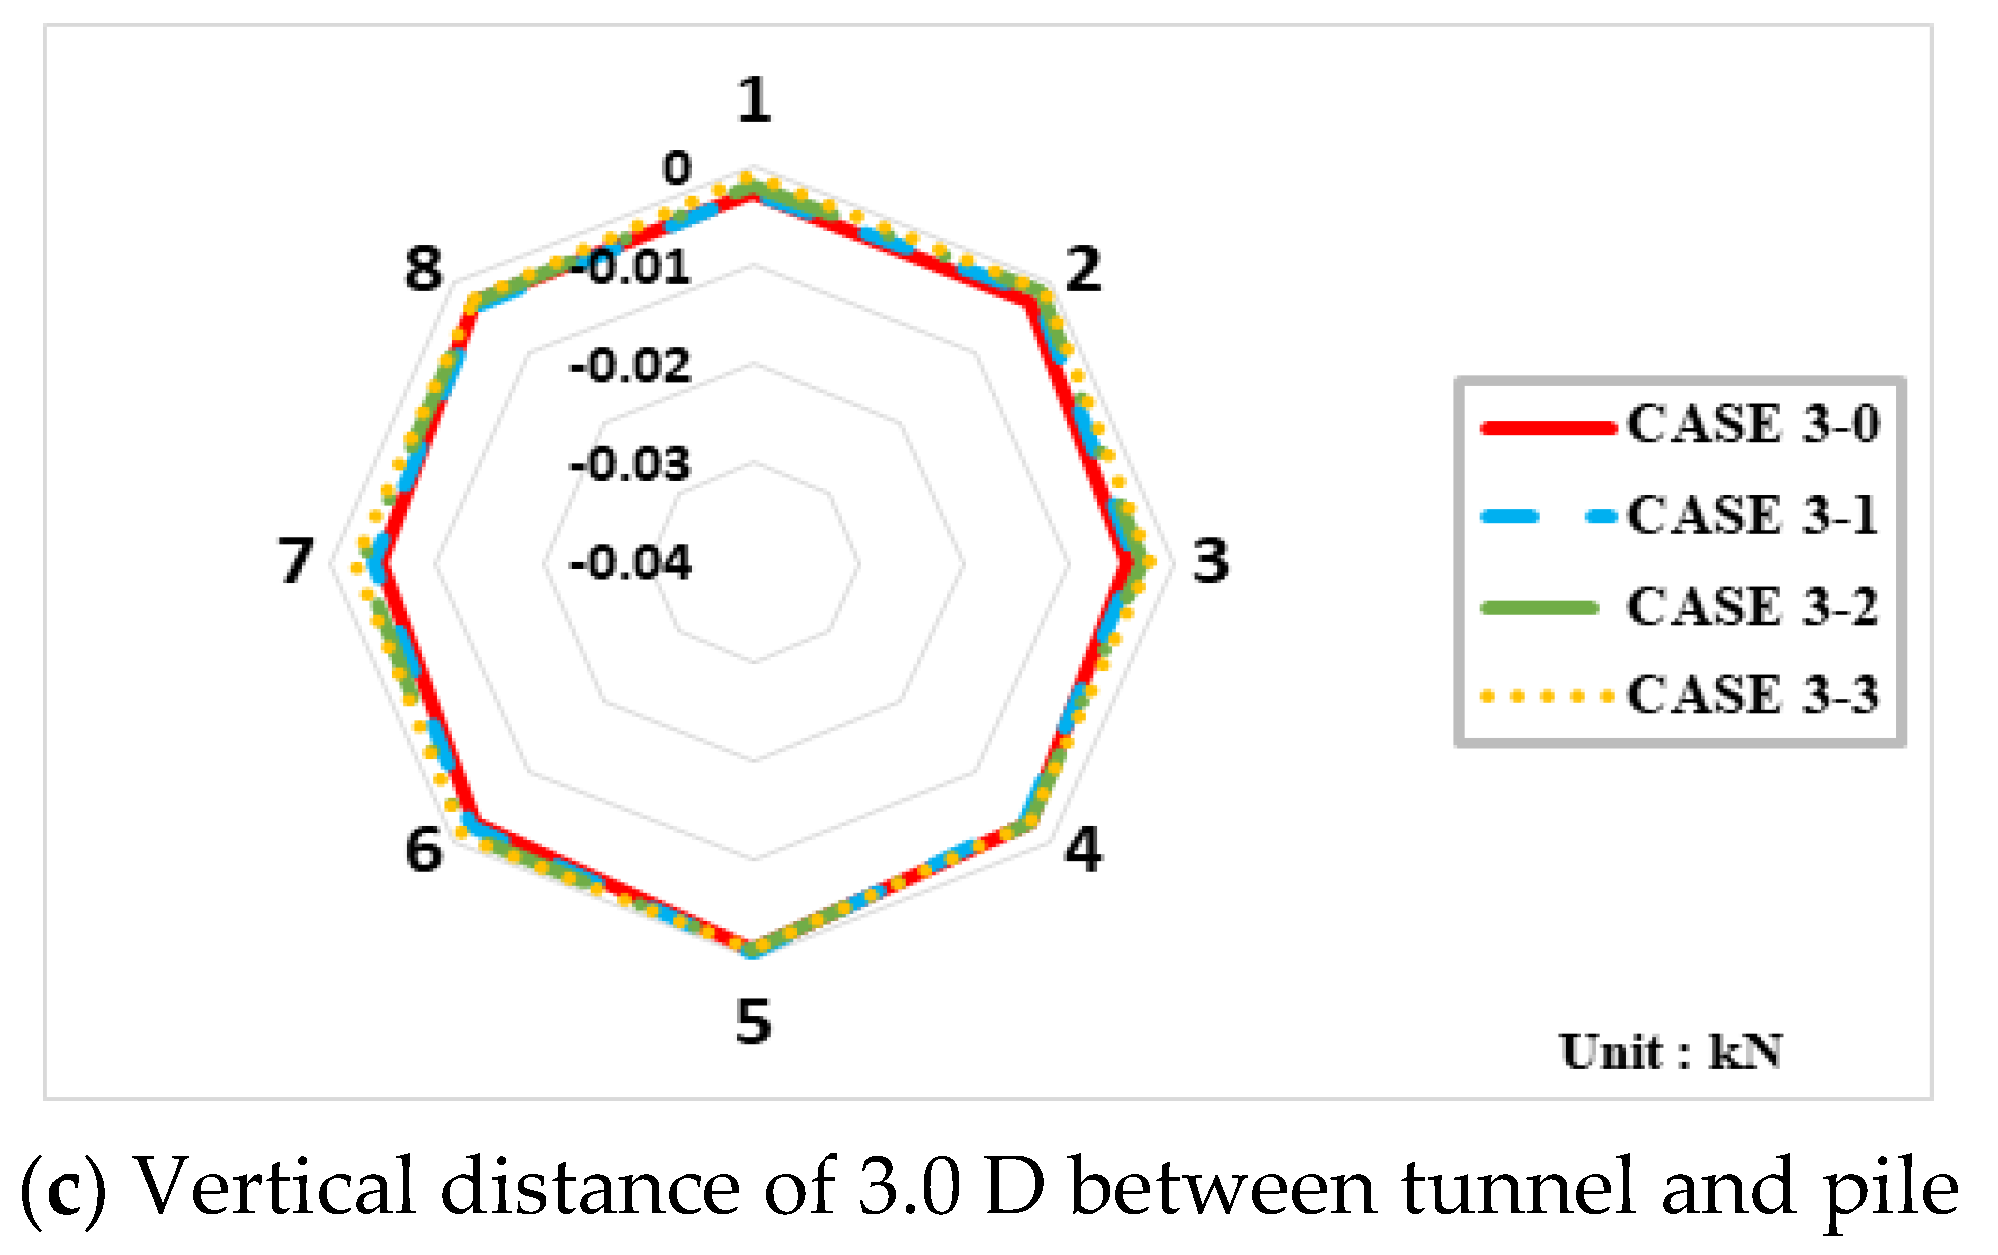
3.3. Numerical Analysis Results

Figure 19, Figure 20, Figure 21 and Figure 22 show the simulation results for the vertical and horizontal displacement contours generated in the lower tunnel when the allowable loads were applied to the pile. As the offset between the tunnel and piles increased by 1.0 D, the effect on the tunnel by the pile installation decreased. As Figure 22 shows, the tunnel was farther outside of the influence area due to the pile installation compared to other cases where the distance was close. Figure 23 and Figure 24 show the simulation results for the axial force generated in the lower tunnel when the allowable and ultimate loads were applied to the pile. When the allowable load was applied, the axial force acting on the tunnel according to the horizontal pile–tunnel offset decreased as the vertical offset decreased. When the ultimate load was applied, the magnitude of the axial force acting on the side wall of the tunnel changed significantly as the horizontal pile–tunnel offset increased.
As shown in Figure 25 and Figure 26, when the allowable load was applied to the pile, the axial force acting on the crown of the tunnel gradually decreased. Compared to case 1-0, cases 1-1, 1-2, and 1-3 were lower by 6.9, 37.7, and 78.7%, respectively. In the case of the side wall, the axial force was larger than that acting on the crown. Compared to case 1-0, where the pile was immediately above the tunnel, the decrease rates of cases 1-1, 1-2, and 1-3 were reduced to be 21.6%, 49.7%, and 69.3%, respectively. When the vertical offsets were 2.0 D and 3.0 D, as the pile moved from the position immediately above the tunnel (0.0 D) to 1.0 D, 2.0 D, and 3.0 D in the horizontal direction, the axial force acting on the crown of the tunnel showed a tendency to sharply decrease by 8.3, 43.9, and 88.1% and by 8.1, 26.7, and 50.1%, respectively. The axial force acting on the side wall also decreased by 42.0, 59.9, and 61.9% and by 8.2, 31.6, and 47.9%, respectively, indicating that the influence of the pile on the tunnel decreased when the pile was farther away. This tendency was also observed when the ultimate load was applied to the pile. The axial force acting on the crown decreased by 3.31, 25.4, and 84.3% (vertical offset: 1.0 D); by 7.4, 65.5, and 71.1% (vertical offset: 2.0 D); and by 6.1, 29.5, and 49.8% (vertical offset: 3.0 D) compared to the case with the pile immediately above the tunnel. The axial force acting on the side wall decreased by 30.3, 49.7, and 70.0% (vertical offset: 1.0 D); by 29.9, 55.6, and 64.6% (vertical offset: 2.0 D); and by 7.7, 31.8, and 50.9% (vertical offset: 3.0 D). Therefore, securing a sufficient horizontal offset from the existing tunnel is necessary, and the appropriate separation distance found by analysis is consistent with the standards of Seoul.

4. Discussion

In this study, the effect of pile installation offset on an existing tunnel was studied using a model test and numerical analysis. The obtained results were compared with the standards of each country. This study is expected to further solidify existing regulations.
First, from the comparison results of the possible construction offsets, it was confirmed that an offset of 2.0 D, which is the safety area standard applied in Korea, was appropriate. Additionally, areas where construction was impossible in each country were defined to be less than 1.0 D However, the standard area that could be penetrated by structures in each country, was closer than 1.0 D, hence further research on separation distances closer than 1.0 D is needed.
Furthermore, to study the interactive behavior of tunnel piles, various conditions such as ground conditions, types of structures, tunnel size, and tunnel shape should be considered. However, in this study, the ground condition was set using only medium sand. The pile of the equivalent model was used to consider plain strain conditions. Thus, it is necessary to apply further ground conditions and model the pile used in the actual field, through further studies.

5. Conclusions

In this study, the mutual interaction of tunnels, piles, and soil following the installation of a pile in the soil above an existing tunnel by applying allowable and ultimate loads was analyzed through a laboratory model test and a finite-element numerical analysis. The conclusions of the study are as follows:
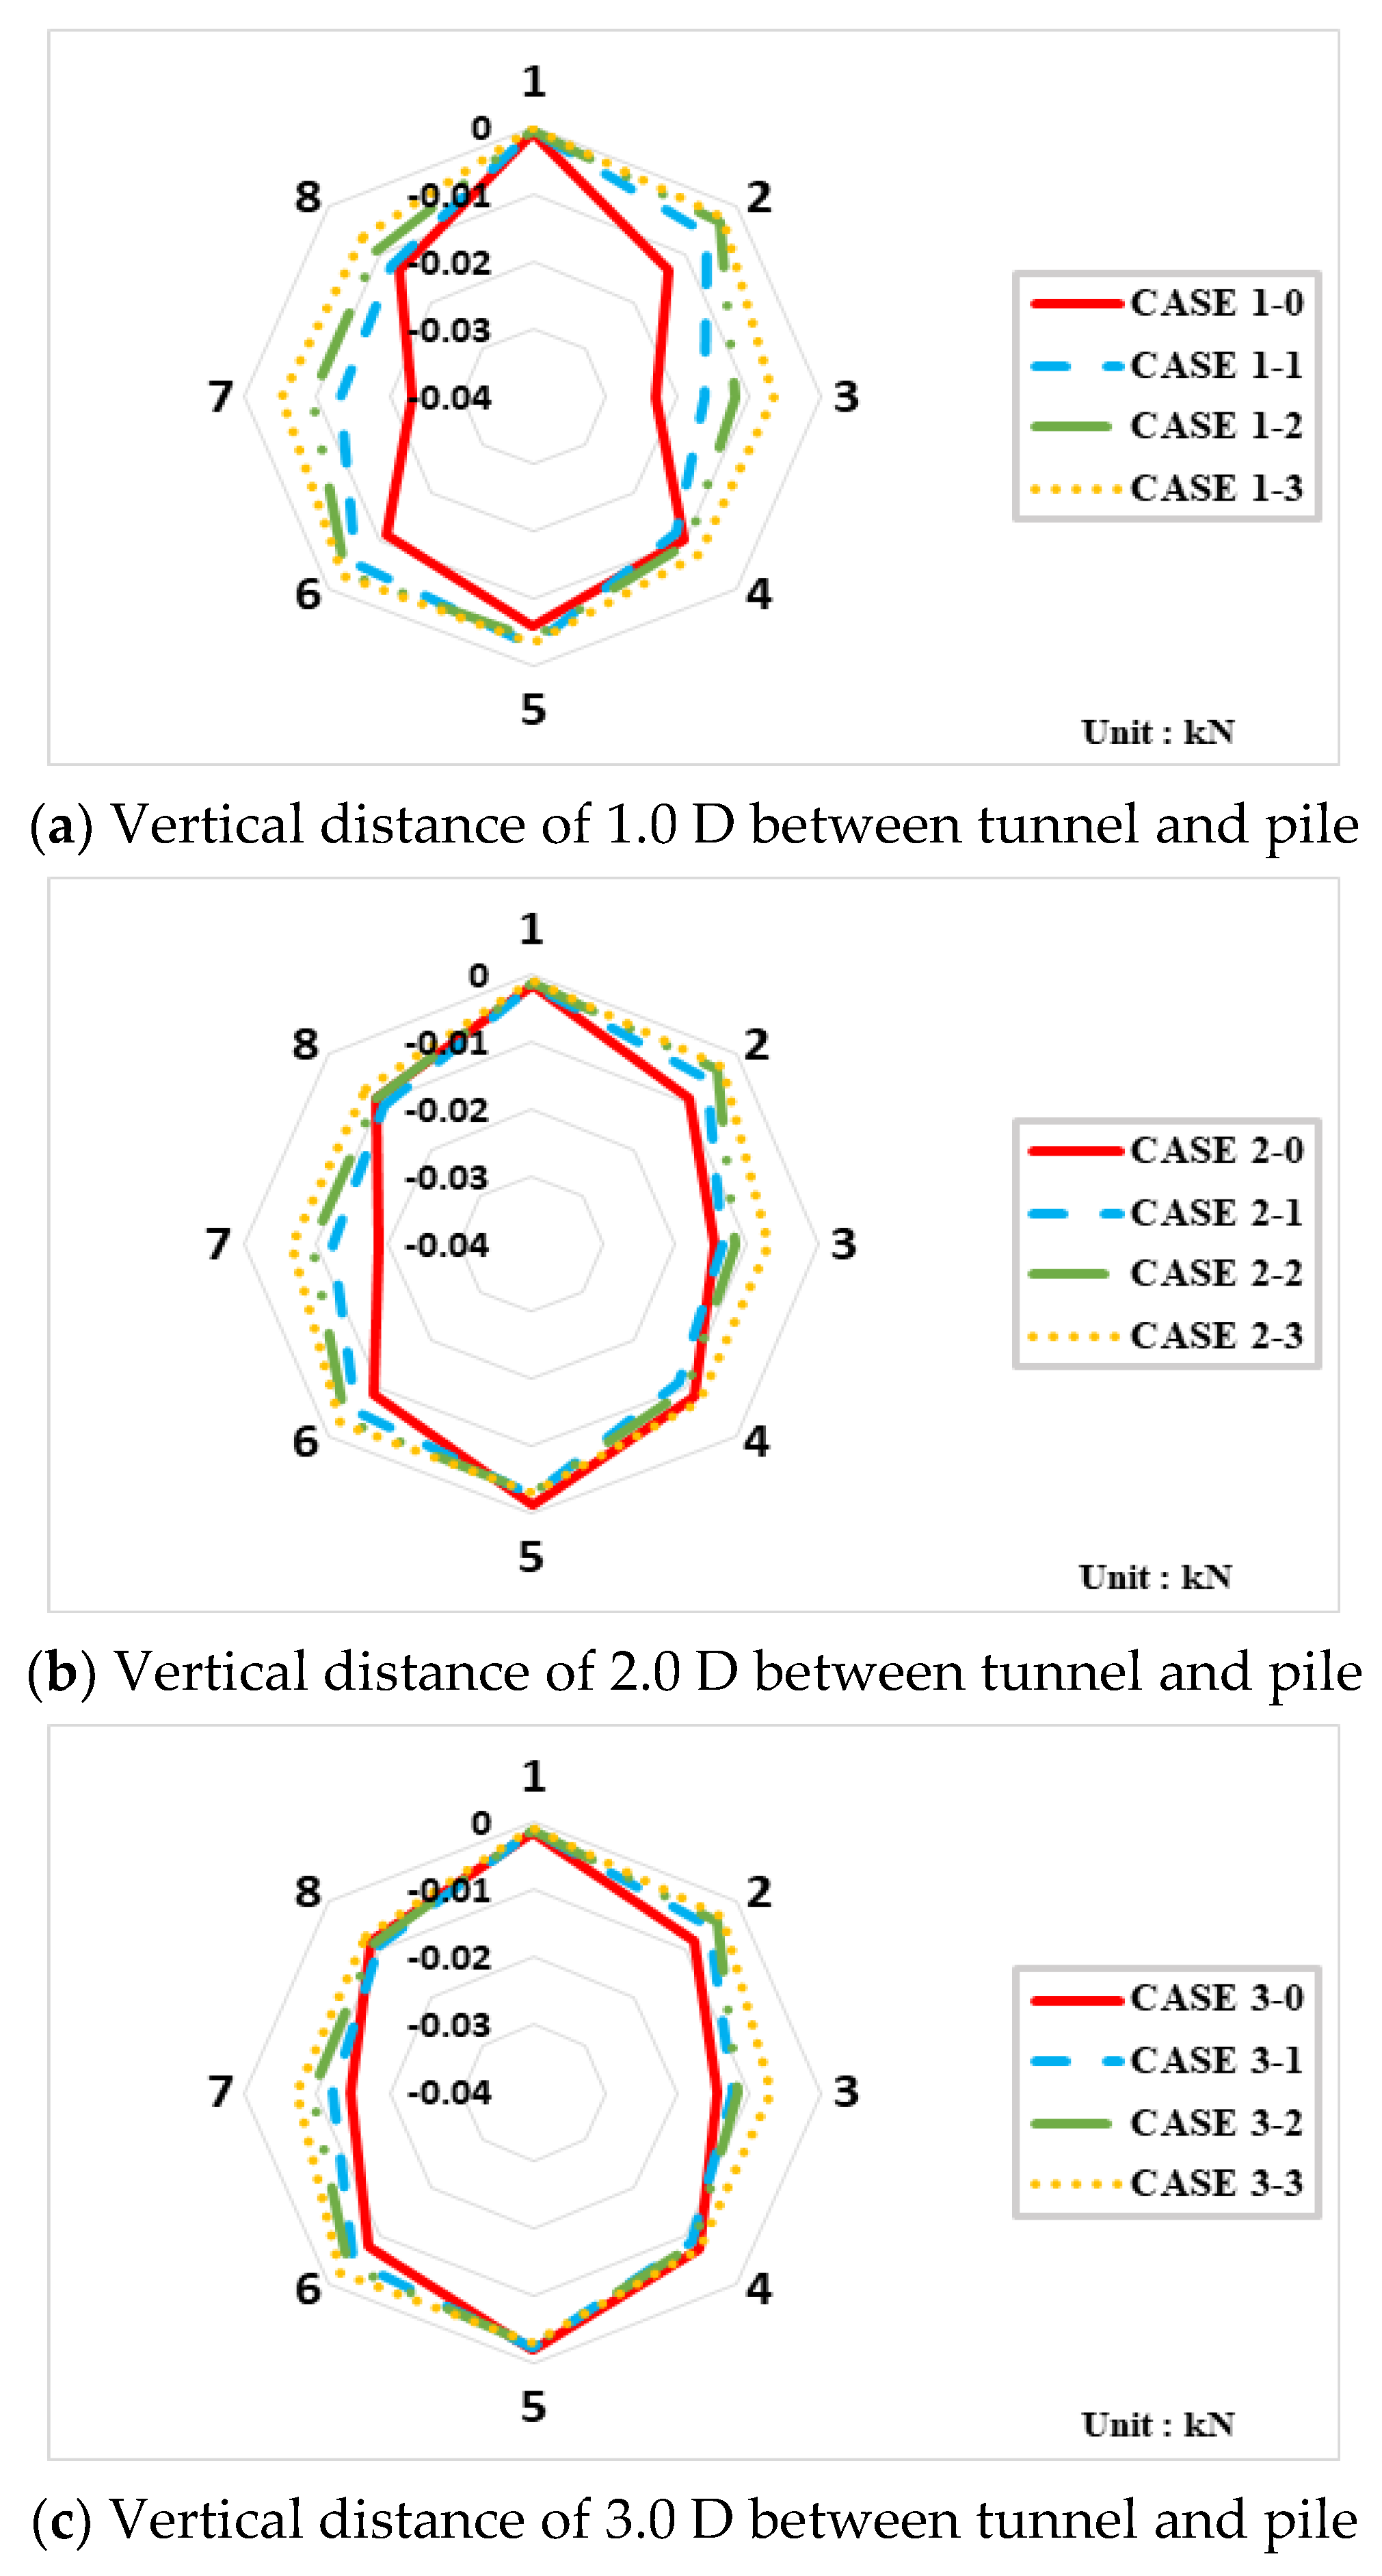
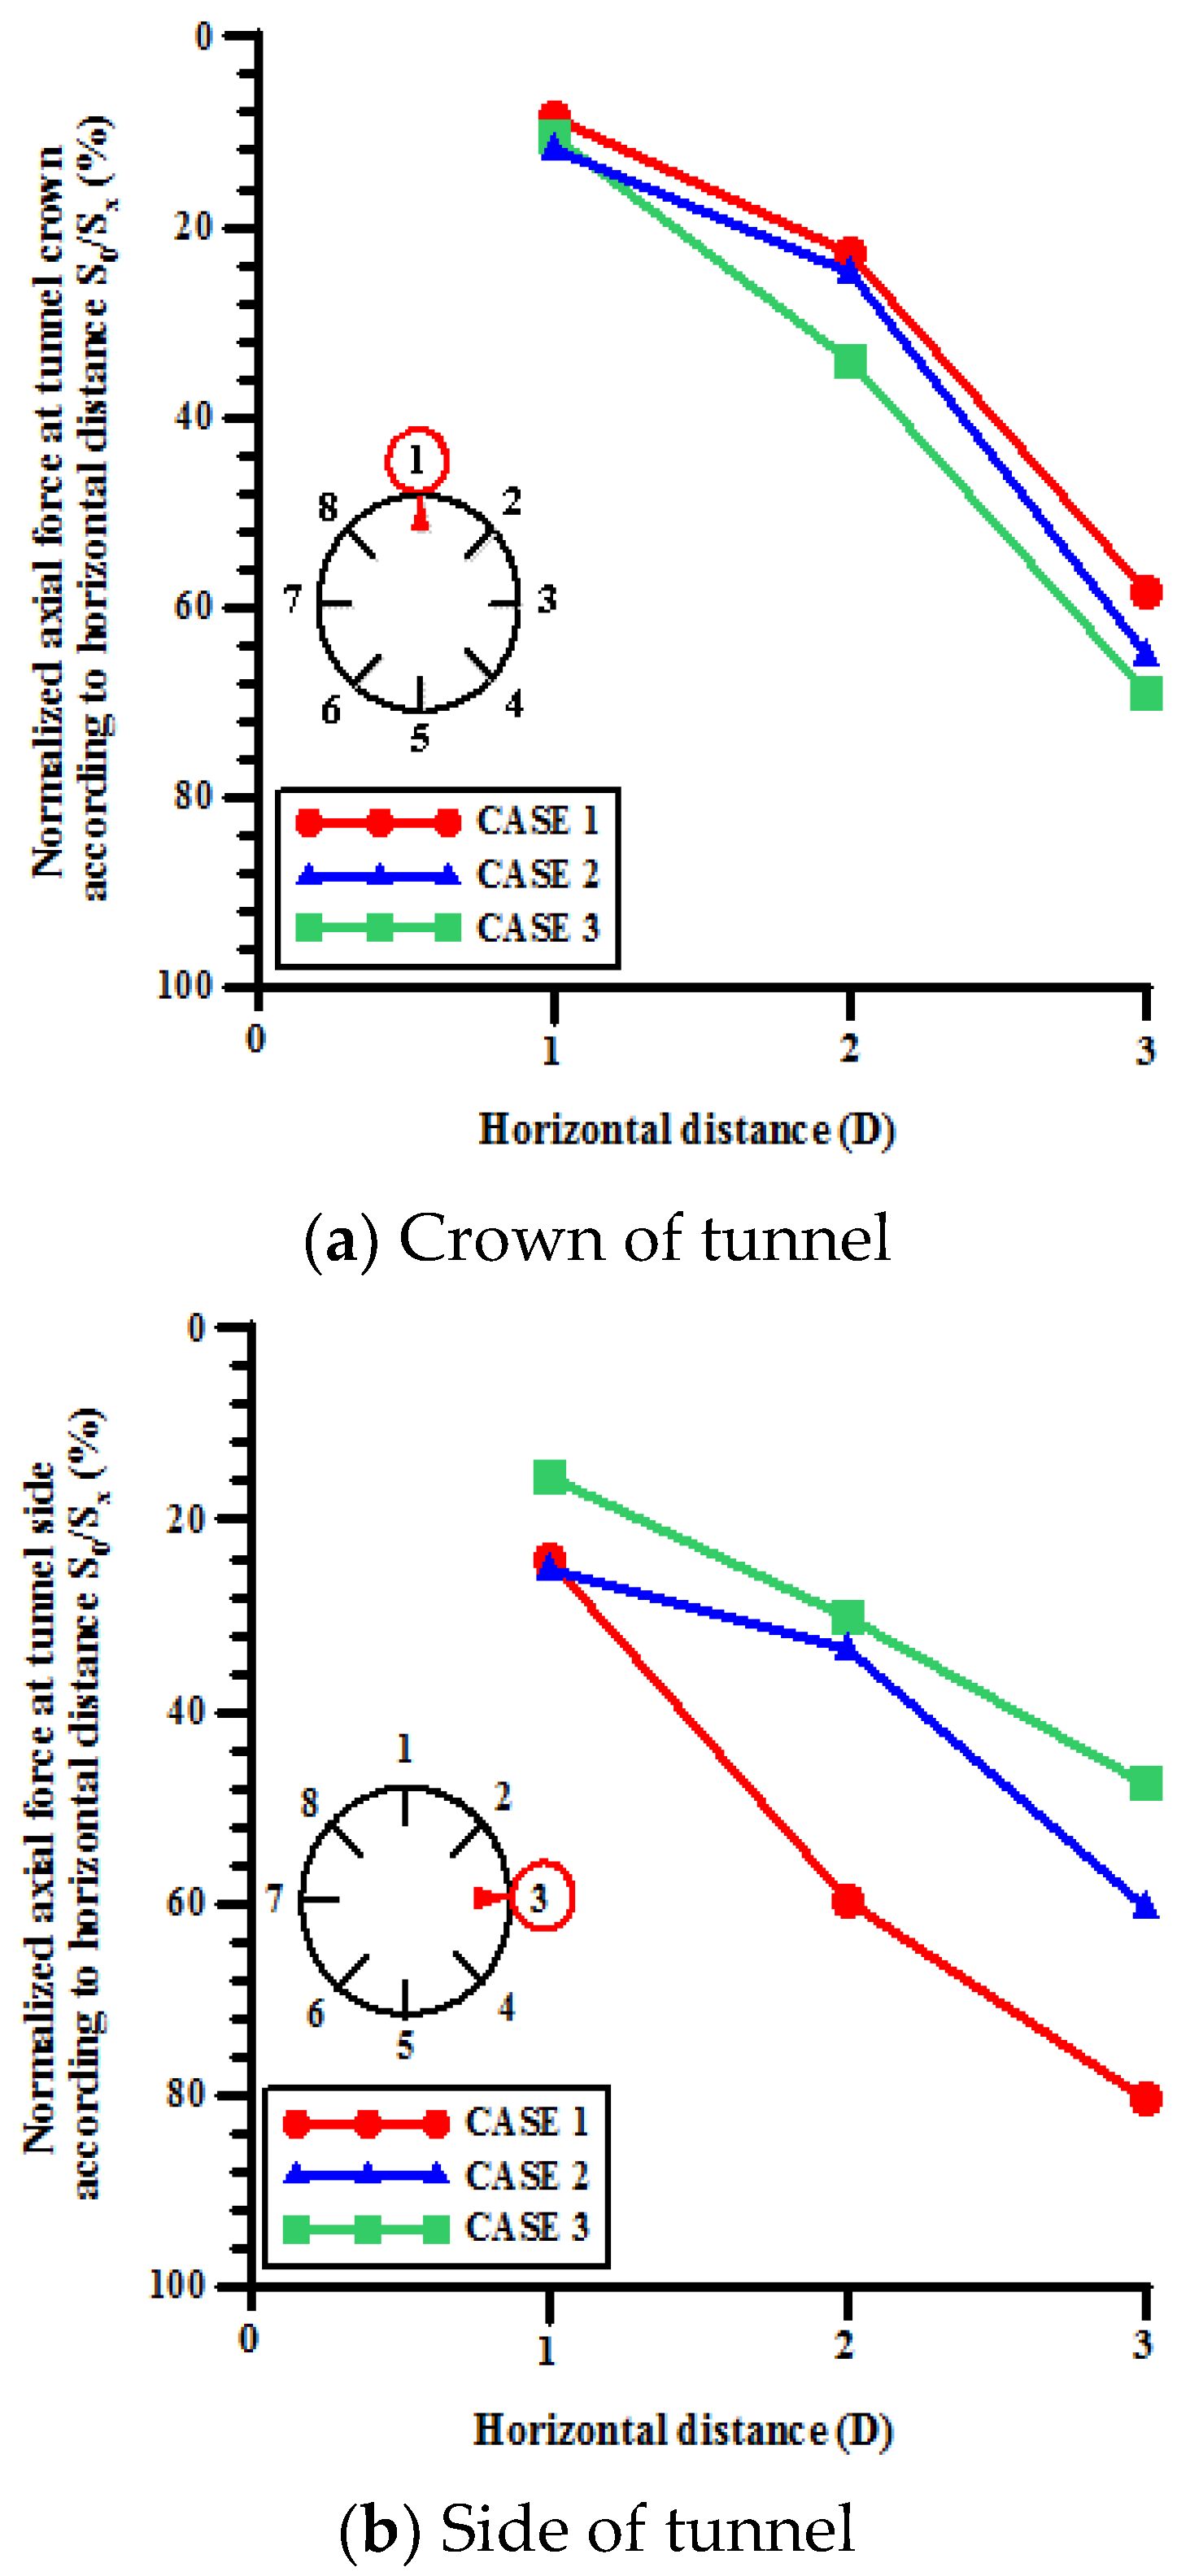
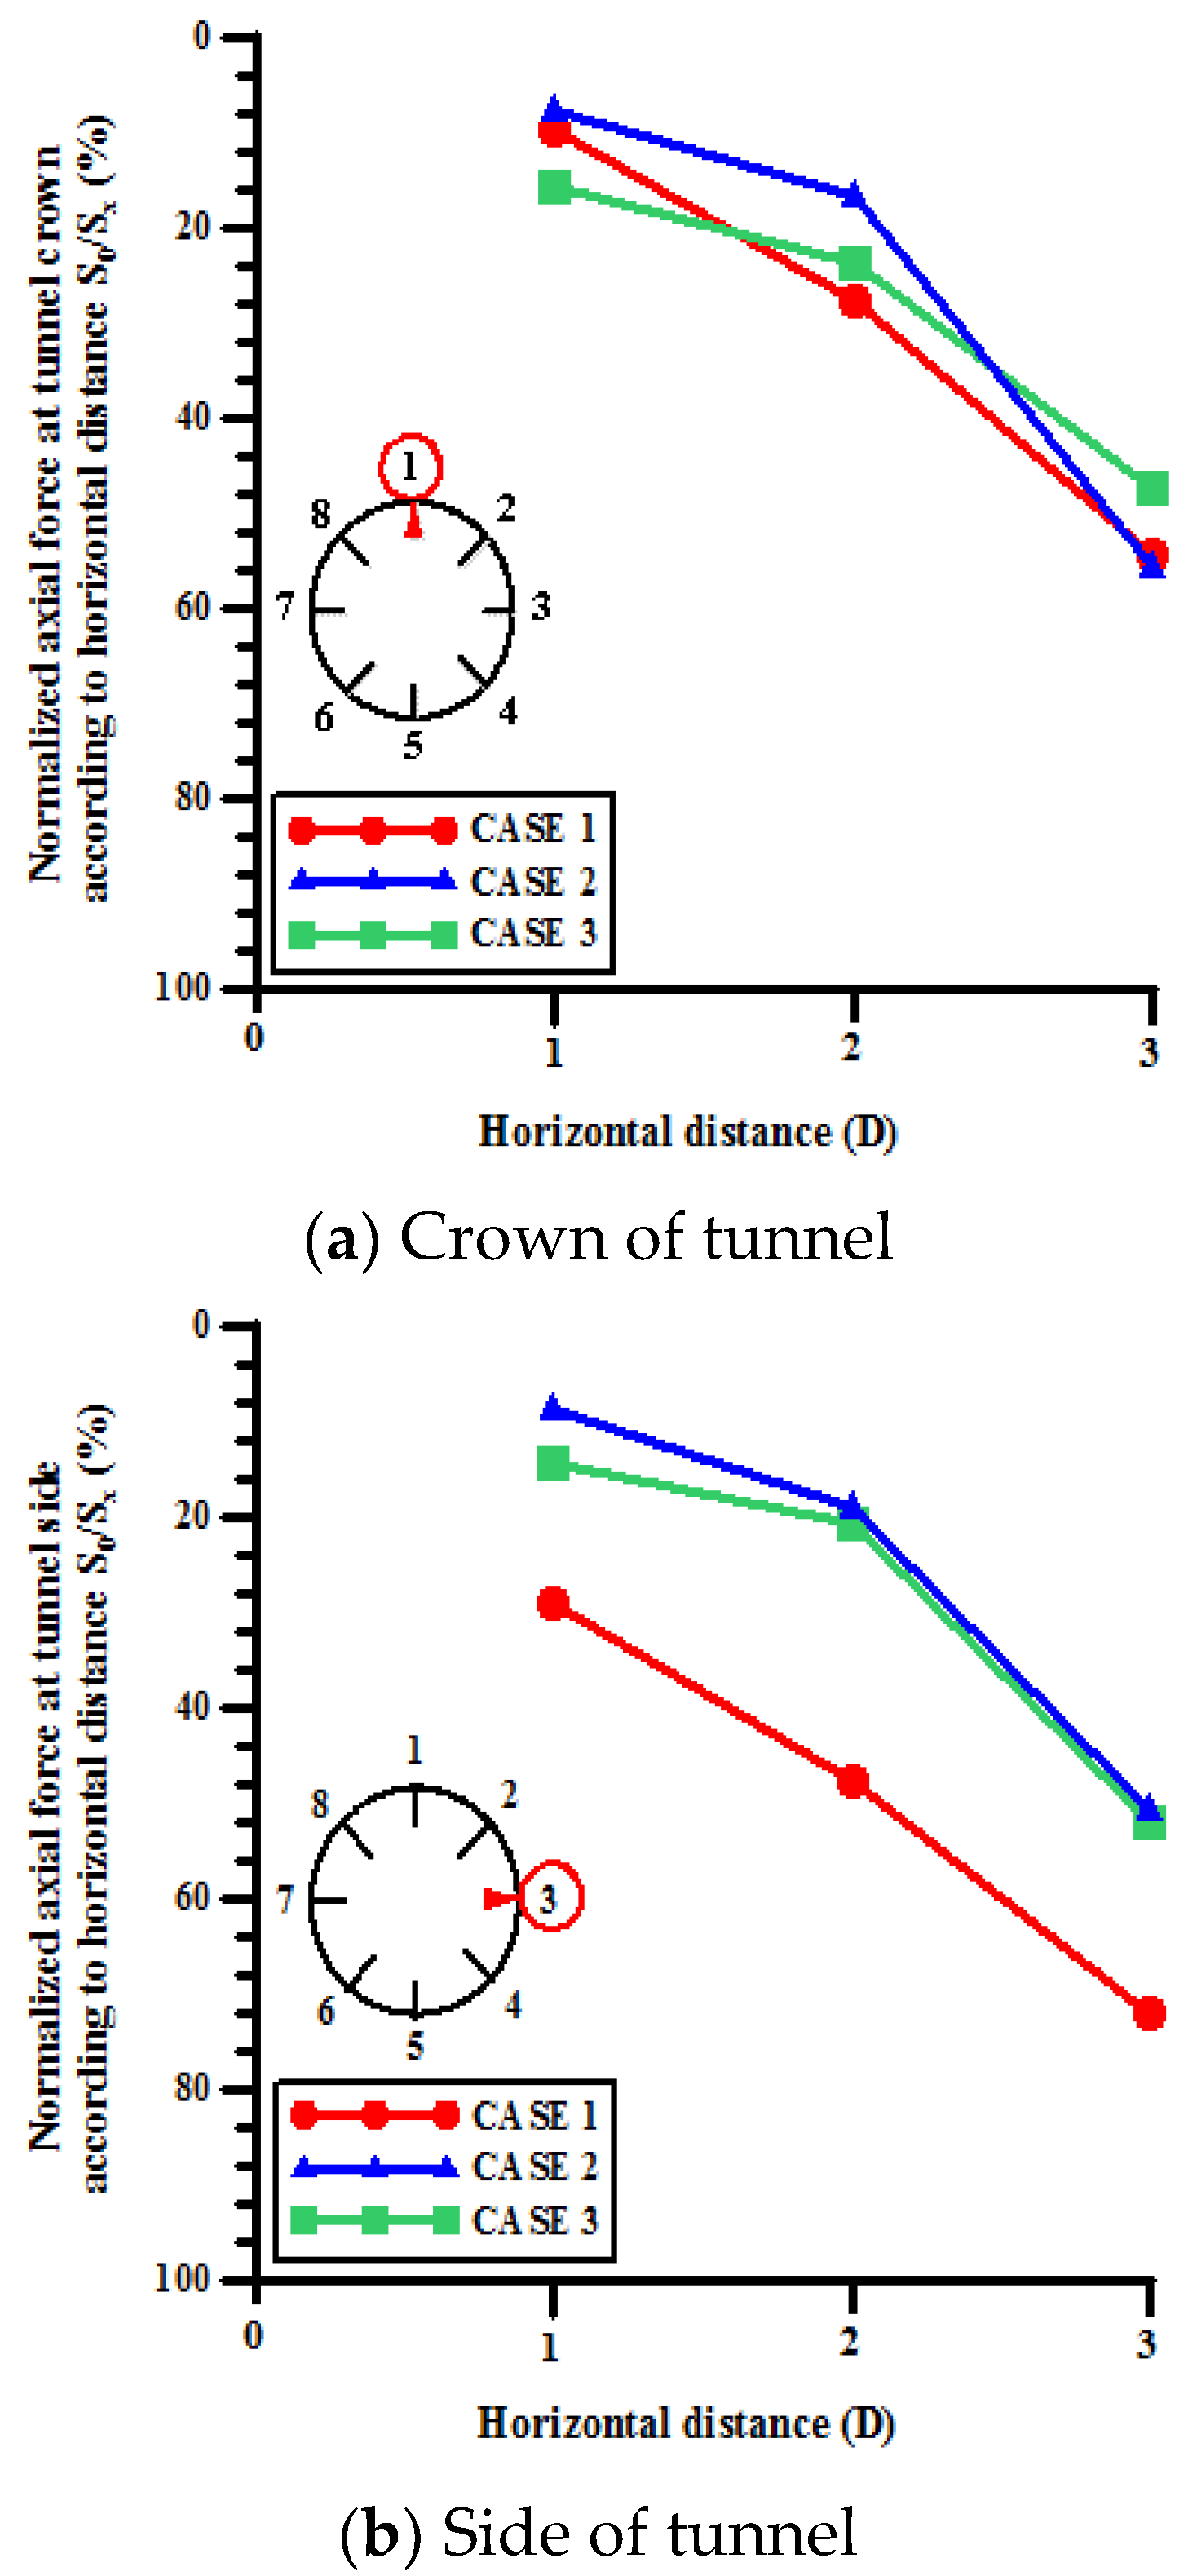
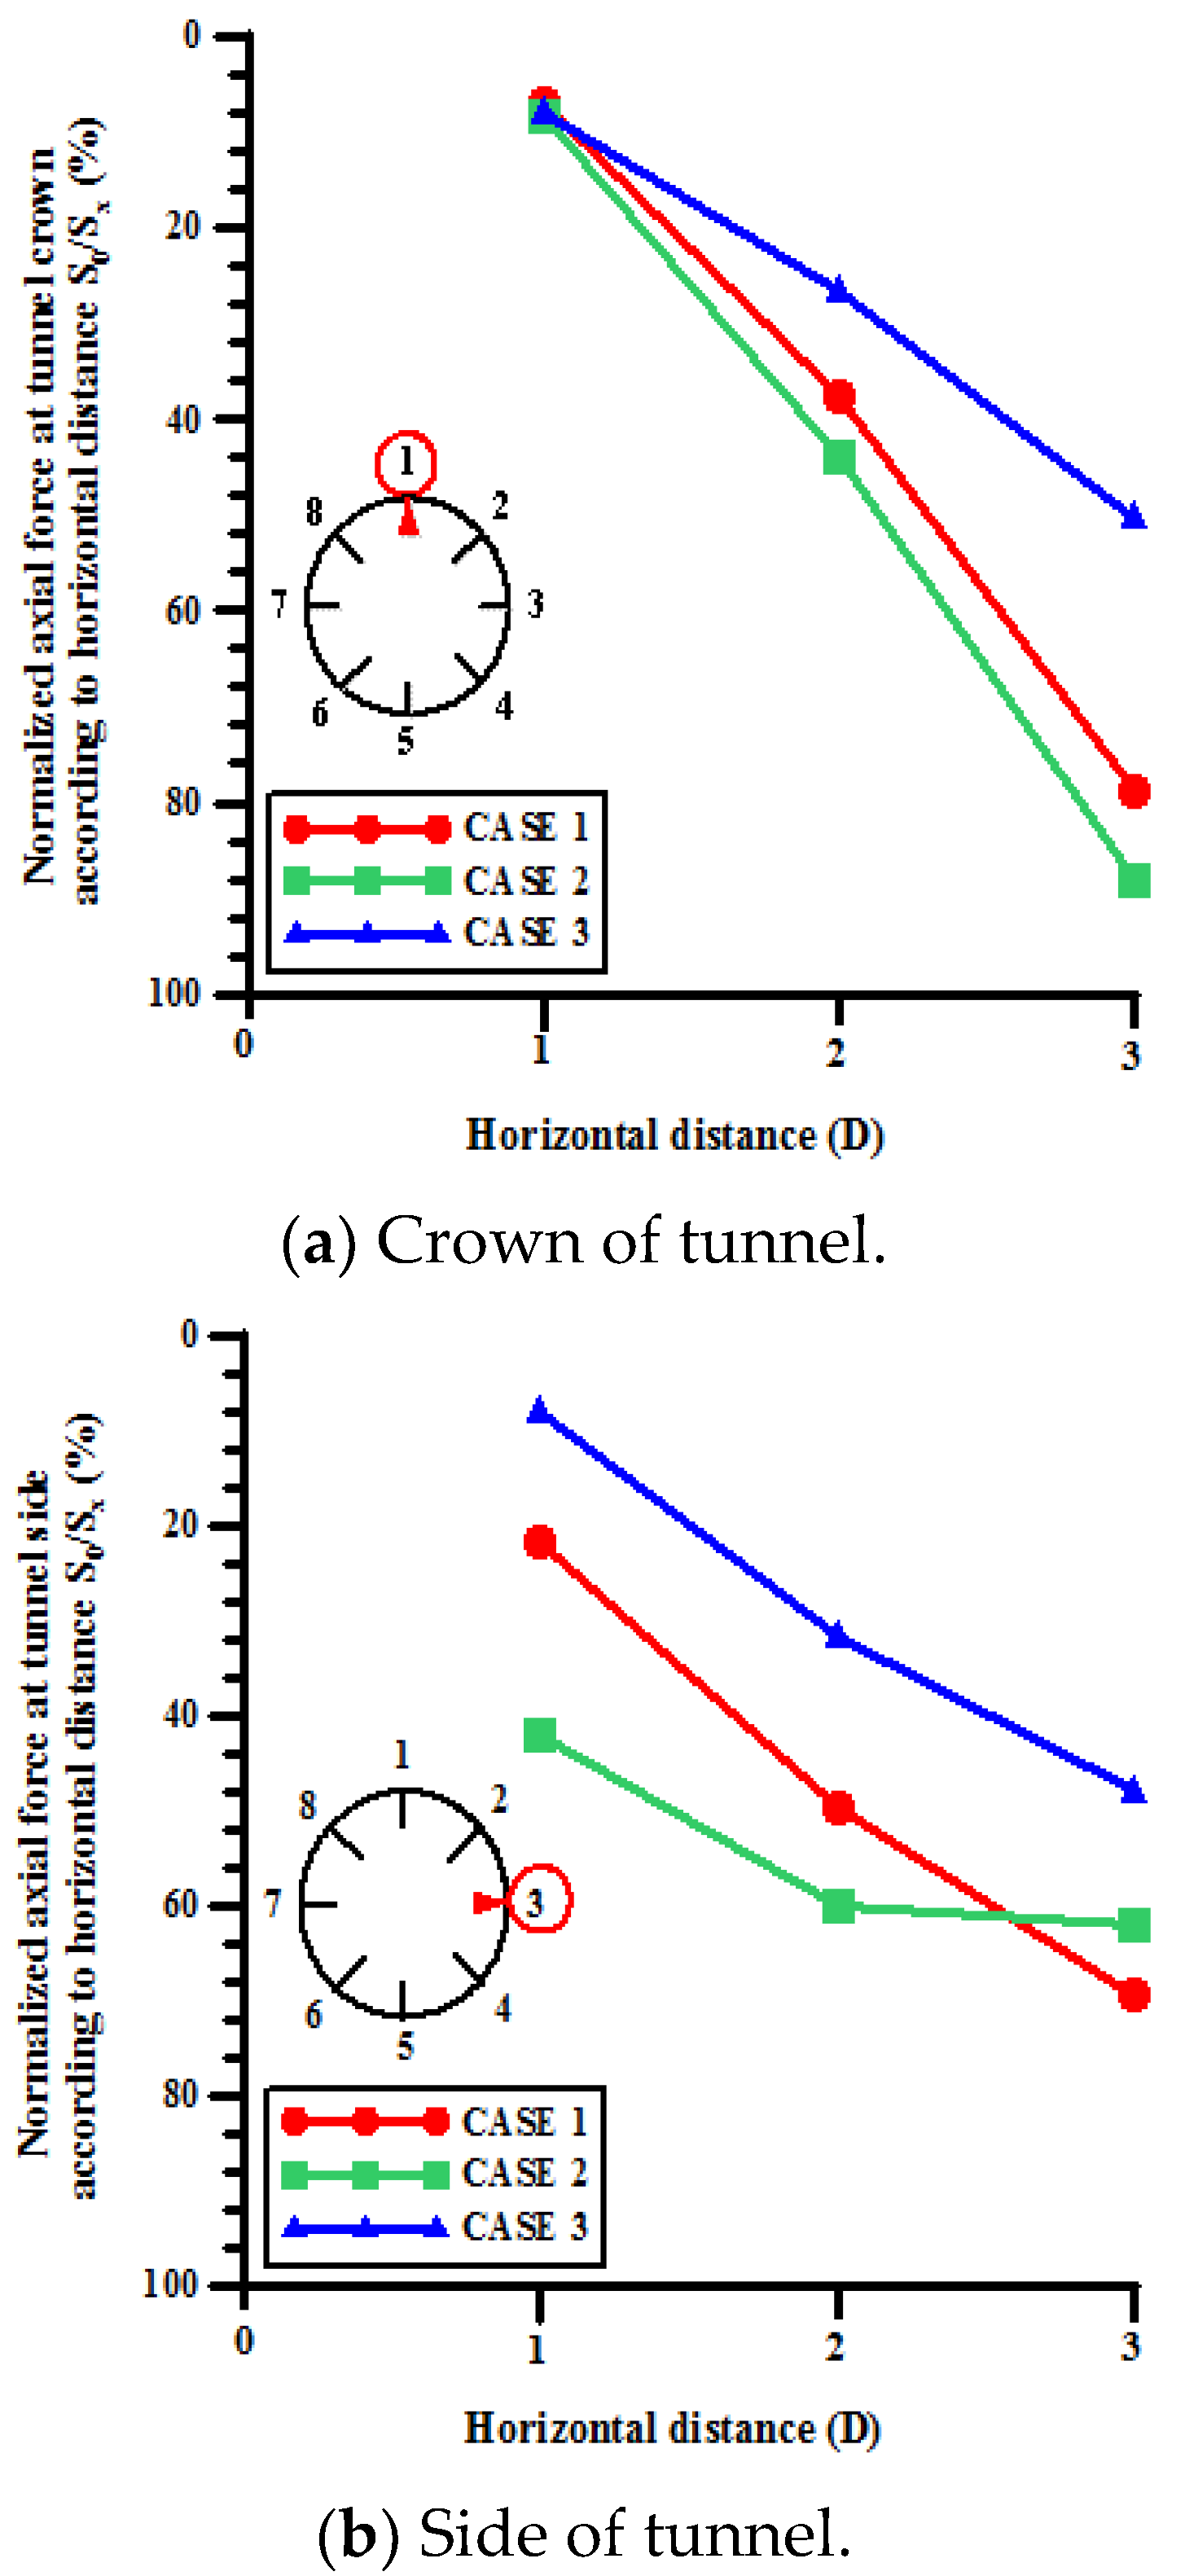
  • A laboratory model test was conducted to measure the effect on an existing tunnel of installing a pile nearby. When the axial force was measured using the strain gauges attached to the tunnel, the axial force acting on the side wall was larger than the axial force acting on the crown of the tunnel, and it sharply decreased as the horizontal offset increased. Under the allowable load, the decrease was up to 68.9% at the crown and 80.3% at the side wall; under the ultimate load, it was up to 55.5% at the crown and 71.9% at the side wall. Therefore, it is important to have a sufficient horizontal offset when a structure is installed near an existing tunnel.
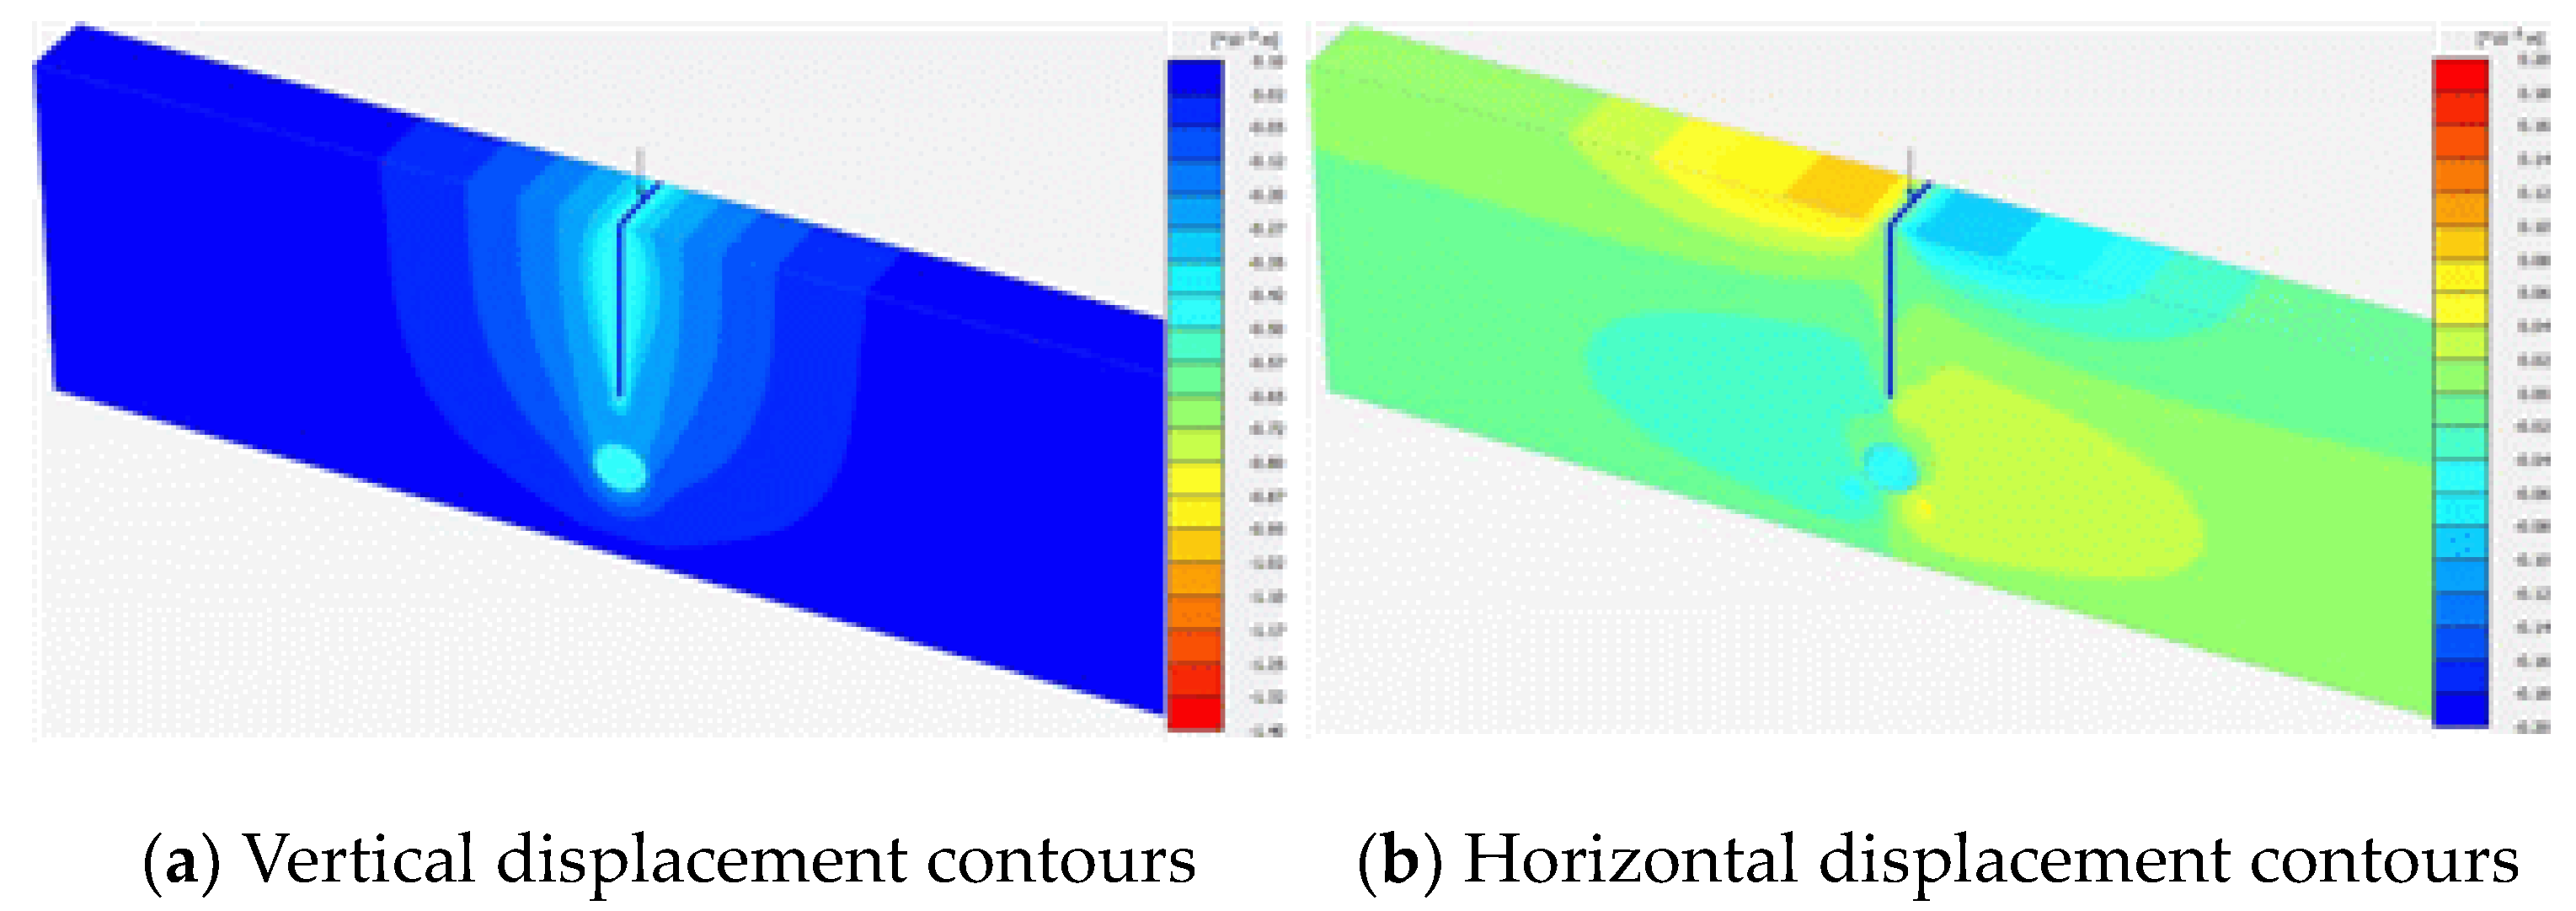
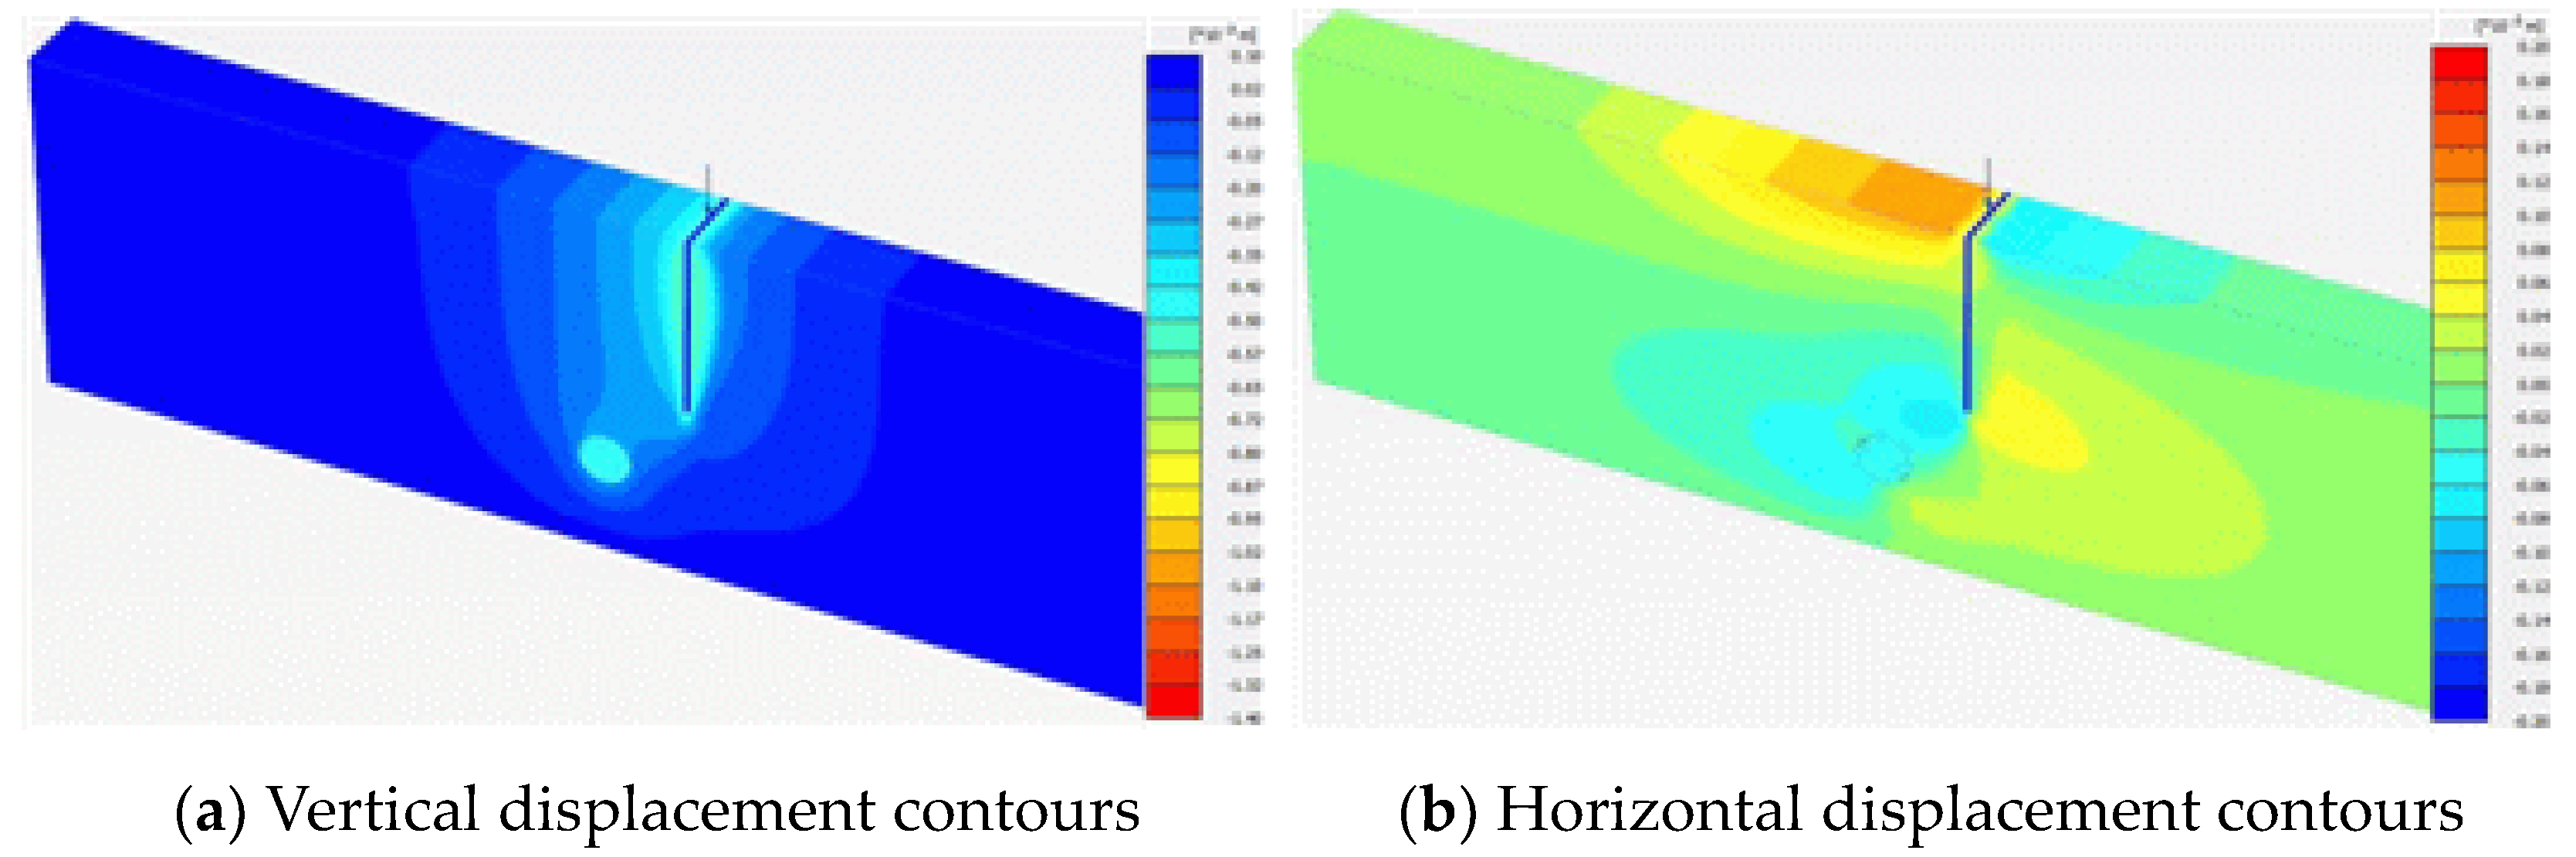
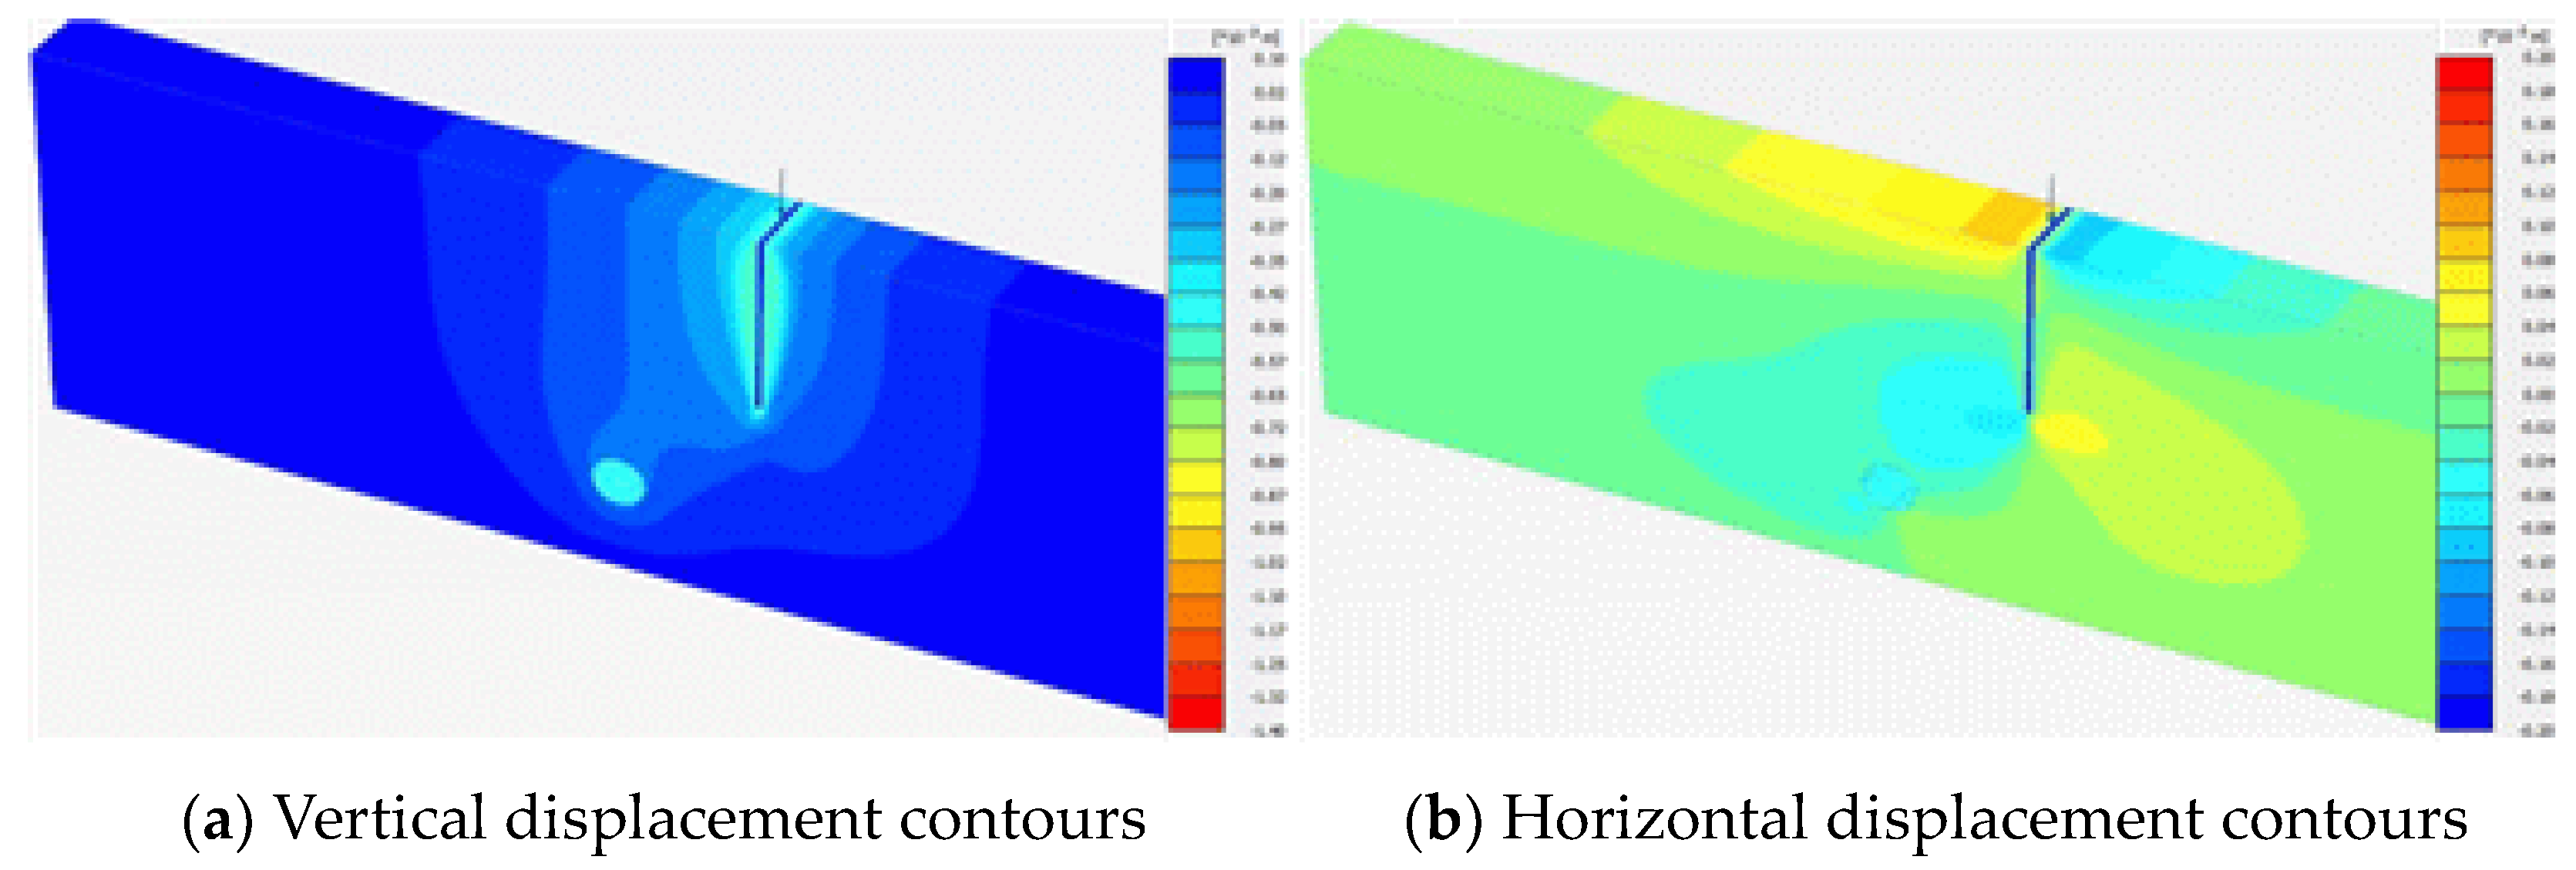
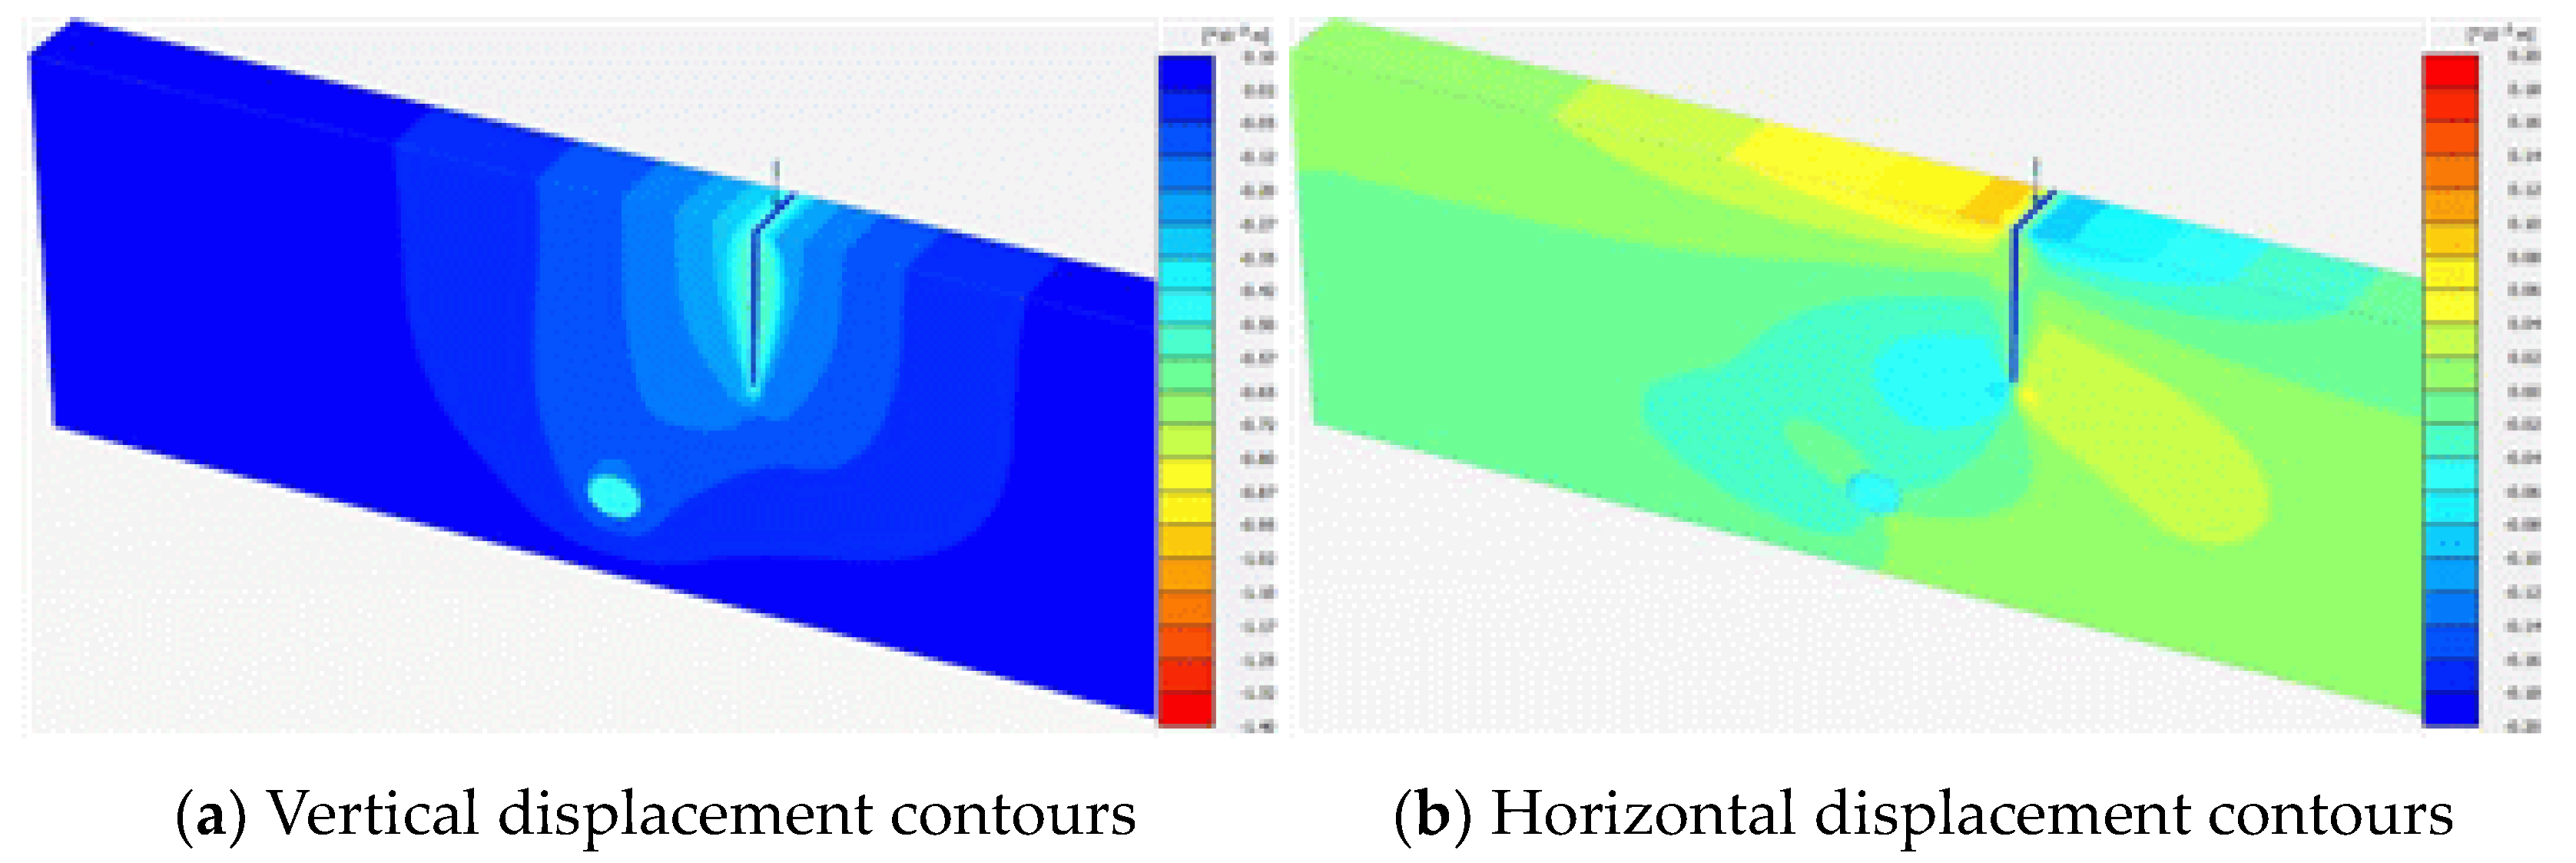
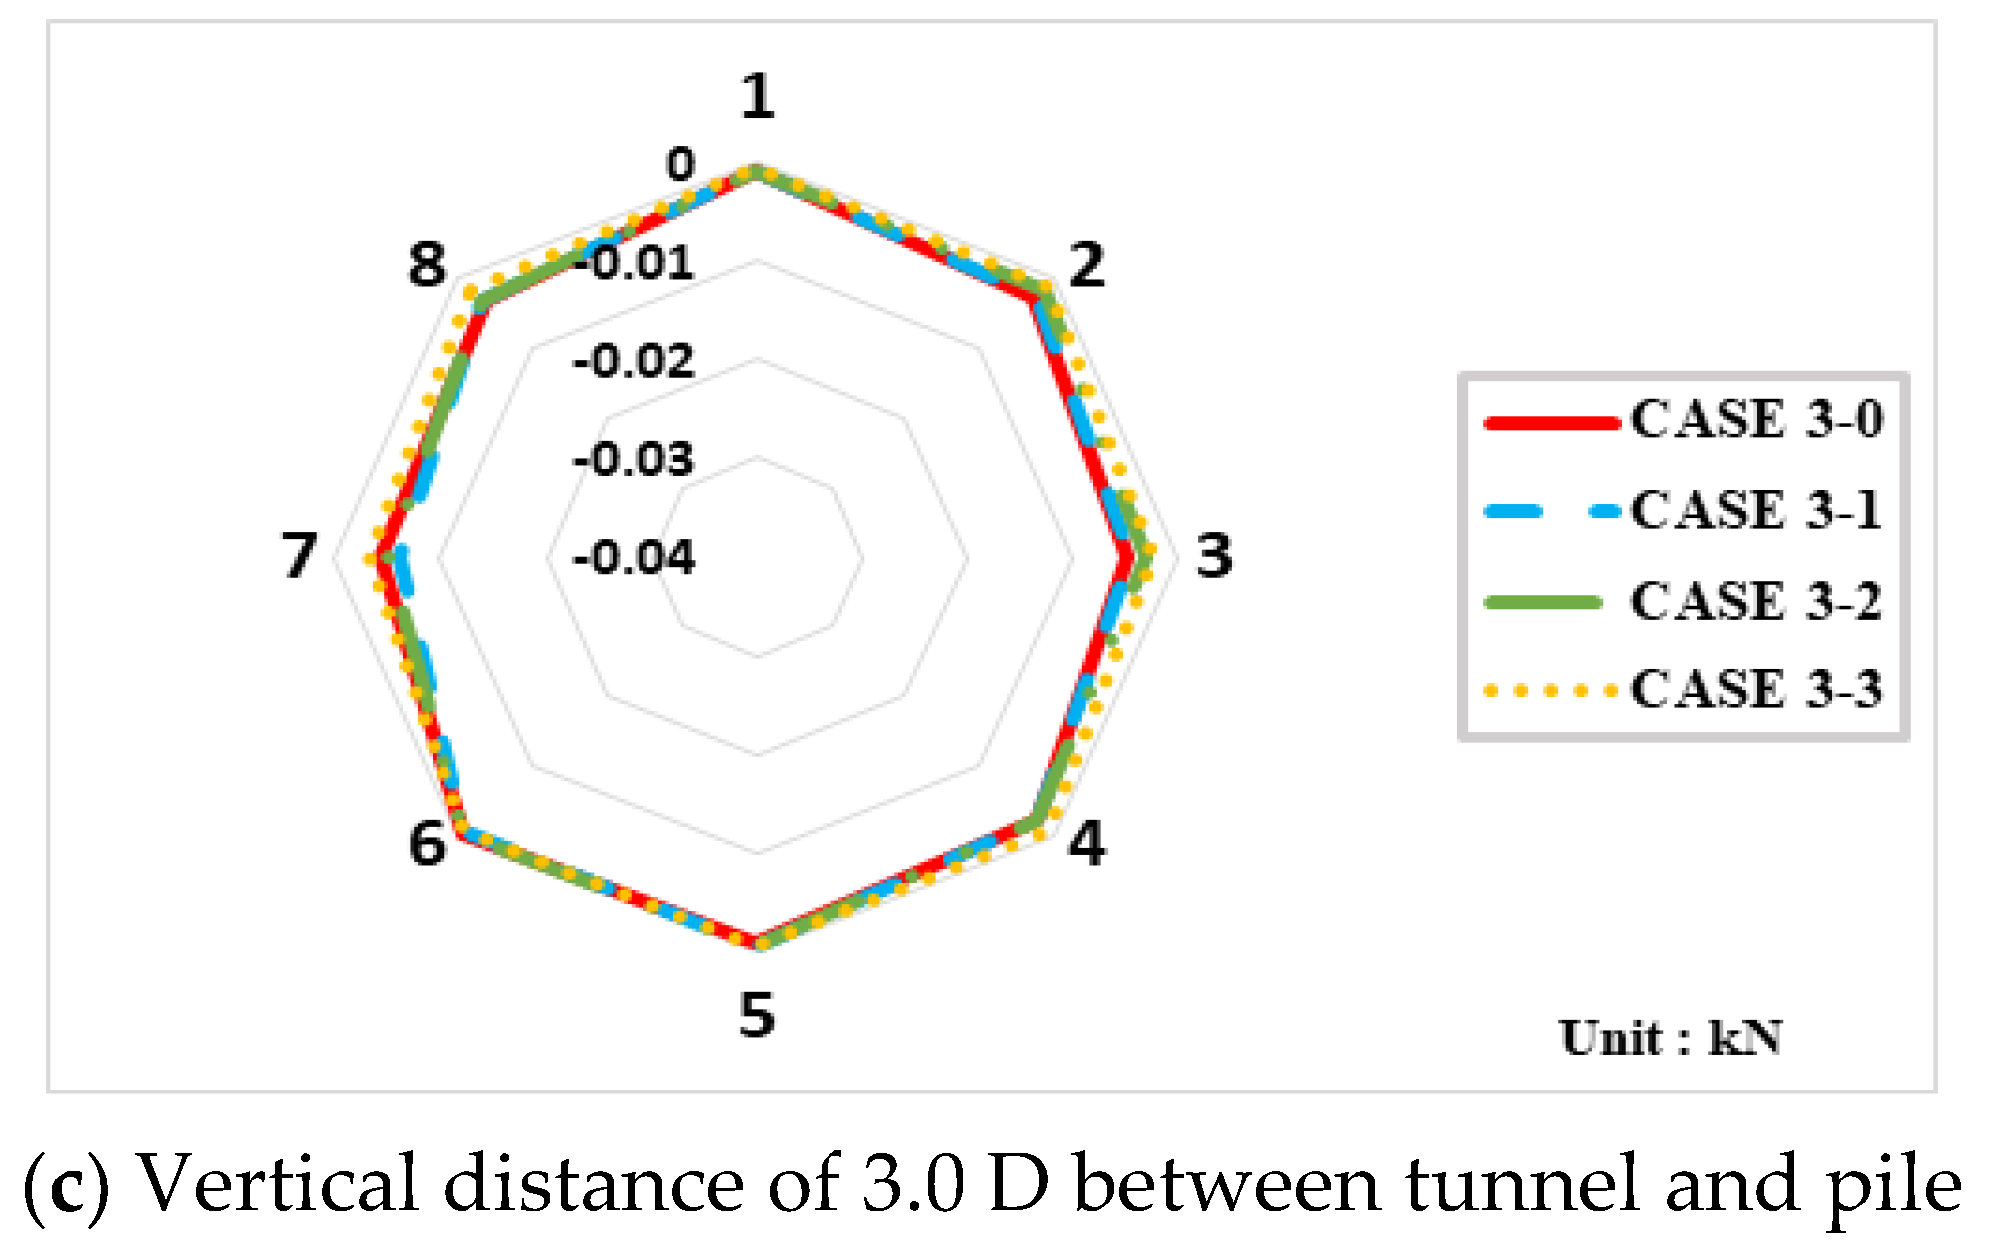
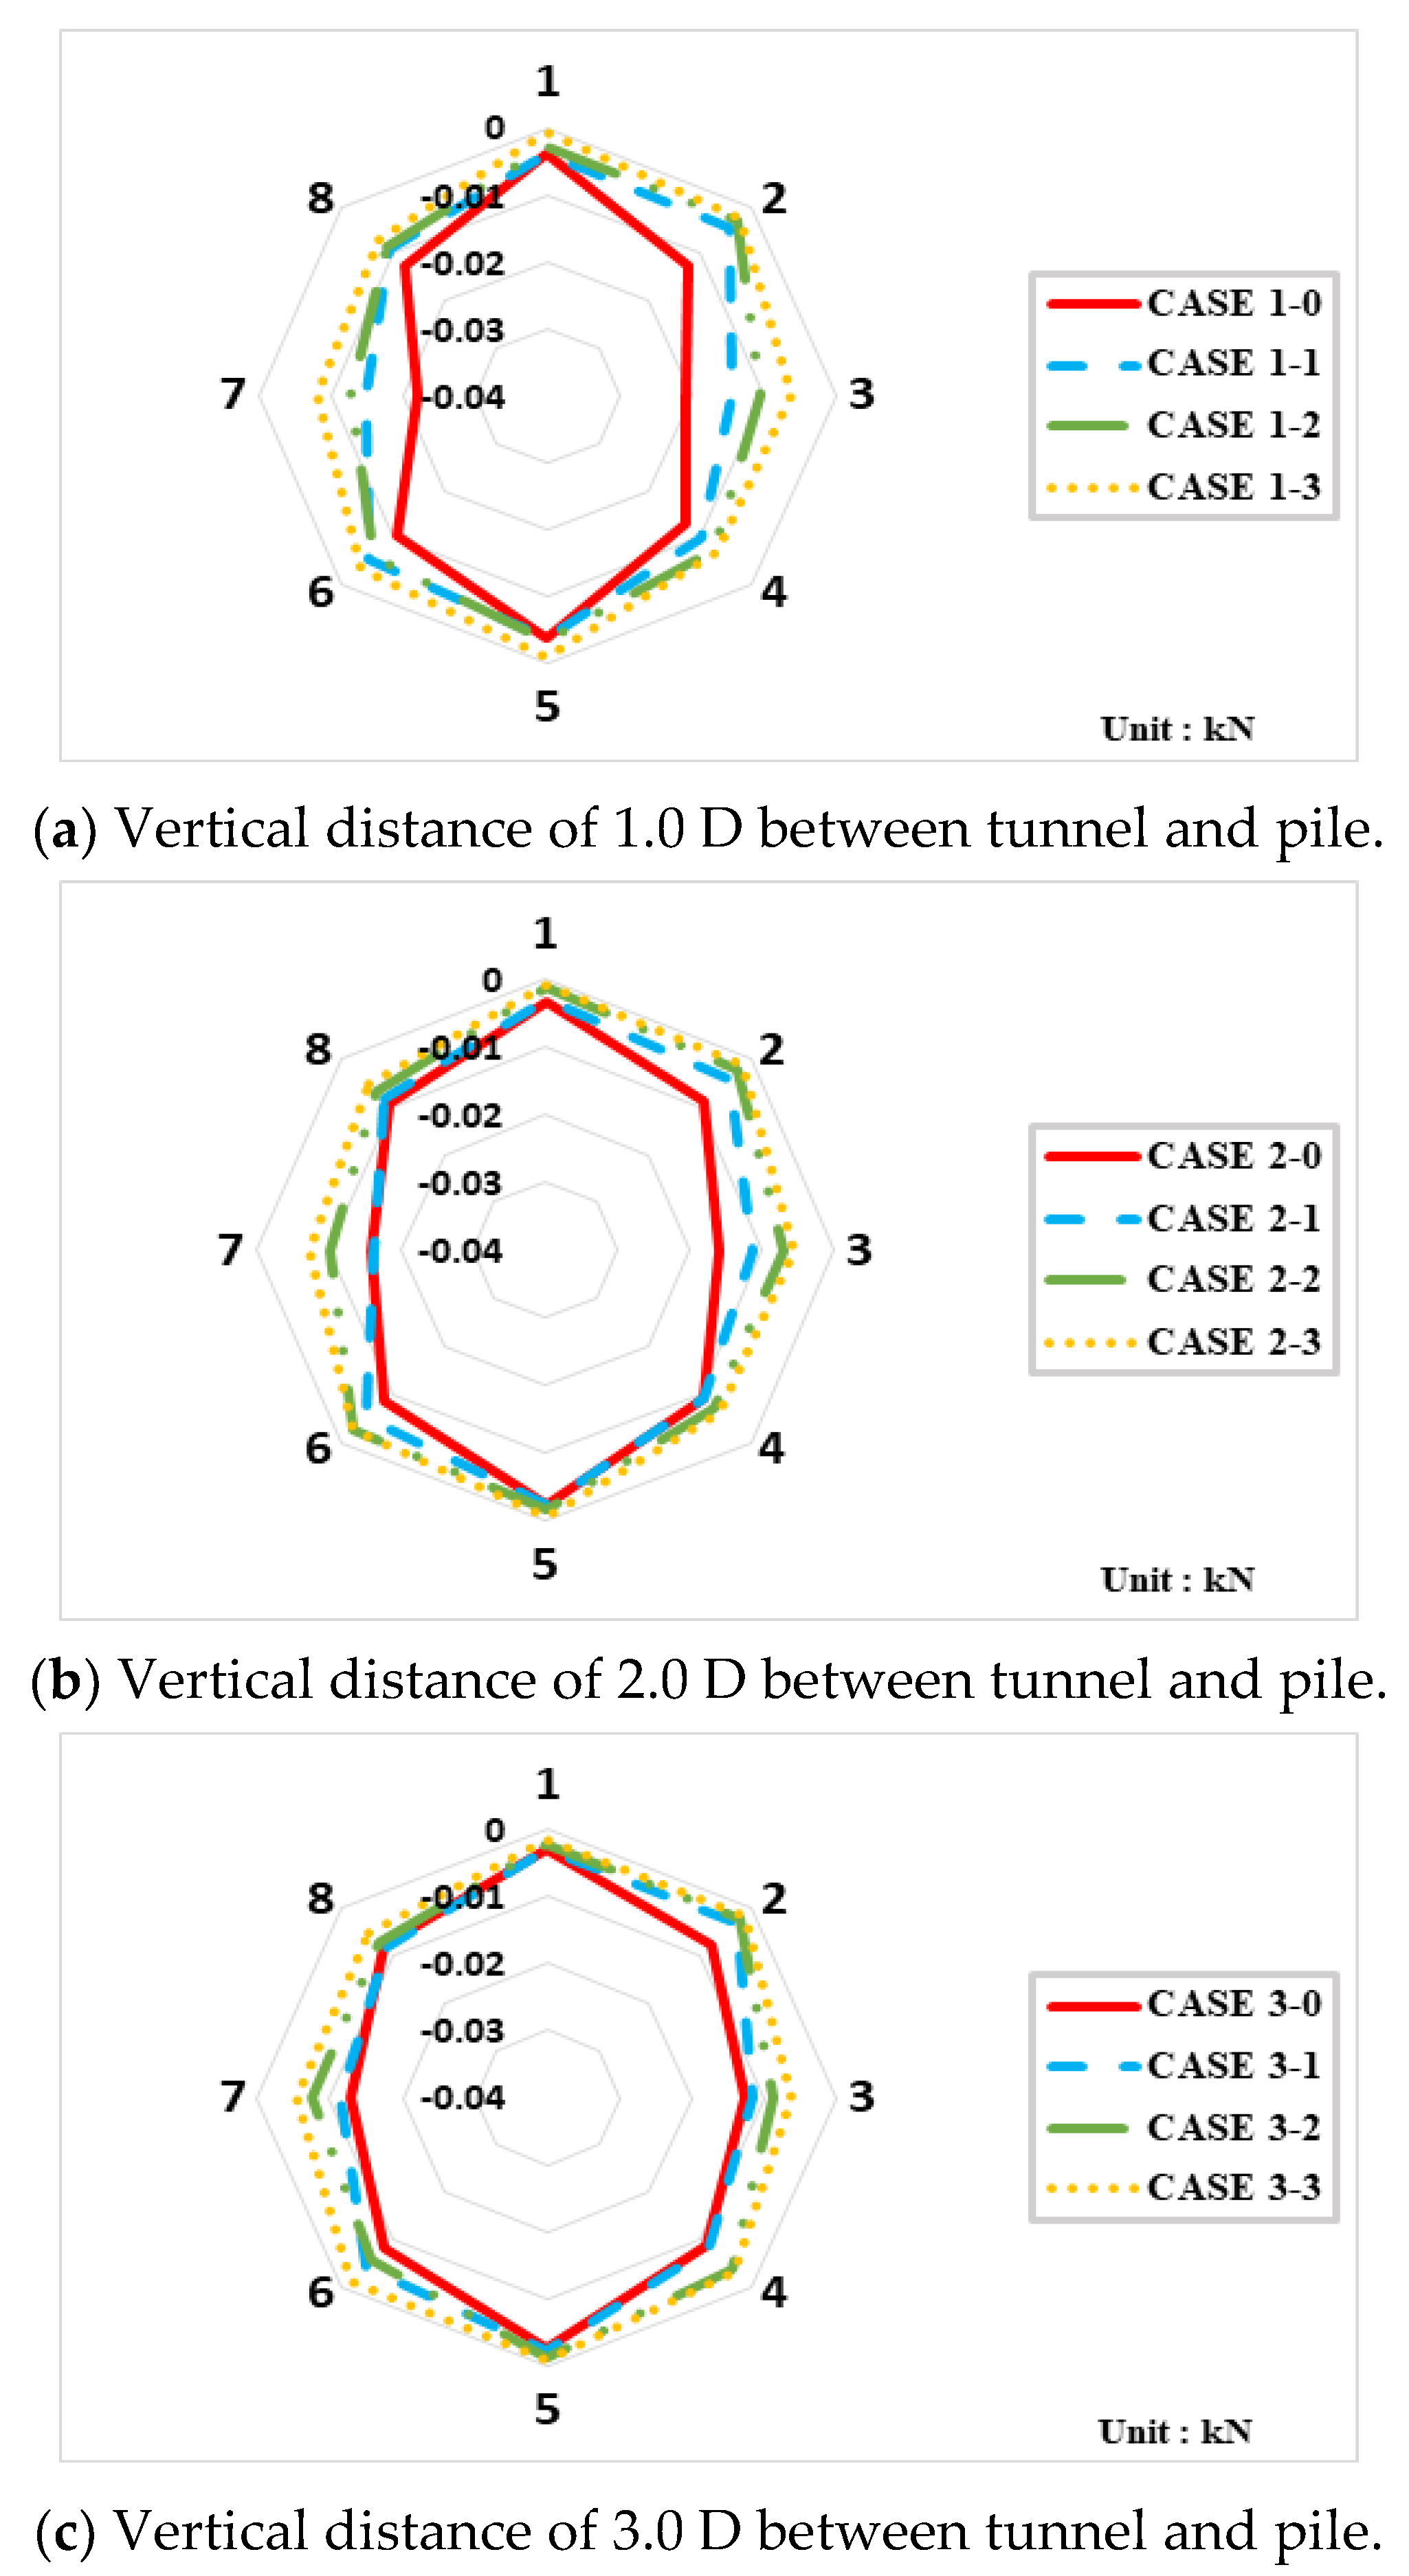
  • The results of the vertical and horizontal displacement contours using numerical analysis show that the tunnel belongs to the influence area by a pile installation. The closer the separation distance, the closer the tunnel will be within the direct influence range. However, where the separation distance is sufficient (case 3-3), it can be seen that the effect of the pile installation is small. So, a sufficient distance between the tunnel and piles is important for the stability of the tunnel.
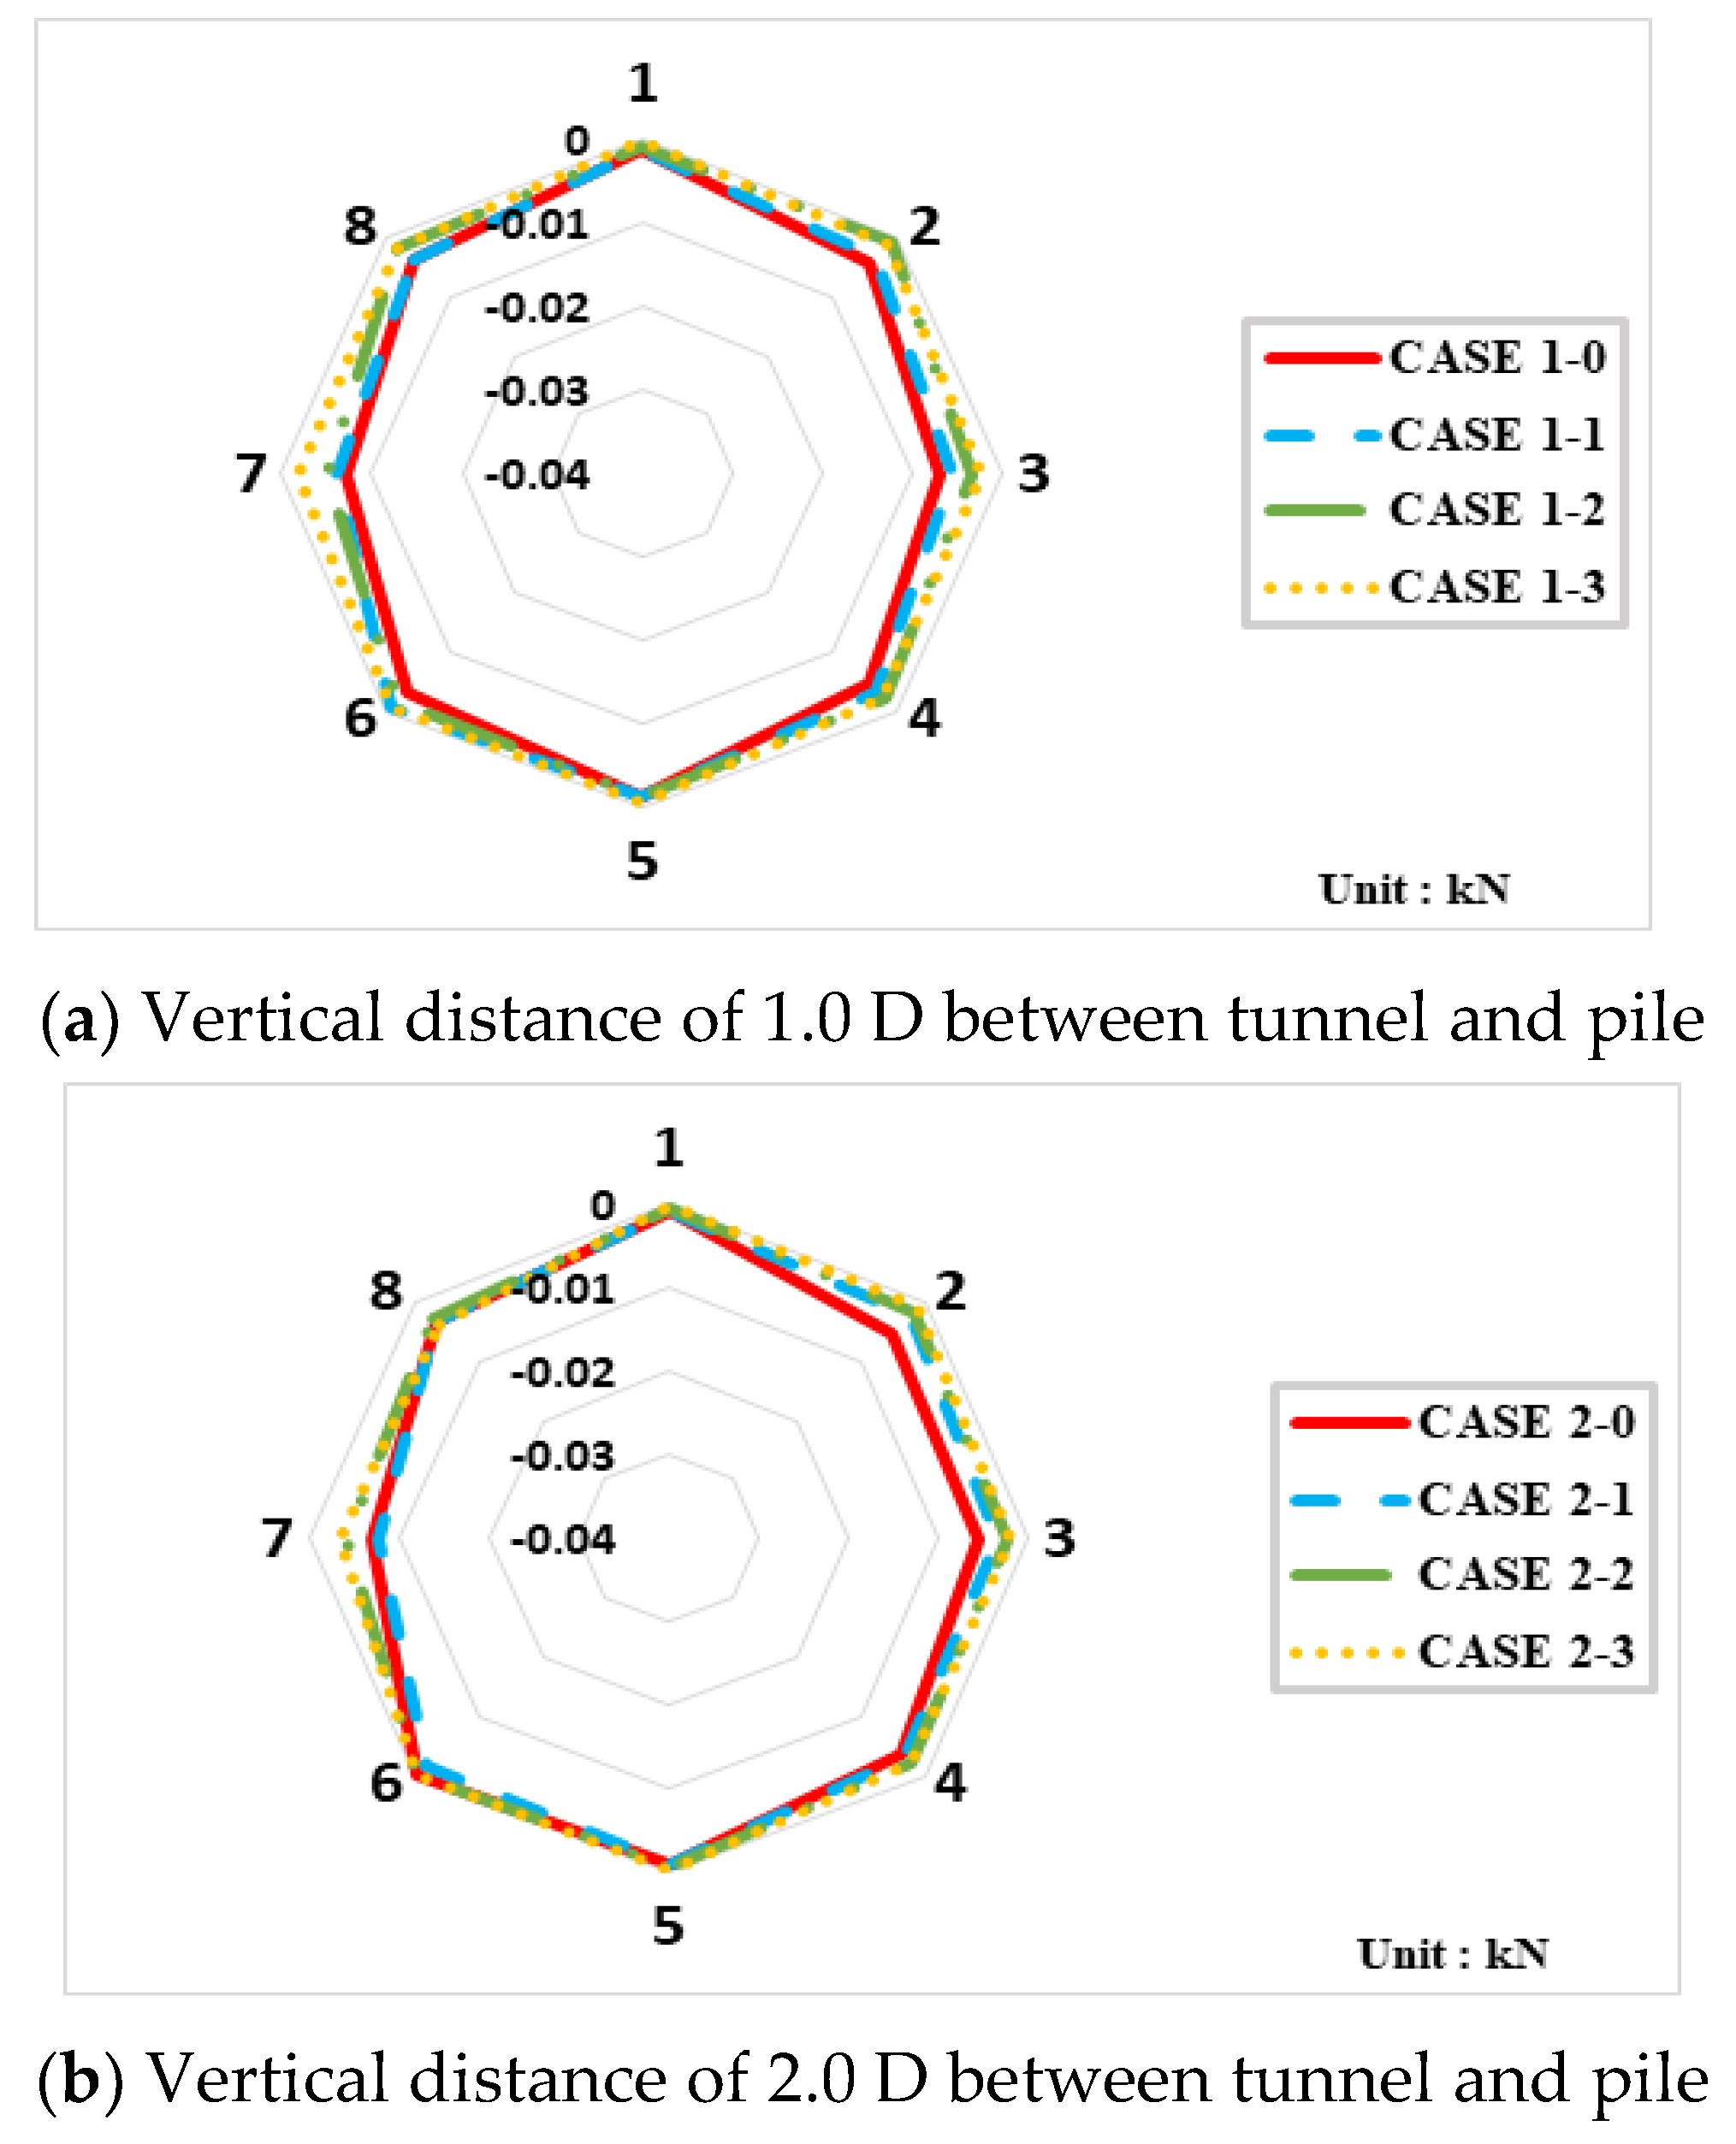
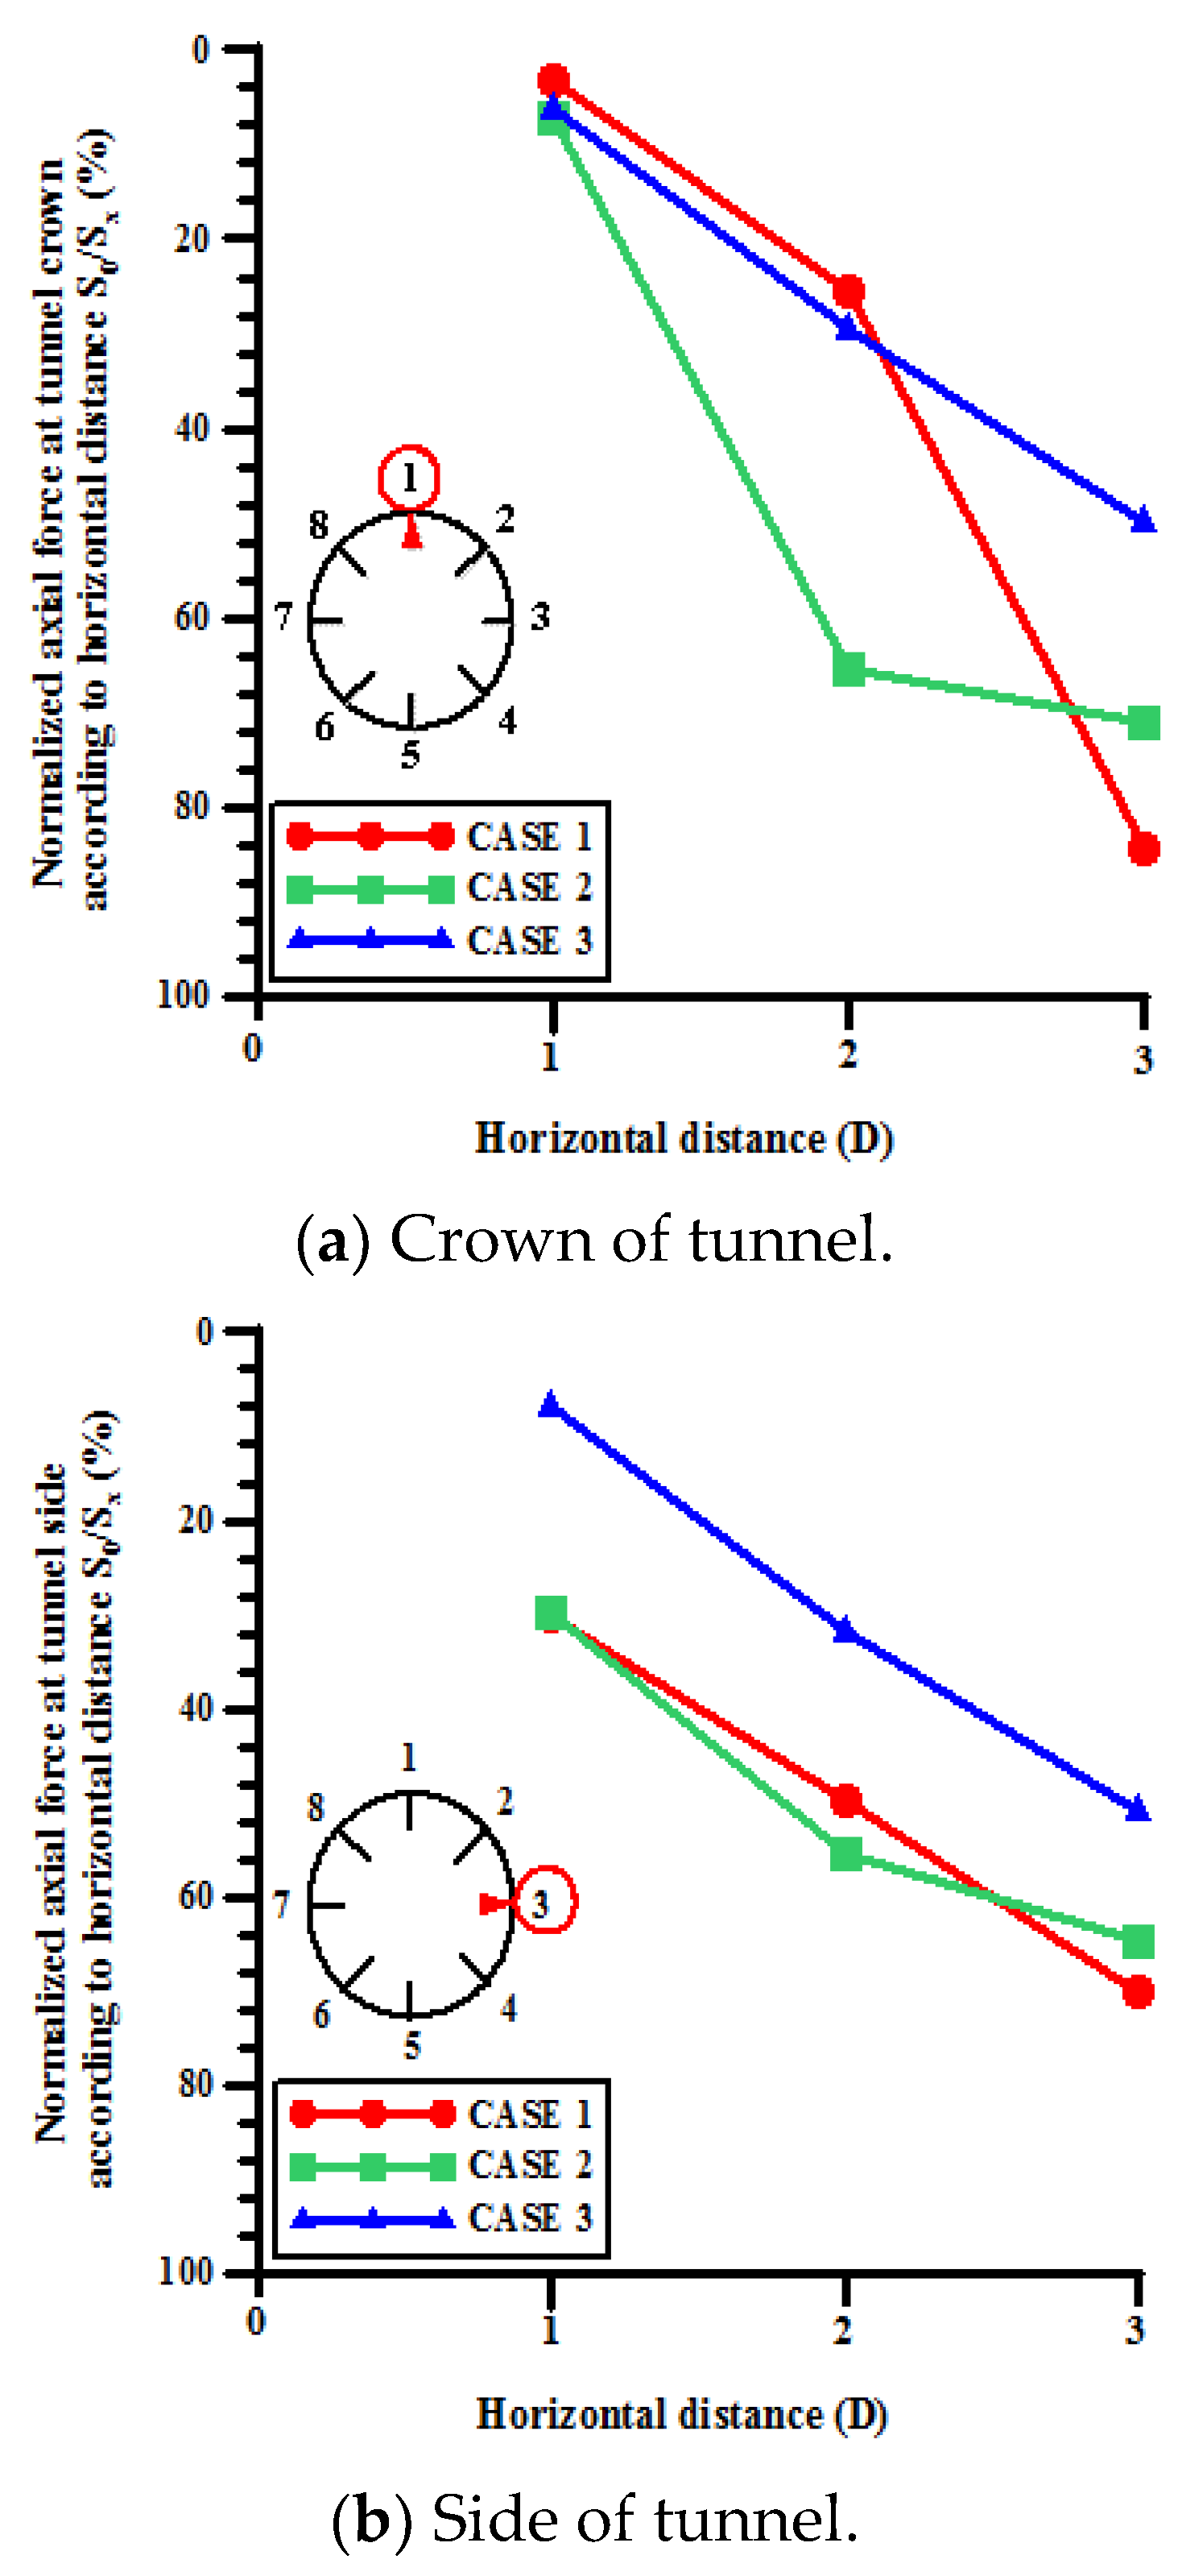
  • When finite element numerical analysis was conducted under the same conditions as the laboratory model test, the axial force decreased by up to 59.5% (allowable load) and 55.6% (ultimate load) at a horizontal distance of 2.0 D, and by up to 69.3% (allowable load) and 70.0% (ultimate load) at a horizontal distance of 3.0 D. This indicates that the regulations of Seoul, which designate the area within 2.0 D of the tunnel diameter as a zone that allows partial construction, and the area beyond 2.0 D as one that allows construction, are reasonable.
  • In the case of constructing piles around an existing tunnel, the suitability of existing regulations on the offset between the existing tunnel and the position of pile installation were determined using a model test and numerical analysis. Through this study, construction with a distance of 2.0 D was considered safe. However, these regulations are conservative, and construction can be performed outside the area that cannot be penetrated by structures at the discretion of the engineer at the site, depending on the site situation or economic factors. Additionally, the case where construction was performed within the offset of 1.0 D was considered dangerous because the reduction rate of the axial force generated at the top and side walls of the tunnel was less than 10%. Moreover, the standard for areas that cannot be penetrated by structures in each country (UK, Japan, and Korea) was less than 1.0 D; hence, additional research on the subject is required.

Author Contributions

S.-M.K. wrote the manuscript and performed the numerical analyses; D.-W.O. investigated and reviewed the material parameters required for the numerical and other analyses; S.-W.L. and C.-Y.K. researched and analyzed the existing literature and relevant data; Y.-J.L. was responsible for the research concept, design, supervision, and final review. All authors have read and agreed to the published version of the manuscript.

Funding

This research was supported by the Korea Agency for Infrastructure Technology Advancement (KAIA) (Project: Research of Advanced Technology for Construction and Operation of Underground Transportation 339 Infrastructure, No. 21UUTI-B157786-02).

Institutional Review Board Statement

Not applicable.

Informed Consent Statement

Not applicable.

Data Availability Statement

Not applicable.

Conflicts of Interest

The authors declare no conflict of interest.

References

  1. Cha, M.S. Aging and wise utilization of infrastructure. In KRIHS Policy Brief; KRIHS: Sejong-si, Korea, 2016; pp. 1–8. [Google Scholar]
  2. Yao, J.; Taylor, R.N.; McNamara, A.M. The effects of loaded bored piles on existing tunnels. In Geotechnical Aspects of Underground Construction in Soft Ground; CRC Press: Boca Raton, FL, USA, 2009; pp. 751–754. [Google Scholar]
  3. Salim, N.M.; Lafta, S.J. The Impact of Driving and Loading Piles on Existing Tunnel. Imp. J. Interdiscip. Res. 2017, 3, 262–270. [Google Scholar]
  4. Lueprasert, P.; Jongpradist, P.; Jongpradist, P.; Suwansawat, S.; Suwansawat, S. Numerical investigation of tunnel deformation due to adjacent loaded pile and pile-soil-tunnel interaction. Tunn. Undergr. Space Technol. 2017, 70, 166–181. [Google Scholar] [CrossRef]
  5. Selemetas, D. The Response of Full-Scale Piles and Piled Structures to Tunnelling. Ph.D. Thesis, University of Cambridge, Cambridge, UK, 2005; p. 1. [Google Scholar]
  6. Choi, B.Y. A Study on Tunnel Behavior by Upper Building Construction. Master’s Thesis, Hanyang University, Seoul, Korea, 2017; pp. 8–17. [Google Scholar]
  7. Farhangi, V.; Karakouzian, M.; Geertsema, M. Effect of micropiles on clean sand liquefaction risk based on CPT and SPT. Appl. Sci. 2020, 10, 3111. [Google Scholar] [CrossRef]
  8. Farhangi, V.; Karakouzian, M. Design of bridge foundations using reinforced micropiles. In Proceedings of the International Road Federation Global R2T Conference & Expo, Las Vegas, NV, USA, 19 November 2019; pp. 1–6. [Google Scholar]
  9. Afsharhasani, R.; Farhangi, V.; Karakouzian, M. Effect of competent caliche layers on measuring the capacity of axially loaded drilled shafts using the Osterberg test. Appl. Sci. 2020, 10, 6169. [Google Scholar] [CrossRef]
  10. Jeon, Y.J.; Jeon, S.C.; Jeon, S.J.; Lee, C.J. A study on the behaviour of pre-existing single piles to adjacent shield TBM tunnelling from three-dimensional finite element analyses. J. Korean Tunn. Undergr. Space Assoc. 2020, 22, 23–46. [Google Scholar]
  11. Japanese Geotechnical Society. Adjacent Construction; Japanese Geotechnical Society: Tokyo, Japan, 1989; pp. 47–61. [Google Scholar]
  12. Seoul Metropolitan Rapid Transit Corporation. Guidelines on Adjacent Excavation on Urban Transit; Seoul Metropolitan Rapid Transit Corporation: Seoul, Korea, 1989; Volume 2001, pp. 29–45.
  13. Yoo, C.S.; Kim, S.B.; Kim, Y.H.; Han, D.H. Time-dependent Deformation Characteristics of Geosynthetic Reinforced Modular Block Walls under Sustained/Cyclic Loading. J. Korean Geotech. Soc. 2007, 23, 5–21. [Google Scholar]
  14. Choi, S.W.; Park, Y.T.; Chang, S.H.; Bae, G.J.; Lee, K.T.; Baek, Y.K. An experimental study on the ground movement around a square pipe by its penetration for trenchless construction in sandy ground. J. Korean Tunn. Undergr. Space Assoc. 2012, 14, 485–501. [Google Scholar] [CrossRef] [Green Version]
  15. Lee, J.H.; Ji, S.B.; Lee, K.C.; Kim, D.W. Analysis of Bearing Capacity Improvement Effect of Inner Cone Penetration Equipped Open-Ended Steel Pipe Pile. J. Korean Geosynth. Soc. 2017, 16, 67–77. [Google Scholar]
  16. Kong, S.M. Effect of Pile Installation on Behaviour of Existing Tunnel and Surrounding Ground Using Model Test and Close Range Photogrammetry. Ph. D Thesis, Seoul National University of Science and Technology, Seoul, Korea, 2020; pp. 1–157. [Google Scholar]
  17. Ministry of Land, Infrastructure and Transport. Tunnel Standard Specifications; Ministry of Land, Infrastructure and Transport: Seoul, Korea, 2015; p. 57.
  18. Ministry of Land, Infrastructure and Transport. Tunnel Design Standards; Ministry of Land, Infrastructure and Transport: Seoul, Korea, 2016; p. 57.
  19. Ahn, B.H. A Study on the Characteristics of the Jumunjin Standard Sand by Triaxial Compression Tests. Master’s Thesis, Changwon University, Changwon, Korea, 2002; pp. 10–11. [Google Scholar]
  20. Shin, J. Geomechanics & Engineering I—Behavior and Modeling; CIR: Seoul, Korea, 2015; pp. 68–73, 150–151.
  21. Kim, Y.S.; Ko, H.W.; Kim, J.H.; Lee, J.G. Dynamic Deformation Characteristics of Joomunjin Standard Sand Using Cyclic Triaxial Test. J. Korean Geotech. Soc. 2012, 28, 53–64. [Google Scholar] [CrossRef]
  22. Cheon, B.S. Geotechnical Engineering—Theory and Reality, 3rd ed.; Goomibook: Seoul, Korea, 2010; pp. 33–34. [Google Scholar]
  23. Bulter, H.D.; Hoy, H.E. User’s Manual for the Texas Quick Load Method for Foundation Load Testing; FHWA-IP-77-8; Federal Highway Administration, Office of Development: Washington, DC, USA, 1977; p. 59.
  24. Bentley Systems, Inc. Plaxis Reference Manual; Bentley Systems, Inc.: Exton, PA, USA, 2019; pp. 347–366. [Google Scholar]
  25. Kwon, O.J.; Kim, D.S.; Park, J.B.; Jeong, S.G. Basic Engineering, 2nd ed.; Goomibook: Seoul, Korea, 2007; pp. 221–233. [Google Scholar]
  26. Shin, J. Geomechanics & Engineering II—Analysis and Design; CIR: Seoul, Korea, 2015; p. 49.
  27. Lambe, T.W.; Whitman, R.V. Soil Mechanics, SI Version; John Wiley & Sons: Sydney, Australia, 1979; pp. 30–31, 147. [Google Scholar]
  28. Das, B.M. Principles of Geotechnical Engineering, 7th ed.; Cengage Learning: San Francisco, CA, USA, 2009; pp. 302–303. [Google Scholar]
  29. Cha, S.H. Review of Tunnel Stability and the Influence of Surrounding Structures during Tunnel Construction; Construction Technology Review, Ssangyong: Pyeongtaek, Korea, 2004; pp. 58–63. [Google Scholar]
  30. Jeong, S.S.; Han, Y.C.; Kim, Y.M.; Kim, D.H. Evaluation of the NATM Tunnel Load on Concrete Lining Using the Ground Lining Interaction Model. KSCE J. Civ. Eng. 2014, 18, 672–682. [Google Scholar] [CrossRef]
  31. Ashab, A.S.M.A.; Ruan, D.; Lu, G.; Bhuiyan, A.A. Finite Element Analysis of Aluminum Honeycombs Subjected to Dynamic Indentation and Compression Loads. J. Mater. 2016, 9, 162. [Google Scholar] [CrossRef] [PubMed] [Green Version]
Figure 1. South Korean infrastructure sectors, with percentage of each sector constructed over 50 years ago [1].
Applsci 11 06904 g001
Figure 2. Size of model test chamber.
Applsci 11 06904 g002
Figure 3. Sand-pouring device and model test chamber.
Applsci 11 06904 g003
Figure 4. Sand-pouring device.
Applsci 11 06904 g004
Figure 5. Model of tunnel.
Applsci 11 06904 g005
Figure 6. Single pile for model test.
Applsci 11 06904 g006
Figure 7. Particle size distribution curve for Joomunjin sand [19].
Applsci 11 06904 g007
Figure 8. Equipment for determining relative density.
Applsci 11 06904 g008
Figure 9. Results of model tunnel strain gauge calibration.
Applsci 11 06904 g009
Figure 10. P-S curve for model test. qu: ultimate load.
Applsci 11 06904 g010
Figure 11. Cases for model test in this study.
Applsci 11 06904 g011
Figure 12. Procedures in model test.
Applsci 11 06904 g012
Figure 13. Axial force on tunnel by allowable load in model test.
Applsci 11 06904 g013aApplsci 11 06904 g013b
Figure 14. Axial force on tunnel by ultimate load in model test.
Applsci 11 06904 g014
Figure 15. Normalized axial force by allowable load according to horizontal offset.
Applsci 11 06904 g015
Figure 16. Normalized axial force by ultimate load according to horizontal offset.
Applsci 11 06904 g016
Figure 17. Pile and tunnel model used in numerical simulation.
Applsci 11 06904 g017
Figure 18. Modeling and mesh for 3D numerical analysis.
Applsci 11 06904 g018
Figure 19. Displacement contours for allowable load (case 1-0).
Applsci 11 06904 g019
Figure 20. Displacement contours for allowable load (case 1-1).
Applsci 11 06904 g020
Figure 21. Displacement contours for allowable load (case 2-2).
Applsci 11 06904 g021
Figure 22. Displacement contours for allowable load (case 3-3).
Applsci 11 06904 g022
Figure 23. Axial force on tunnel by allowable load in 3D numerical analysis.
Applsci 11 06904 g023aApplsci 11 06904 g023b
Figure 24. Axial force on tunnel by ultimate load in 3D numerical analysis.
Applsci 11 06904 g024
Figure 25. Normalized axial force by allowable load according to horizontal offset (3D numerical analysis).
Applsci 11 06904 g025
Figure 26. Normalized axial force by ultimate load according to horizontal offset (3D numerical analysis).
Applsci 11 06904 g026
Table 1. Regulatory standards for tunnel stability near pile construction.
Country Area That Cannot Be Penetrated by Structures
Crown (m)Crown (m)
London Underground Limited standard Applsci 11 06904 i00133
Japanese geotechnical society standard Applsci 11 06904 i00250.5
Seoul Metropolitan Rapid Transit standard Applsci 11 06904 i0034~6
Busan City standard Applsci 11 06904 i00435
Table 2. Properties of sandy soil with various relative densities [21].
Relative Density (Dr)Max.80%70%60%50%40%30%Min.
Density (kN/m3)16.4815.8015.4815.1714.8814.5914.3213.55
Void ratio0.6080.6670.7120.7470.7820.8160.8510.955
Table 3. Measurement of relative density for sandy soil in the laboratory model test.
Test 1Test 2Test 3
Weight of sand (g)309.72310.83310.24
Volume of mold (mm3)207.53207.53207.53
Unit dry weight (kN/m3)14.9214.9814.95
Relative density (%)51.7853.6052.63
Average of Relative density (%)52.67
Table 4. Relationship between relative density and soil condition of the sand [20].
Relative Density (%)Soil Condition
0~15Very loose
15~50Loose
50~70Medium
70~85Dense
85~100Very dense
Table 5. Material properties for numerical analysis.
ParametersSoilPileTunnel
γ (kN/m3)14.95
E (kN/m2)10,00072,000,00072,000,000
ν0.250.340.34
c (kN/m2)0
Φ’ (°)35
Rinter0.7
γ: Unit weight of soil; E: Young’s modulus; ν: Poisson’s ratio; c: cohesion; Φ’: internal friction angle; Rinter: interface factor.
Publisher’s Note: MDPI stays neutral with regard to jurisdictional claims in published maps and institutional affiliations.

