Abstract
The aims of this study were to analyze the within-group weekly metabolic power average (wMPA), weekly acceleration zones (wAcZ), and weekly deceleration zones (wDcZ), in starter and non-starter professional soccer players, based on different periods of the full season (pre-, early-, mid-, and end-season). Twenty-one professional soccer players (age, 28.3 ± 3.8 years; height, 181.2 ± 7.1 cm; body mass, 74.5 ± 7.7 kg; BMI, 22.6 ± 1.0 kg·m2) were monitored during the full season in the highest level of the Iranian Premier League. WMPA, wAcZ, and wDcZ at three different zones (wAcZ1, wAcZ2, wAcZ3, wDcZ1, wDcZ2, wDcZ3) were collected using Global Positioning System. ANOVA was applied to analyze within-group changes across the different periods of the full season. In general, starters presented higher values in the beginning of the season (pre- and early-season) and lower values at mid- and end-season. Specifically, starters showed significant differences in early- vs. mid-season for wMPA, wAcZ1, and wDcZ1 (p < 0.05), plus early- vs. end-season for wMPA and wAcZ1 (p < 0.01). In addition, non-starters showed higher values in the pre-season that decreased until the end-season for wMPA, wAcZ1, and wDcZ1. Regarding wAcZ2, wDcZ2, wAcZ3, and wDcZ3, non-starters presented higher values in early-season that decreased until the end-season. Specifically, non-starters showed significant differences in pre- vs. mid-season for wMPA, wAcZ1, and wDcZ1; pre- vs. end-season for wMPA, wDcZ1, wDccZ2, and wDcZ3; early- vs. mid-season for wMPA, wAcZ1, wDcZ1, wAcZ2, and wDccZ2; early- vs. end-season for wMPA, wAcZ1, wDcZ1, wAcZ2 wDccZ2, wAcZ3, and wDcZ3; and mid- vs. end-season for wMPA, wAcZ1, and wAcZ3 (p < 0.05). In conclusion, starters were revealed to have higher values in pre- and early-season, and lower values in mid- to end-season, while non-starters were revealed to have lower load values in pre- and end-season and higher load values in early- and mid-season. This study provides extra insights over the season for starters and non-starters, respectively. Data can be used by coaches to better training periodization across soccer season.
1. Introduction
In team sports, especially in soccer, the external workload quantification is measured through microtechnology such as Global Positioning Systems (GPS) [1,2,3]. These systems quantify distances covered with different intensities, accelerations, and decelerations that allow to produce other measures such as player load and metabolic power [2,3,4].
It is well-known that high-intensity activities, such as accelerations and decelerations, can contribute to the most decisive action in soccer, such as scoring a goal [5]. In recent studies, higher values of accelerometer-based variables have been related with neuromuscular fatigue, which may increase the likelihood of injury [6,7]. On one hand, accelerations have a higher metabolic cost [8], while decelerations have a higher mechanical load [9]; both actions can produce higher damage on soft-tissue structures due to their association with high load and force impact [10]. On the other hand, when these actions are not properly executed, a higher risk of fatigue and, consequently, injury may occur [11]. Because of these higher number of accelerations and decelerations, better load adjustment is required to avoid negative effects for soccer players. Another variable that could help to better adjust the load through the season is the metabolic power average (MPA), which allows to quantify energy expenditure, which contributes to reflect the average work intensity [12,13]. The concept of this variable estimates the energy demands of acceleration and deceleration derived from GPS, and it assumes that linear acceleration and deceleration are the primary drivers of energy cost [13].
Moreover, soccer matches usually are related to the day of the week with higher workload [14,15]. Thus, they induce significant biochemical and neuromuscular responses related to fatigue [7]. In this sense, only eleven players can participate in a competitive match, and for that reason, there are differences between starter and non-starter players. This also leads to different weekly training loads between starting and non-starting players [16]. These differences and discrepancies in physical workloads, between players with different status, could lead to differences in the training process [17]. Along with these differences, another problem can be to maintain higher levels of physical fitness in the entire team throughout the season, because of the organizational and traditional training practices inherent to professional soccer [18].
During the full season, some load variations may occur. One way to explore these variations are through the analysis of accumulated workload by microcycle and mesocycle across the season [19]. In this sense, some studies analyzed different periods of the season (pre-, early-, mid-, and end-season) in order to verify if starters presented, or not, higher values than non-starters [16,17,20].
However, to the best of the authors’ knowledge, few studies have analyzed the weekly variations of accelerometer and metabolic power variables for starters and non-starters throughout an entire season, which can assist better planning and periodization approaches for training prescriptions [16,17], and no studies have included such variables simultaneously.
For instance, Nobari et al. [16] showed that MPA training monotony and training strain presented higher values for starters than non-starters during the season analyzed in four different periods (pre-, early-, mid- and end-season), with a tendency to decrease from the beginning to the end of the season; while Nobari et al. [17] also found that training monotony and training strain, calculated through the number of accelerations and decelerations, presented higher values for starters than non-starters during the same periods, with pre-season revealing higher values than other periods of the season. None of the previous studies used an accumulated period analysis; instead, the accelerometer-based variables were used through indexes such training monotony and training strain [16,17].
Thus, monitoring the external workloads of starters and non-starters seems to be necessary to reduce overload risk for athletes who start most of the games, as well as to create training strategies in order to increase the weekly workload of non-starters, thereby avoiding a decline in their physical conditioning. The precise knowledge about such workloads on the aforementioned variables can help coaches to create better load adjustments though the season.
Therefore, the aims of this study were (i) to analyze the within-group in the weekly MPA (wMPA) in starter and non-starter professional soccer players, based on different periods of the full season (pre-, early-, mid-, and end-season); and (ii) to analyze the within-group in the weekly acceleration zone 1 (wAcZ1), 2 (wAcZ2), and 3 (wAcZ3); deceleration zone 1 (wDcZ1), 2 (wDcZ2), and 3 (wDcZ3) in starters and non-starters based on pre-, early-, mid-, and end-season. It was hypothesized that starters will present higher values than non-starters across the four periods of the season. Due to a large amount of information, the present manuscript is the second part of an analysis that does not include a comparison between groups. Such comparisons are presented in another study.
2. Materials and Methods
2.1. Experimental Approach to the Problem
For the purposes of the present study, the full season was divided into four periods (pre-season, W1 to W5; early-season, W6 to W19; mid-season, W20 to W35; end-season, W36 to W48) to analyze 21 professional soccer players. These players were divided into starters and non-starters based on previous studies, so starters are those that played at least 60 min per match weekly. If the competition was not held in a week, the division criterion was based on the total training time per week of this division [16,17]. Finally, by considering these two criteria, the players were divided into 10 players in the starters group and 11 players in the non-starters group. The rationale for using two groups with a within-group analysis is supported by previous studies [16,17] which help to explain the difference between starters and non-starters. However, those differences were not analyzed in the present study because they were explored in another study with a between-group analysis [21]. Instead, a within-group analysis for starter and non-starter players on MPA and accelerometer variables derived from the GPS parameters was conducted (Table 1).

Table 1.
Monitoring the periods of the full season.
2.2. Participants
The characteristics of the participating professional soccer players were age, 28.3 ± 3.8 years; height, 181.2 ± 7.1 cm; body mass, 74.5 ± 7.7 kg; BMI, 22.6 ± 1.0 kg·m2. All players belonged to one team that competed in the Iranian Persian Gulf Pro League. Players were monitored for 48 weeks of the 2018–2019 full season. The inclusion criteria were to participate in a minimum of three training sessions per week, and a regular participation in most of the training sessions (80% of weekly training sessions) over the season. The exclusion criteria were (i) the absence for two weeks; (ii) position of goalkeepers due to differences with field players. This research was conducted by the training coaches of the club after setting with the relevant authorities and the head coach in the club. This study was developed according to the Helsinki Declaration and received approval of the research ethics committee from the University of Mohaghegh Ardabili. All players were informed of the purposes of this study and signed the informed consent.
2.3. External Monitoring Measures—Microelectromechanical System
The microelectromechanical systems used in this study were a GPSPORTS Pty Ltd., model: SPI High-Performance Unit (HPU), made in Australia. It was used in all training and competition sessions during the full season for all players. This tool is based on tracking and SPI HPU, including GPS position with 15 Hz; accelerometer: 100 Hz, G Tri-Axial-Track impacts; mag: 50 Hz, three-axis; water resistance and data transmission: infrared and weighs 56 g. The validity and reliability of the device have been confirmed [22]. In addition, and according to Kelly et al. [23], 15 Hz GPS (model: SPI High-Performance Unit HPU, GPSPORTS Systems Pty Ltd., Canberra, Australia) has a “high reliability” with a low coefficient of variation (1.87–2.21%) for acceleration-based variables.
2.4. How to Collect Information
Data export from GPS was performed with the considerations of previous studies [12,13]. Specifically, the GPS device was placed in the belt bag, in a vertically upright position. Before starting the warm-up, all green and red lights were turned on for GPS tracking. At the end of training sessions, the GPS was inserted into the dock station for the device to transfer data by the AMS updated software. All data over the full season was set and collected by Default Zone in the SPI IQ Absolutes. These procedures were repeated for all training sessions.
The variables used from the output data for this study were as follows: 1. training sessions based on minutes; 2. MPA, indicates the amount of average energy consumption per second (W·kg−1) for player activity, with reliability equal to 3–5%. This metric was calculated by the instantaneous energy cost based on an individual’s running speed, acceleration, and deceleration by the GPS (5); 3. AcZ1 (<2 m·s2); 4. AcZ2 (2 to 4 m·s2); 5. AcZ3 (>4 m·s2); 6. DcZ1 (<−2 m·s2); 7. DcZ2 (−2 to −4 m·s2); 8. DcZ3 (>−4 m·s2) [13,16]. Accelerometer variables categories were determined based on the time spent at the intensity of the thresholds which is a valid and reliable way to determine the acceleration of the team sports activities [24]. All MPA, AcZ, and DcZ variables were presented by weekly average data for the different periods and by status (starters and non-starters, respectively).
2.5. Statistical Analysis
The Statistical Package for the Social Sciences (SPSS, version 25.0; IBM SPSS Inc, Chicago, IL, USA) was used for statistical procedures and analyses. Data are presented as mean and standard deviation (SD). Kolmogorov–Smirnov and Levene’s tests were executed to check the normality and homogeneity of data, respectively. Then, inferential tests were conducted. Repeated measures analysis of variance (one-way ANOVA) was applied to analyze within-group changes across the different periods of the season, in all dependent variables for both starter and non-starter soccer players, respectively. Bonferroni post hoc tests were also executed to determine pairwise comparisons outcomes. Significant differences were considered for p ≤ 0.05. Partial eta squared (ηp2) was calculated as effect size of the repeated measures ANOVA. Moreover, Hedge’s g effect size (95% confidence interval) was calculated to determine the magnitude of pairwise comparisons. Hopkins’ thresholds for Cohen d effect size statistics were used, as follows: ≤0.2, trivial; >0.2, small; >0.6, moderate; >1.2, large; >2.0, very large; >4.0, nearly perfect [25].
3. Results
Table 2 illustrates the within-group comparisons of wMPA between the different periods of the season for both starters and non-starters, respectively. The outcomes of repeated measures ANOVA revealed significant differences between season periods for both starters (p < 0.001, ηp2 = 0.827) and non-starters (p < 0.001, ηp2 = 0.909). In particular, pairwise comparisons of wMPA are displayed in the same table and, additionally, to better understand the differences of the variables, are are shown in Figure 1.
Table 2.
Within-group differences for pairwise comparisons between season periods in wMPA for starter and non-starter players.
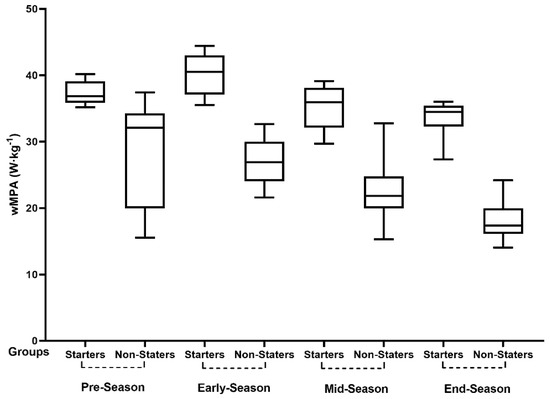
Figure 1.
Pairwise comparisons between season periods in wMPA. WMPA, weekly metabolic power average; W·kg−1, watts per kilogram.
Within-group comparisons of GPS-derived accelerometer variables parameters between the different season periods for both starters and non-starters are displayed in Table 3, Table 4 and Table 5. According to Table 3, analysis of wAcZ1 and wDcZ1 showed significant results for both starters (p = 0.012, ηp2 = 0.467 and p = 0.055, ηp2 = 0.352) and non-starters (p < 0.001, ηp2 = 0.755 and p < 0.001, ηp2 = 0.663), respectively. To better understand the differences of the variables, these are also shown in Figure 2.
Table 3.
Within-group differences for pairwise comparisons between season periods in wAcZ1 and wDcZ1 for both non- and starter players.
Table 4.
Within-group differences for pairwise comparisons between season periods in wAcZ2 and wDcZ2 for both non- and starter players.
Table 5.
Within-group differences for pairwise comparisons between season periods in wAcZ3 and wDcZ3 for both non- and -starters players.
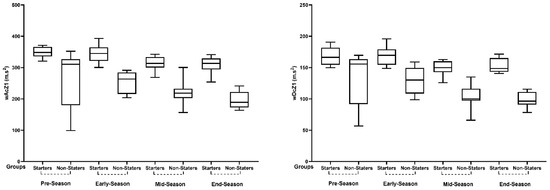
Figure 2.
Pairwise comparisons between season periods in wAcZ1, the average weekly time spent on the acceleration threshold of zone 1 (<2 m·s2) and wDcZ1, the average weekly time spent on the deceleration threshold of zone 1 (>−2 m·s2); m·s−2, meters per second squared.
The results of wAcZ2 and wDcZ2 demonstrated meaningful differences in non-starters (p = 0.001, ηp2 = 0.629 and p < 0.001, ηp2 = 0.746), but no differences with starters (p = 0.271, ηp2 = 0.200 and p = 0.226, ηp2 = 0.220). Subsequently, the above pairwise comparisons are shown in Table 4. To better understand the differences of the variables, these are also shown in Figure 3.
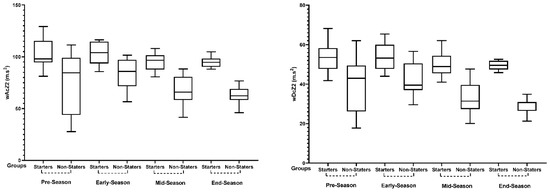
Figure 3.
Pairwise comparisons between season periods wAcZ2, the average weekly time spent on the acceleration threshold of zone 2 (2 to 4 m·s2) and wDcZ2, the average weekly time spent on the deceleration threshold of zone 2 (−2 to −4 m·s2); m·s−2, meters per second squared.
According to Table 5, analysis of wAcZ3 and wDcZ3 showed significant results for non-starters (p = 0.001, ηp2 = 0.603 and p = 0.001, ηp2 = 0.637) respectively. Whereas, in starters only wAcZ3 was significant (p = 0.044, ηp2 = 0.371), and wDcZ3 was not meaningful for this group (p = 0.055, ηp2 = 0.352). Nevertheless, pairwise comparisons aforementioned are displaying in Table 5. As well as, to better understand the differences of the variables are shown in Figure 4.
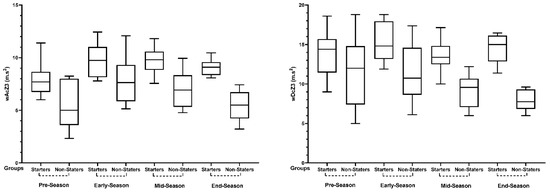
Figure 4.
Pairwise comparisons between season periods in wAcZ3, The average weekly time spent on the acceleration threshold of zone 3 (<4 m·s2) and wDcZ3, The average weekly time spent on the deceleration threshold of zone 3 (<−4 m·s2). m·s−2, meters per second squared.
4. Discussion
This study aimed to analyze within-group in the wMPA, wAcZ1, wAcZ2, wAcZ3, wDcZ1, wDcZ2, and wDcZ3 for starter and non-starter professional soccer players across pre-, early-, mid-, and end-season periods.
Regarding wMPA, starters and non-starters revealed significant variations through the season. Specifically, starters showed higher values in early-season > pre-season > mid-season > end-season, while non-starters presented higher values in pre-season > early-season > mid-season > end-season. The presented results showed a different pattern to those found by Nobari et al.’s [16] study, where starters and non-starters showed significantly higher values in pre-season over early-season for MPA training monotony and strain indexes. Meanwhile, the same study observed a tendency to decrease MPA training monotony and strain indexes from the beginning to the end of the season, which is in line with the present study. Although the present study did not analyze training monotony and training strain, it seems there is a similar tendency of higher values in the pre-season and early-season, which means higher external workloads at the beginning of the season that are reduced until the end of the season.
Despite that MPA was estimated by GPS used in this study, the theoretical basis of this calculation [12,13], its accuracy [26], and reliability [27] supported the use of this measure. Furthermore, MPA is also related with acceleration-based variables, and, as mentioned before, the GPS used in the present study has a high reliability for these variables. Even so, researchers, coaches, and staff may use the values reported in this study as reference, considering this limitation.
Regarding wAcZ1 and wDcZ1, it was observed that starters and non-starters presented higher values in pre- and early-season, and lower values in mid- and end-season, while wAcZ1 showed a decrease from the beginning of the season to the end of the season, and wDcZ1 showed a w-shape variation over the full season for starter players, with only a significant difference between early- vs. mid-season.
In wAcZ2 and wDcZ2, starters presented the highest values in pre-season and early-season, and the lowest values in mid- and end-season, without significant variations. However, non-starters showed some variations for the same variables, where higher values were found in early-season.
Finally, in wAcZ3, starters presented lower values in pre-season and higher values in early- and mid-season. Regarding wDcZ3, the pattern showed a w-shape variation without significant differences. However, in wAcZ3, non-starters showed some variations and higher values in early- to mid-season, but in wDcZ3, they showed higher values in pre-season and early-season, and the lower values were not found until the end of the season. Indeed, and according to the previous study, starters presented significantly higher values for all accelerometer-based variables than non-starters (all p < 0.05), except for wDcZ3 during pre-season, where no significant differences were found (p > 0.05) [21].
Overall, the higher values found in pre- and early-season were similar regarding the status of the players. First, pre-season showed a tendency with higher load, which is sustained by a high training volume and intensity applied in this team. The following period, early-season, showed a tendency to keep higher load, which is reinforced by the tendency of the coaches in applying a higher physiological stimulus to increase the physical conditioning of the players. Then, the load showed a tendency to reduce until the end-season, which could be associated with the recovery activities and strategies to reduce higher levels of fatigue [28], which did not allow players to increase their levels of strength and conditioning across the season [29].
The present findings are in line with a previous study that analyzed training monotony and training strain through the number of accelerations and decelerations [17]. Furthermore, the higher workloads found in pre-season are in line with some studies [19,30,31,32] that used different variables but found the same results, which means that the exercise training program focused on improving physical condition through a higher training load, early in the pre-season [33], despite the small number of matches (n = 1) or training sessions performed (n = 27). Additionally, the higher values found in early-season led us to believe that high-intensity actions were adjusted to give a higher response in matches, because 15 matches and 64 training sessions were performed in this period. According to Nobari et al. [17], the reduction in load could be associated with reduced training volume, provide adequate recovery, and maintain fitness and freshness for starters. The non-starters also revealed the same tendency with lower values, which led us to speculate that non-starters are not the major focus for the coach and, therefore, some adjustments in the load should be applied.
In opposition to other studies [34,35], a statistically significant difference for starters between pre-season and end-season was not found, but the results clearly showed higher values for all variables in pre-season and lower values in end-season. It seems that after pre-season, high-intensity actions decrease, despite some variation occurring until the end of the season. The lower values found in end-season could be associated with the lower number of training sessions and matches compared to the other periods of the season. On the other hand, non-starters revealed statistically significant differences for all variables between pre-season and end-season, except for wAcZ2 and wAcZ3. According to some studies, non-starters show a tendency to produce higher intensity actions when they enter in a match, compared to players that were replaced [35,36], which led us to believe that non-starters provided higher demands in the few minutes that they participated during the matches compared to the training. Thus, we recommend this analysis in future studies.
Despite not being the aim of this study, it is relevant to mention that starters had higher average values for all variables in all periods of the season than non-starters, which is probably associated with the lack of training adjustments for players that do not participate in matches, or with lower match durations. These arguments are in line with previous studies [16,17].
As stated by Clemente et al. [19], the research on accelerometry-based measures and MPA across a full season remains scarce in the literature when they are analyzed over the full-season period, and, consequently, it is difficult to compare the present results with other studies because different accelerometry variables or indexes were used, as well as different periods of the season, or even different use of match data.
Furthermore, the present study constituted several practical applications. For instance, coaches and their staff must consider the results of the present study in order to provide workload adjustments in training sessions, especially for non-starters. Otherwise, non-starters will not achieve better physical fitness to dispute a place as a first choice for a coach. Besides, it will be much more difficult to provide the proper physiological adaptations to these players. In order to better periodize workload across the full season and provide sufficient load to starter and non-starter players, coaches and their staff should quantify external workload variables to acknowledge what kind of stimulus they are providing.
To the best of the authors’ knowledge, this is the first study to examine variations for starters and non-starters through four different periods of the season using metabolic power, accelerations, and decelerations. However, the present study has some limitations. As stated in previous studies [14,15,30,36], the small number of players and teams analyzed is a frequent limitation that occurs in longitudinal studies in elite soccer. Therefore, more studies are required to confirm and generalize the present results. In order to not reduce sample power, player positions were not analyzed. However, we split the sample into two groups (starters and non-starters), but we did not compare them in the study. In addition, it is important to highlight that there are several other aspects that could have affected the variables analyzed in this study, such as tactical and technical performance, and other situational factors such as match result, match location, and quality of the opponents, that were not controlled for this study [36,37,38]. Finally, MPA has not yet been properly validated as reliable through the GPS used in the present study. However, the authors believe that this paper provides relevant data that could be used as a reference for future studies. Meanwhile, future studies regarding validity and reliability of MPA are needed.
5. Conclusions
Starters were revealed to have higher values in pre- and early-season, and lower values in mid- to end-season, while non-starters were revealed to have lower load values in pre- and end-season, and higher load values in early- and mid-season, which means that status differences should be considered when planning and prescribing training workloads across a full season.
The participation in higher number of matches and training sessions seems to result in higher weekly workloads for all variables. Consequently, coaches should plan compensatory training sessions and ensure higher workloads and proper physiological adaptations to non-starters. In opposition, special attention should be given to starters in order to avoid fatigue and injury risk.
Author Contributions
Conceptualization, H.N., R.O., M.S. and J.P.-G.; methodology, H.N., F.C., L.P.A. and R.O.; software, H.N., F.C. and R.O.; validation, H.N., R.O. and J.P.-G.; formal analysis, H.N., R.O. and J.P.-G.; investigation, H.N. and L.P.A.; resources, H.N., R.O., F.C., J.P.-G., M.S. and L.P.A.; writing—original draft preparation, H.N., M.S. and R.O.; writing—review and editing, H.N., R.O., J.P.-G. and L.P.A.; visualization, H.N., R.O., J.P.-G. and L.P.A.; supervision, H.N., R.O., L.P.A. and J.P.-G. All authors have read and agreed to the published version of the manuscript.
Funding
Portuguese Foundation for Science and Technology, I.P., Grant. Award Number UIDP/04748/2020.
Institutional Review Board Statement
The study was conducted according to the guidelines of the Declaration of Helsinki, and approved by the University of Mohaghegh Ardabili Research Ethics Committee.
Informed Consent Statement
Informed consent was obtained from all subjects involved in the study. Written informed consent has been obtained from the players to publish this paper if applicable.
Data Availability Statement
The datasets used and/or analyzed during the current study are available from the corresponding author on reasonable request.
Conflicts of Interest
The authors declare no conflict of interest.
References
- Impellizzeri, F.M.; Marcora, S.M.; Coutts, A.J. Internal and External Training Load: 15 Years On. Int. J. Sports Physiol. Perform. 2019, 14, 270–273. [Google Scholar] [CrossRef]
- Malone, J.J.; Lovell, R.; Varley, M.C.; Coutts, A.J. Unpacking the Black Box: Applications and Considerations for Using GPS Devices in Sport. Int. J. Sports Physiol. Perform. 2017, 12. [Google Scholar] [CrossRef] [Green Version]
- Rago, V.; Brito, J.; Figueiredo, P.; Costa, J.; Barreira, D.; Krustrup, P.; Rebelo, A. Methods to collect and interpret external training load using microtechnology incorporating GPS in professional football: A systematic review. Res. Sports Med. 2020, 28, 437–458. [Google Scholar] [CrossRef]
- Cummins, C.; Orr, R.; O’Connor, H.; West, C. Global positioning systems (GPS) and microtechnology sensors in team sports: A systematic review. Sports Med. 2013, 43, 1025–1042. [Google Scholar] [CrossRef] [PubMed]
- Faude, O.; Koch, T.; Meyer, T. Straight Sprinting is the most Frequent Action in Goal Situations in Professional Football. J. Sports Sci. 2012, 30, 625–631. [Google Scholar] [CrossRef]
- Leduc, C.; Lacome, M.; Buchheit, M. The use of standardised runs (and associated data analysis) to monitor neuromuscular status in team sports players: A call to action. Sport Perform. Sci. Rep. 2020, 1, 1–5. [Google Scholar]
- Harper, D.J.; Carling, C.; Kiely, J. High-Intensity Acceleration and Deceleration Demands in Elite Team Sports Competitive Match Play: A Systematic Review and Meta-Analysis of Observational Studies. Sports Med. 2019, 49, 1923–1947. [Google Scholar] [CrossRef] [PubMed] [Green Version]
- Hader, K.; Mendez-Villanueva, A.; Palazzi, D.; Ahmaidi, S.; Buchheit, M. Metabolic power requirement of change of direction speed in young soccer players: Not all is what it seems. PLoS ONE 2016, 11, e0149839. [Google Scholar] [CrossRef] [PubMed]
- Dalen, T.; Ingebrigtsen, J.; Ettema, G.; Hjelde, G.H.; Wisløf, U. Player load, acceleration, and deceleration during forty-five competitive matches of elite soccer. J. Strength Cond. Res. 2016, 30, 351–359. [Google Scholar] [CrossRef]
- Verheul, J.; Nedergaard, N.J.; Pogson, M.; Lisboa, P.; Gregson, W.; Vanrenterghem, J.; Robinson, M.A. Biomechanical loading during running: Can a two mass-spring-damper model be used to evaluate ground reaction forces for high-intensity tasks? Sports Biomech. 2019. [Google Scholar] [CrossRef] [PubMed]
- Harper, D.J.; Kiely, J. Damaging nature of decelerations: Do we adequately prepare players? BMJ Open Sport Exerc. Med. 2018, 4, e000379. [Google Scholar] [CrossRef] [Green Version]
- Di Prampero, P.E. Sprint running: A new energetic approach. J. Exp. Biol. 2005, 208, 2809–2816. [Google Scholar] [CrossRef] [Green Version]
- Osgnach, C.; Poser, S.; Bernardini, R.; Rinaldo, R.; di Prampero, P.E. Energy Cost and Metabolic Power in Elite Soccer: A New Match Analysis Approach. Med. Sci. Sports Exerc. 2010, 42, 170–178. [Google Scholar] [CrossRef] [PubMed]
- Oliveira, R.; Brito, J.; Martins, A.; Mendes, B.; Marinho, D.A.; Ferraz, R.; Marques, M.C. In-Season Internal and External Training Load Quantification of an Elite European Soccer Team. PLoS ONE 2019, 14, e0209393. [Google Scholar] [CrossRef] [PubMed] [Green Version]
- Oliveira, R.; Brito, J.P.; Martins, A.; Mendes, B.; Calvete, F.; Carriço, S.; Ferraz, R.; Marques, M.C. In-season training load quantification of one-, two-and three-game week schedules in a top European professional soccer team. Physiol. Behav. 2019, 201, 146–156. [Google Scholar] [CrossRef] [PubMed]
- Nobari, H.; Praça, G.M.; Clemente, F.M.; Pérez-Gómez, J.; Carlos-Vivas, J.; Ahmadi, M. Comparisons of new body load and metabolic power average workload indices between starters and non starters: A full-season study in professional soccer players. Proc. Inst. Mech. Eng. Part P J. Sports Eng. Technol. 2021. [Google Scholar] [CrossRef]
- Nobari, H.; Oliveira, R.; Clemente, F.M.; Adsuar, J.C.; Pérez-Gómez, J.; Carlos-Vivas, J.; Brito, J.P. Comparisons of accelerometer variables training monotony and strain of starters and non starters: A full-season study in professional soccer players. Int. J. Environ. Res. Public Health 2020, 17, 6547. [Google Scholar] [CrossRef] [PubMed]
- Anderson, L.; Orme, P.; Di Michele, R.; Close, G.L.; Milsom, J.; Morgans, R.; Drust, B.; Morton, J. Quantification of Seasonal-Long Physical Load in Soccer Players with Different Starting Status from the English Premier League: Implications for Maintaining Squad Physical Fitness. Int. J. Sports Physiol. Perform. 2016, 11, 1038–1046. [Google Scholar] [CrossRef] [Green Version]
- Clemente, F.M.; Clark, C.; Castillo, D.; Sarmento, H.; Nikolaidis, P.T.; Rosemann, T.; Knechtle, B. Variations of Training Load, Monotony, and Strain and Dose-Response Relationships with Maximal Aerobic Speed, Maximal Oxygen Uptake, and Isokinetic Strength in Professional Soccer Players. PLoS ONE 2019, 14, e0225522. [Google Scholar] [CrossRef] [Green Version]
- Nobari, H.; Castillo, D.; Clemente, F.M.; Carlos-Vivas, J.; Pérez-Gómez, J. Acute, chronic and acute/chronic ratio between starters and non-starters professional soccer players across a competitive season. Proc. Inst. Mech. Eng. Part P J. Sports Eng. Technol. 2021. [Google Scholar] [CrossRef]
- Nobari, H.; Chen, Y.-S.; Clemente, F.M.; Kargarfard, M.; Carlos-Vivas, J.; Pérez-Gómez, J. Comparisons of accelerometer variables acute, chronic and acute/chronic workload ratio between starters and non-starters: A full-season study in professional soccer players. Sci. Sports 2021, No.SCISPO-D-20-00286 in press. [Google Scholar]
- William, J.; Tessaro, E. Validity and reliability of a 15 Hz GPS device for court-based sports movements. Sport Perform. Sci. Rep. 2018, 29, 1–4. [Google Scholar]
- Kelly, S.J.; Murphy, A.J.; Watsford, M.L.; Austin, D.; Rennie, M. Reliability and validity of sports accelerometers during static and dynamic testing. Int. J. Sports Physiol. Perform. 2015, 10, 106–111. [Google Scholar] [CrossRef]
- Delaney, J.A.; Cummins, C.J.; Thornton, H.R.; Duthie, G.M. Importance, Reliability, and Usefulness of Acceleration Measures in Team Sports. J. Strength Cond. Res. 2018, 32, 3485–3493. [Google Scholar] [CrossRef] [Green Version]
- Hopkins, W.; Marshall, S.; Batterham, A.; Hanin, J. Progressive statistics for studies in sports medicine and exercise science. Med. Sci. Sports Exerc. 2009, 41, 3. [Google Scholar] [CrossRef] [PubMed] [Green Version]
- Rampinini, E.; Alberti, G.; Fiorenza, M.; Riggio, M.; Sassi, R.; Borges, T.O.; Coutts, A.J. Accuracy of GPS devices for measuring high-intensity running in field-based team sports. Int. J. Sports Med. 2015, 36, 49–53. [Google Scholar] [CrossRef] [PubMed] [Green Version]
- Buchheit, M.; Manouvrier, C.; Cassirame, J.; Morin, J.B. Monitioring locomotor load in soccer: Is metabolic power, powerful? Int. J. Sports Med. 2015, 36, 1149–1155. [Google Scholar] [PubMed] [Green Version]
- Moreira, A.; Bilsborough, J.C.; Sullivan, C.J.; Ciancosi, M.; Aoki, M.S.; Coutts, A.J. The Training Periodization of Professional Australian Football Players During an Entire AFL Season. Int. J. Sports Physiol. Perform. 2015, 10, 566–571. [Google Scholar] [CrossRef]
- Malone, J.; Di Michele, R.; Morgans, R.; Burgess, D.; Morton, J.; Drust, B. Seasonal Training-Load Quantification in Elite English Premier League Soccer Players. Int. J. Sports Physiol. Perform. 2015, 10, 489–497. [Google Scholar] [CrossRef] [Green Version]
- Clemente, F.M.; Silva, R.; Castillo, D.; Arcos, A.L.; Mendes, B.; Afonso, J. Weekly Load Variations of Distance-Based Variables in Professional Soccer Players: A Full-Season Study. Int. J. Environ. Res. Public Health 2020, 17, 3300. [Google Scholar] [CrossRef]
- Clemente, F.M.; Silva, R.; Ramirez-Campillo, R.; Afonso, J.; Mendes, B.; Chen, Y.S. Accelerometry-based variables in professional soccer players: Comparisons between periods of the season and playing positions. Biol. Sport 2020, 37, 389–403. [Google Scholar] [CrossRef]
- Arcos, A.L.; Mendez-Villanueva, A.; Martínez-Santos, R. In-Season Training Periodization of Professional Soccer Players. Biol. Sport 2017, 34, 149–155. [Google Scholar] [CrossRef] [PubMed]
- Meckel, Y.; Doron, O.; Eliakim, E.; Eliakim, A. Seasonal Variations in Physical Fitness and Performance Indices of Elite Soccer Players. Sports 2018, 6, 14. [Google Scholar] [CrossRef] [Green Version]
- Dragijsky, M.; Maly, T.; Zahalka, F.; Kunzmann, E.; Hank, M. Seasonal Variation of Agility, Speed and Endurance Performance in Young Elite Soccer Players. Sports 2017, 5, 12. [Google Scholar] [CrossRef] [PubMed] [Green Version]
- Fessi, M.S.; Zarrouk, N.; Filetti, C.; Rebai, H.; Elloumi, M.; Moalla, W. Physical and anthropometric changes during pre-and in-season in professional soccer players. J. Sports Med. Phys. Fitness 2016, 56, 1163–1170. [Google Scholar]
- Carling, C.; Espié, V.; Le Gall, F.; Bloomfield, J.; Jullien, H. Work-rate of substitutes in elite soccer: A preliminary study. J. Sci. Med. Sport 2010, 13, 253–255. [Google Scholar] [CrossRef] [PubMed]
- Oliveira, R.; Brito, J.P.; Loureiro, N.; Padinha, V.; Ferreira, B.; Mendes, B. Does the distribution of the weekly training load account for the match results of elite professional soccer players? Physiol. Behav. 2020, 225, 113118. [Google Scholar] [CrossRef]
- Oliveira, R.; Brito, J.M.; Loureiro, N.; Padinha, V.; Ferreira, B.; Mendes, B. Effects of match location, match result and the quality of opposition in training load on a two-matches week in a top-class elite European soccer team. Cuad. Psicol. Dep. 2021, 21, 183–197. [Google Scholar]
Publisher’s Note: MDPI stays neutral with regard to jurisdictional claims in published maps and institutional affiliations. |
© 2021 by the authors. Licensee MDPI, Basel, Switzerland. This article is an open access article distributed under the terms and conditions of the Creative Commons Attribution (CC BY) license (https://creativecommons.org/licenses/by/4.0/).