Article

Contribution of Particle–Wall Distance and Rotational Motion of a Single Confined Elliptical Particle to the Effective Viscosity in Pressure-Driven Plane Poiseuille Flows

Department of Mechanical Engineering, Kyoto Institute of Technology, Kyoto 606-8585, Japan
*
Author to whom correspondence should be addressed.
Appl. Sci. 2021, 11(15), 6727; https://doi.org/10.3390/app11156727
Submission received: 8 June 2021 / Revised: 19 July 2021 / Accepted: 20 July 2021 / Published: 22 July 2021
(This article belongs to the Special Issue Multiphase Flows in Microfluidics: Fundamentals and Applications)

Abstract

:
Rheological properties of the suspension flow, especially effective viscosity, partly depend on spatial arrangement and motion of suspended particles. It is important to consider effective viscosity from the microscopic point of view. For elliptical particles, the equilibrium position of inertial migration in confined state is unclear, and there are few studies on the relationship between dynamics of suspended particles and induced local effective viscosity distribution. Contribution of a single circular or elliptical particle flowing between parallel plates to the effective viscosity was studied, focusing on the particle–wall distance and particle rotational motion using the two-dimensional regularized lattice Boltzmann method and virtual flux method. As a result, confinement effects of the elliptical particle on the equilibrium position of inertial migration were summarized using three definitions of confinement. In addition, the effects of particle shape (aspect ratio and confinement) on the effective viscosity were assessed focusing on the particle–wall distance. The contribution of particle shape to the effective viscosity was found to be enhanced when the particle flowed near the wall. Focusing on the spatial and temporal variation of relative viscosity evaluated from wall shear stress, it was found that the spatial variation of the local relative viscosity was larger than temporal variation regardless of the aspect ratio and particle–wall distance.

1. Introduction

Suspension flows are ubiquitous in industrial process such as filtration, cosmetics, and food processing and also in nature such as mud and blood flow. Rheological properties of a suspension flow partly depend on its microstructure, which refers to spatial arrangement and orientation of suspended particles [1]. Rheological properties of suspension play important roles in terms of product quality; therefore, it is important to reveal the relationship between macroscopic rheological properties of suspensions and their microstructures to handle suspension rheology effectively.
In a channel flow, suspended particles migrate transversal to the streamlines and converge at the equilibrium position due to inertial effects. This phenomenon is known as the “tubular pinch effect” or “Segré–Silberberg effect”. Segré and Silberberg [2] found that rigid spheres in a Poiseuille flow through a tube accumulate at about 0.6 tube radii from the axis. After these findings, many attempts have been made to clarify the mechanism of inertial migration and to extend this phenomenon to broad applications. We have observed that the microstructure of a suspension changes in time mainly due to inertial effects of the suspended particles [3]. Such inertial effects might be significant in practical cases, such as industrial flow or blood flow; therefore, it is important to consider inertial migration.
Strictly speaking, suspended particles are commonly not always spherical in nature, i.e., non-spherical shapes should be considered. Chen et al. [4] investigated the motion of an elliptical particle in plane Poiseuille flow. The numerical results showed that the equilibrium position of the particle with higher aspect ratio is closer to the center of the channel. Wen et al. [5] also numerically investigated the inertial migration of the elliptical particle, and they showed that the equilibrium position of the elliptical particle changes with aspect ratio. However, in these previous studies, confinement, which is the ratio of particle size to the channel diameter (or width), or particle concentration was not kept constant with changing aspect ratio. It is important to take into account not only aspect ratio but also confinement when suspension rheology is considered because effective viscosity strongly depends on confinement as well as particle concentration.
Effective viscosity of a dilute suspension including spheres was firstly studied and summarized by Einstein [6]. According to his theory, the effective viscosity can be expressed as
η eff = η 0 ( 1 + [ η ] ϕ ) ,
where ηeff is the effective viscosity, η0 is the viscosity of the solvent, [η] is the intrinsic viscosity, and ϕ is solid volume fraction in three-dimensional conditions or area fraction in two-dimensional conditions. Intrinsic viscosity [η] is also called shape index because it depends on particle shape; for example, [η] = 2 [7] for a rigid circular particle and [η] = 2.3 [8] for an elliptical porous particle for Darcy number Da = 10−12 with aspect ratio AR = 2 in two-dimensional conditions. Jeffery [9] extended Einstein’s work to the case of ellipsoidal particles. He investigated the motion of a single ellipsoid in a shear flow and found that increase of viscosity can be represented by modifying the intrinsic viscosity. Huang et al. [10] numerically demonstrated that the intrinsic viscosity of spheroids depends on rotational mode such as tumbling or log rolling mode. They showed that the intrinsic viscosity agrees well with Jeffery’s analytical solution for various aspect ratios. Doyeux et al. [11] studied the effects of confinement on the effective viscosity of two-dimensional suspensions. They found that intrinsic viscosity is also a function of confinement. As particle size becomes larger, intrinsic viscosity also increases. However, for the elliptical particle, the confinement effect is unclear due to ambiguity in the definition of confinement when comparing with different shapes.
It is important to consider rheological properties, especially effective viscosity, from the microscopic point of view in field of bioengineering. We have observed that suspension flow with homogeneously scattered rigid circular particles shows undulating wall shear stress (WSS) distribution due to existence of suspended particles [12,13]. Xiong and Zhang [14] simulated red blood cells flowing in microvessels to examine the induced WSS variation. They showed real dynamic features of WSS distributions. However, to the best of our knowledge, there are few studies on the relationship between dynamics of suspended particles, such as red blood cells, and induced local WSS distribution. Jou et al. [15] reported that ruptured aneurysms are more exposed to low WSS. It is important to investigate additional WSS distribution changes due to particle motion.
The aim of this study was to investigate the effects of particle–wall distance and rotational motion of elliptical particles on the effective viscosity considering confinement effects. Two-dimensional numerical simulations were conducted using the regularized lattice Boltzmann method and virtual flux method. The equilibrium position of inertial migration was investigated for various aspect ratios by introducing three definitions of confinement for elliptical particles. In addition, the spatial and temporal variations of relative viscosity were also evaluated.

2. Numerical Methods

2.1. Computational Models

We carried out two-dimensional numerical simulations of pressure-driven plane Poiseuille flow including a single circular or elliptical particle. Figure 1 shows the simulation model. The particle was initially located at the lower side and constrained in the y-directional motion (details in Section 2.5). The computational domain was set to width D = 400 µm and length L = 4D = 1600 µm with a periodic boundary condition with pressure difference in the flow direction [12] to reduce the computational costs. In Section 3.1, the effects of periodic length and grid resolution are assessed. The computational domain was filled with an orthogonal grid of equal spacing Δx = Δy = 0.5 μm. The Reynolds number was set to Re = 32 for all simulations to consider inertial effects.
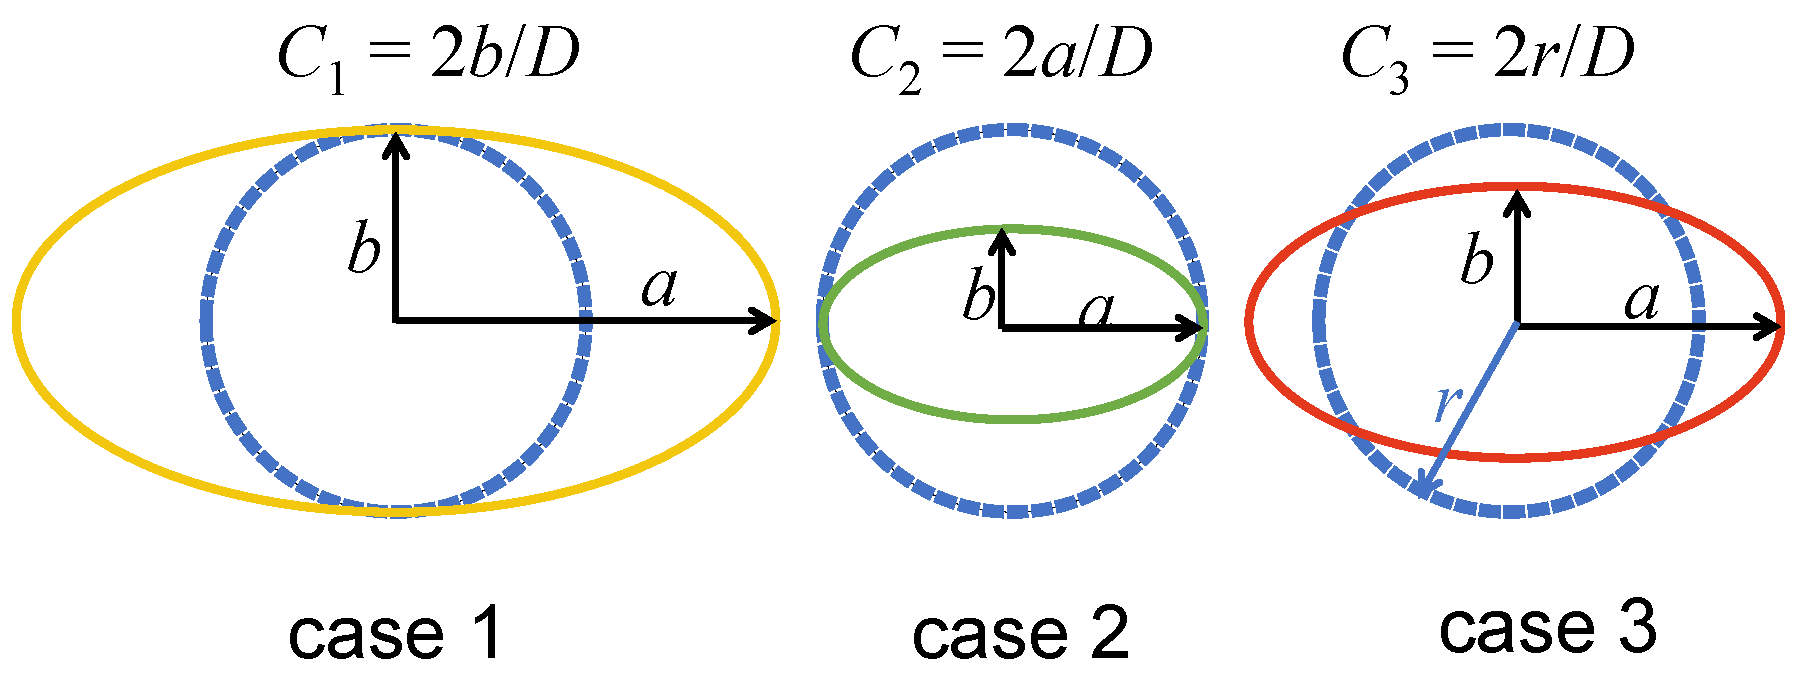
The suspended particle was assumed to be rigid, neutrally buoyant, and non-Brownian. Aspect ratio was set to AR = 1, 2, and 4. Confinement is usually defined as the ratio of particle size to the channel width; however, when the particle is non-spherical, it is difficult to define it uniquely. Therefore, in this study, it was defined using three different characteristic lengths as follows: C1 = 2b/D, C2 = 2a/D, and C3 = 2r/D, where a is semi-major axis, b is semi-minor axis, and r is equivalent radius of the circular particle with the same area as shown in Figure 2. Case 1 is for comparison of the same minor diameter. Case 2 is for comparison of the same major diameter. Case 3 is for comparison of the same area for different aspect ratios. The parameters of confinement were set to C3 = 0.05, 0.1, and 0.2, which corresponds to the area fraction ϕ = 0.05%, 0.20%, 0.79%.
In the studies on the inertial migration using numerical simulation, the comparison in case 2 (same major diameter) is often adopted [5,16]. Chen et al. [4] adopted the comparison similar to case 1 (the confinement increases as increasing aspect ratio). However, comparison in case 3 (with the same area fraction (particle concentration)) should be considered for rheological evaluation because the effective viscosity is predominantly dependent on particle concentration. Başaǧaoǧlu et al. [17] adopted case 3 to compare the different geometrical shapes of particles in settling or flowing particle simulation. However, they investigated only trajectories of particles, and equilibrium positions of the inertial migration were not discussed. From the above background, these three definitions of confinement effects are discussed in this study.

2.2. Governing Equation for Fluid Part

The regularized lattice Boltzmann method (RLBM) [18] was used as a governing equation for the fluid part. This method is based on the lattice Boltzmann method (LBM). RLBM maintains simplicity, efficiency, and good scalability for parallel computing of LBM; in addition, it can reduce sufficient memory usage.
The distribution function fα for the lattice Boltzmann equation can be written as
f α = w α ( a 0 + b i e α i + c i j e α i e α j + d i j k e α i e α j e α k + ) .
The expansion of the distribution function up to second-order moment is equivalent to incompressible Navier–Stokes equations; therefore, the distribution function is approximated as
f α     w α ( a 0 + b i e α i + c i j j e α i e α j ) ,
where eα is the discrete velocity vector and subscript α represents velocity direction. The distribution functions propagate with velocities restricted to a finite set of discrete vectors, which is modeled in the DnQm model (m denotes discrete velocities in n dimensions). The D2Q9 model [19] was applied in our simulations. This model is one of the most common lattice speed models for two-dimensional lattice Boltzmann simulations and it has the following nine discrete lattice velocity vectors:
e   α = { c ( 0 , 0 ) ( α = 0 ) c ( cos ( α 1 ) π 2 ,   sin ( α 1 ) π 2 ) ( α = 1 4 ) 2 c   ( cos ( 2 α 9 ) π 4 ,   sin ( 2 α 9 ) π 4 ) ( α = 5 8 )
In this model, weight coefficients wα are defined as follows:
w α = { 4 / 9       ( α = 0 ) 1 / 9       ( α = 1 4 ) 1 / 36   ( α = 5 8 ) ,
The parameters a0, bi, and cij are determined to satisfy the following relationships:
α f α = ρ ,
α f α e α i = ρ u i ,
α e α i e α j   f α   = c 2 3 ρ δ i j + ρ u i u j   + Π i j neq ,
where ρ is the fluid density, u is the fluid velocity vector, c is the lattice speed defined as c = δ x / δ t , δ i j is the Kronecker delta, and Π i j neq is the non-equilibrium part of the stress tensor. The lattice units of   δ x   = 1 and δ t   = 1 were used in this study. The parameters a0, bi, and cij are expressed by ρ, u, and Π i j neq . The distribution function fα can therefore be written as
f α = w α ρ [ 1 + 3 ( e α i u i ) c 2 + 9 ( e α i u i ) 2 2 c 4 3 ( u i u i ) 2 c 2 ] + 9 w α 2 c 2 ( e α i e α j c 2 1 3 δ i j ) Π i j neq .
The first term on the right-hand side is equal to Maxwell equilibrium function f α   eq . The second term on the right-hand side is described as   f α   1 , and the distribution function f α   is expressed by
f α = f α   eq + f α   1 .
The time evolution equation for the regularized lattice Boltzmann equation is then
f α ( t + δ t ,   x + e α δ t ) = f α   eq ( t ,   x ) + ( 1 1 τ )   f α   1 ( t ,   x ) ,
where τ is single relaxation time defined using kinetic viscosity of fluid ν as follows:
τ = 3 ν c δ x + 1 2 .
The single relaxation time τ was set to 0.88 for all simulations.
In addition, local pressure distribution function p α introduced by He et al. [20] was applied to simulate incompressible flow. Local pressure distribution function p α is
p α = c s 2   f α ,
where cs is the sound speed, and c s = c   /   3 in this model. Therefore, the time evolution equation for solving the fluid part is
p α ( t + δ t ,   x + e α δ t ) = p α   eq ( t ,   x ) + ( 1 1 τ )   p α   1 ( t ,   x ) .
Accordingly, the pressure p, the velocity components ui, and the non-equilibrium part of the stress tensor Π i j neq are given by
  p = α p α ,
u i = 1 ρ c s 2 α p α e α i ,
Π i j neq = 1 c s 2 ( α e α i e α j p α c 2 3 p δ i j c 2 3 ρ u i u j ) .
In the programming for the regularized lattice Boltzmann method, only pressure (Equation (15)), velocity components (Equation (16)), and non-equilibrium part of the stress tensor components (Equation (17)) need to be stored in the array to solve the time evolution equation (Equation (14)). The distribution function can be obtained from the parameters above, i.e., it does not need to be stored in the memory. Thus, this method is useful to reduce the computational memory usage compared to the original lattice Boltzmann method.

2.3. Governing Equation for Particles

The translational motion of a particle is determined by solving Newton’s equation
m d   2 x p d t 2 = F p ,
where m is mass of the suspended particle,   x p is the position vector, and F p is the total force vector acting on the particle. The rotational motion of a particle is determined by the equation of angular motion
I d   2 θ p d t 2 = T p ,
where I is the moment of inertia, θ p is the particle angle, and T p is the torque exerted on the particle. The mass of the suspended particle m and moment of inertia I are m = ρ p π a b and I = m ( a 2 + b 2 ) / 4 , where ρ p is the density of the particle. Both these two equations were discretized with the third-order Adams–Bashforth method and third-order Adams–Moulton method.
According to Mei et al. [21], the component of shear stress tensor τi, j in D dimension is given by
τ i ,   j = ( 1 1 2 τ ) α f α   neq ( t   ,   x ) ( e α ,   i e α ,   j 1 D e α · e α δ i ,   j ) ,
where f α   neq is
f α   neq ( t   ,   x ) = f α ( t ,   x )   f α   eq ( t ,   x ) .
The shear stress vector τw = ( τ x, τ y) is calculated using stress tensor Tw on the particle surface as follows:
τ w = T w · n   ,
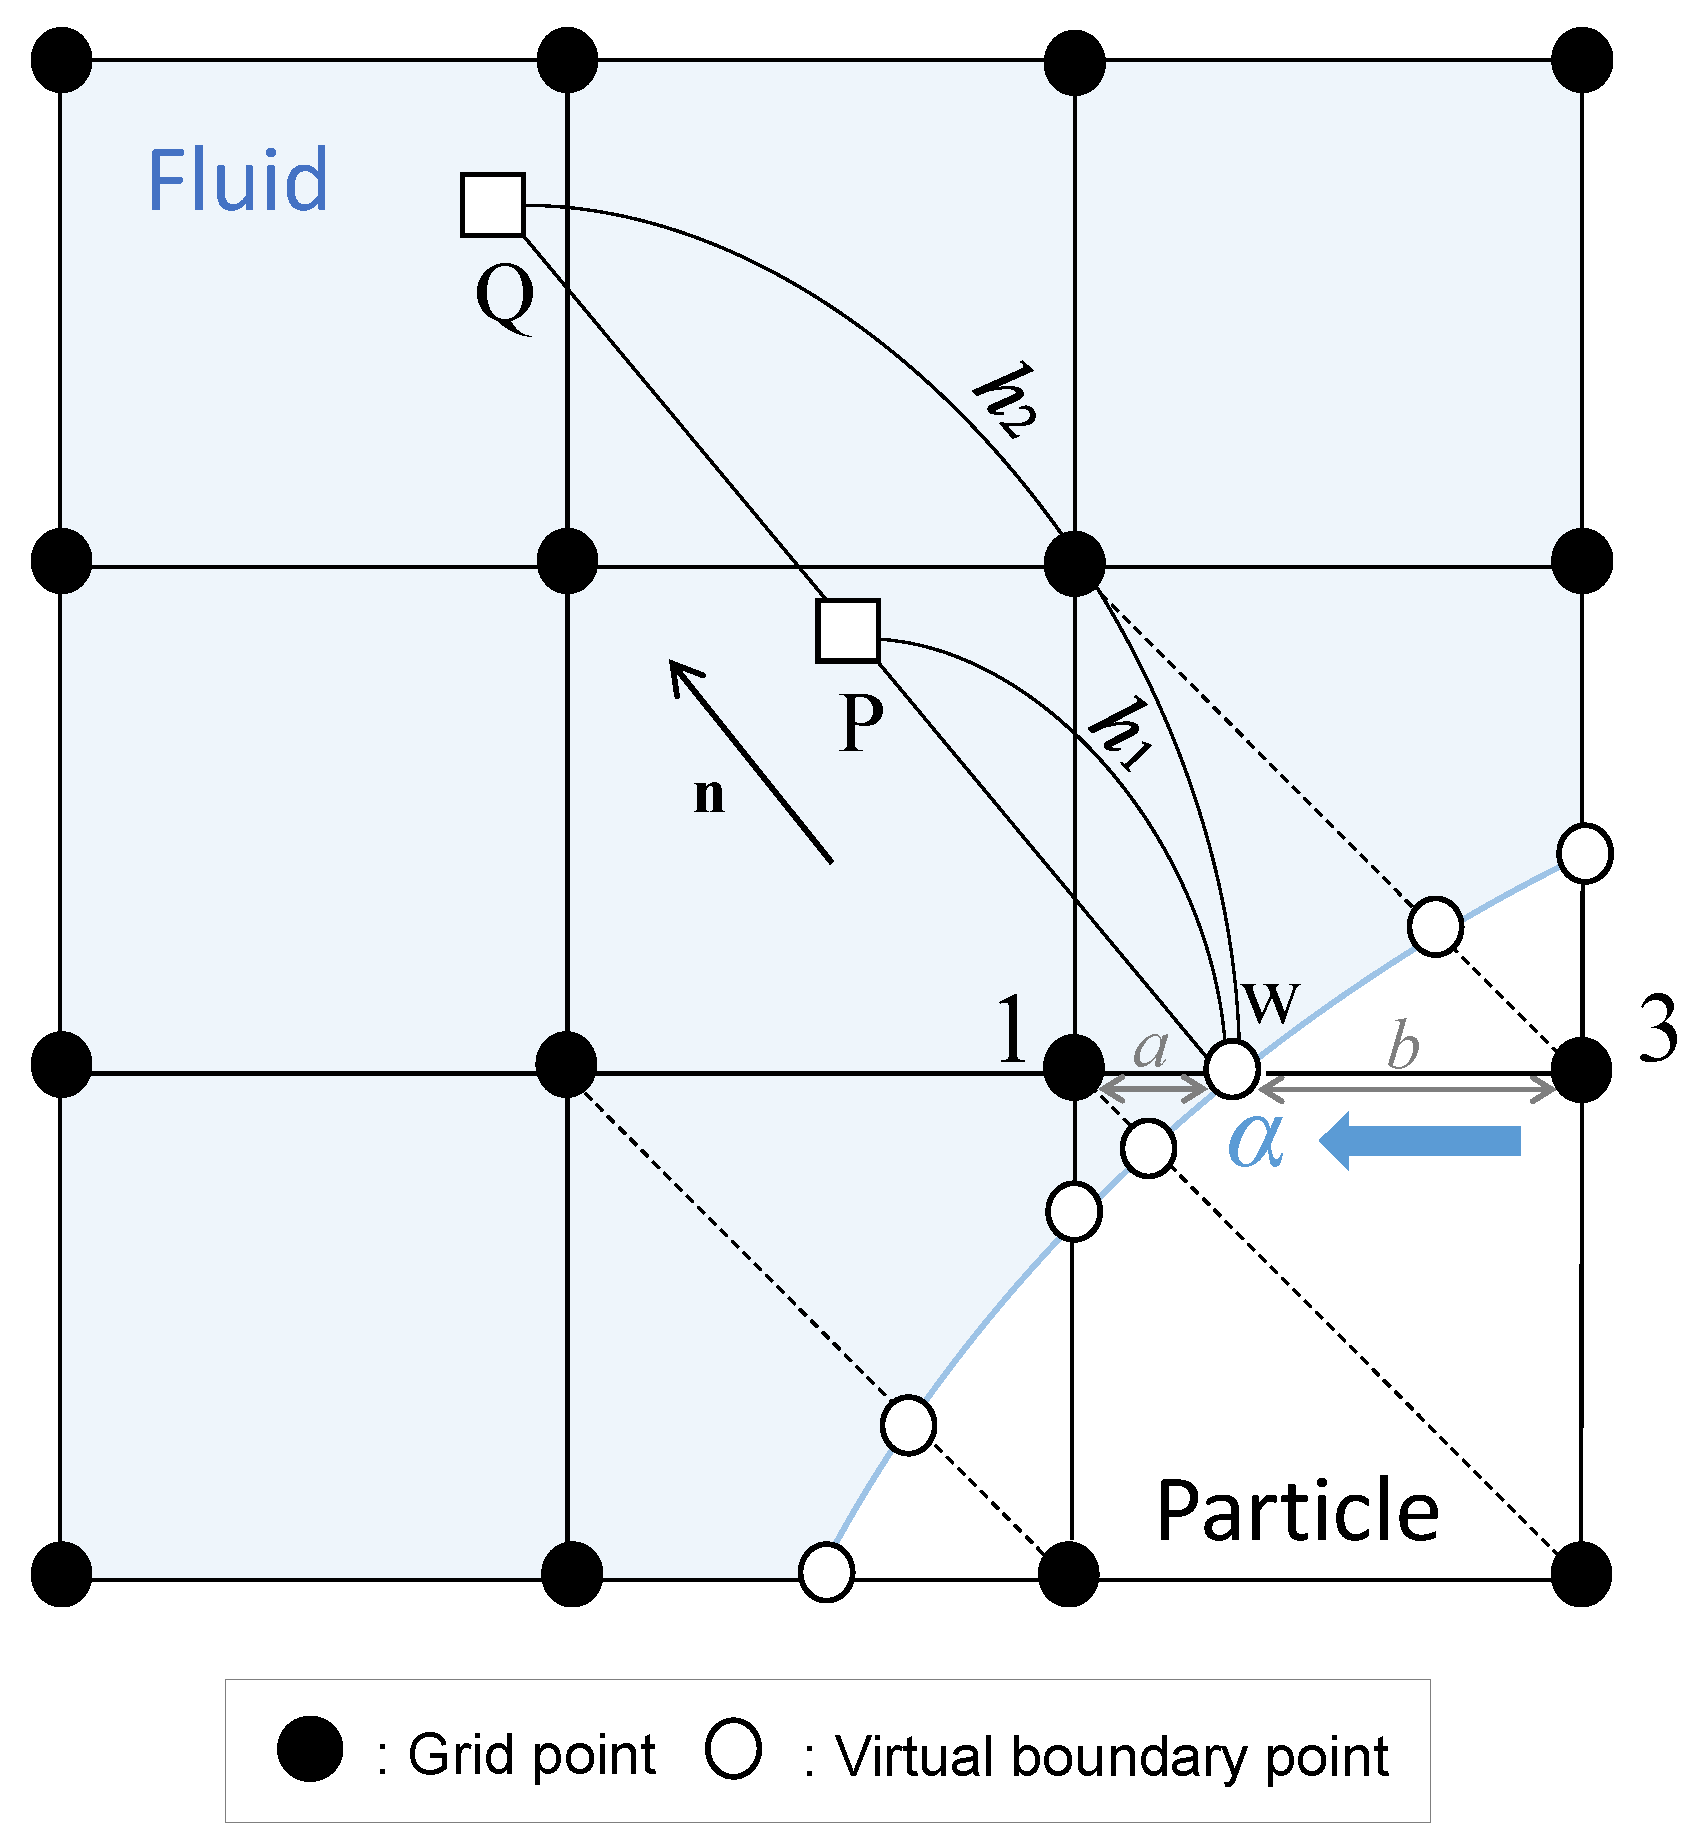
where n is the outward normal unit vector on the surface of the particle. The stress tensor Tw was extrapolated by stress tensor TP and TQ, on points P and Q (Figure 3), respectively. The components of the force Fp = (Fx, Fy) and the torque Tp on the solid particle are given by
F x = C ( p p p 0 ) n x ds + C τ w ,   x ds ,
F y = C ( p p p 0 ) n y ds + C τ w ,   y ds ,
T p = |   r   ×   τ w | z ,
where pp is the pressure on the solid particle surface, p0 is the reference pressure, and r is the vector on the particle surface from the particle center.

2.4. Virtual Flux Method

The virtual flux method [22,23] was applied to describe the curved boundary of particle shape on a Cartesian grid. Suspension flows including solid particle can be solved by reflecting the distribution functions calculated using the virtual flux method. One of the advantages of this method is simple algorism with no iterative calculations. The distribution function on the particle surface can be obtained by simply considering its hydrodynamic conditions. These procedures need no iterations. Compared to the immersed boundary method (IBM) [24], which is popularly coupled with LBM, the virtual flux method has superior spatial resolution without adding external force to the body surfaces to describe the arbitrary shape on the Cartesian grid.
Figure 3 shows the virtual boundary on the Cartesian grid. For example, the distribution function streams to nine directions in the D2Q9 model; however, the distribution function at grid point 3 cannot propagate to grid point 1 (described as direction   α ) because the virtual boundary point w exists at the position where a:b divides the space between grid points 1 and 3.
A brief description of the calculation procedure to obtain the distribution function at grid point 1 fα, 1 is as follows: First, the physical quantities on the virtual boundary (point w) were obtained by imposing both the no-slip boundary condition (uw = up) and pressure boundary condition on the particle surface ( p / n = 0 ). Pressure p P and p Q at point P and Q, which were located in the normal direction to the wall surface from the boundary point, were interpolated by using data neighboring four points. Pressure at grid point w p w was obtained by extrapolating pressure p P and p Q as
p w = h 2 2 p P h 1 2 p Q h 2 2 h 1 2 ,
where distances of h 1 and h 2 in this study were 2 , and   2 2 , respectively. The equilibrium distribution function f α ,   w   eq on the virtual boundary was then obtained, and the distribution function f α ,   w was
f α ,   w = f α ,   w eq ( u w ,   p w ) + ( f α , 1 f α , 1 eq ) .
Then, the virtual distribution function f α ,   3 * and the equilibrium distribution function f α ,   3 eq * at grid point 3 were obtained by extrapolation using these values at grid point 1 as follows:
f α ,   3 * = a + b a f α ,   w b a f α ,   1 ,
f α ,   3 eq * = a + b a f α ,   w eq b a f α ,   1 eq .
Finally, the distribution function at grid point 1 for the next time step considering the virtual boundary using f α ,   3 * and f α ,   3 eq * can be obtained as
f α , 1 = f α ,   3 * + 1 τ ( f α ,   3 eq * f α ,   3 * ) .

2.5. Lift Coefficient

The equilibrium position of inertial migration in a pressure-driven flow can be obtained by the following two methods: the lift force profile of a particle constrained in lateral motion and the trajectory of a freely moving particle. In this study, the constraint method (the former method) was used to obtain the equilibrium position of inertial migration. This method has been previously used by many groups [25,26].
A brief description of the calculation procedure in this study is as follows: A single particle was released from five different initial positions (y/D = 0.2–0.4 with an interval of 0.05) between the lower wall and center line. The motion of the particle was restricted in the direction perpendicular to the flow direction, i.e., the particle was allowed to move only in the flow direction with rotation. The profiles of lift coefficient CL were obtained using time averaged lift force acting on the particle. Note that the lift force at the center (y/D = 0.5) is assumed to be zero for the symmetry of the computational domain. The equilibrium position was then obtained as a position where the lift force is the closest to zero excluding y/D = 0.5 by using a cubic spline interpolation with a precision of the order of y/D = 0.001. The lift coefficient CL was calculated by
C L = F y ρ U 2 r ,
where U is a characteristic velocity.

2.6. Relative Viscosity

Relative viscosity η eff / η 0 for pressure-driven flow [12] is given by
η eff η 0 = p p 0     τ i j τ 0 ,
where ∆p is pressure drop over the channel length, p 0 is pressure drop for particle-free flow over the channel length,   τ i j is the spatially averaged wall shear stress, and τ 0 is the wall shear stress for particle-free flow.

3. Results and Discussion

3.1. Periodic Length and Grid Resolution

The effects of periodic length, which refers to the length L of the parallel plates model, on the equilibrium position of inertial migration were assessed, and a grid independence study was conducted.
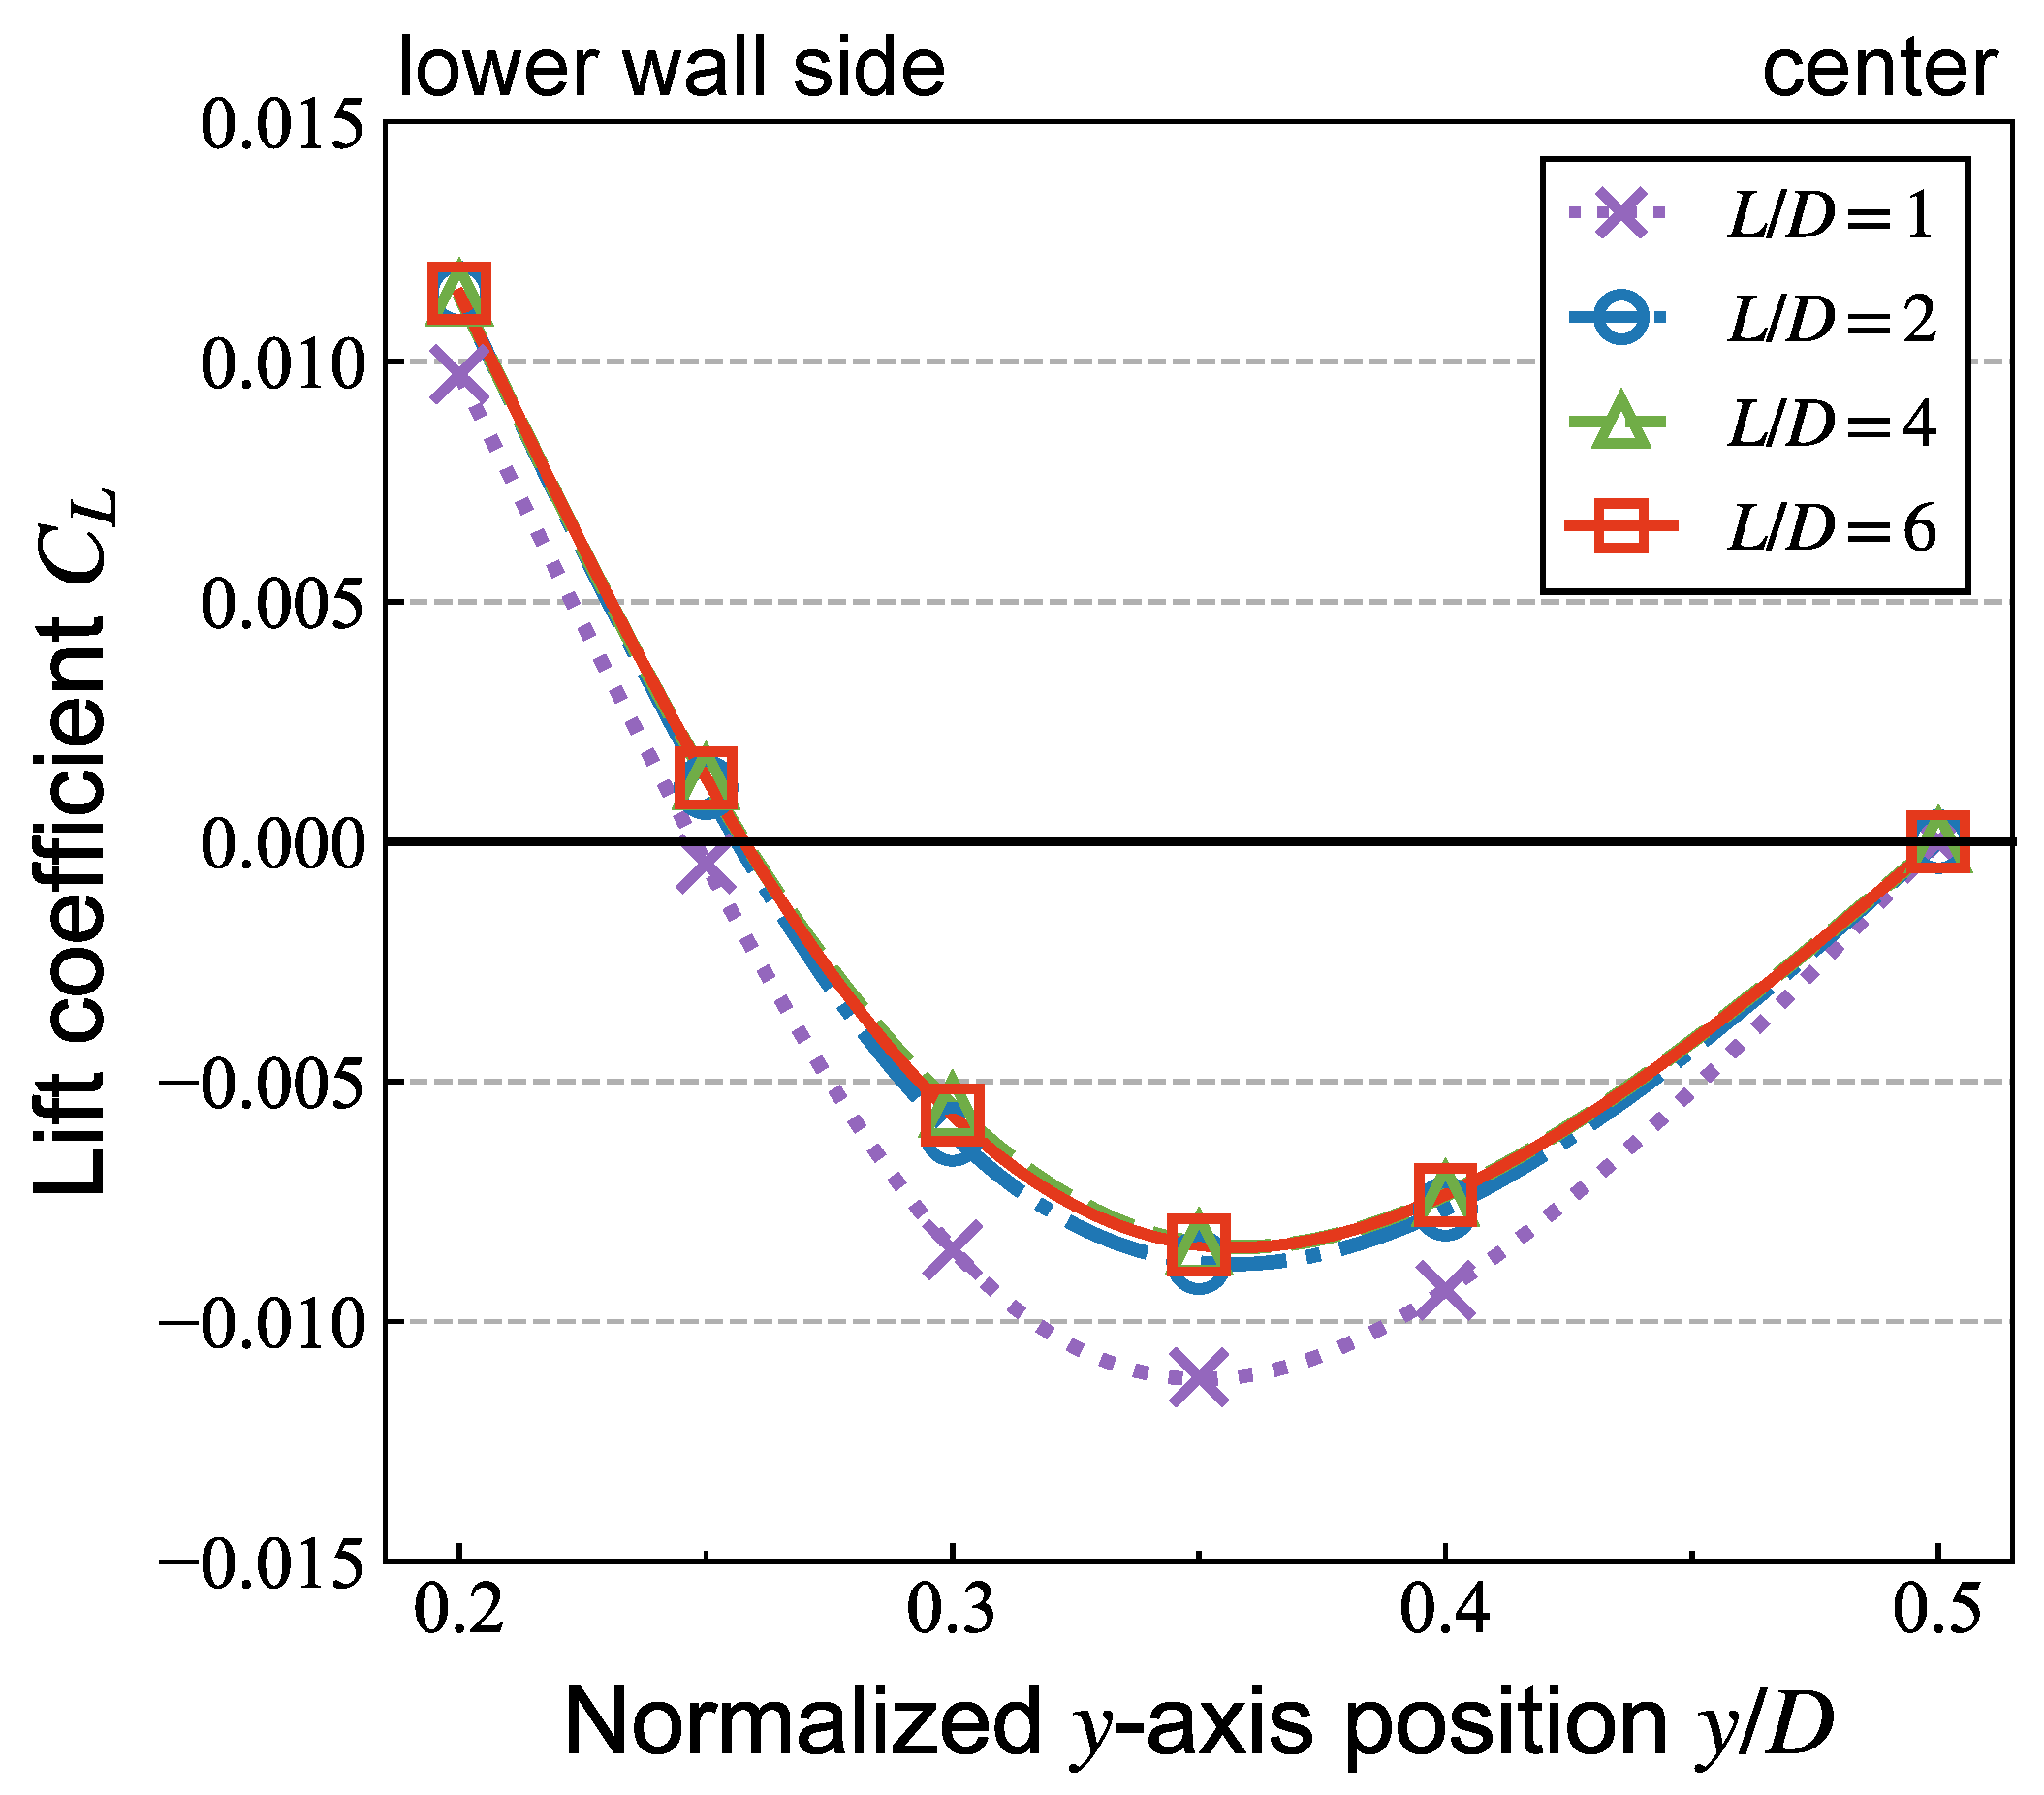
First of all, the effects of periodic length were investigated. This length should be sufficient to neglect the effect of the boundary condition. The lift coefficient profiles were compared to determine the periodic length. Figure 4 shows the profiles of lift coefficient of a single circular particle for four different periodic lengths L/D = 1, 2, 4, and 6. On the lower wall side (y/D = 0.2), the lift force exerted on the particle was positive, which indicates that particle in this region is lifted up toward the center. On the other hand, when the lift force is negative, particle is lifted down from center region to the wall side. The profiles for L/D = 4 and 6 were almost the same. Table 1 shows equilibrium positions obtained from the lift coefficient profiles. The periodic length L/D = 4 was thus adopted in the simulation conditions.
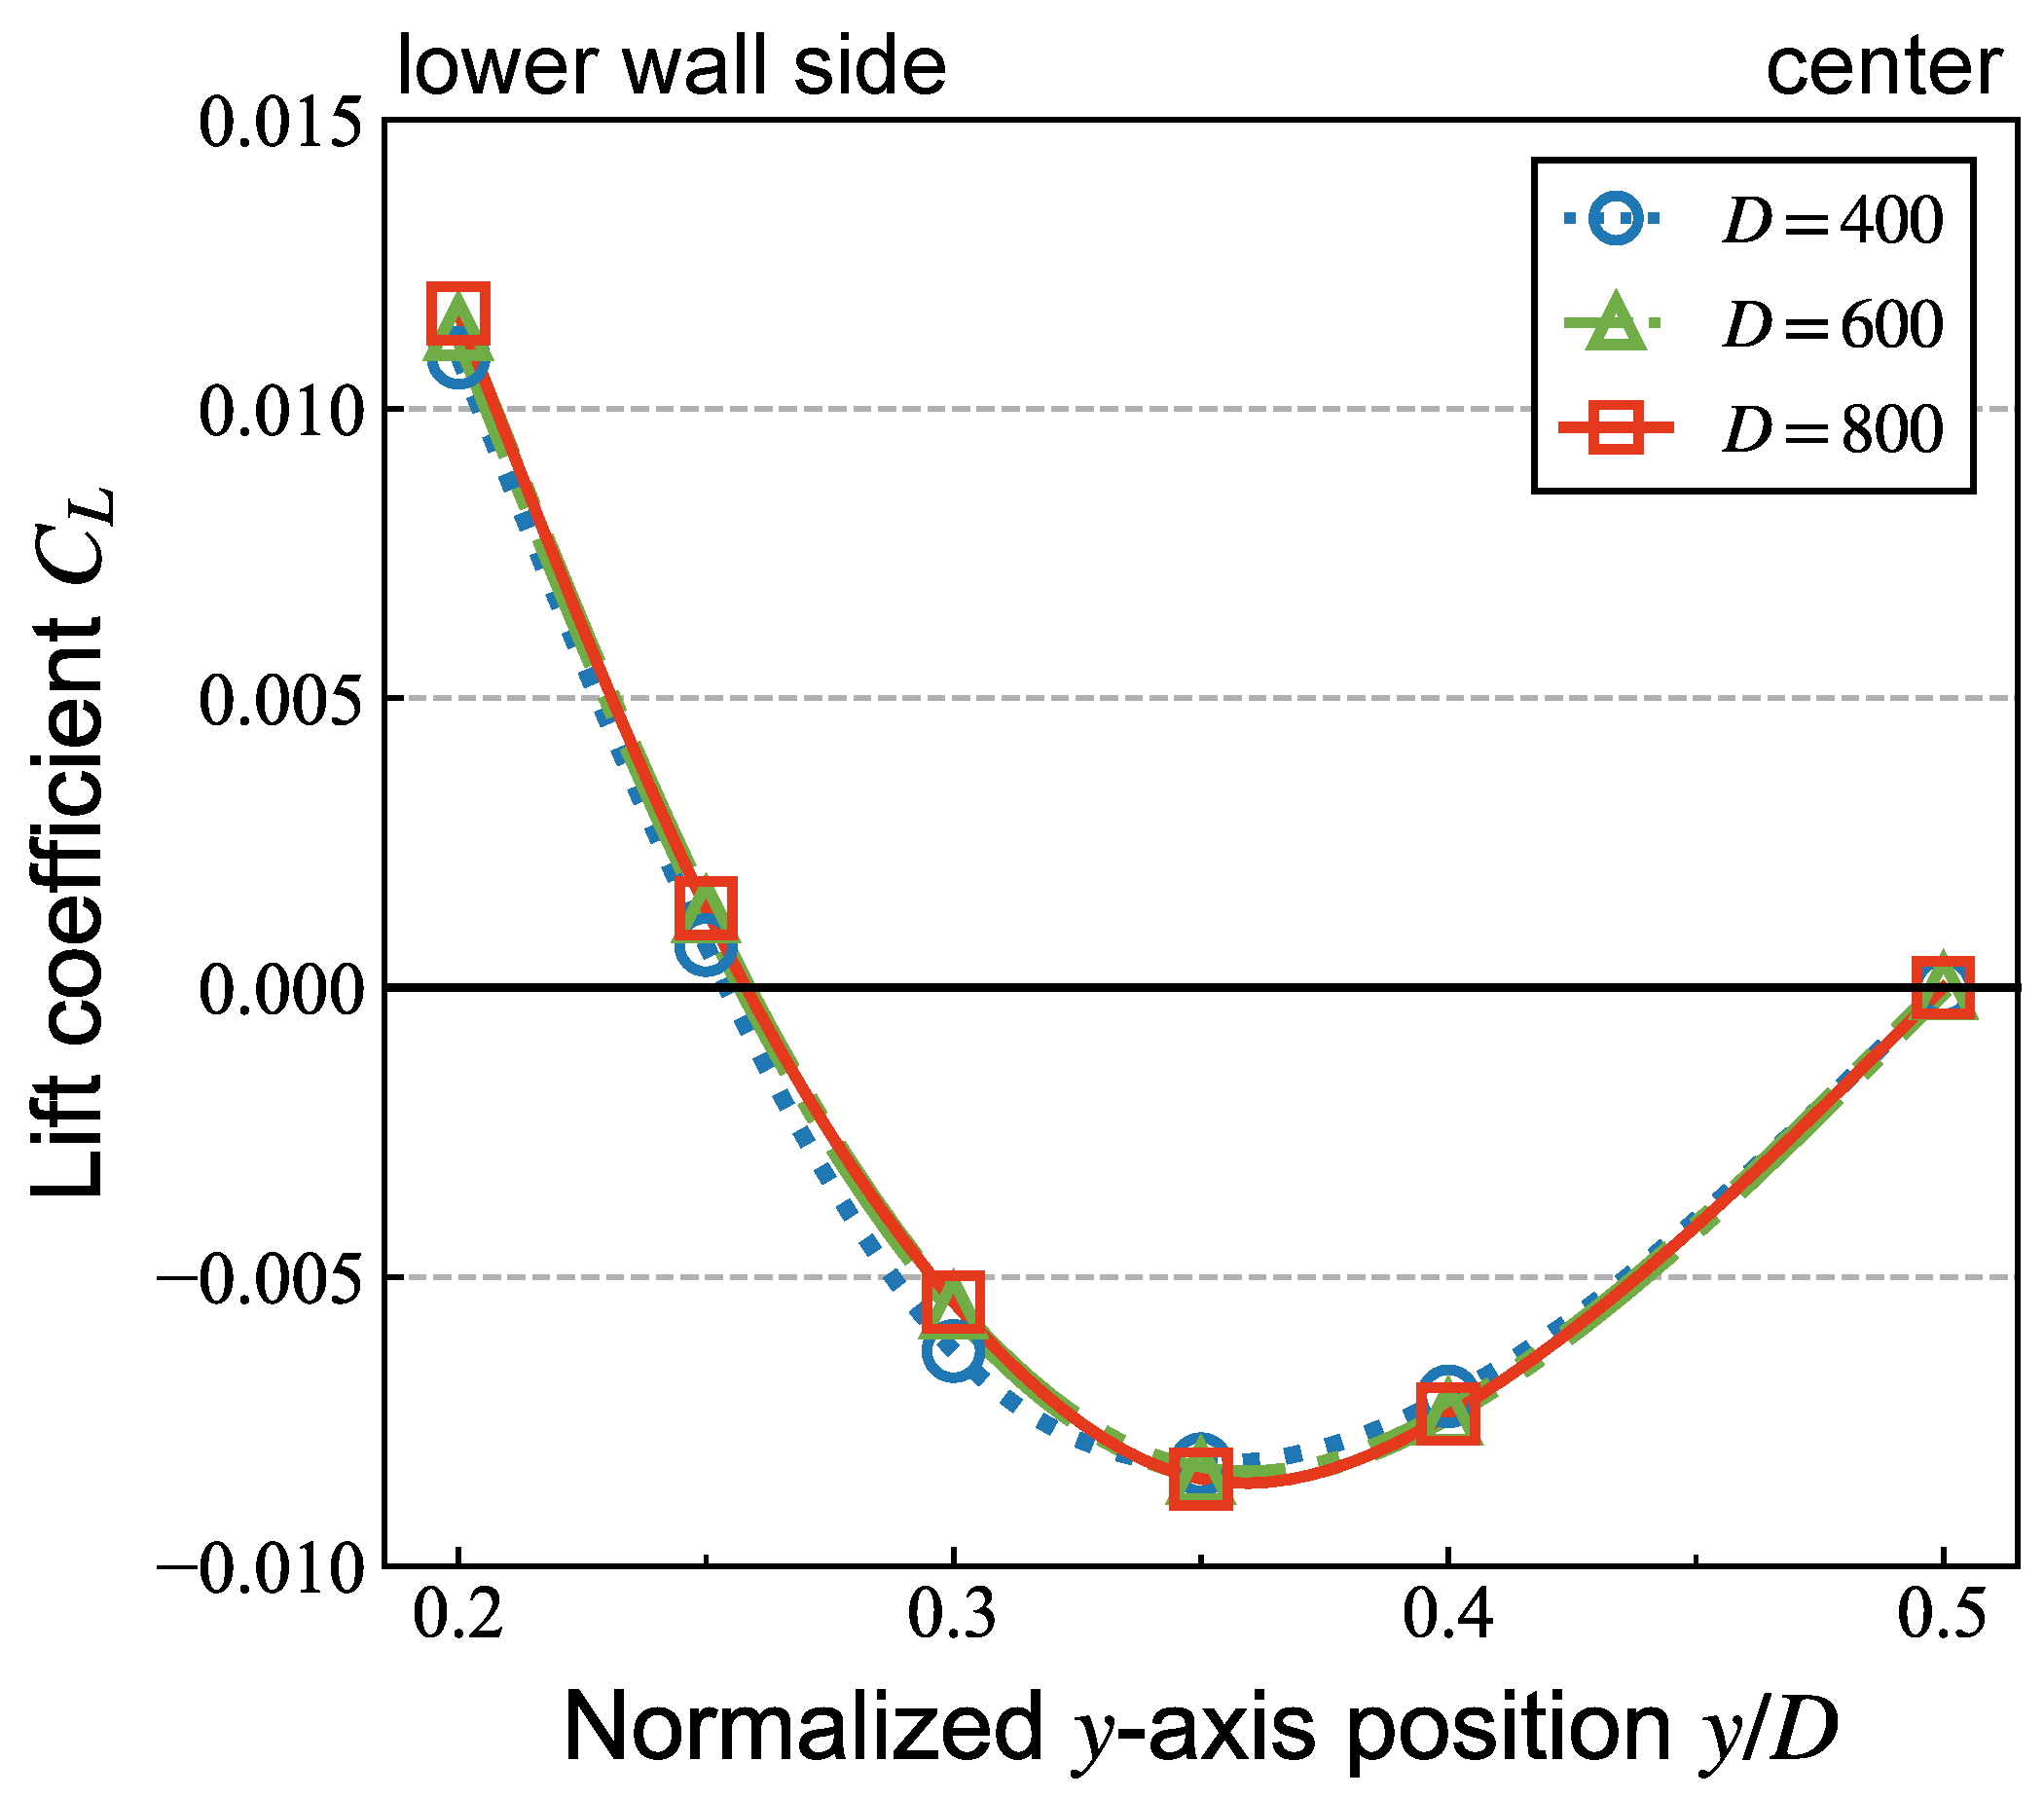
Secondly, a grid independence study was performed. Figure 5 shows profiles of lift coefficient with three different grid resolutions. When the particle flowed near the lower wall, the lift coefficient became slightly larger with increasing grid resolutions as illustrated in Figure 5. The equilibrium position, where the lift force is zero, moved slightly toward the center for higher resolution. Table 2 shows equilibrium positions obtained from the lift coefficient profiles. The results show that the number of cells for channel width is required to be at least 600. Thus, the number of cells for channel width D was set to 800 in all simulations to take non-spherical particle shapes into account. At least 20 cells were used for the grid resolution of the minor axis of AR = 4 in case 3 for C3 = 0.05.

3.2. Effects of Aspect Ratio of Elliptical Particle on the Equilibrium Position Due to Inertial Migration

The effects of aspect ratio on the lift coefficient profiles and the equilibrium positions of the particles with the same area fraction (in case 3) are discussed. Figure 6 shows profiles of lift coefficient of an elliptical particle for different aspect ratios with various confinements. Note that the vertical axis scale depends on each figure for clarity. The lift coefficient profiles were similar between AR = 1 and AR = 2. On the contrary, those for AR = 4 were different from those for AR =1 and 2. When the particle flowed on the lower wall side, the lift coefficient became larger with increasing aspect ratio, i.e., the repulsive force from the wall became larger with increasing aspect ratio. Table 3 shows equilibrium positions for different aspect ratios with various confinements. The equilibrium position shifted toward the center with the increase of aspect ratio, and it was enhanced with higher confinement (larger particle).
The effects of aspect ratio on the equilibrium positions with the different confinement definitions are discussed. Figure 7 shows the comparison of equilibrium position as a function of confinement with three different definitions for AR = 1–4. For each confinement, changes in the equilibrium position with increasing AR are described. For comparison among C1, which corresponds to the comparison with the same minor axis, the equilibrium position was shifted to the center with increasing AR. On the contrary, for comparison among C2, which corresponds to the comparison with the same major axis, the equilibrium position was slightly shifted to the wall side (AR = 2), then shifted to the center (AR = 4) with increasing AR. For comparison among C3, which corresponds to the comparison with the same area fraction, the equilibrium position was shifted to the center with increasing AR. These results showed that the effects of aspect ratio on the equilibrium position strongly depend on the confinement definition.
Our results are qualitatively consistent with other results for case 1 and 2. Chen et al. [4], who discussed the effects of aspect ratio in a comparison similar to case 1, showed that the equilibrium position with higher AR is closer to the center. Hu et al. [16], who discussed the effects of aspect ratio with C2 for non-Newtonian fluids, reported that the equilibrium position shifted toward the wall with increasing AR. Wen et al. [5] also discussed the effects of aspect ratio with C2 on the equilibrium position. They reported that the equilibrium position changes from being closer to the wall to being closer to the center when a certain aspect ratio was exceeded. Our results are consistent with their results. The novel contribution of the present study is to determine the equilibrium positions in case 3 and to compare them among their definitions.

3.3. Effects of Aspect Ratio of Elliptical Particle on the Effective Viscosity

In this section, the relative viscosity contributed by a single particle with various aspect ratios and various distances from the walls is compared. Figure 8 shows the relative viscosity contributed by the elliptical particle with different aspect ratios for the various particle–wall distances. Note that the vertical axis scale is different for each figure for clarity.
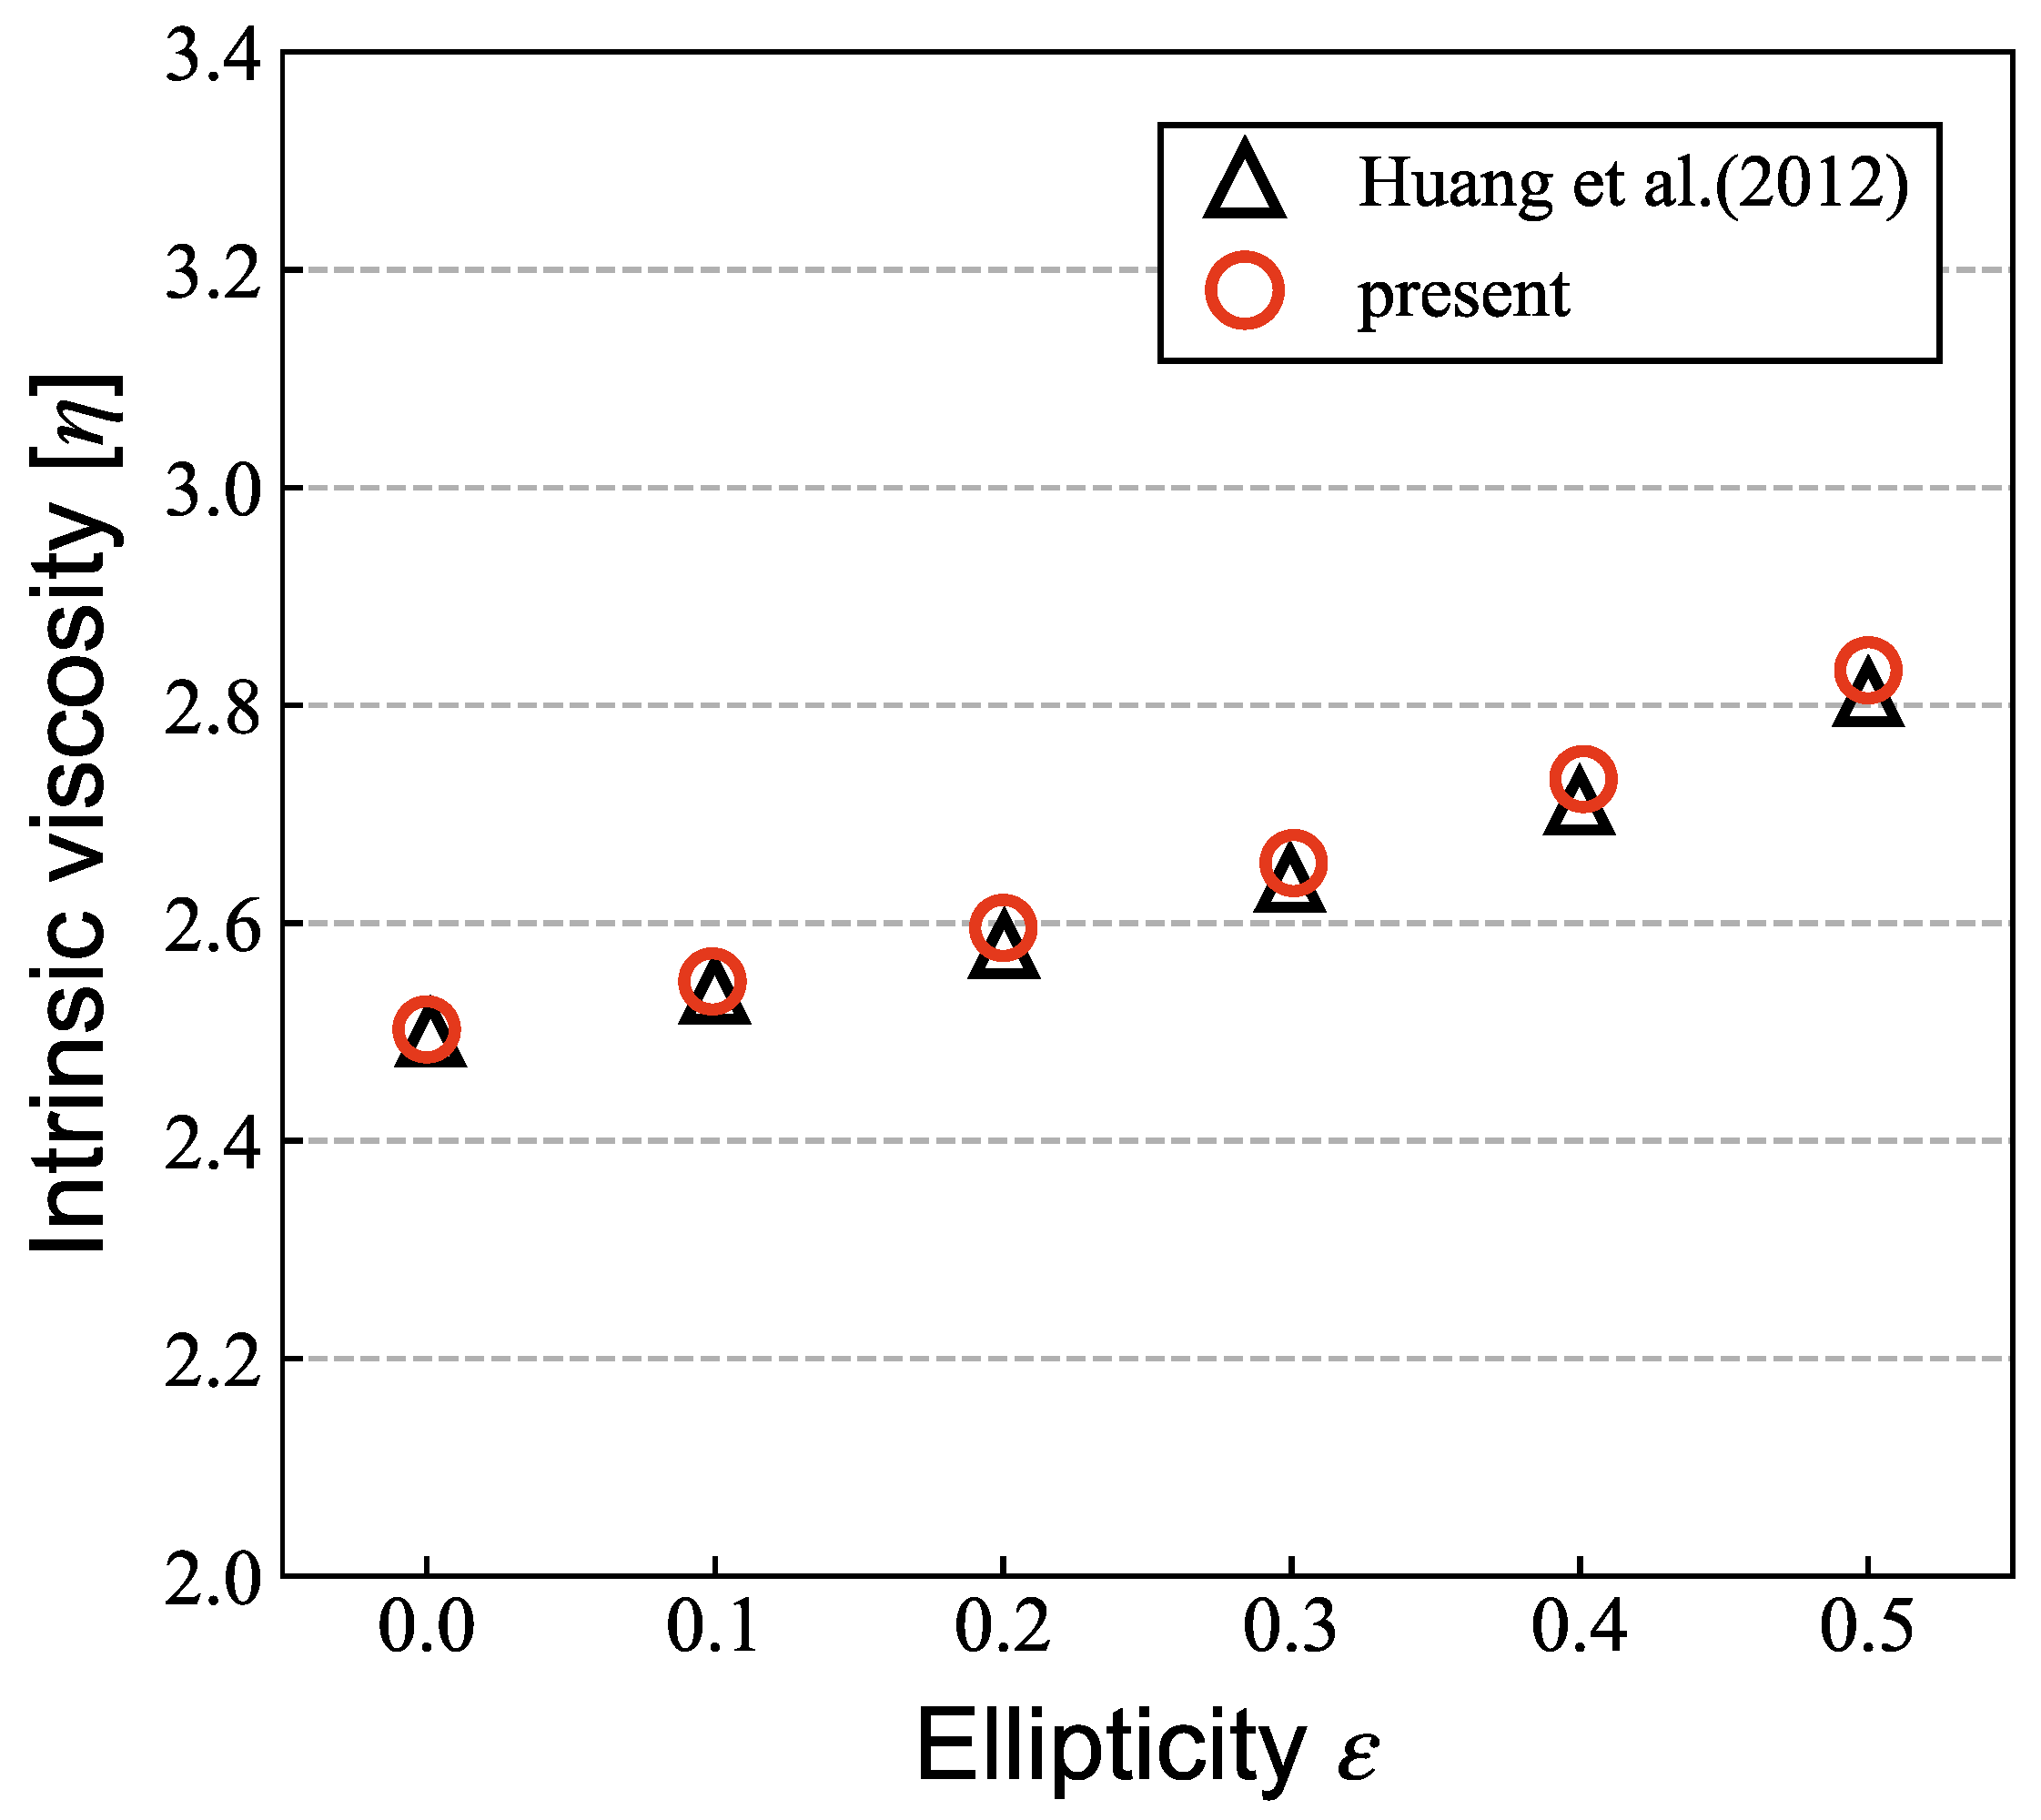
For all cases, contribution of the particle to the viscosity increases when particle flows near the wall. Doyeux et al. [11] simulated the motion of confined circular particle in shear flow. They showed that the viscosity increases when the particle approaches the wall. Our results are consistent with their results. When the particle flows near the center line, the relative viscosity was almost independent of aspect ratio and confinement. For small particles, the relative viscosity was almost independent of aspect ratio. In a two-dimensional simulation, Liu et al. [8] reported that the intrinsic viscosity of the elliptical particle is higher than that of the circular particle. Although some factors such as flow field conditions and particle concentration are different from theirs, a significant contribution to the viscosity due to particle shape was not confirmed in this study. In order to validate our numerical results, the intrinsic viscosity in three-dimensional conditions was calculated, and the results were compared with those from Huang et al. [10]. Details of the simulation results are given in Appendix A.
On the contrary, for larger particles, when the particle flowed near the wall, effects of particle shape on the relative viscosity became significant. The contribution of particles with high aspect ratio to the viscosity is minor when the particle flows near the walls. One of the reasons is that particles are oriented in the flow direction for a long time. In previous research, Pozrikidis [27] investigated particle orientation under shear flow and reported that the effective viscosity decreases with higher aspect ratio. Our results are consistent with these results.

3.4. Spatial and Temporal Changes in the Effective Viscosity

The fluctuation of effective viscosity in time and space due to particle behavior was found to be quite significant [12,13]. In this section, the effects of the particle flow position and rotational motion on the spatial distribution of the relative viscosity are discussed, and the spatial and temporal changes in the viscosity are evaluated.
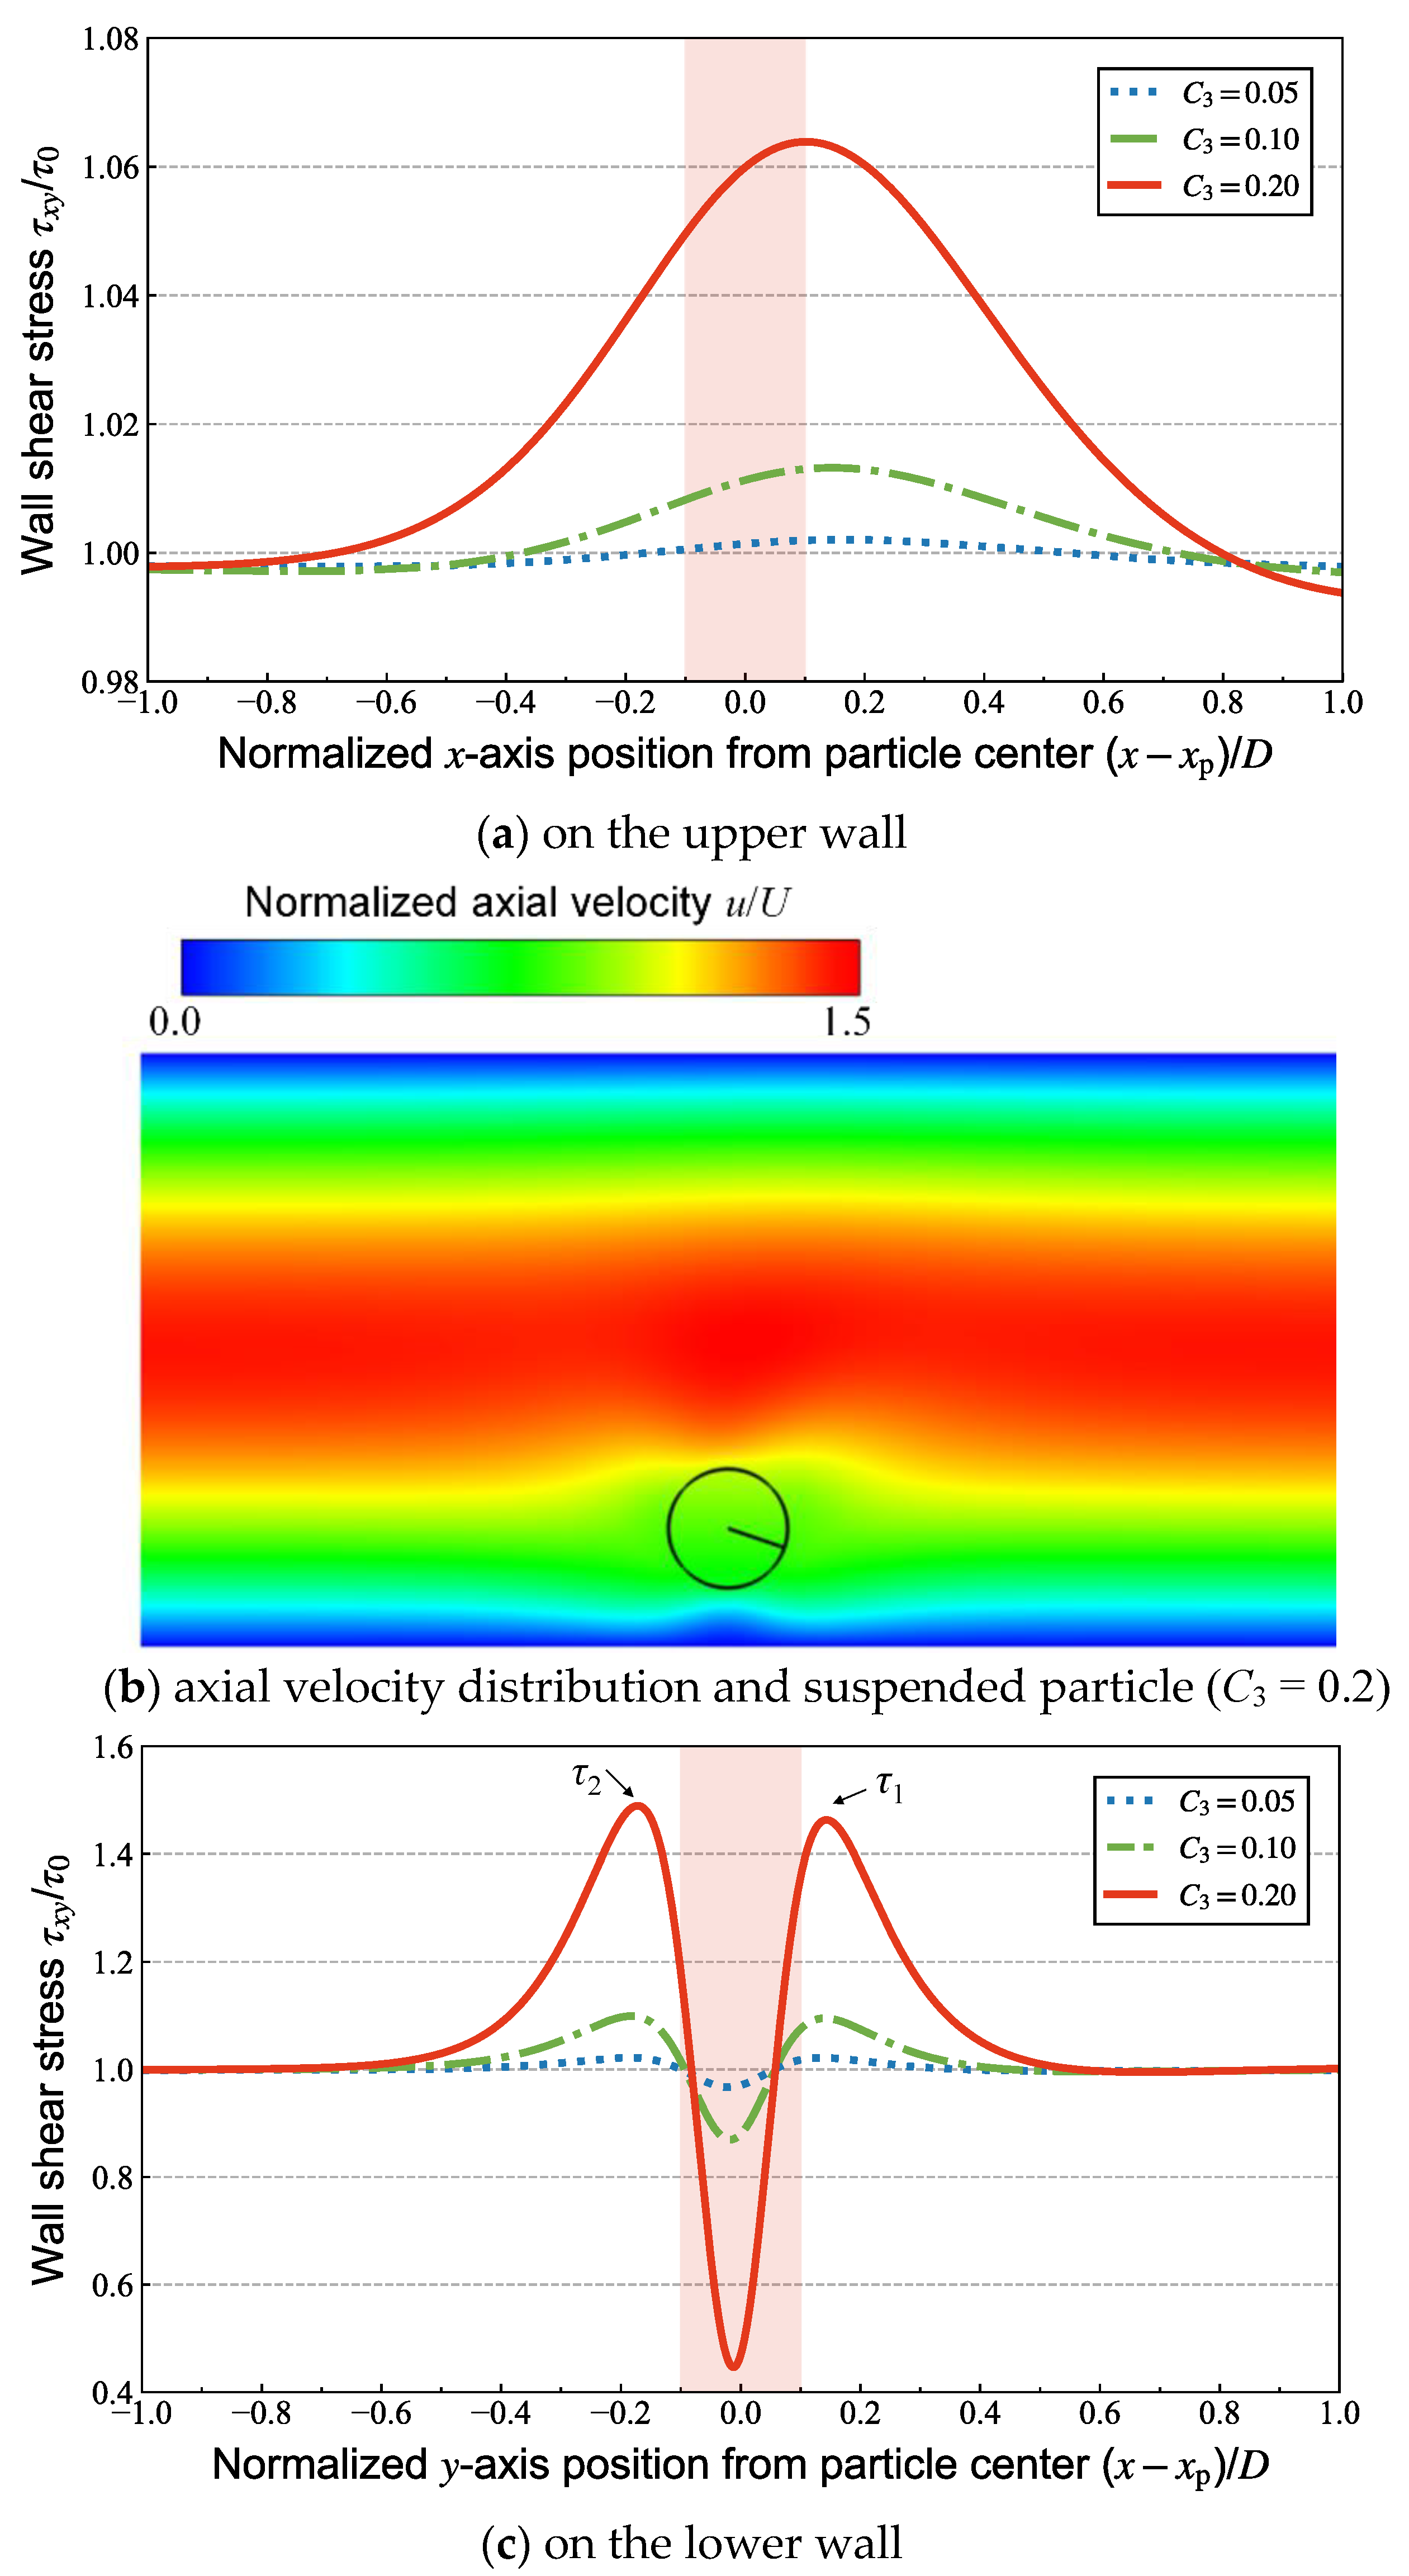
Figure 9 shows distributions of local WSS on the upper and lower wall for a circular particle flowing at y/D = 0.2 with various confinements C3 = 0.05, 0.1, and 0.2. Figure 9b shows axial velocity distribution and particle position in connection with Figure 9a,c for C3 = 0.2. Note that local WSS can also be interpreted as the local relative viscosity from Equation (32). The lowest local WSS lies on the lower wall in the region near the particle (Figure 9c). This is already reported by previous studies [12,14,28]. The higher regions of WSS on the lower wall were observed near the edge of the particle. The peak in front of the particle is denoted by τ1, and that behind the particle is denoted by τ2 (Figure 9c). In contrast, on the upper wall, the local relative viscosity near the particle becomes higher (Figure 9a). These characteristics are qualitatively consistent with the results from Inamuro et al. [28] who studied the inertial migration of a single circular particle flowing between the parallel plates using IBM-LBM.
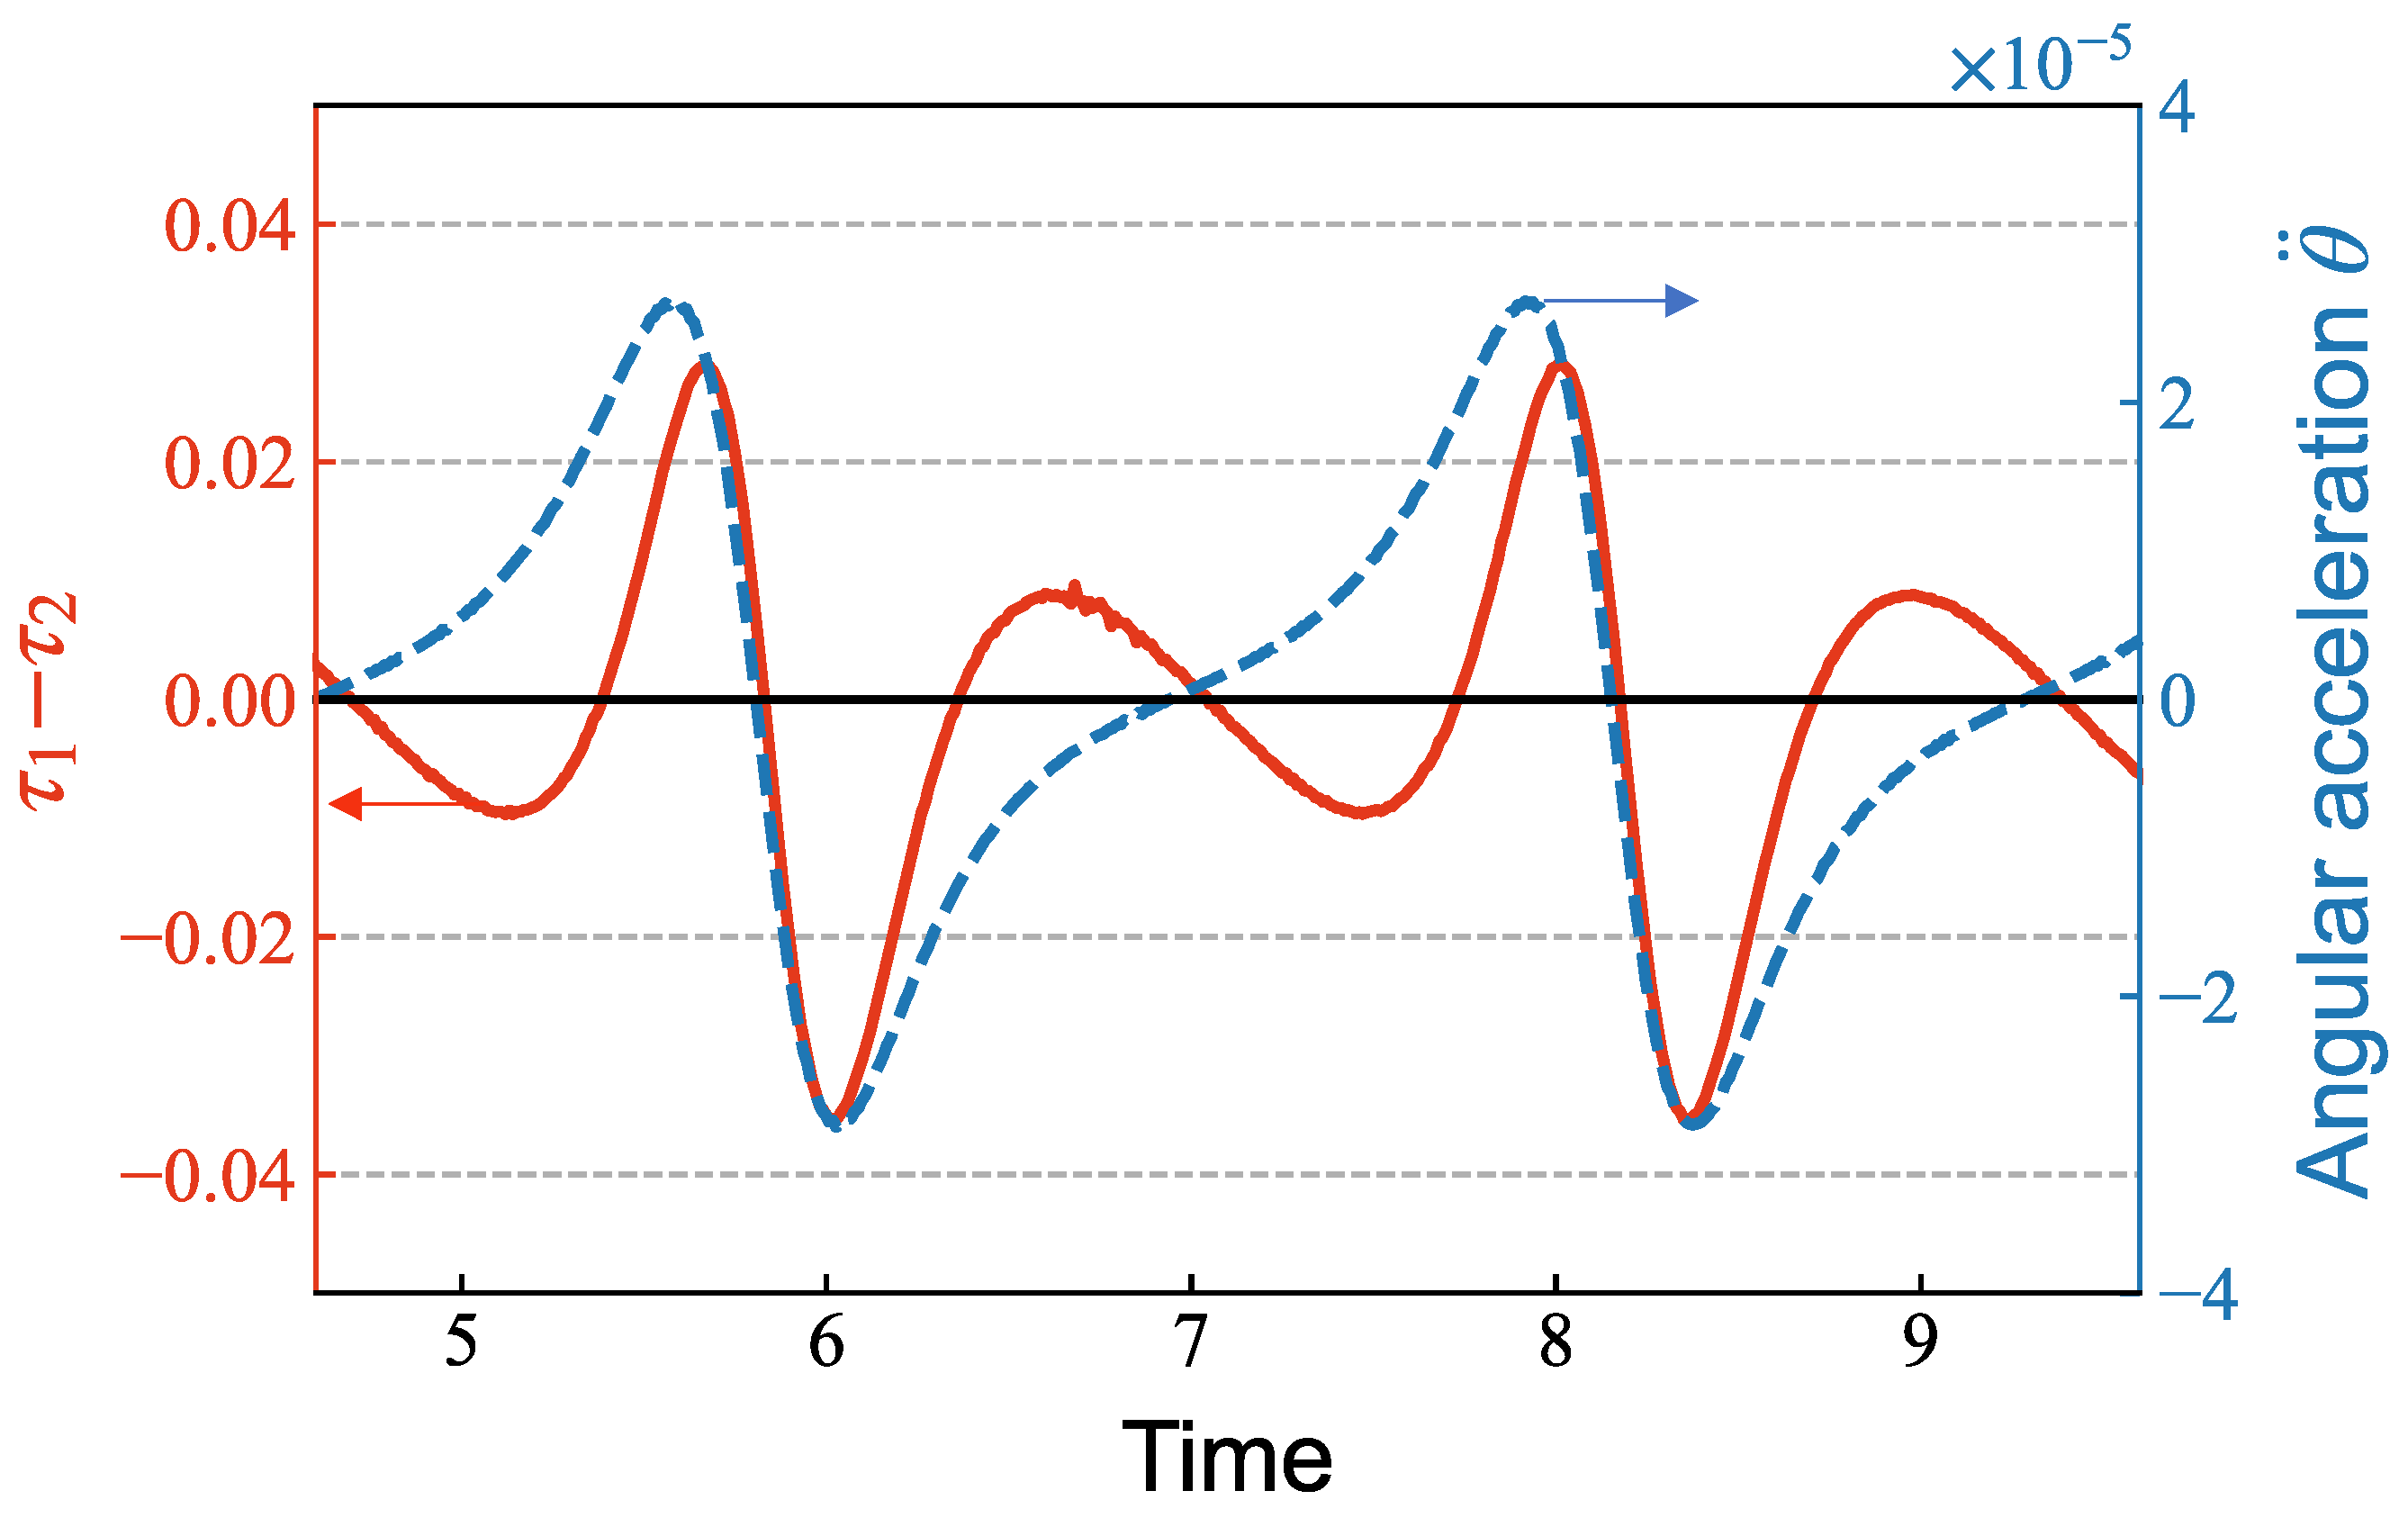
In order to capture the characteristics of the variation of the spatial WSS distribution with rotational motions of the particle, we focused on the difference of peaks τ1τ2. Figure 10 shows the time history of angular acceleration and difference of peak τ1τ2. The elliptical particle rotates, accelerating and deaccelerating during the cycle. When the peak is positive, τ1 is higher than τ2, and vice versa. When the angular acceleration of the particle equals 0, the particle is oriented in the flow direction around non-dimensional time t = 4.6 and t = 7 in Figure 10, and the particle is perpendicular to the flow direction around non-dimensional time t = 6 and t = 8 in Figure 10. In addition, the negative difference of peak is dominant, which indicates that τ2 is higher than τ1 when the particle flows at y/D = 0.2, and this depends on the particle–wall distance.
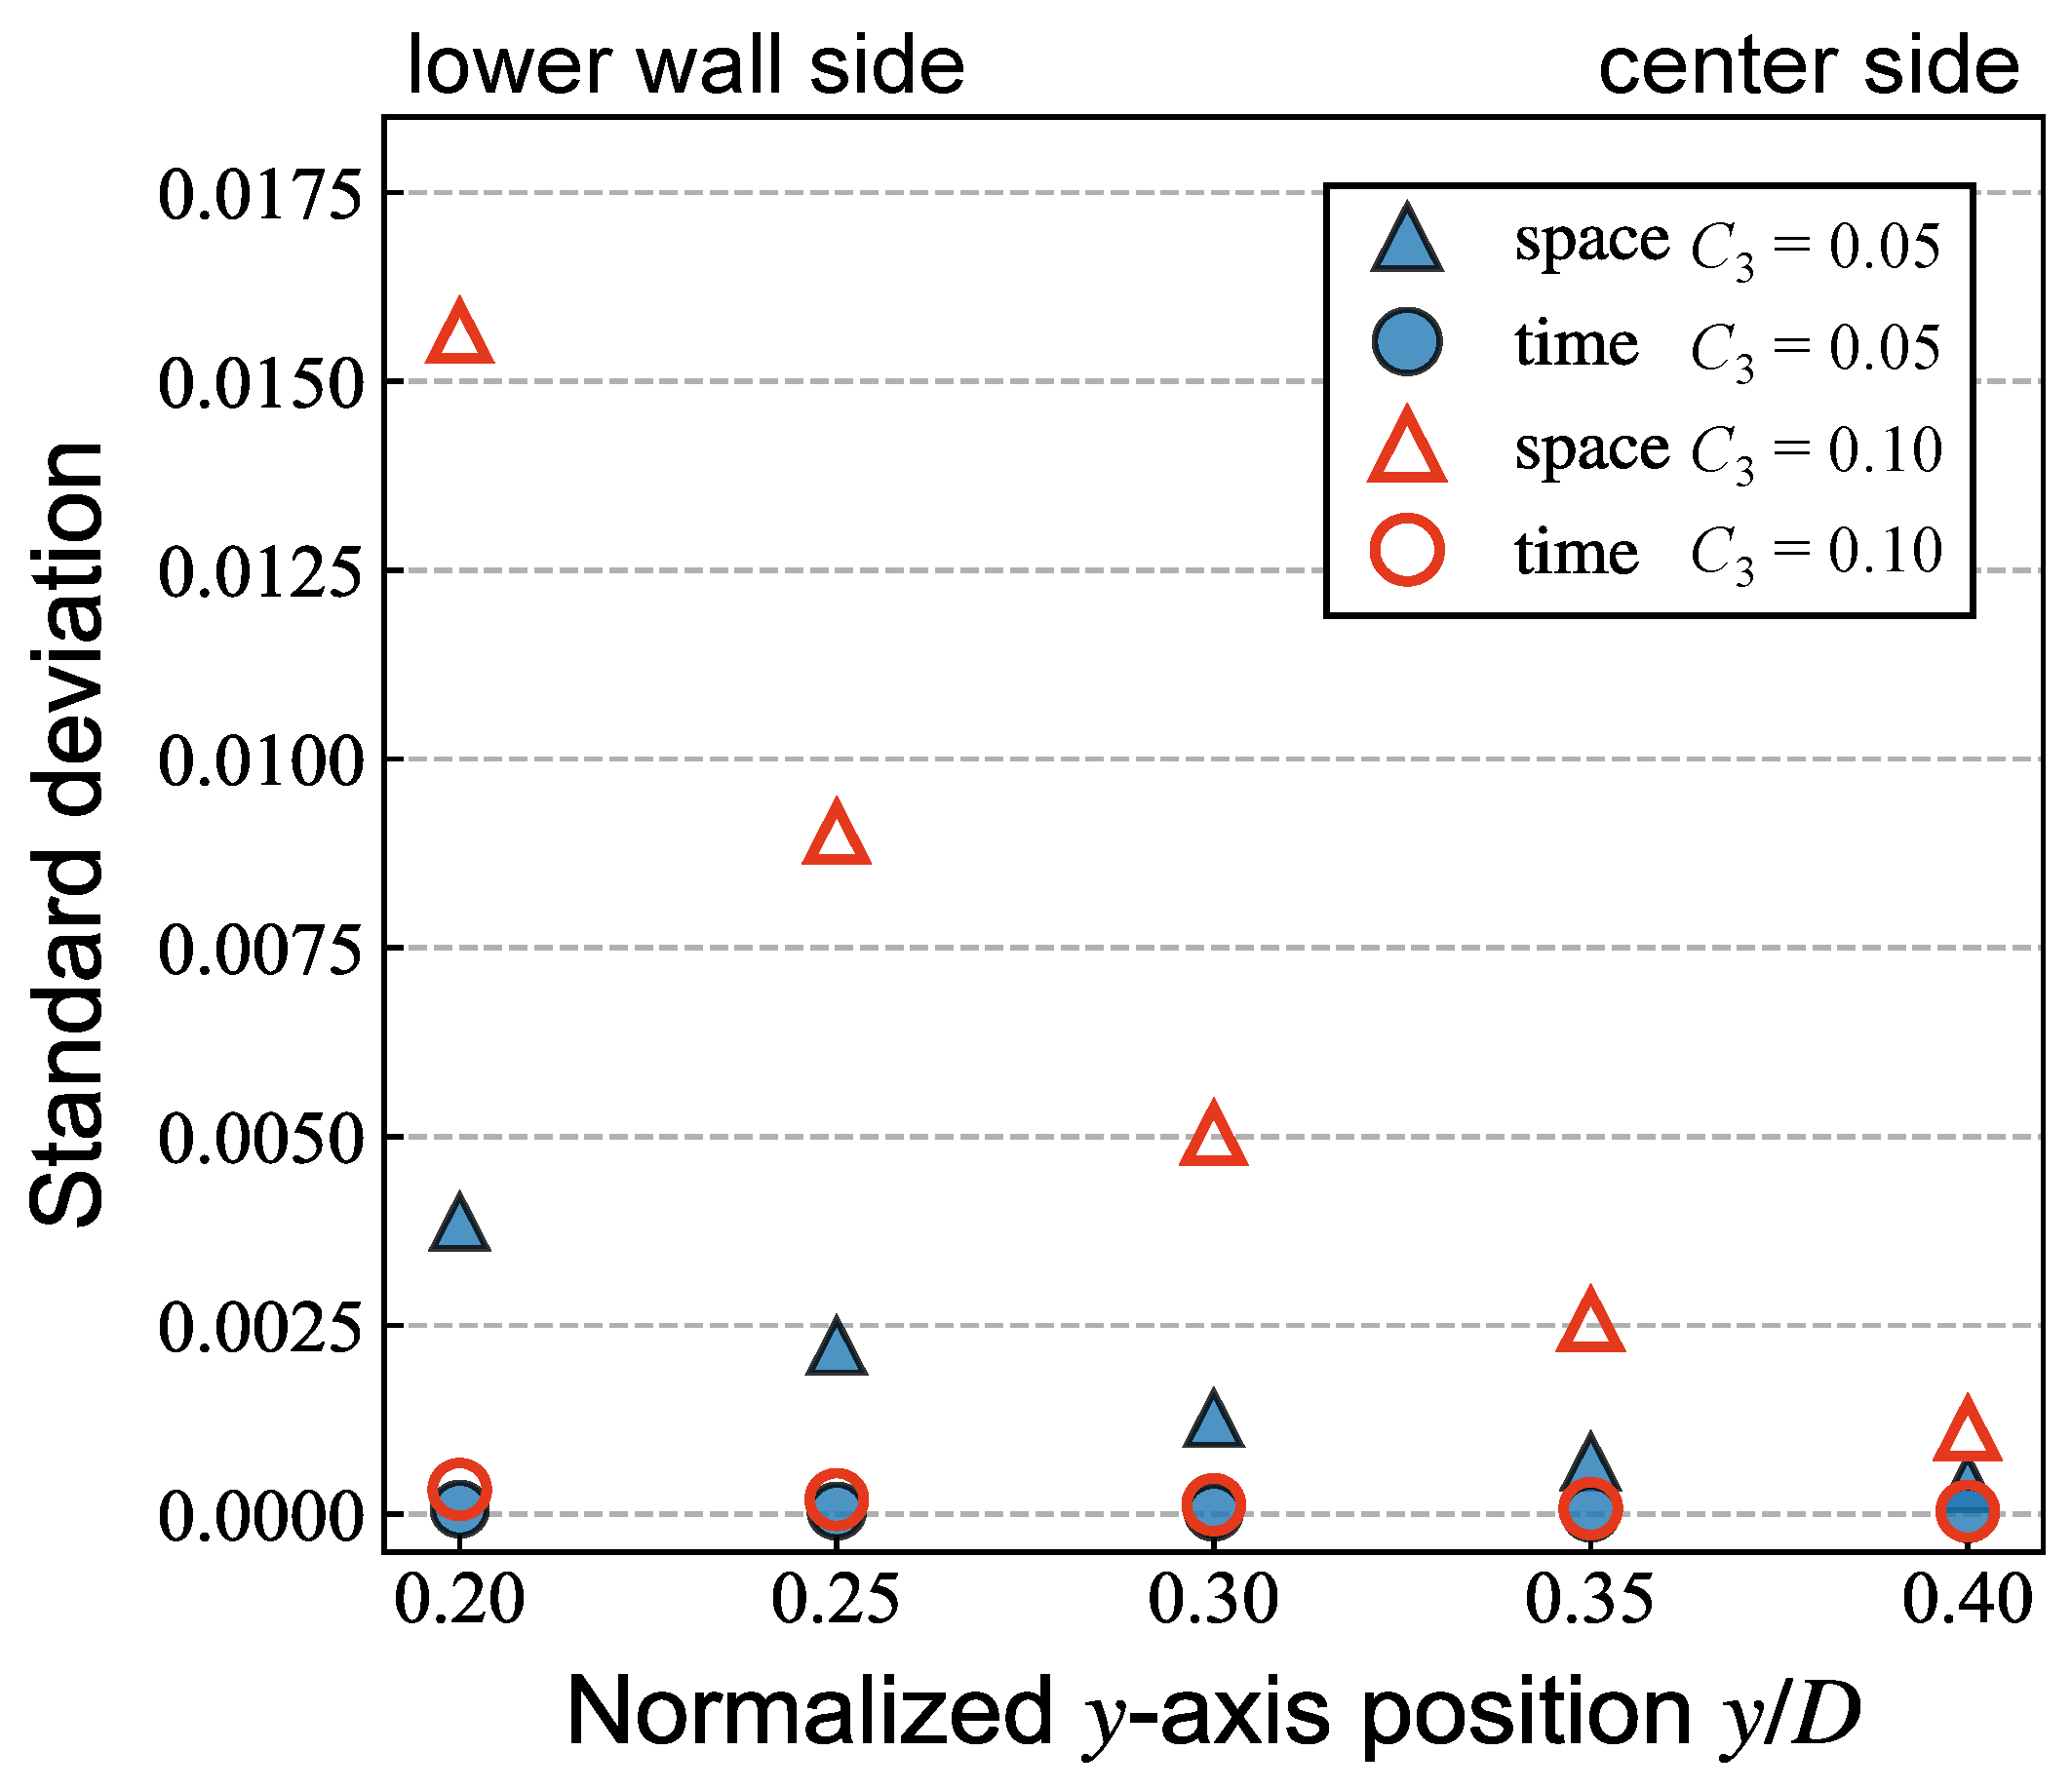
Since the rotational motion of the non-circular particle is unsteady, the effective viscosity dramatically changes not only in space but also in time. The spatial and temporal changes in viscosity were evaluated, and these effects were compared. Figure 11 shows the comparison of spatial and temporal standard deviation (SD) of effective viscosity. The temporal and spatial SD was calculated by
SD time = 1 n t = 1 n ( τ ( t ) τ ( t ) ¯ ) 2 ,
SD space ( t ) = 1 2 L i = 1 2 L ( τ ( t ,   i ) τ ( t ,   i ) ) 2 ,
where τ symbolizes the spatial average for τ , and τ symbolizes time-average for τ . The spatial SD was evaluated as the one-cycle rotational averaged value of Equation (34).
The spatial SD of relative viscosity became large when the particle flowed near the wall, the same as the contribution of particle motion to the relative viscosity. The spatial SD of effective viscosity was larger than the temporal deviation, and these differences become larger with increasing confinement.
In the previous studies, Xiong and Zhang [14] observed peak-valley-peak structure of WSS induced by red blood cells, and τ1 was larger than τ2. Freund and Vermont [29] showed that blood cells led to WSS with fluctuations that may significantly exceed mean values. The present study extends their findings by focusing on the particle rotational motions, and it was found that the difference between the peaks on the lower wall around the particle was associated with the unsteady rotational motion of the elliptical particle. As Xiong and Zhang [14] mentioned, channel size is a major factor in the fluctuation of WSS. This change is expected to be important especially in microvessels where the particle surface is close to the wall.

4. Conclusions

The contribution of a single circular or elliptical particle motion, especially the particle–wall distance and rotational motion to the effective viscosity was studied using the regularized lattice Boltzmann method coupled with the virtual flux method. First, the effects of elliptical particle shape on the equilibrium position of inertial migration were summarized using three definitions of confinement. It was found that the effects of aspect ratio on the equilibrium position depend on the confinement definition. The effects of particle shape on the viscosity were also studied, and the contribution of particle shape to the effective viscosity was found to be enhanced when the particle flows near the wall. In terms of temporal and spatial variation of the relative viscosity, spatial variation is larger than temporal variation regardless of the aspect ratio and particle–wall distance.

Author Contributions

Conceptualization, M.K. and T.F.; methodology, M.K. and T.F.; software, M.K., T.F., and K.M.; validation, M.K.; investigation, M.K.; resources, T.F. and K.M.; writing—original draft preparation, M.K.; writing—review and editing, M.K., T.F., and K.M.; visualization, M.K.; supervision, T.F. and K.M.; project administration, T.F. and K.M.; funding acquisition, T.F. All authors have read and agreed to the published version of the manuscript.

Funding

This research was funded in part by JSPS KAKENHI Grant Number JP20K04266.

Institutional Review Board Statement

Not applicable.

Informed Consent Statement

Not applicable.

Data Availability Statement

Data sharing not applicable.

Conflicts of Interest

The authors declare no conflict of interest.

Nomenclature

ARaspect ratio
asemi-major axis
bsemi-minor axis
C (C1, C2, C3)confinement
cssound speed
clattice speed
Dchannel width (characteristic length)
Dpdiameter of sphere
eαdiscrete velocity vector
fαdistribution function
f α eq equilibrium distribution function
f α neq non-equilibrium distribution function
f α * virtual distribution function
f α eq * virtual equilibrium distribution function
Fptotal force vector acting on the particle
Imoment of inertia
Lchannel length
mmass of the suspended particle
nnormal unit vector
p0reference pressure
pppressure on the solid particle surface
Δp0pressure drop for particle-free flow
Δppressure drop
pαpressure distribution function
ReReynolds number
Repparticle Reynolds number
rradius of circular particle
ttime
Tptorque for particle
Twstress tensor
Ucharacteristic velocity
ufluid velocity vector
Δx, Δygrid resolution
xpposition vector for particle
yeqequilibrium position of inertial migration
y0initial position of a particle in y-coordinate
wαweight coefficients
εellipticity
η eff effective viscosity
η 0 viscosity of solvent
[η]intrinsic viscosity
θpparticle angle
Π i j neq non-equilibrium stress tensor
ρfluid density
τsingle relaxation time
τwshear stress tensor
τ0wall shear stress for particle-free flow
ϕ area fraction

Abbreviations

eqequilibrium
neqnon-equilibrium
effeffective

Appendix A

In order to validate the numerical results, a numerical simulation of shear flow with a tumbling plorate spheroid was carried out, and the intrinsic viscosity was calculated from Equations (1) and (32). The diameter of sphere Dp included 20 cells, and the computational domain was 20 Dp × 20 Dp × 20 Dp. The confinement was set to C3 = 0.05, and each volume of the spheroids was the same. The particle Reynolds number was set to ReP = 0.125. To compare the geometry of the spheroid, ellipticity ε was defined as
ε = a b a ,
by referring to Huang et al. [10]. The intrinsic viscosity was determined to be averaged for non-dimensional time t = 15–20 for ε = 0 and for one rotational period at t > 20 for ε > 0. The results are shown in Figure A1 with others.
Figure A1. Intrinsic viscosities of a single prolate spheroid in the shear flow in three-dimensional conditions.
Applsci 11 06727 g0a1

References

  1. Stickel, J.; Powell, R.L. Fluid Mechanics and Rheology of Dense Suspensions. Annu. Rev. Fluid Mech. 2005, 37, 129–149. [Google Scholar] [CrossRef]
  2. Segré, G.; Silberberg, A. Behaviour of macroscopic rigid spheres in Poiseuille flow: Part 2. Experimental results and interpretation. J. Fluid Mech. 1962, 14, 136–157. [Google Scholar] [CrossRef]
  3. Fukui, T.; Kawaguchi, M.; Morinishi, K. Numerical Study of the Microstructure of a Dilute Suspension to Assess Its Thixotropic Behavior by a Two-Way Coupling Scheme. Adv. Fluid Mech. XIII 2020, 128, 47–58. [Google Scholar] [CrossRef]
  4. Chen, S.-D.; Pan, T.-W.; Chang, C.-C. The motion of a single and multiple neutrally buoyant elliptical cylinders in plane Poiseuille flow. Phys. Fluids 2012, 24, 103302. [Google Scholar] [CrossRef]
  5. Wen, B.; Chen, H.; Qin, Z.; He, B.; Zhang, C. Lateral migration and nonuniform rotation of suspended ellipse in Poiseuille flow. Comput. Math. Appl. 2019, 78, 1142–1153. [Google Scholar] [CrossRef]
  6. Einstein, A. Eine neue bestimmung der molekuldimensionenm. Ann. Phys. 1906, 19, 289–306. [Google Scholar] [CrossRef] [Green Version]
  7. Brady, J.F. The Einstein viscosity correction in n dimensions. Int. J. Multiph. Flow 1984, 10, 113–114. [Google Scholar] [CrossRef]
  8. Liu, J.; Li, C.; Ye, M.; Liu, Z. On the shear viscosity of dilute suspension containing elliptical porous particles at low Reynolds number. Powder Technol. 2019, 354, 108–114. [Google Scholar] [CrossRef]
  9. Jeffery, G.B. The motion of ellipsoidal particles immersed in a viscous fluid. Proc. R. Soc. Lond. Ser. A Math. Phys. Sci. 1922, 102, 161–179. [Google Scholar] [CrossRef] [Green Version]
  10. Huang, H.; Wu, Y.; Lu, X. Shear viscosity of dilute suspensions of ellipsoidal particles with a lattice Boltzmann method. Phys. Rev. E 2012, 86, 046305. [Google Scholar] [CrossRef] [PubMed] [Green Version]
  11. Doyeux, V.; Priem, S.; Jibuti, L.; Farutin, A.; Ismail, M.; Peyla, P. Effective viscosity of two-dimensional suspensions: Confinement effects. Phys. Rev. Fluids 2016, 1, 043301. [Google Scholar] [CrossRef] [Green Version]
  12. Fukui, T.; Kawaguchi, M.; Morinishi, K. A two-way coupling scheme to model the effects of particle rotation on the rheological properties of a semidilute suspension. Comput. Fluids 2018, 173, 6–16. [Google Scholar] [CrossRef]
  13. Fukui, T.; Kawaguchi, M.; Morinishi, K. Numerical study on the inertial effects of particles on the rheology of a suspension. Adv. Mech. Eng. 2019, 11, 1–10. [Google Scholar] [CrossRef]
  14. Xiong, W.; Zhang, J. Shear Stress Variation Induced by Red Blood Cell Motion in Microvessel. Ann. Biomed. Eng. 2010, 38, 2649–2659. [Google Scholar] [CrossRef]
  15. Jou, L.-D.; Lee, D.; Morsi, H.; Mawad, M. Wall Shear Stress on Ruptured and Unruptured Intracranial Aneurysms at the Internal Carotid Artery. Am. J. Neuroradiol. 2008, 29, 1761–1767. [Google Scholar] [CrossRef] [Green Version]
  16. Hu, X.; Lin, J.; Guo, Y.; Ku, X. Motion and equilibrium position of elliptical and rectangular particles in a channel flow of a power-law fluid. Powder Technol. 2021, 377, 585–596. [Google Scholar] [CrossRef]
  17. Başaǧaoǧlu, H.; Succi, S.; Wyrick, D.; Blount, J. Particle Shape Influences Settling and Sorting Behavior in Microfluidic Domains. Sci. Rep. 2018, 8, 8583. [Google Scholar] [CrossRef] [PubMed] [Green Version]
  18. Izham, M.; Fukui, T.; Morinishi, K. Application of Regularized Lattice Boltzmann Method for Incompressible Flow Simulation at High Reynolds Number and Flow with Curved Boundary. J. Fluid Sci. Technol. 2011, 6, 812–822. [Google Scholar] [CrossRef] [Green Version]
  19. Qian, Y.H.; D’Humières, D.; Lallemand, P. Lattice BGK Models for Navier-Stokes Equation. EPL Europhys. Lett. 1992, 17, 479–484. [Google Scholar] [CrossRef]
  20. He, X.; Luo, L.-S. Lattice Boltzmann Model for the Incompressible Navier–Stokes Equation. J. Stat. Phys. 1997, 88, 927–944. [Google Scholar] [CrossRef]
  21. Mei, R.; Yu, D.; Shyy, W.; Luo, L.-S. Force evaluation in the lattice Boltzmann method involving curved geometry. Phys. Rev. E 2002, 65, 041203. [Google Scholar] [CrossRef] [Green Version]
  22. Tanno, I.; Morinishi, K.; Matsuno, K.; Nishida, H. Validation of Virtual Flux Method for Forced Convection Flow. JSME Int. J. Ser. B 2006, 49, 1141–1148. [Google Scholar] [CrossRef] [Green Version]
  23. Morinishi, K.; Fukui, T. An Eulerian approach for fluid–structure interaction problems. Comput. Fluids 2012, 65, 92–98. [Google Scholar] [CrossRef]
  24. Peskin, C.S. Flow patterns around heart valves: A numerical method. J. Comput. Phys. 1972, 10, 252–271. [Google Scholar] [CrossRef]
  25. Su, J.; Chen, X.; Hu, G. Inertial migrations of cylindrical particles in rectangular microchannels: Variations of equilibrium positions and equivalent diameters. Phys. Fluids 2018, 30, 032007. [Google Scholar] [CrossRef] [Green Version]
  26. Udono, H.; Sakai, M. Numerical evaluation of lift forces acting on a solid particle in a microchannel. J. Soc. Powder Technol. Japan 2017, 54, 454–459. [Google Scholar] [CrossRef] [Green Version]
  27. Pozrikidis, C. Orientation statistics and effective viscosity of suspensions of elongated particles in simple shear flow. Eur. J. Mech. B/Fluids 2005, 24, 125–136. [Google Scholar] [CrossRef]
  28. Inamuro, T.; Maeba, K.; Ogino, F. Flow between parallel walls containing the lines of neutrally buoyant circular cylinders. Int. J. Multiph. Flow 2000, 26, 1981–2004. [Google Scholar] [CrossRef]
  29. Freund, J.B.; Vermot, J. The Wall-stress Footprint of Blood Cells Flowing in Microvessels. Biophys. J. 2014, 106, 752–762. [Google Scholar] [CrossRef] [Green Version]
Figure 1. Simulation model including a single particle in pressure-driven plane Poiseuille flow. The center of the circular or elliptical particle was initially located at y = y0 with particle angle to the flow direction θp = 0. The computational domain was L × D, and periodic boundary condition with pressure difference was applied in the flow direction.
Applsci 11 06727 g001
Figure 2. Schematic view of elliptical particles for comparison of three different definitions of confinement. The parameter of confinement C was chosen by the researchers, i.e., semi-major axis a, semi-minor axis b, and equivalent radius r of a circular particle with the same area.
Applsci 11 06727 g002
Figure 3. Schematic view of virtual boundary on a Cartesian grid.
Applsci 11 06727 g003
Figure 4. Lift coefficient profiles of a single circular particle with C3 = 0.05 for four different periodic lengths L/D = 1, 2, 4, and 6 (the number of cells for D was 600).
Applsci 11 06727 g004
Figure 5. Lift coefficient profiles of a single circular particle with C3 = 0.05 for different grid resolutions: 400, 600, and 800 cells for D in the condition of L/D = 4.
Applsci 11 06727 g005
Figure 6. Lift coefficient profiles of a single circular and elliptical particle with (a) C3 = 0.05, (b) C3 = 0.1, and (c) C3 = 0.2 for different aspect ratios AR = 1, 2, and 4. Note that the vertical axis scale is different for each figure for clarity.
Applsci 11 06727 g006
Figure 7. Comparison of equilibrium position as a function of confinement with three different definitions.
Applsci 11 06727 g007
Figure 8. Comparison of relative viscosity of different aspect ratios and confinement. Note that the vertical axis scale is different for each figure for clarity.
Applsci 11 06727 g008
Figure 9. Distributions of local relative viscosity determined by wall shear stress on the (a) upper and (c) lower wall for a circular particle flowing at y/D = 0.2 with various confinements C3 = 0.05 (blue dashed line), 0.1 (green dot-dashed line), and 0.2 (red solid line). The red shadow indicates the region where the particle exists for C3 = 0.2 as shown in (b) with axial velocity distribution. The forward and backward peaks of the local relative viscosity on the lower wall are denoted by τ1 and τ2, respectively.
Applsci 11 06727 g009
Figure 10. Time history of difference of peak relative viscosity on the lower wall (red solid line) and angular acceleration (blue dashed line) for AR = 2 and C3 = 0.1.
Applsci 11 06727 g010
Figure 11. Comparison of temporal (circle) and spatial (triangle) standard deviation of effective viscosity for AR = 2 with confinement C3 = 0.05 (filled in blue) and 0.1 (red).
Applsci 11 06727 g011
Table 1. Normalized equilibrium position yeq/D of a single circular particle with C3 = 0.05 for different periodic lengths L/D = 1, 2, 4, and 6 (the number of cells for D was 600).
L/D [-]yeq/D [-]
10.248
20.256
40.258
60.258
Table 2. Normalized equilibrium position yeq/D of a single circular particle with C3 = 0.05 for different grid resolutions. The parameters D and 2r denote the number of grids for channel width and particle diameter, respectively.
Number of Cells for D [Cells]Number of Cells for 2r [Cells]yeq/D [-]
400200.255
600300.258
800400.258
Table 3. Normalized equilibrium position yeq/D of a single circular and elliptical particle with C3 = 0.05, 0.1, and 0.2 for different aspect ratios.
AR [-]yeq/D [-]
C3 = 0.05C3 = 0.1C3 = 0.2
10.2580.2630.277
20.2600.2670.284
40.2600.2820.314
Publisher’s Note: MDPI stays neutral with regard to jurisdictional claims in published maps and institutional affiliations.