
Performance Improvement of Decision Tree: A Robust Classifier Using Tabu Search Algorithm

 ,
,  ,
,  ,
,
Abstract
:1. Introduction
Our Contributions
- We proposed a performance-oriented classifier algorithm for training supervised ML models over large datasets using decision tree and tabu search algorithms, respectively. We termed the proposed classifier algorithm “tabu search oriented decision tree (TSODT)” (see Section 4).
- We provided a functional setup for the proposed TSODT classifier algorithm to perform several experimentations (as can be seen in Section 5).
- The linear and logarithmic Big O evaluation of our proposed classifier is presented (as can be seen in Section 6.4.3).
- We provided a statistical analysis of the proposed TSODT classifier algorithm (see Section 6.4.3).
2. Existing Classifiers and Their Limitations
3. Preliminaries
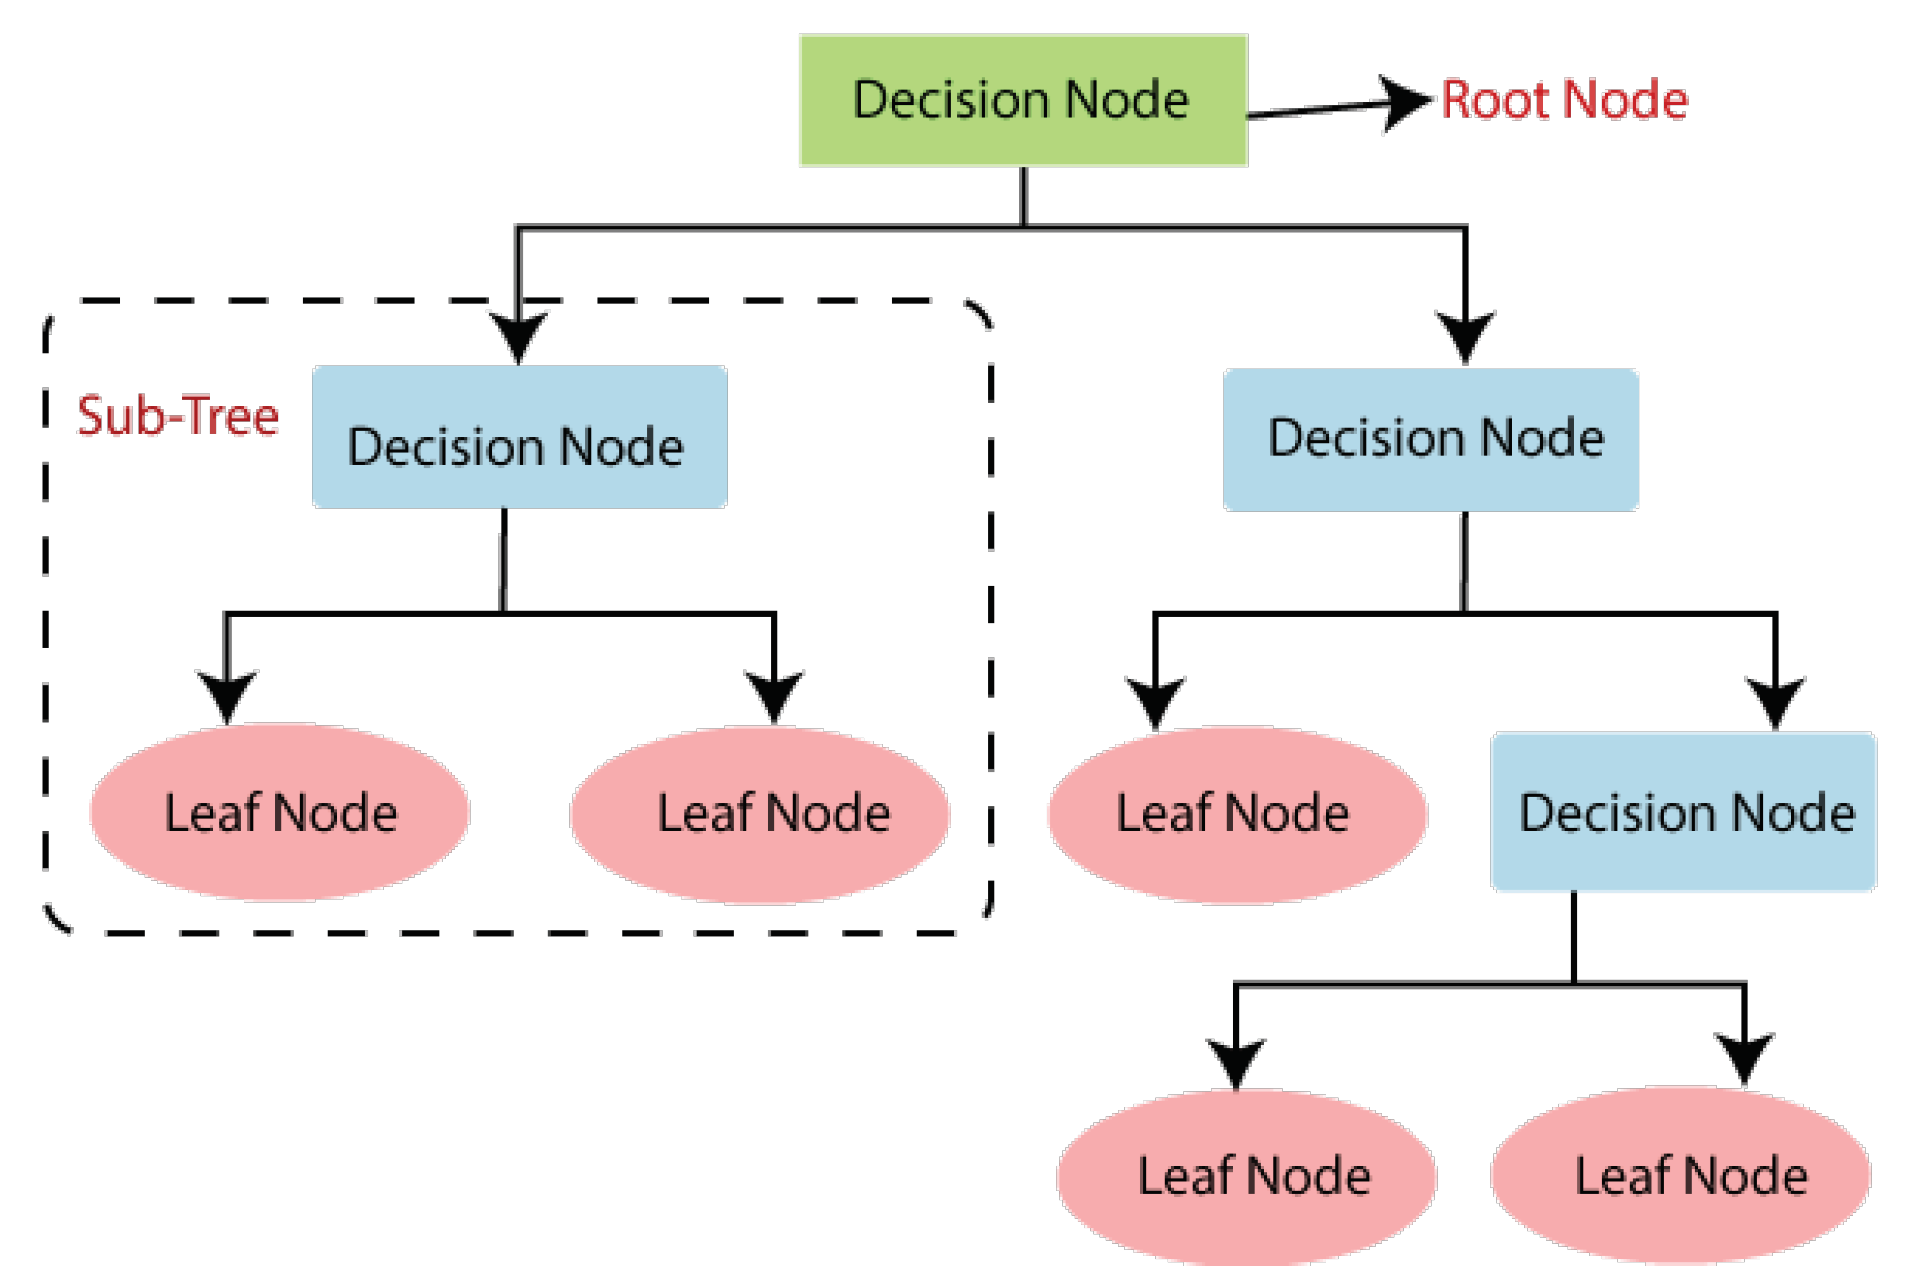
3.1. Decision Tree Algorithm
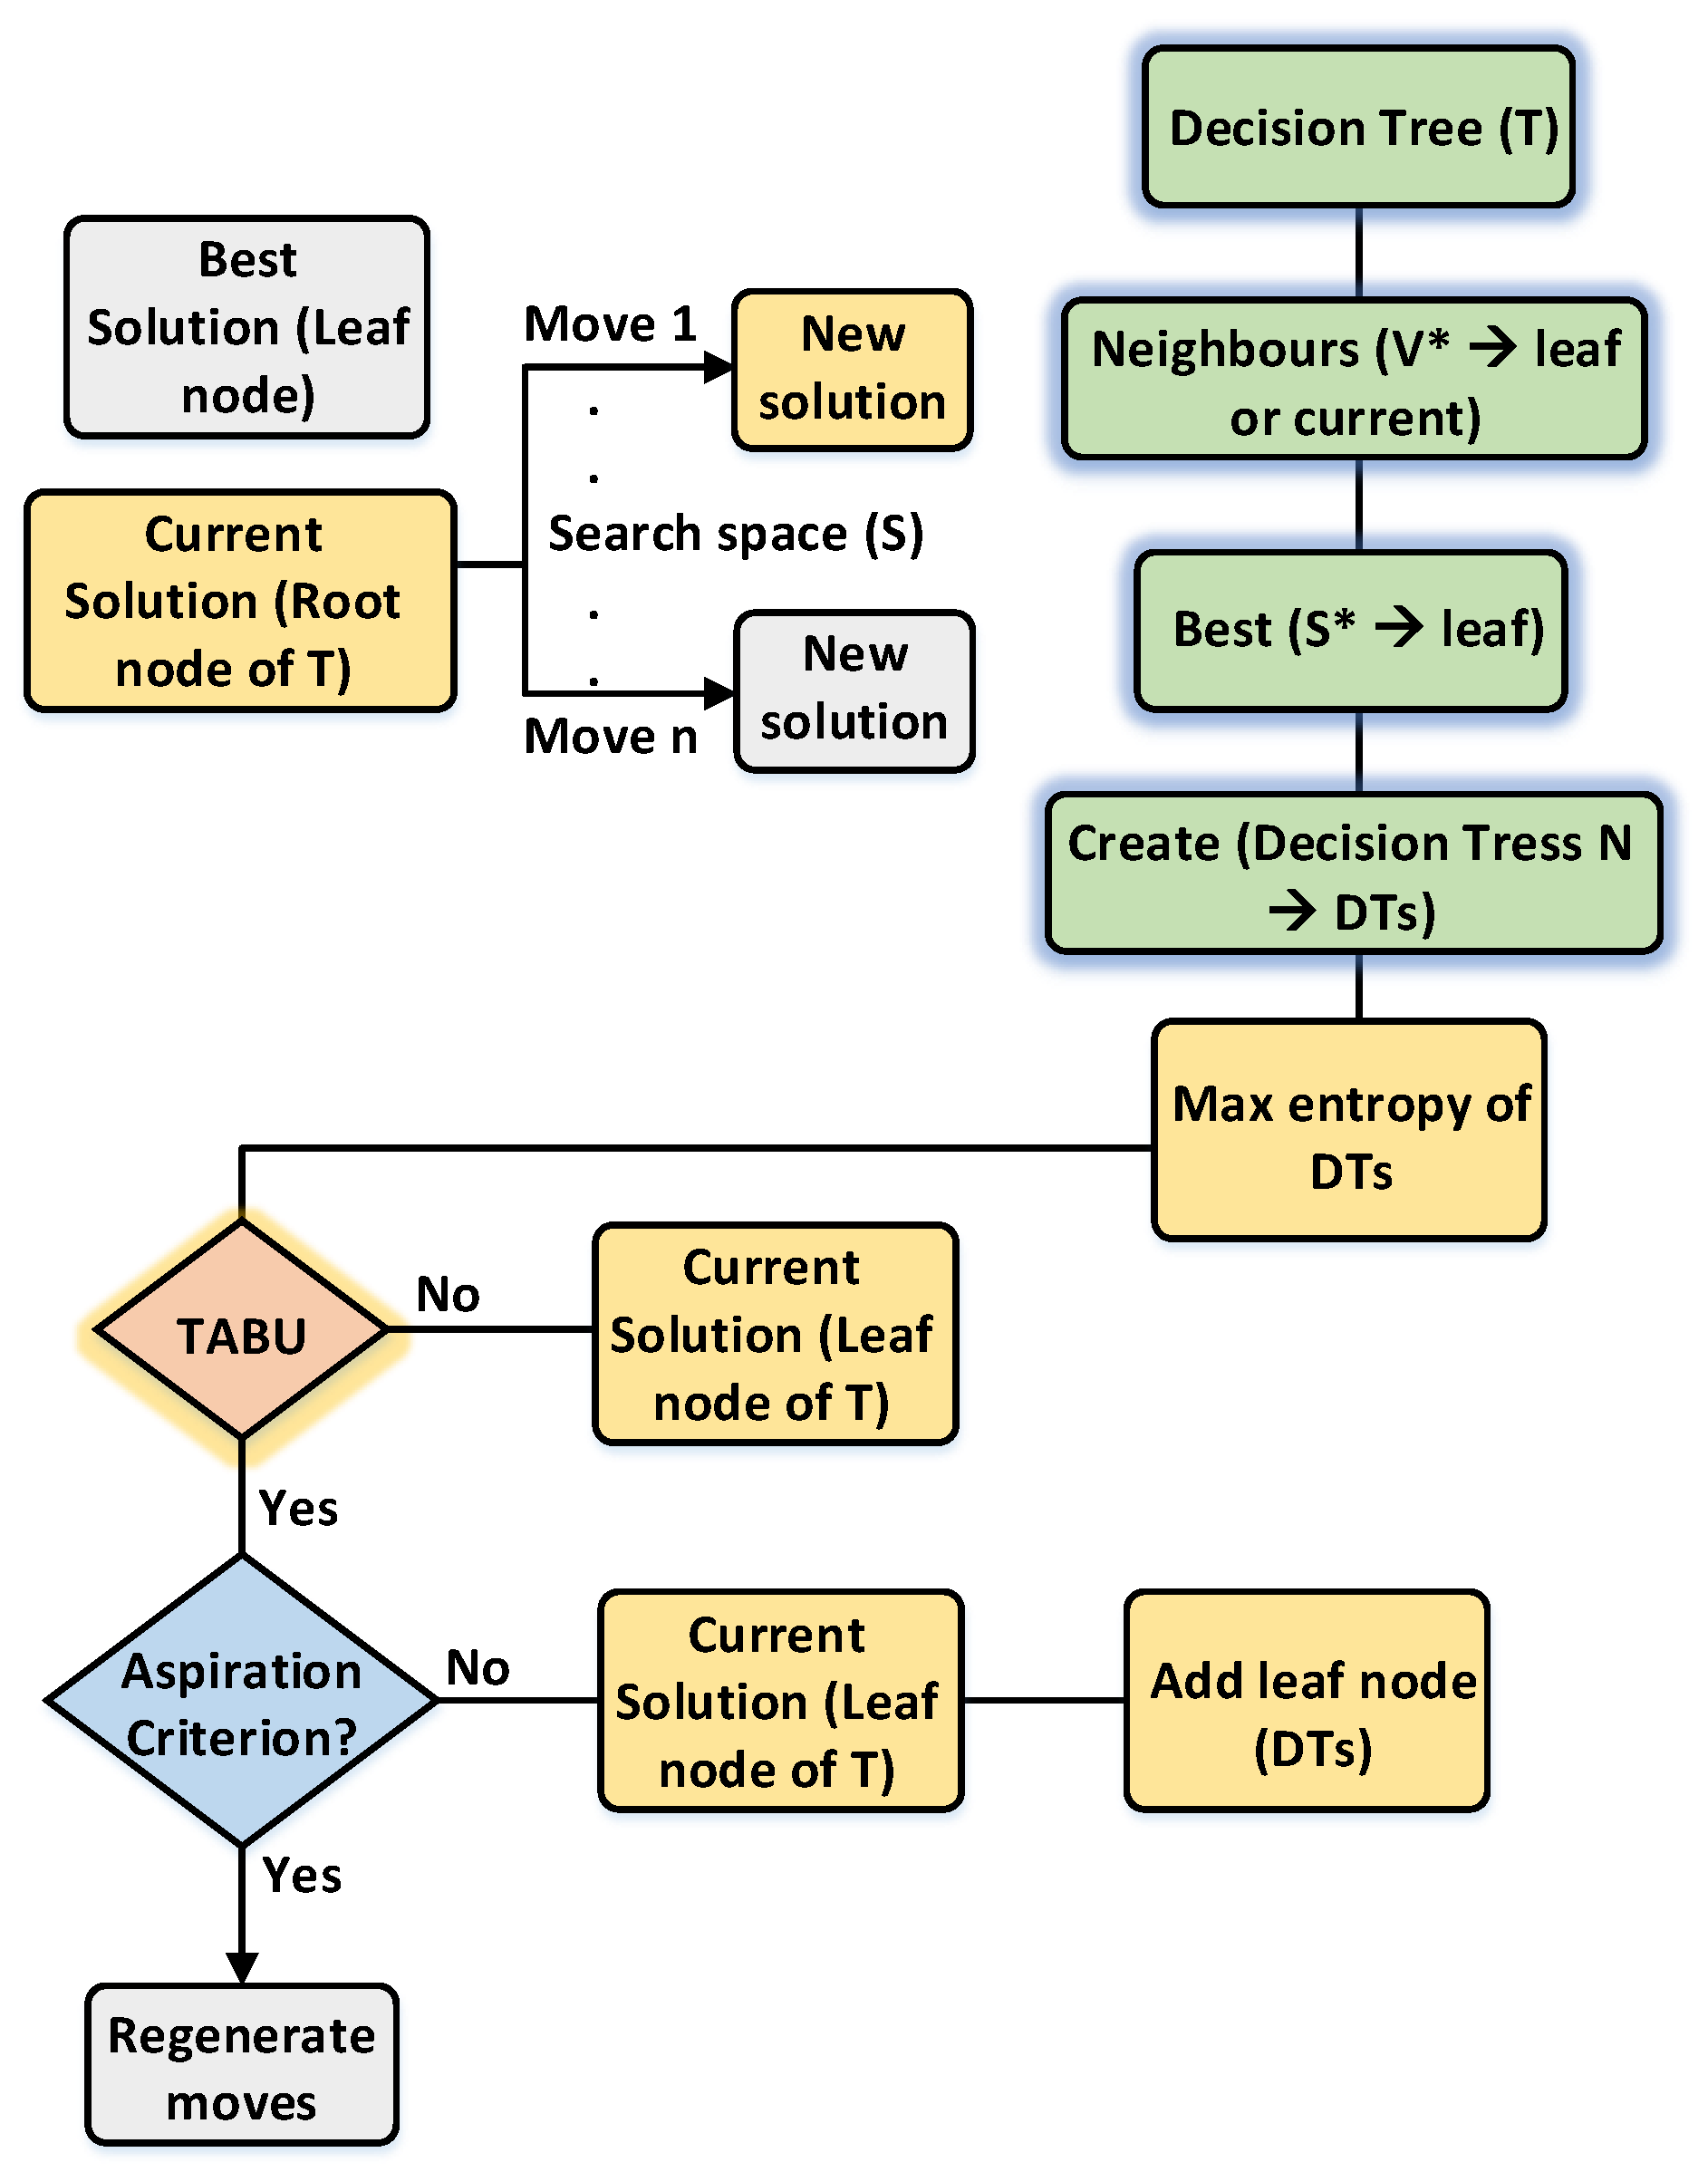
4. Proposed Classifier Algorithm
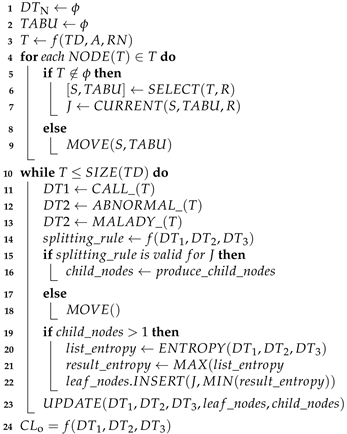
| Algorithm 1: Proposed Tabu Search Oriented Decision Tree (TSODT) Algorithm |
Input: TD (training data), R (target aspiration), N (number of decision trees), RN( rootnode), A (attributes of trainig data) |
Output: CLo ← f (TD, R, N, RN) |
 |
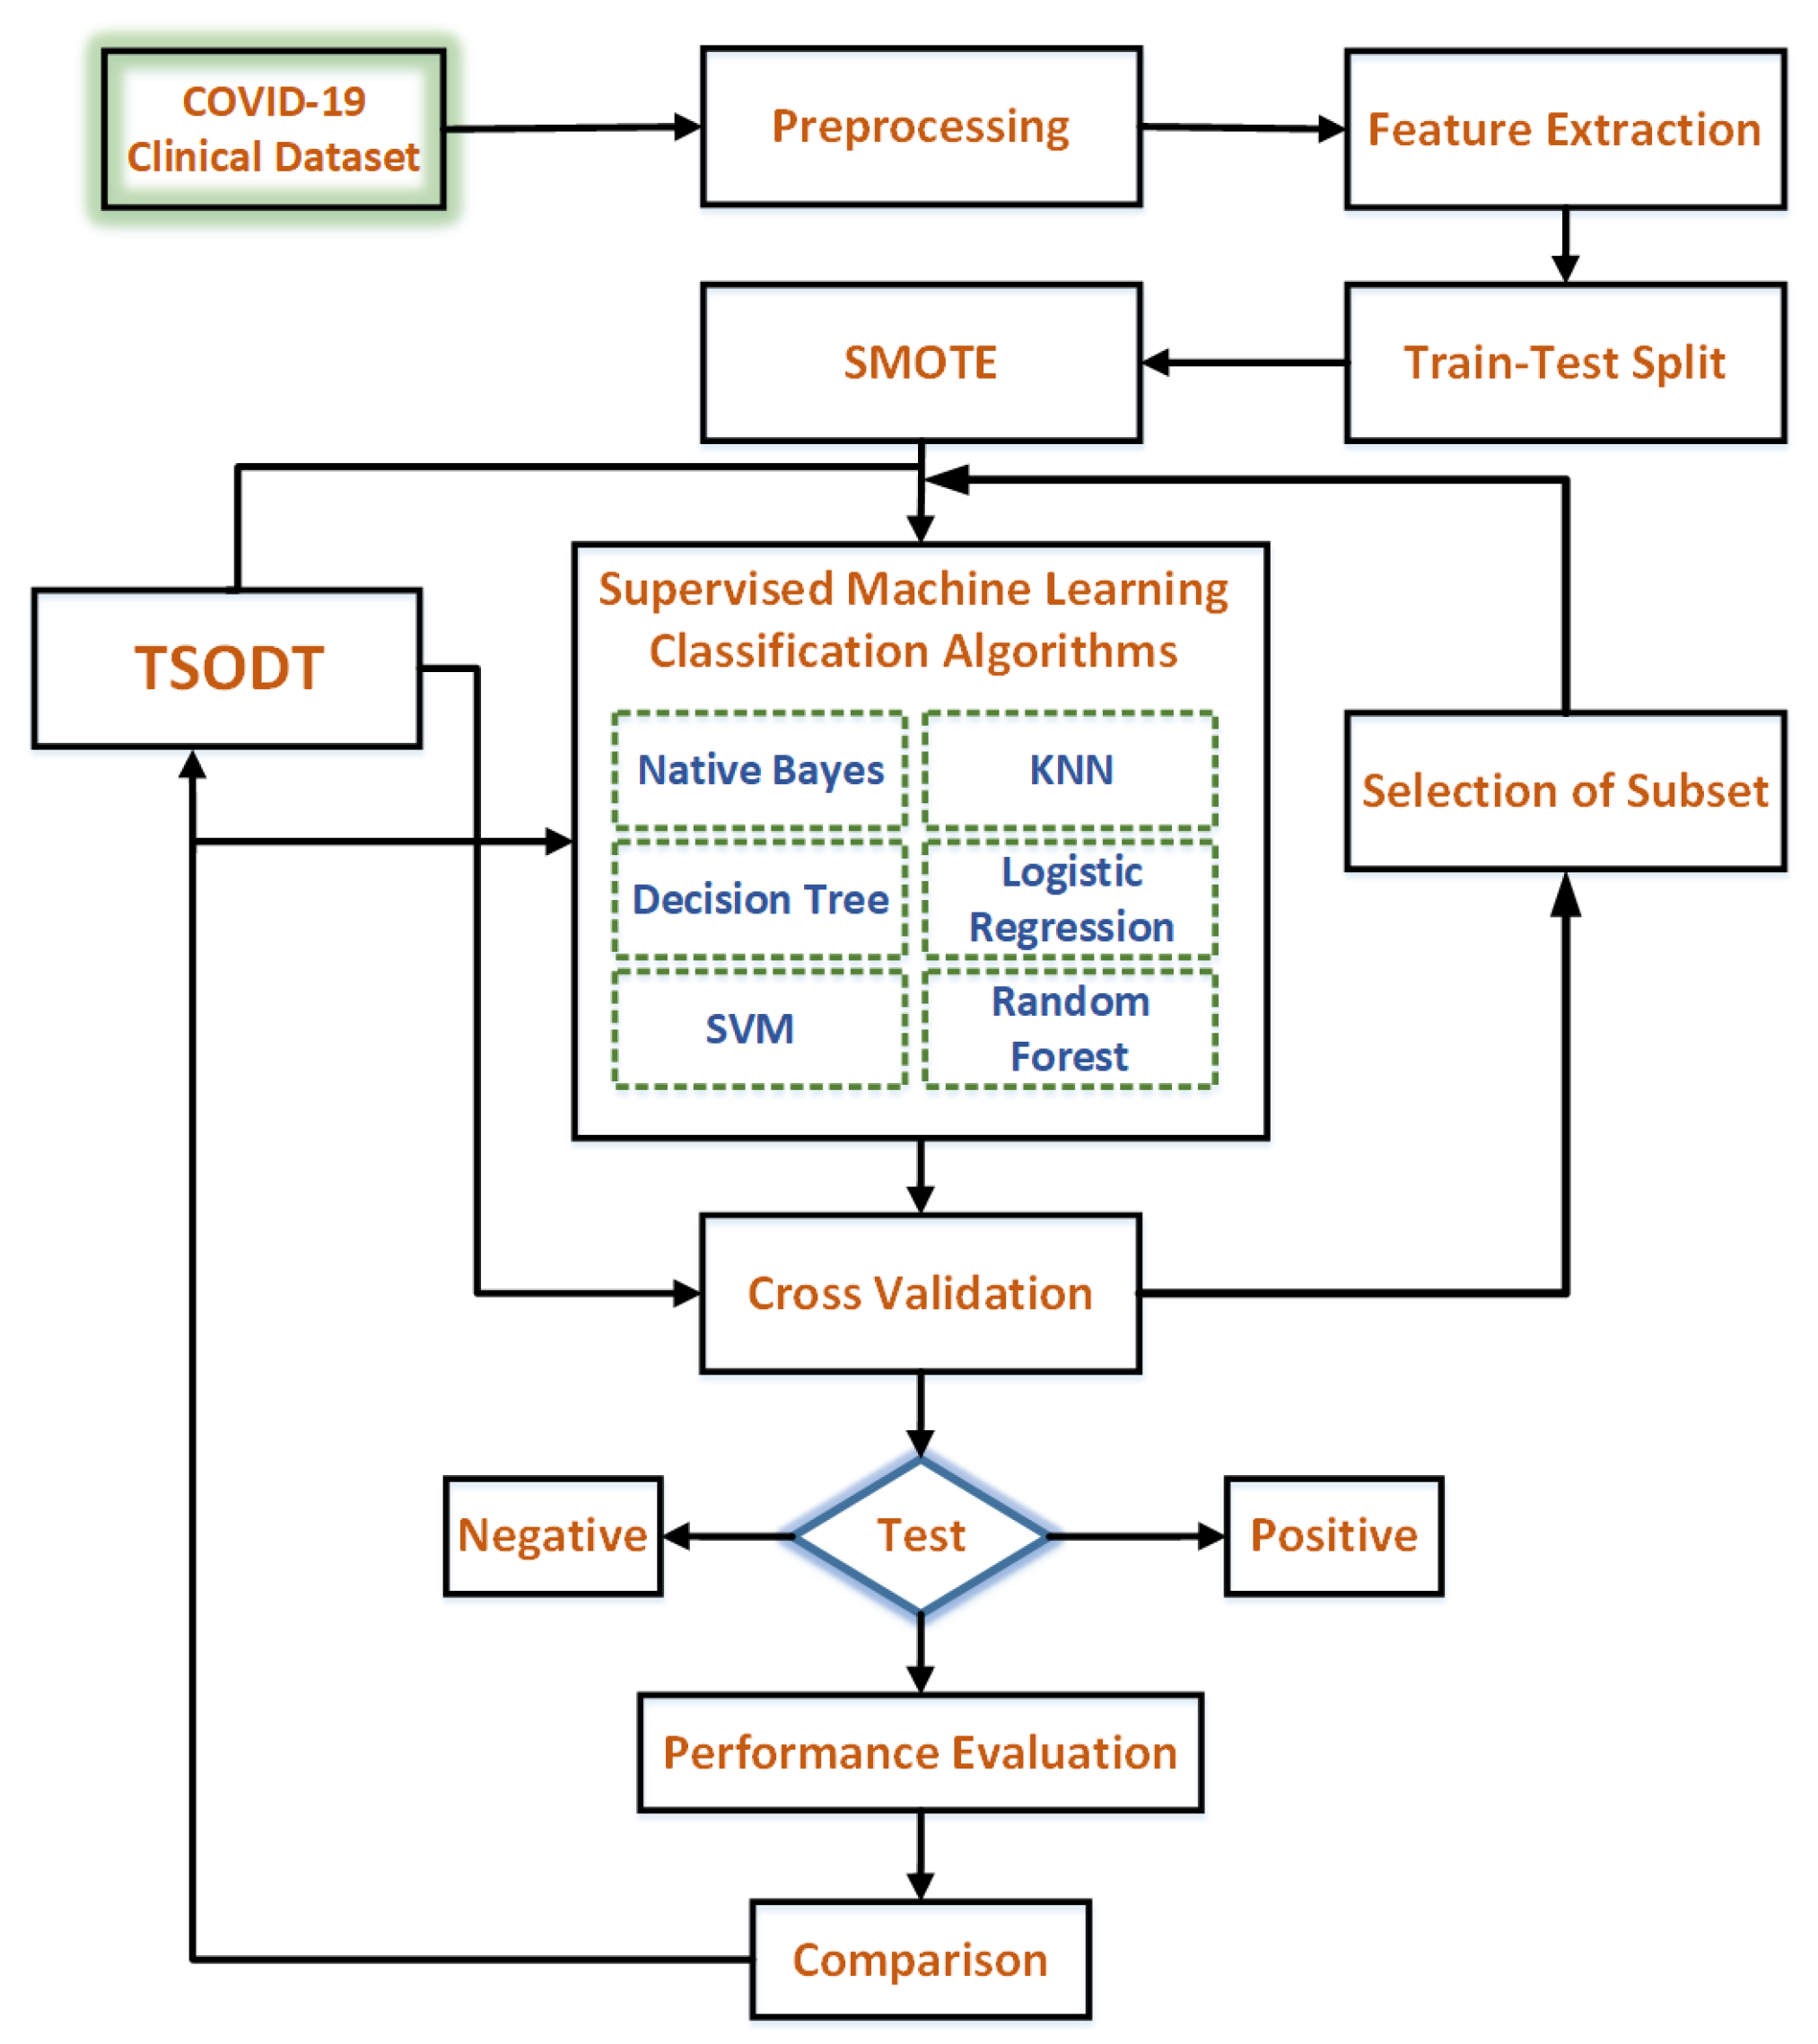
5. Experimental Setup for the Evaluation of Tsodt
5.1. Clinical Data
5.2. Preprocessing
5.2.1. Categorical Data into Numeric Data
5.2.2. Missing Data
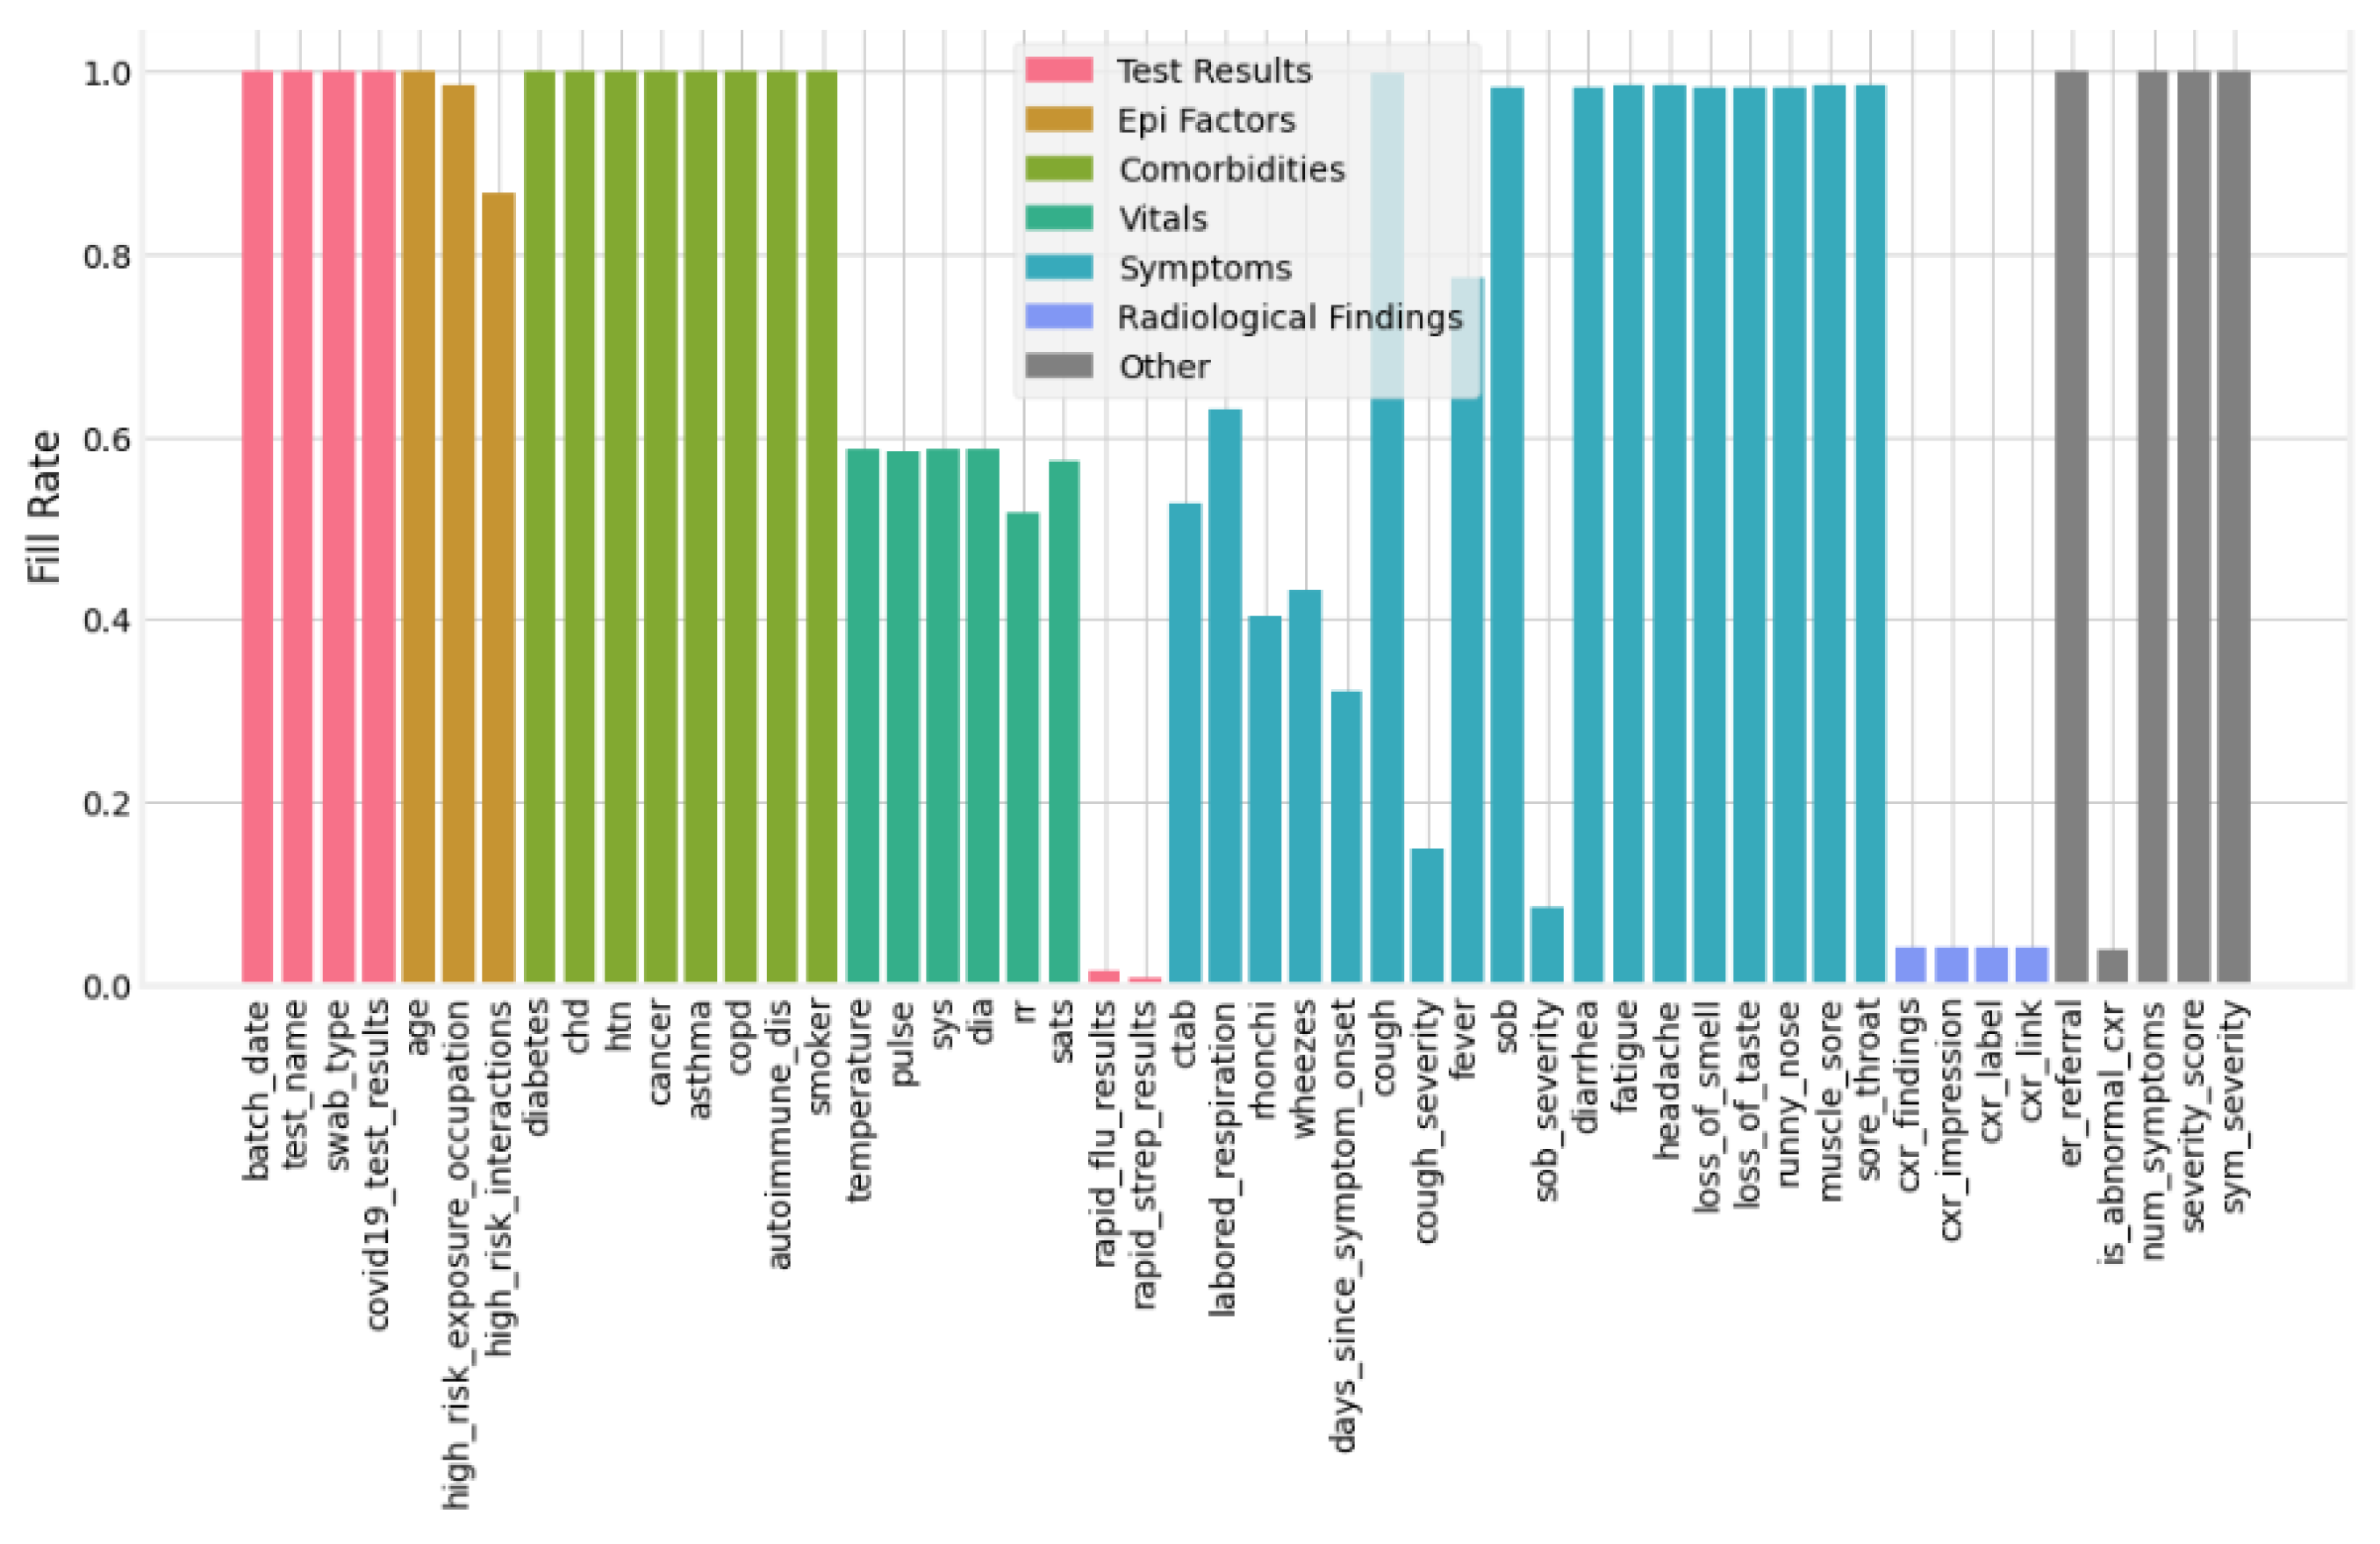
- The columns with ≥50% missing data are dropped from the dataset. Consequently, after removing irrelevant and more than 50% missing data columns, the remaining columns are 31 (shown in Figure 5).
- For those features having less than 50% missing data, respective records/rows are dropped. After dropping missing data rows, 3616 records of patients were left for training and testing.
5.3. Feature Extraction
5.4. Classification Algorithms
5.5. Test–Train Split
5.6. Class Imbalance
6. Experimental Results and Performance Evaluations
6.1. Parameters for Classifiers
6.2. Criterion to Calculate the Results
6.3. Calculated Results
6.4. Performance Comparison
6.4.1. Comparison to Conventional Classifiers
6.4.2. Comparison to State-of-the-Art Classifier Algorithms
6.4.3. Performance Validation of the Proposed TSODT Classifier Algorithm
7. Conclusions
Author Contributions
Funding
Institutional Review Board Statement
Informed Consent Statement
Data Availability Statement
Acknowledgments
Conflicts of Interest
Appendix A. Mathematical Equations
References
- Russell, S. Artificial Intelligence: A Modern Approach, 4th ed.; Pearson: New York, NY, USA, 2019. [Google Scholar]
- Sivasakthi, M. Classification and prediction based data mining algorithms to predict students’ introductory programming performance. In Proceedings of the 2017 International Conference on Inventive Computing and Informatics (ICICI), Coimbatore, India, 23–24 November 2017; pp. 346–350. [Google Scholar] [CrossRef]
- Savla, A.; Israni, N.; Dhawan, P.; Mandholia, A.; Bhadada, H.; Bhardwaj, S. Survey of classification algorithms for formulating yield prediction accuracy in precision agriculture. In Proceedings of the 2015 International Conference on Innovations in Information, Embedded and Communication Systems (ICIIECS), Coimbatore, India, 19–20 March 2015; pp. 1–7. [Google Scholar] [CrossRef]
- Imran, M.; Bashir, F.; Jafri, A.R.; Rashid, M.; ul Islam, M.N. A systematic review of scalable hardware architectures for pattern matching in network security. Comput. Electr. Eng. 2021, 92, 107169. [Google Scholar] [CrossRef]
- Negi, A.; Rajesh, K. A Review of AI and ML Applications for Computing Systems. In Proceedings of the 2019 9th International Conference on Emerging Trends in Engineering and Technology—Signal and Information Processing (ICETET-SIP-19), Nagpur, India, 1–2 November 2019; pp. 1–6. [Google Scholar] [CrossRef]
- Shehzad, F.; Rashid, M.; Sinky, M.H.; Alotaibi, S.S.; Zia, M.Y.I. A Scalable System-on-Chip Acceleration for Deep Neural Networks. IEEE Access 2021, 9, 95412–95426. [Google Scholar] [CrossRef]
- Binkhonain, M.; Zhao, L. A review of machine learning algorithms for identification and classification of non-functional requirements. Expert Syst. Appl. X 2019, 1, 100001. [Google Scholar]
- Hady, M.F.A.; Schwenker, F. Semi-supervised Learning. In Handbook on Neural Information Processing; Bianchini, M., Maggini, M., Jain, L.C., Eds.; Springer: Berlin/Heidelberg, Germany, 2013; pp. 215–239. [Google Scholar]
- Rashid, M.; Imran, M.; Jafri, A.R. Exploration of Hardware Architectures for String Matching Algorithms in Network Intrusion Detection Systems. In Proceedings of the 11th International Conference on Advances in Information Technology; Association for Computing Machinery: New York, NY, USA, 2020. [Google Scholar]
- Navada, A.; Ansari, A.N.; Patil, S.; Sonkamble, B.A. Overview of use of decision tree algorithms in machine learning. In Proceedings of the 2011 IEEE Control and System Graduate Research Colloquium, Shah Alam, Malaysia, 27–28 June 2011; pp. 37–42. [Google Scholar] [CrossRef]
- Hao, H.; Chen, T.; Lu, J.; Liu, J.; Ma, X. The Research and Analysis in Decision Tree Algorithm Based on C4.5 Algorithm. In Proceedings of the 2018 IEEE 3rd Advanced Information Technology, Electronic and Automation Control Conference (IAEAC), Chongqing, China, 12–14 October 2018; pp. 1882–1886. [Google Scholar] [CrossRef]
- RMishina, V.; Khomyakova, L. Dedollarization and settlements in national currencies: Eurasian and Latin American experience. Vopr. Ekon. 2020, 9, 61–79. [Google Scholar] [CrossRef]
- Zhang, S.; Li, X.; Zong, M.; Zhu, X.; Wang, R. Efficient kNN Classification With Different Numbers of Nearest Neighbors. IEEE Trans. Neural Netw. Learn. Syst. 2018, 29, 1774–1785. [Google Scholar] [CrossRef]
- Aksoy, G.; Karabatak, M. Performance Comparison of New Fast Weighted Naïve Bayes Classifier with Other Bayes Classifiers. In Proceedings of the 2019 7th International Symposium on Digital Forensics and Security (ISDFS), Barcelos, Portugal, 10–12 June 2019; pp. 1–5. [Google Scholar]
- Junli, C.; Licheng, J. Classification mechanism of support vector machines. In Proceedings of the WCC 2000—ICSP 2000, 2000 5th International Conference on Signal Processing, 16th World Computer Congress, Beijing, China, 21–25 August 2000; Volume 3, pp. 1556–1559. [Google Scholar] [CrossRef]
- Rashid, M.; Shah, S.A.B.; Arif, M. Determination of Worst-Case Data using an Adaptive Surrogate Model for Real-Time System. J. Circuits Syst. Comput. 2020, 29, 2050005. [Google Scholar] [CrossRef]
- Shah, S.A.B.; Rashid, M.; Arif, M. Estimating WCET using prediction models to compute fitness function of a genetic algorithm. Real-Time Syst. 2020, 56, 28–63. [Google Scholar] [CrossRef]
- Al Hamad, M.; Zeki, A.M. Accuracy vs. Cost in Decision Trees: A Survey. In Proceedings of the 2018 International Conference on Innovation and Intelligence for Informatics, Computing, and Technologies (3ICT), Sakhier, Bahrain, 18–20 November 2018; pp. 1–4. [Google Scholar] [CrossRef]
- Alam, F.I.; Bappee, F.K.; Rabbani, M.R.; Islam, M.M. An Optimized Formulation of Decision Tree Classifier. In Advances in Computing, Communication, and Control; Unnikrishnan, S., Surve, S., Bhoir, D., Eds.; Springer: Singapore, 2013; pp. 105–118. [Google Scholar]
- Zhang, H.; Zhou, R. The analysis and optimization of decision tree based on ID3 algorithm. In Proceedings of the 2017 9th International Conference on Modelling, Identification and Control (ICMIC), Kunming, China, 10–12 July 2017; pp. 924–928. [Google Scholar] [CrossRef]
- Jati, W.K.; Kemas Muslim, L. Optimization of Decision Tree Algorithm in Text Classification of Job Applicants Using Particle Swarm Optimization. In Proceedings of the 2020 3rd International Conference on Information and Communications Technology (ICOIACT), Yogyakarta, Indonesia, 24–25 November 2020; pp. 201–205. [Google Scholar] [CrossRef]
- Yuan, F.; Lian, F.; Xu, X.; Ji, Z. Decision tree algorithm optimization research based on MapReduce. In Proceedings of the 2015 6th IEEE International Conference on Software Engineering and Service Science (ICSESS), Beijing, China, 23–25 September 2015; pp. 1010–1013. [Google Scholar] [CrossRef]
- Ahmed, A.M.; Rizaner, A.; Ulusoy, A.H. A Decision Tree Algorithm Combined with Linear Regression for Data Classification. In Proceedings of the 2018 International Conference on Computer, Control, Electrical, and Electronics Engineering (ICCCEEE), Khartoum, Sudan, 12–14 August 2018; pp. 1–5. [Google Scholar] [CrossRef]
- Eman Abdel, M.; Sherif, B.; Mohammed, E. Chapter 9—Medical Images Analysis Based on Multilabel Classification. In Machine Learning in Bio-Signal Analysis and Diagnostic Imaging; Nilanjan, D., Surekha, B., Amira, S.A., Fuqian, S., Eds.; Academic Press: Cambridge, MA, USA, 2019; Chapter 10; pp. 209–245. [Google Scholar]
- Thangaparvathi, B.; Anandhavalli, D. An improved algorithm of decision tree for classifying large data set based on rainforest framework. In Proceedings of the 2010 International Conference on Communication Control and Computing Technologies, Nagercoil, India, 7–9 October 2010; pp. 800–805. [Google Scholar] [CrossRef]
- Donna, K.K. Investigating the Use of Tabu Search to Find Near-Optimal Solutions in Multiclassifier Systems; University of Texas at Austin: Austin, TX, USA, 2013. [Google Scholar]
- Silvia, C.Y.; Joaquín, P.B. Tabu Search for Variable Selection in Classification. In Encyclopedia of Data Warehousing and Mining; IGI Global: Hershey, PA, USA, 2009; pp. 1909–1915. [Google Scholar]
- Orsenigo, C.; Vercellis, C. Discrete support vector decision trees via tabu search. Comput. Stat. Data Anal. 2004, 47, 311–322. [Google Scholar] [CrossRef]
- Li, X.B.; Sweigart, J.; Teng, J.; Donohue, J.; Thombs, L.; Wang, S. Multivariate decision trees using linear discriminants and tabu search. IEEE Trans. Syst. Man Cybern. Part A Syst. Hum. 2003, 33, 194–205. [Google Scholar] [CrossRef]
- Ansari, E.; Sadreddini, M.; Sadeghi Bigham, B.; Alimardani, F. A combinatorial cooperative-tabu search feature reduction approach. Sci. Iran. 2013, 20, 657–662. [Google Scholar] [CrossRef] [Green Version]
- Zhu, N.; Zhang, D.; Wang, W.; Li, X.; Yang, B.; Song, J.; Zhao, X.; Huang, B.; Shi, W.; Lu, R.; et al. A Novel Coronavirus from Patients with Pneumonia in China, 2019. N. Engl. J. Med. 2020, 382, 727–733. [Google Scholar] [CrossRef]
- Chan, J.F.W.; Yuan, S.; Kok, K.H.; To, K.K.W.; Chu, H.; Yang, J.; Xing, F.; Liu, J.; Yip, C.C.Y.; Poon, R.W.S.; et al. A familial cluster of pneumonia associated with the 2019 novel coronavirus indicating person-to-person transmission: A study of a family cluster. Lancet 2020, 395, 514–523. [Google Scholar] [CrossRef] [Green Version]
- Qin, L.; Yang, Y.; Cao, Q.; Cheng, Z.; Wang, X.; Sun, Q.; Yan, F.; Qu, J.; Yang, W. A predictive model and scoring system combining clinical and CT characteristics for the diagnosis of COVID-19. Eur. Radiol. 2020, 1–11. [Google Scholar] [CrossRef] [PubMed]
- Akib Mohi Ud Din, K.; Syed Tanzeel, R.; Qamar Rayees, K.; Nusrat, R.; Masarat, M.U.D. Machine learning based approaches for detecting COVID-19 using clinical text data. Int. J. Inf. Technol. 2020, 12, 731–739. [Google Scholar]
- Mienye, I.D.; Sun, Y.; Wang, Z. Prediction performance of improved decision tree-based algorithms: A review. Procedia Manuf. 2019, 35, 698–703. [Google Scholar] [CrossRef]
- Rustam, F.; Khalid, M.; Aslam, W.; Rupapara, V.; Mehmood, A.; Choi, G.S. A performance comparison of supervised machine learning models for COVID-19 tweets sentiment analysis. PLoS ONE 2021, 16, e0245909. [Google Scholar] [CrossRef] [PubMed]
- Zhong, L.; Mu, L.; Li, J.; Wang, J.; Yin, Z.; Liu, D. Early Prediction of the 2019 Novel Coronavirus Outbreak in the Mainland China Based on Simple Mathematical Model. IEEE Access 2020, 8, 51761–51769. [Google Scholar] [CrossRef] [PubMed]
- Muhammad, L.J.; Algehyne, E.A.; Usman, S.S.; Ahmad, A.; Chakraborty, C.; Mohammed, I.A. Supervised Machine Learning Models for Prediction of COVID-19 Infection using Epidemiology Dataset. SN Comput. Sci. 2020, 2, 11. [Google Scholar] [CrossRef]
- Carbon Health and Braid Health. Coronavirus Disease 2019 (COVID-19) Clinical Data Repository. 2020. Available online: https://github.com/mdcollab/covidclinicaldata (accessed on 10 May 2020).
- Sanagapati, P. A Simple Tutorial—How to Handle Missing Data. 2020. Available online: https://www.kaggle.com/pavansanagapati/simple-tutorial-how-to-handle-missing-data (accessed on 20 April 2020).
- Sudirman, I.; Nugraha, D. Naive bayes classifier for predicting the factors that influence death due to COVID-19 in China. J. Theor. Appl. Inf. Technol. 2020, 98, 1686–1696. [Google Scholar]
- Xu, K.; Zhou, M.; Yang, D.; Ling, Y.; Liu, K.; Bai, T.; Cheng, Z.; Li, J. Application of Ordinal Logistic Regression Analysis to Identify the Determinants of Illness Severity of COVID-19 in China. Epidemiol. Infect. 2020, 148, 1–25. [Google Scholar] [CrossRef]
- Sethy, P.K.; Behera, S.K.; Ratha, P.K.; Biswas, P. Detection of coronavirus Disease (COVID-19) based on Deep Features and Support Vector Machine. Int. J. Math. Eng. Manag. Sci. 2020, 643–651. [Google Scholar] [CrossRef]
- Iwendi, C.; Bashir, A.K.; Peshkar, A.; Sujatha, R.; Chatterjee, J.M.; Pasupuleti, S.; Mishra, R.; Pillai, S.; Jo, O. COVID-19 Patient Health Prediction Using Boosted Random Forest Algorithm. Front. Public Health 2020, 8, 357. [Google Scholar] [CrossRef] [PubMed]
- Bose, A. Cross Validation—Why & How. 2020. Available online: https://towardsdatascience.com/cross-validation-430d9a5fee2 (accessed on 8 May 2012).
- Chawla, N.; Bowyer, K.; Hall, L.; Kegelmeyer, W. SMOTE: Synthetic Minority Over-sampling Technique. J. Artif. Intell. Res. (JAIR) 2002, 16, 321–357. [Google Scholar] [CrossRef]
- Jiang, Z.; Pan, T.; Zhang, C.; Yang, J. A New Oversampling Method Based on the Classification Contribution Degree. Symmetry 2021, 13, 194. [Google Scholar] [CrossRef]
- Salazar, A.; Vergara, L.; Safont, G. Generative Adversarial Networks and Markov Random Fields for oversampling very small training sets. Expert Syst. Appl. 2021, 163, 113819. [Google Scholar] [CrossRef]
- Izonin, I.; Tkachenko, R.; Shakhovska, N.; Lotoshynska, N. The Additive Input-Doubling Method Based on the SVR with Nonlinear Kernels: Small Data Approach. Symmetry 2021, 13, 612. [Google Scholar] [CrossRef]
- Almansoor, M.; Hewahi, N.M. Exploring the Relation between Blood Tests and COVID-19 Using Machine Learning. In Proceedings of the 2020 International Conference on Data Analytics for Business and Industry: Way Towards a Sustainable Economy (ICDABI), Sakheer, Bahrain, 26–27 October 2020; pp. 1–6. [Google Scholar] [CrossRef]
- Friedman, M. The Use of Ranks to Avoid the Assumption of Normality Implicit in the Analysis of Variance. J. Am. Stat. Assoc. 1937, 32, 675–701. [Google Scholar] [CrossRef]


| Status of the COVID-19 Patients | Classifier Prediction | |
|---|---|---|
| Positive | Negative | |
| True (sufferer) | TP | FN |
| False (non-sufferer) | FP | FN |
| Classifier | Execution Time (ms) | TP | TN | FP | FN | Accuracy (%) | Error Rate (%) | Precision (%) | Recall (%) | Fscore (%) | AUROC |
|---|---|---|---|---|---|---|---|---|---|---|---|
| NB | 8.5 | 1400 | 1050 | 80 | 16 | 96.6 | 5.4 | 94.5 | 98.8 | 96.7 | 0.846 |
| LR | 99.8 | 1550 | 905 | 60 | 10 | 97.1 | 11 | 82.4 | 98.2 | 89.6 | 0.89 |
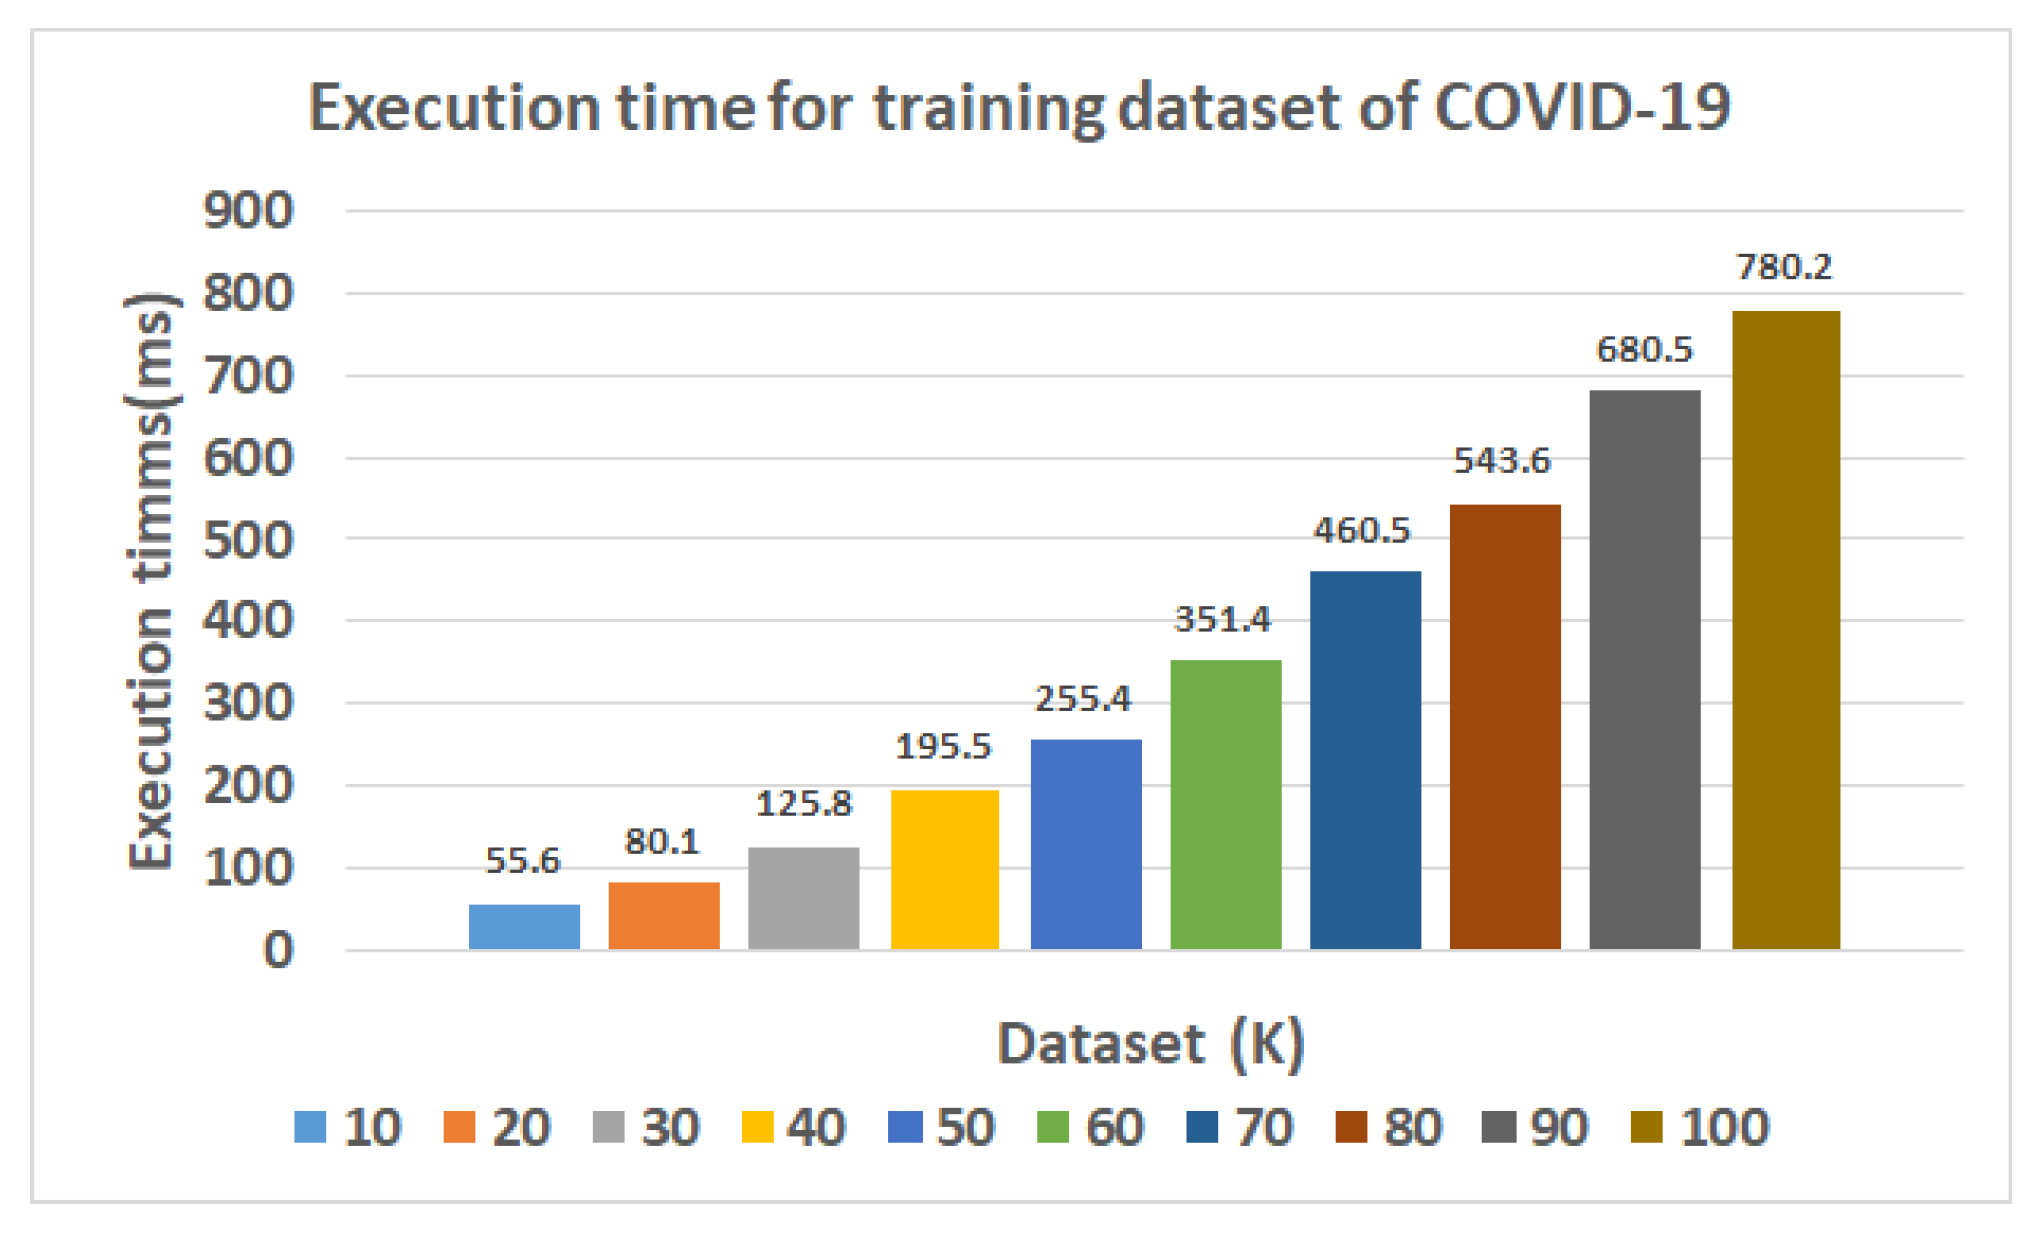
| DT | 55.6 | 1390 | 920 | 98 | 60 | 93.6 | 9.627 | 93.4 | 95.8 | 94.6 | 0.88 |
| SVM | 12,496.9 | 1061 | 814 | 234 | 20 | 89.2 | 11 | 81.9 | 98.1 | 89.2 | 0.91 |
| RF | 505.5 | 1067 | 1002 | 46 | 29 | 96.5 | 4.38 | 95.8 | 97.3 | 96.6 | 0.898 |
| KNN | 14 | 1068 | 940 | 108 | 30 | 93.9 | 10.3 | 90.8 | 97.2 | 93.9 | 0.754 |
| TSODT | 55.6 | 1565 | 1020 | 40 | 10 | 98.1 | 3.7 | 97.5 | 99.3 | 98.4 | 0.95 |
| Classifiers | Our Work | 2020, [50] | 2021, [36] | 2020, [38] | 2020, [34] | |||||
|---|---|---|---|---|---|---|---|---|---|---|
| Acc (%) | ET (ms) | Acc (%) | ET (ms) | Acc (%) | ET (ms) | Acc (%) | ET (ms) | Acc (%) | ET (ms) | |
| NB | 96.6 | 0.94 | 0.98 | 0.96 | – | – | 94.36 | 0 | 96.2 | – |
| LR | 97.1 | 0.82 | – | – | – | – | 94.41 | 0 | 96.2 | – |
| TSODT | 98 | 0.97 | – | – | – | – | – | – | – | – |
| SVM | 89.2 | 0.81 | 69.79 | – | 89 | – | 92.4 | – | 90.6 | – |
| RF | 95 | 0.95 | 77.98 | – | 94.3 | 0.93 | – | – | 94.3 | – |
| KNN | 87 | 0.90 | 75.68 | – | - | - | 89.2 | – | – | – |
| DT | 93.6 | 55.6 | – | – | 0.91 | – | – | – | 0.92 | – |
| DT (Optimized) [23] | 92.5 | L | – | – | – | – | – | – | – | – |
| DT (Optimized) [28] | 96.0 | – | – | – | – | – | – | – | – | – |
| DT (Optimized) [30] | 95.5 | L | – | – | – | – | – | – | – | – |
| Classifier | NB | LR | DT | SVM | RF | KNN | TSODT |
|---|---|---|---|---|---|---|---|
| NB | 0 | 14 | 2 | 5 | 4 | 9 | 18 |
| LR | 3 | 0 | 9 | 7.5 | 10 | 7.1 | 11 |
| DT | 5.6 | 9.3 | 0 | 8 | 6 | 3.6 | 9.6 |
| SVM | 6.9 | 11 | 5 | 0 | 8.5 | 9.2 | 15 |
| RF | 5.8 | 10.7 | 10 | 5.5 | 0 | 9.5 | 4.3 |
| KNN | 14 | 17 | 9 | 8 | 5.9 | 0 | 10.3 |
| TSODT | 8.6 | 15 | 20 | 4 | 10 | 8.1 | 0 |
Publisher’s Note: MDPI stays neutral with regard to jurisdictional claims in published maps and institutional affiliations. |
© 2021 by the authors. Licensee MDPI, Basel, Switzerland. This article is an open access article distributed under the terms and conditions of the Creative Commons Attribution (CC BY) license (https://creativecommons.org/licenses/by/4.0/).
Share and Cite
Hafeez, M.A.; Rashid, M.; Tariq, H.; Abideen, Z.U.; Alotaibi, S.S.; Sinky, M.H. Performance Improvement of Decision Tree: A Robust Classifier Using Tabu Search Algorithm. Appl. Sci. 2021, 11, 6728. https://doi.org/10.3390/app11156728
Hafeez MA, Rashid M, Tariq H, Abideen ZU, Alotaibi SS, Sinky MH. Performance Improvement of Decision Tree: A Robust Classifier Using Tabu Search Algorithm. Applied Sciences. 2021; 11(15):6728. https://doi.org/10.3390/app11156728
Chicago/Turabian StyleHafeez, Muhammad Asfand, Muhammad Rashid, Hassan Tariq, Zain Ul Abideen, Saud S. Alotaibi, and Mohammed H. Sinky. 2021. "Performance Improvement of Decision Tree: A Robust Classifier Using Tabu Search Algorithm" Applied Sciences 11, no. 15: 6728. https://doi.org/10.3390/app11156728
APA StyleHafeez, M. A., Rashid, M., Tariq, H., Abideen, Z. U., Alotaibi, S. S., & Sinky, M. H. (2021). Performance Improvement of Decision Tree: A Robust Classifier Using Tabu Search Algorithm. Applied Sciences, 11(15), 6728. https://doi.org/10.3390/app11156728