
A Physical Approach to Simulate the Corrosion of Ceramic-Coated Magnesium Implants


Abstract
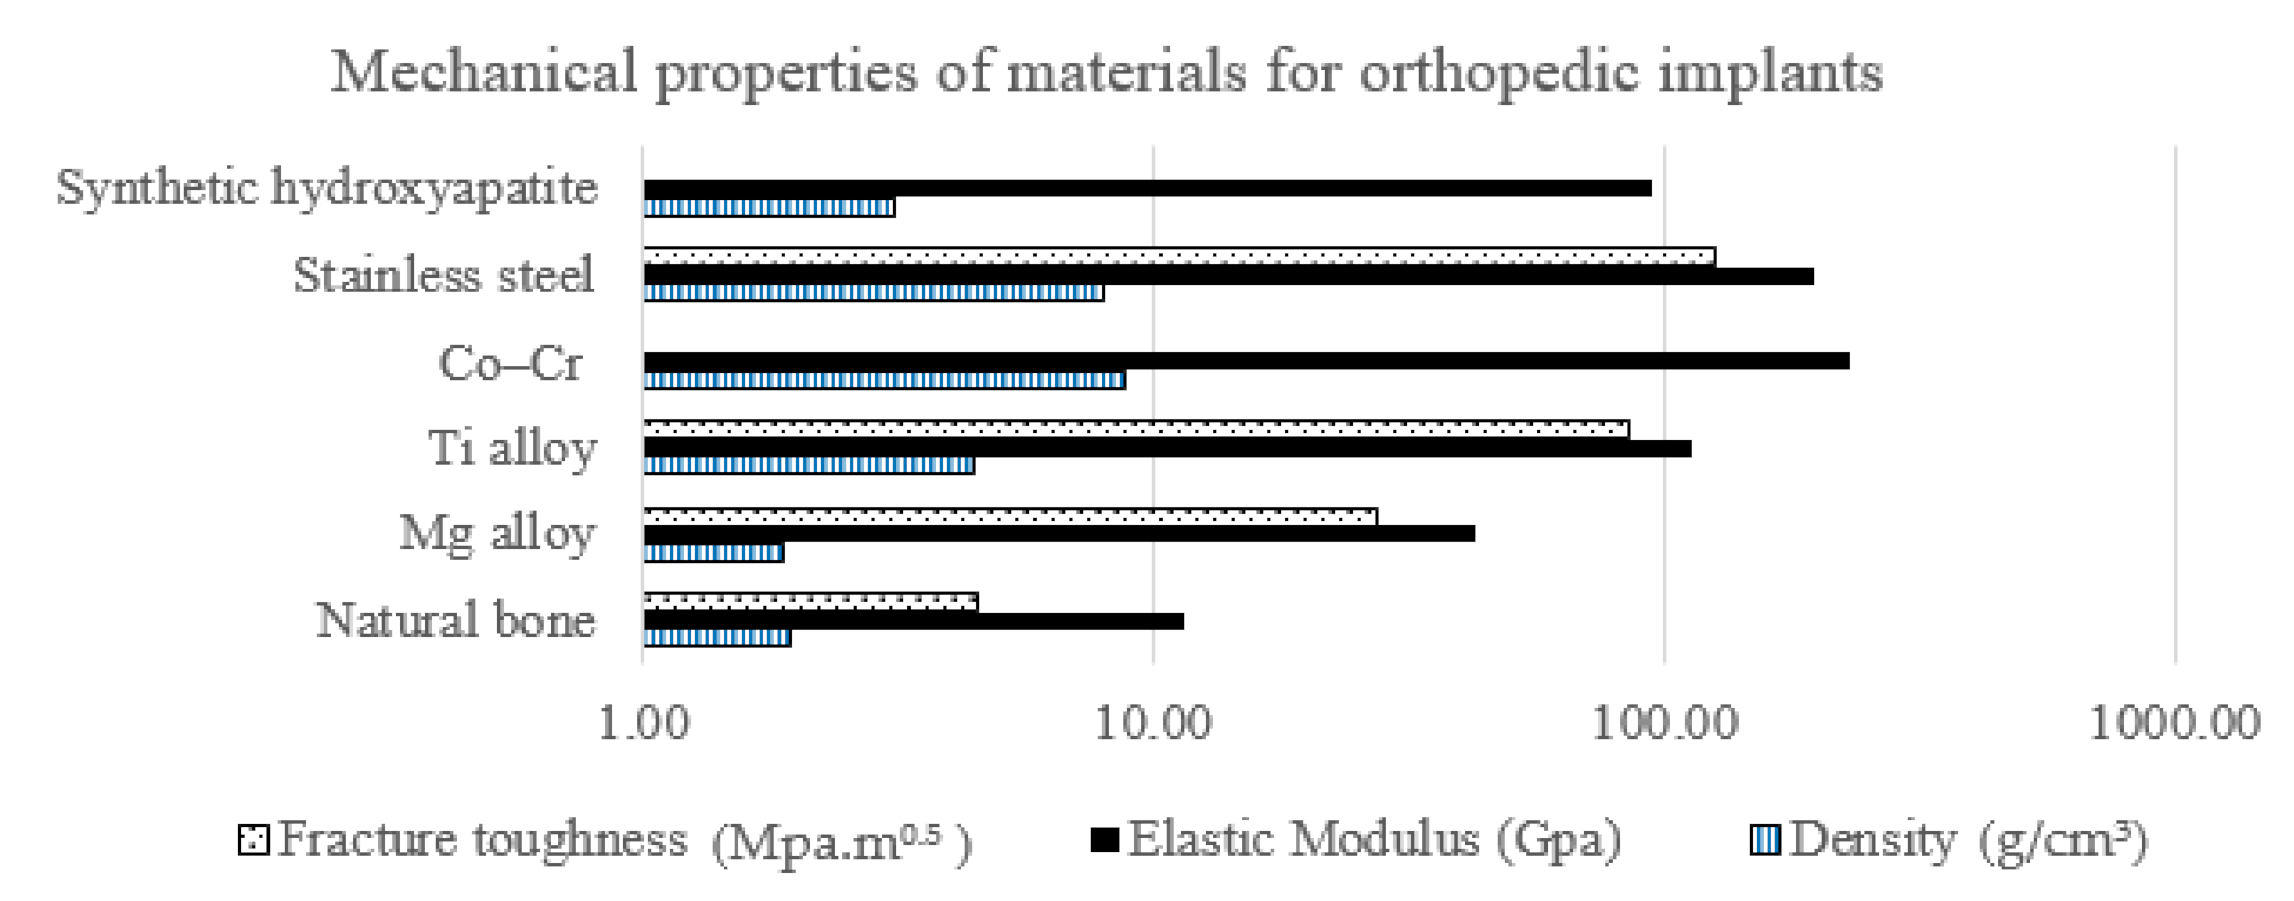
:1. Introduction
2. Materials and Methods
2.1. Saturation Tests
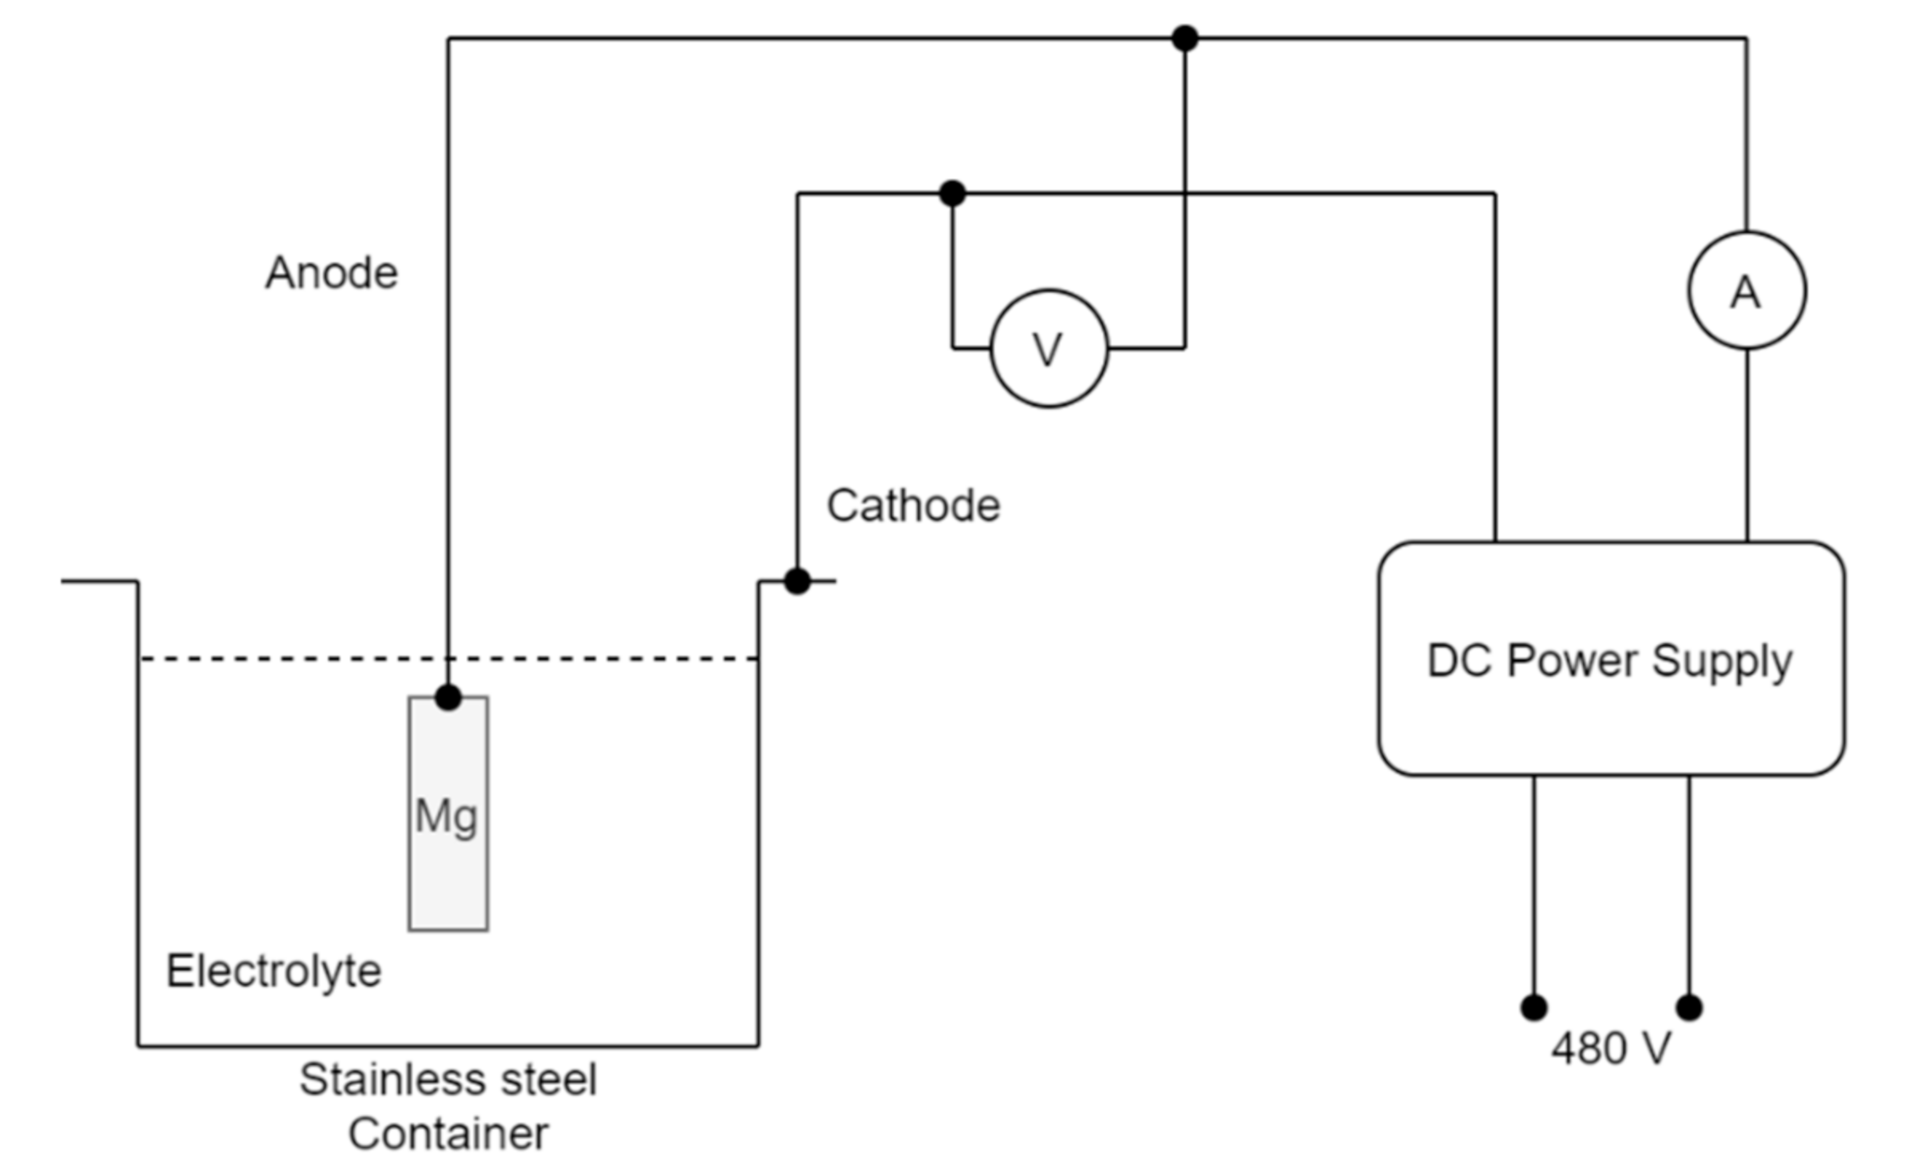
2.2. Micro Arc Oxidation Coating
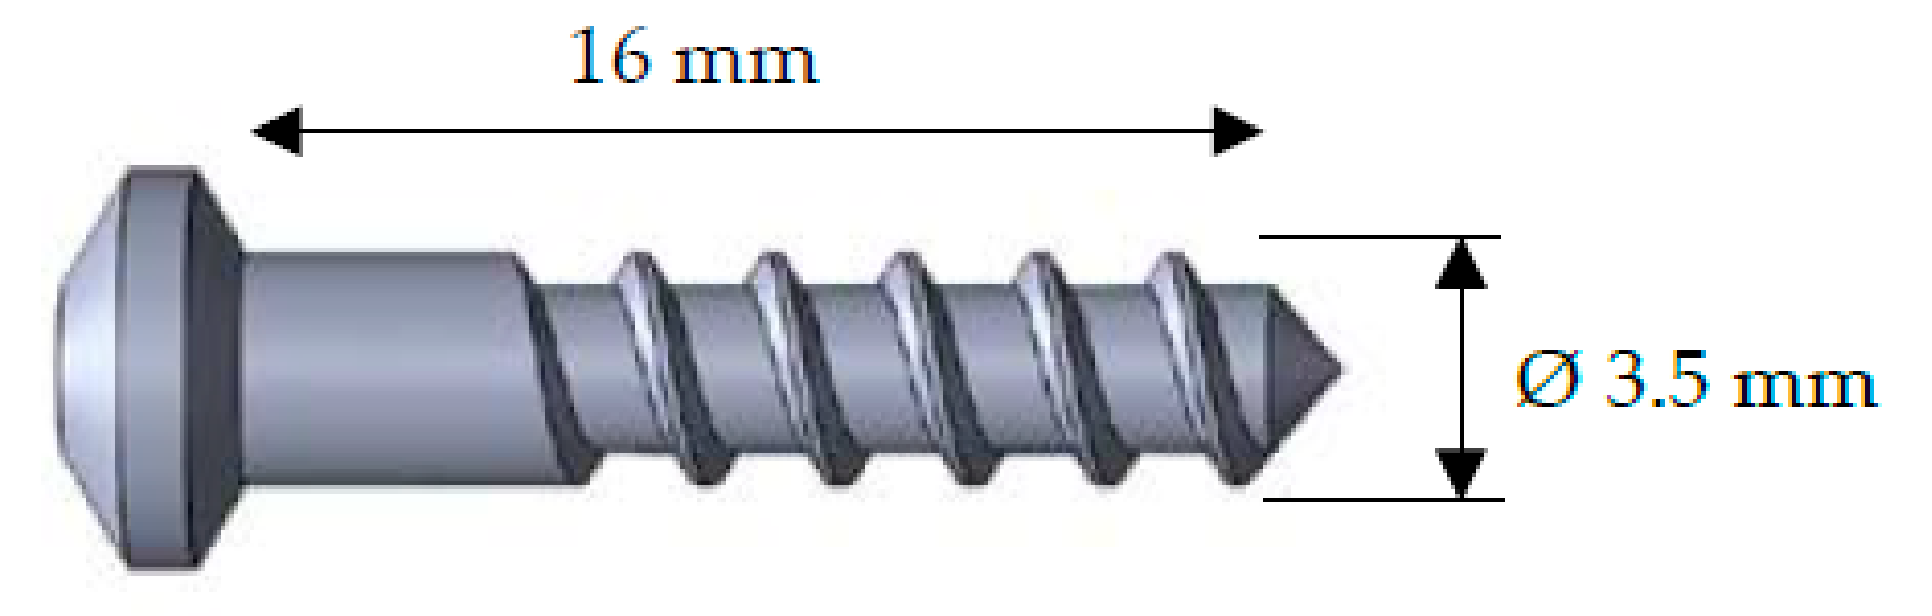
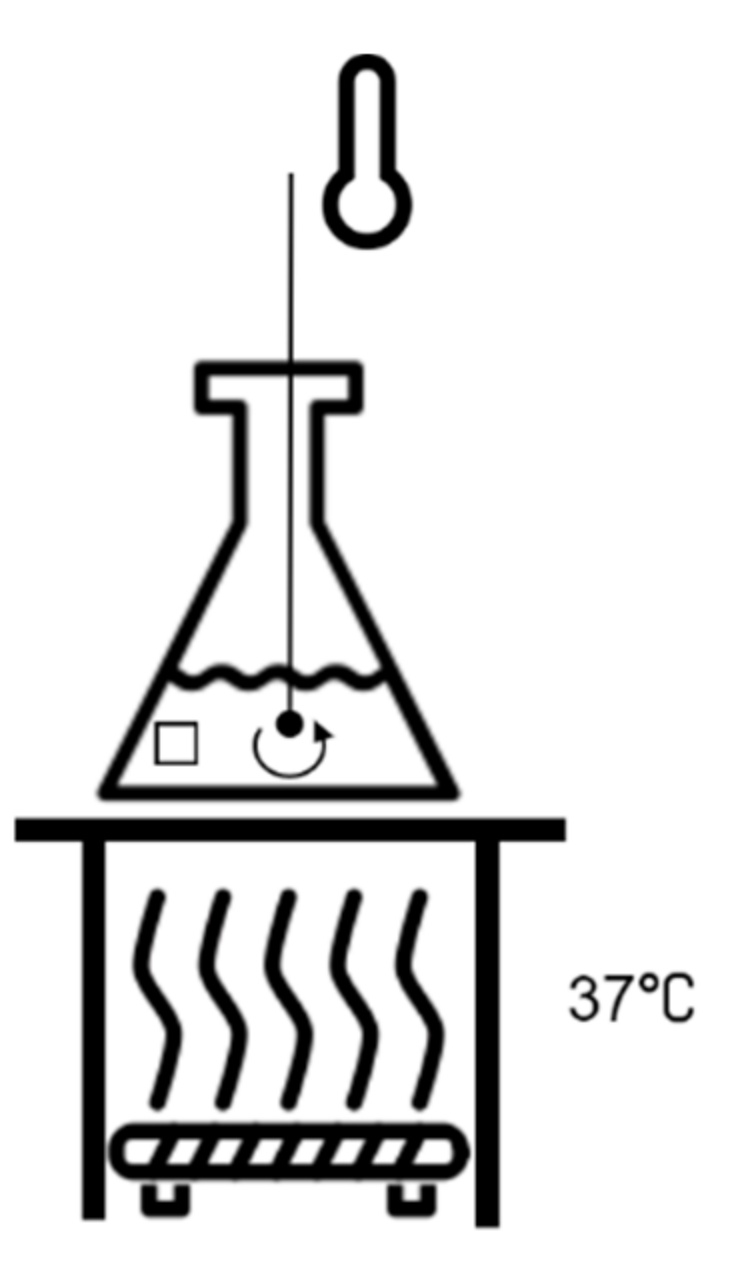
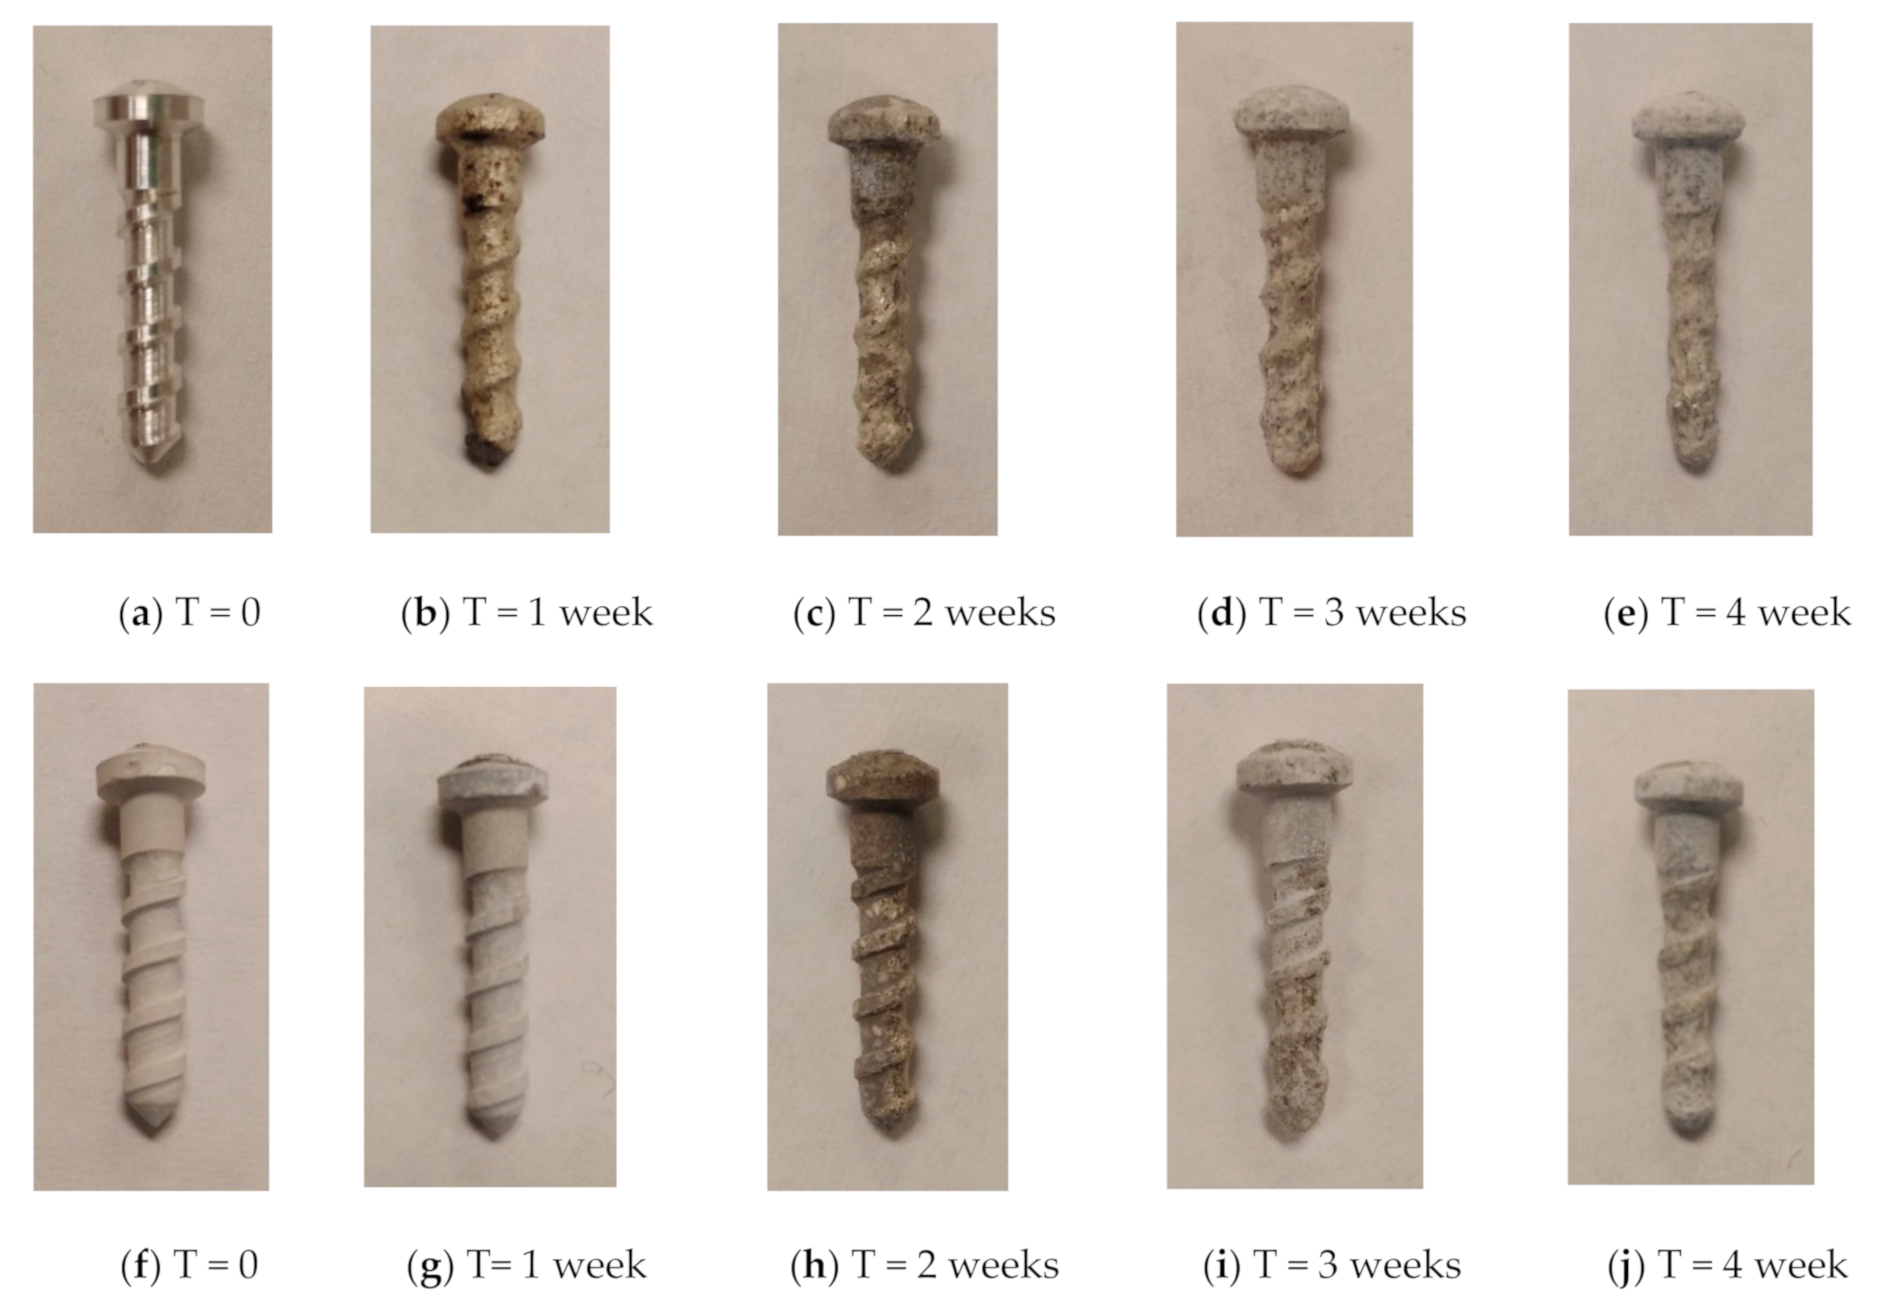
2.3. In Vitro Immersion Test
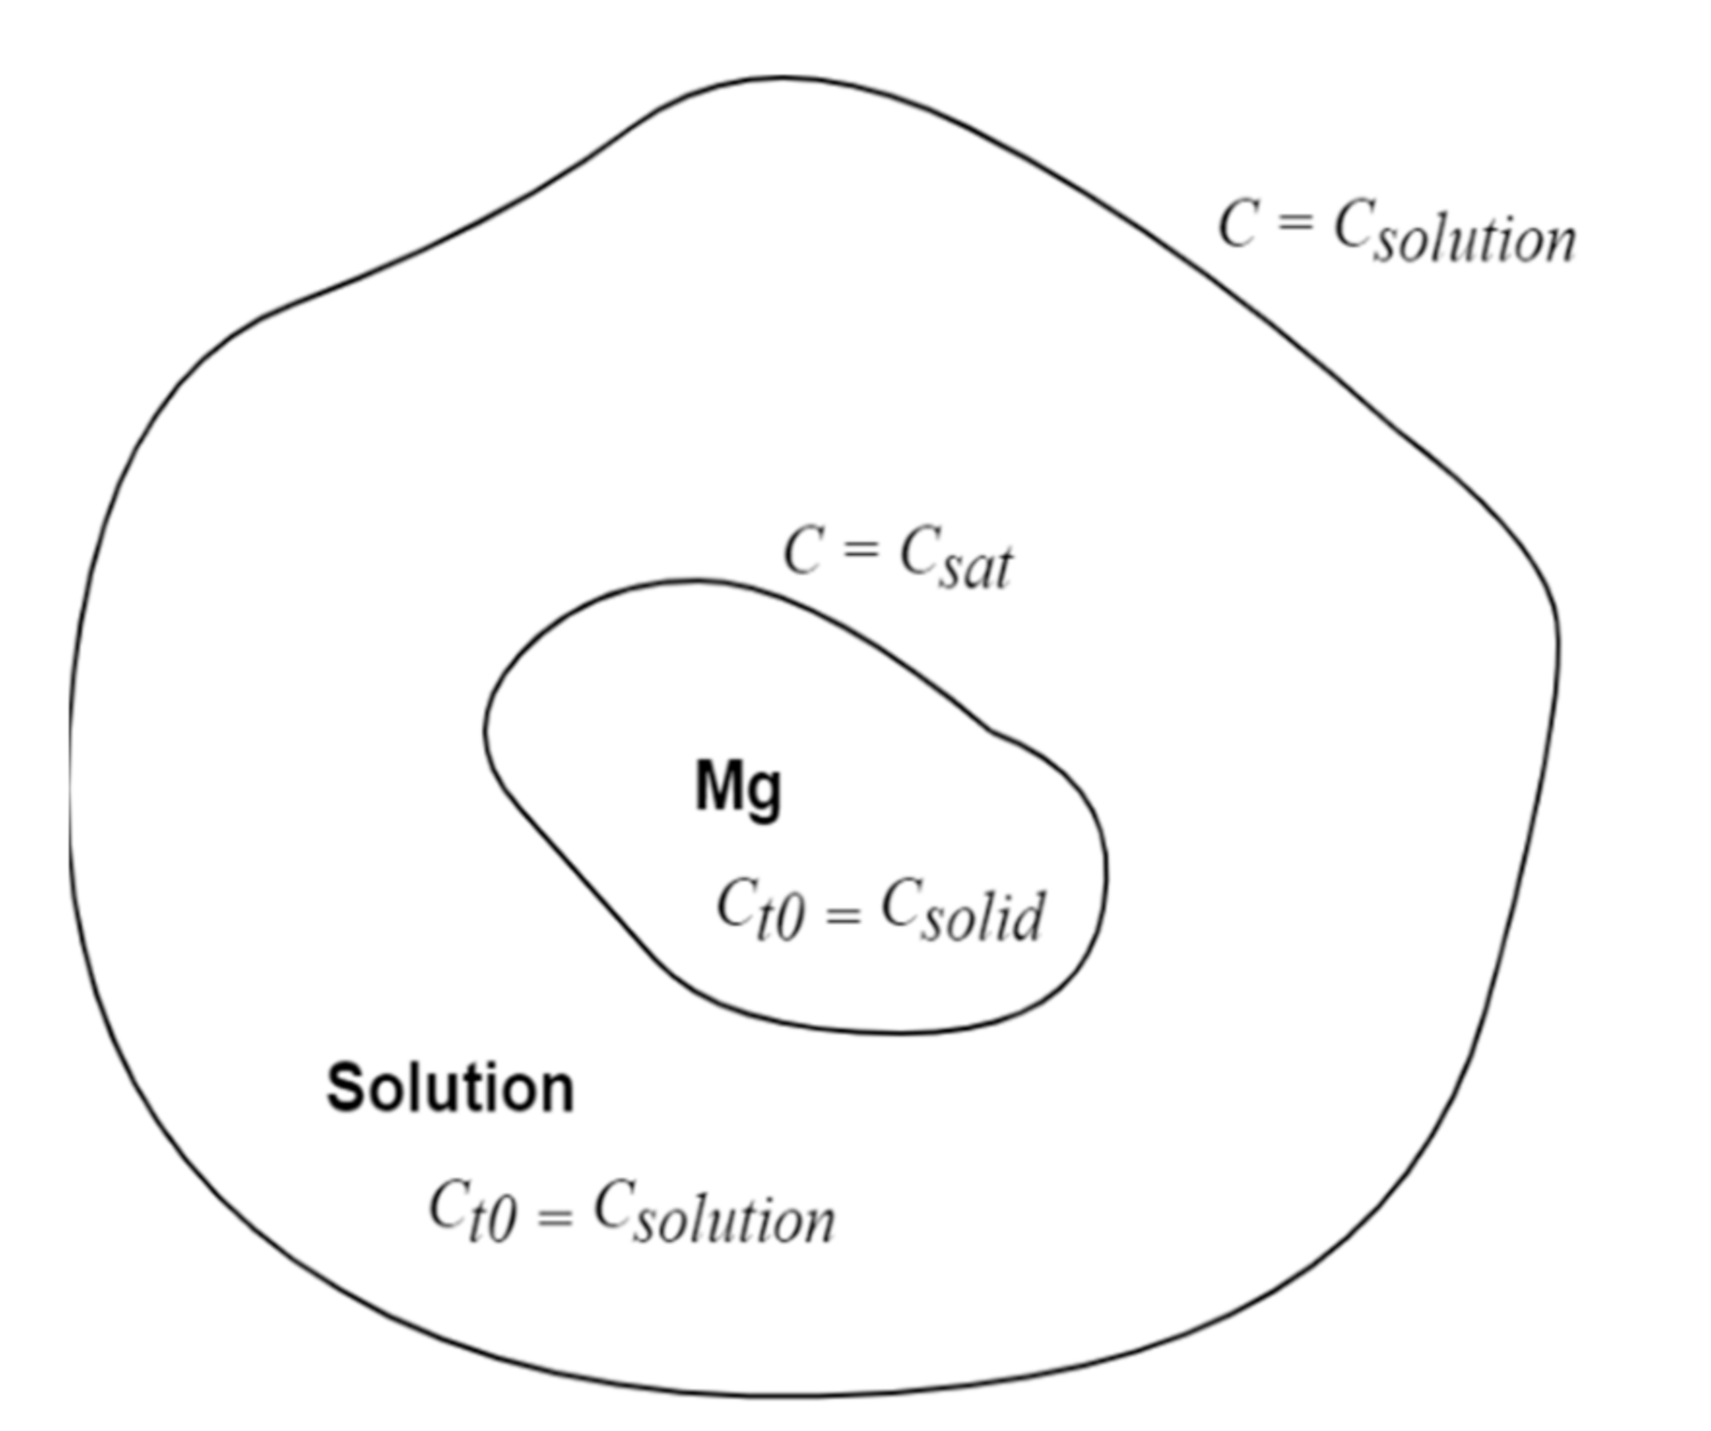
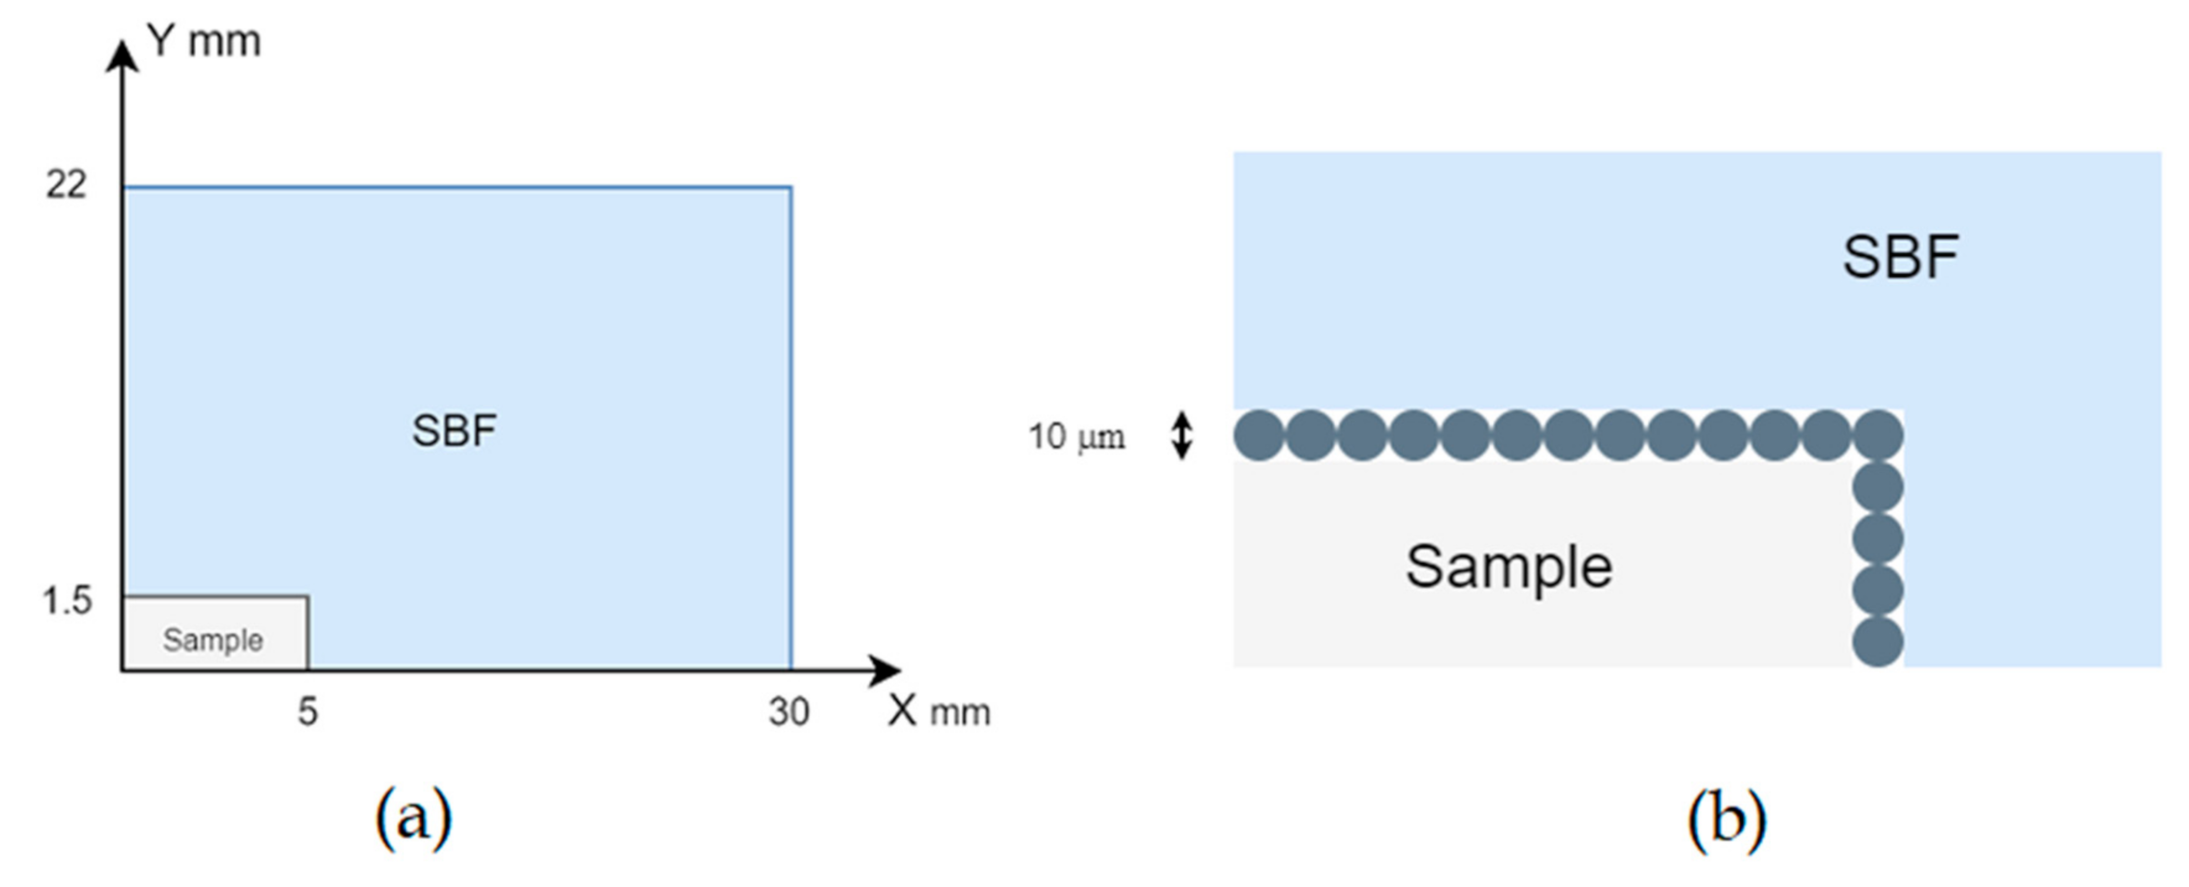
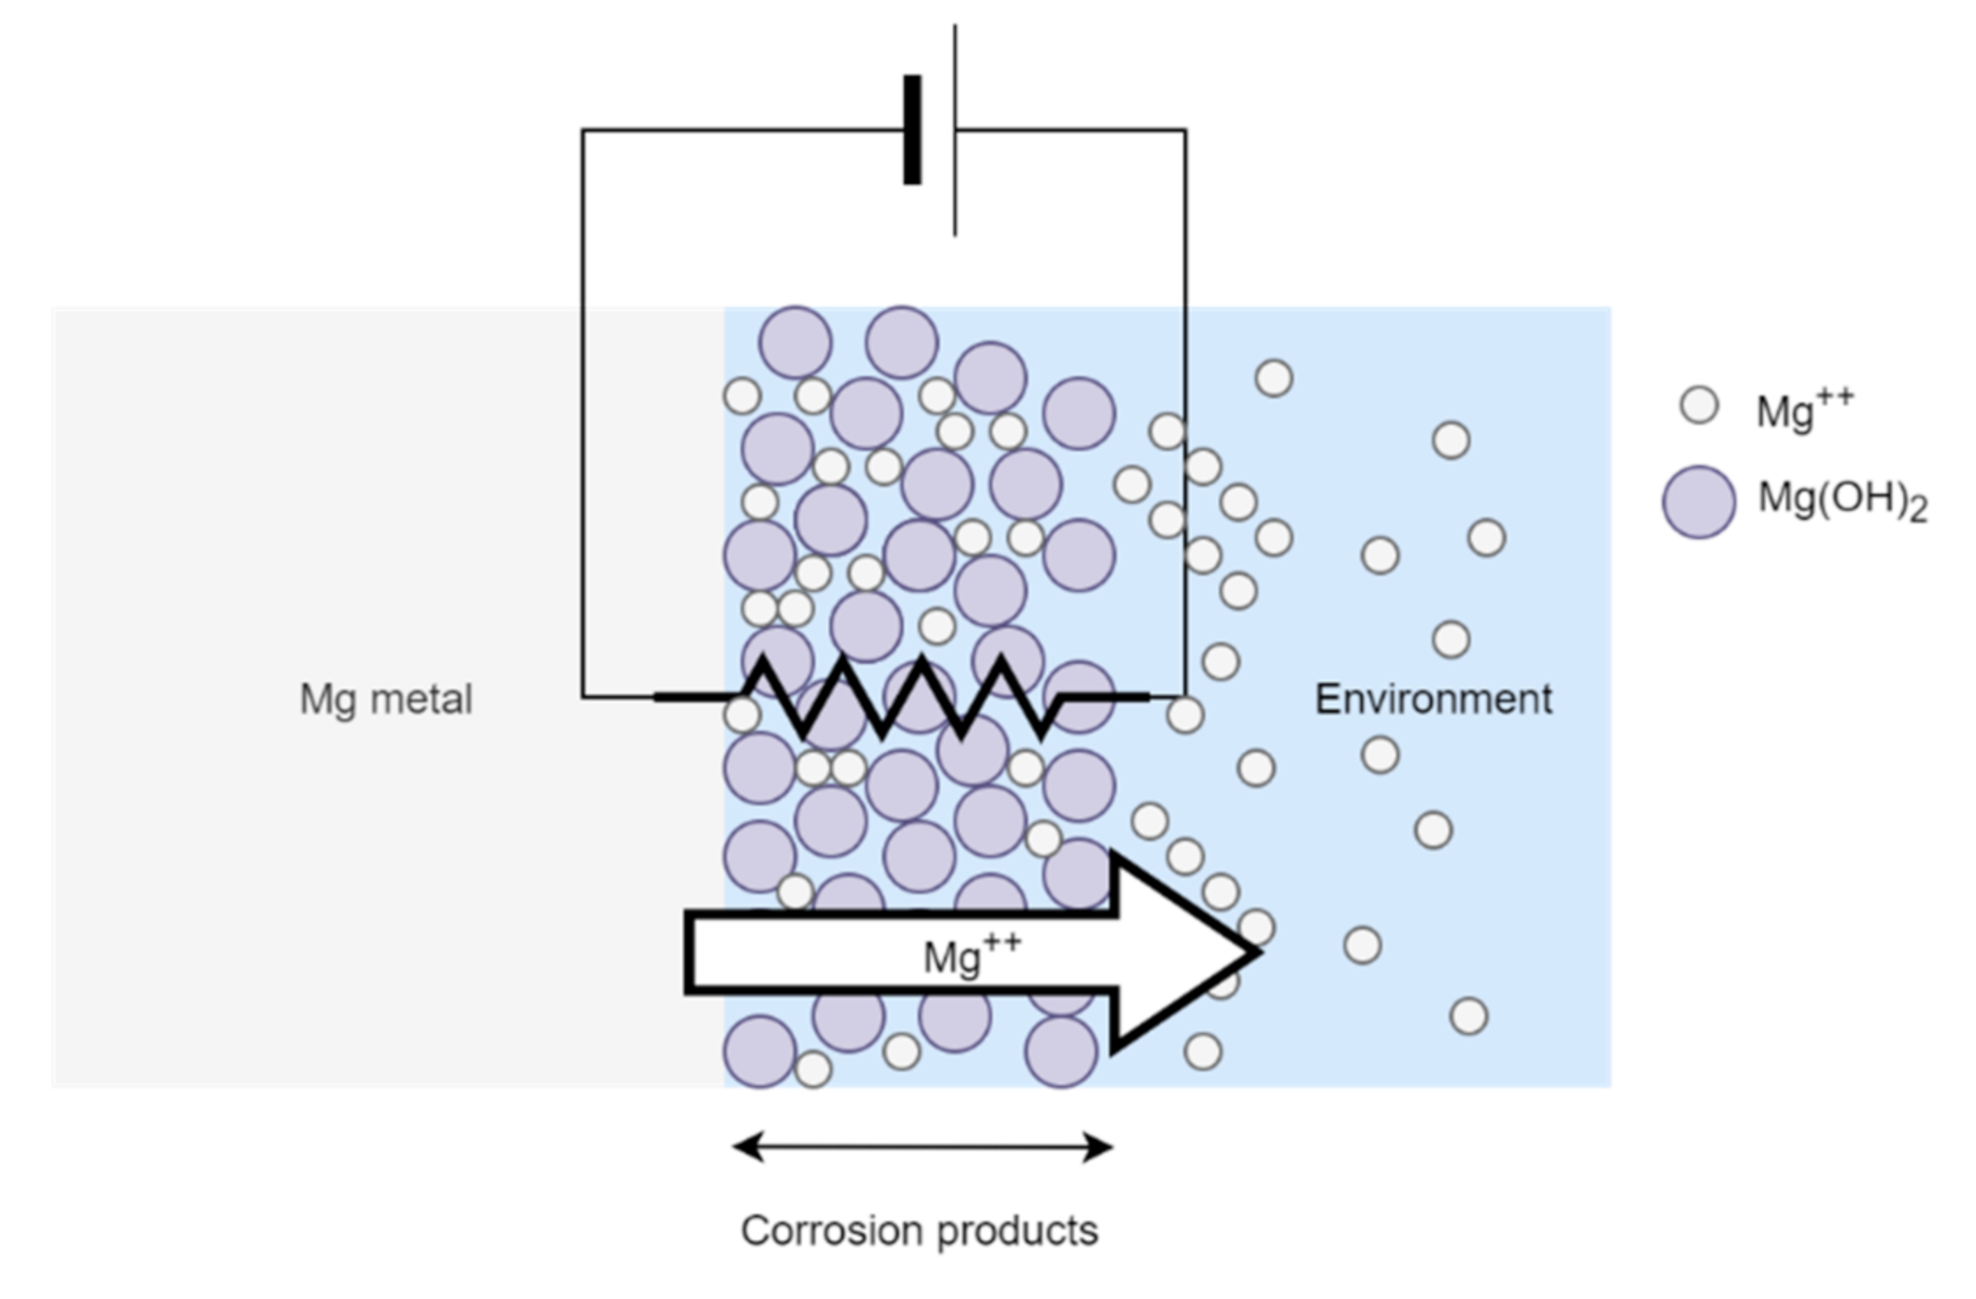
2.4. Numerical Model Development
2.5. Model Validation
3. Results and Discussion
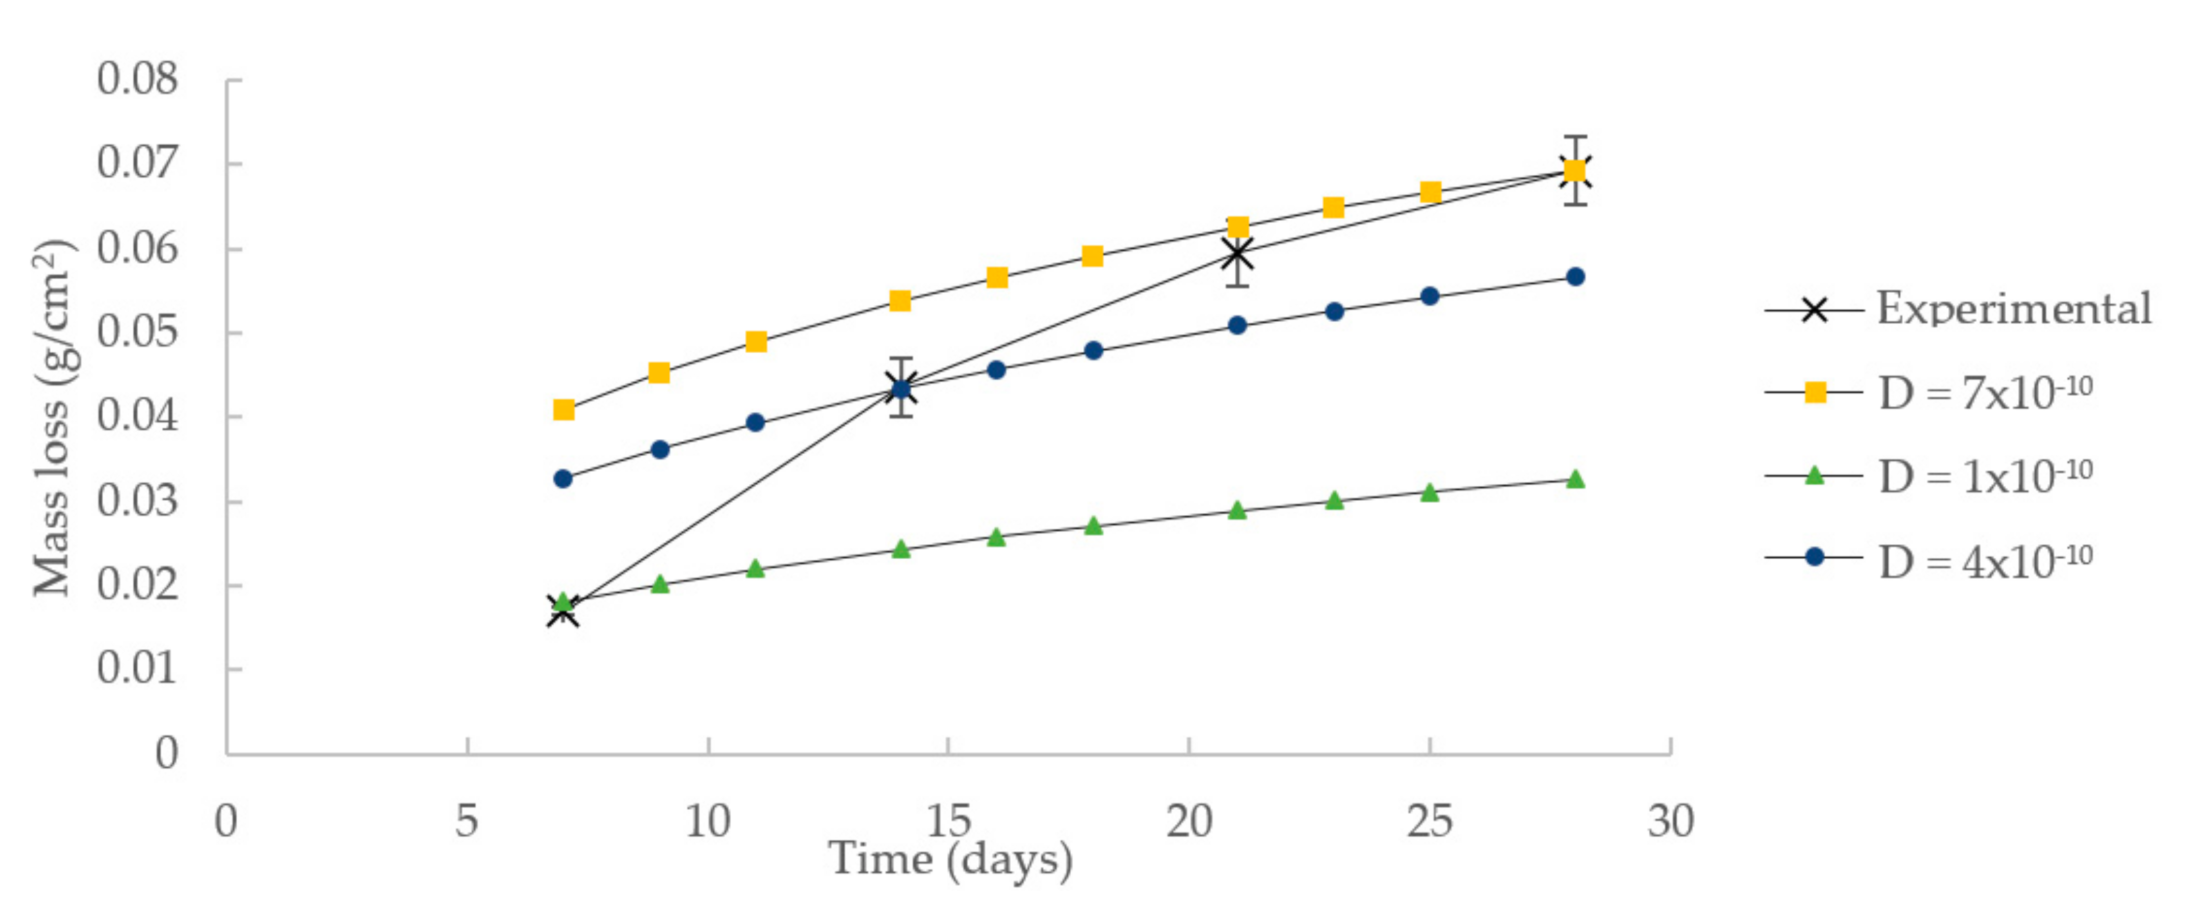
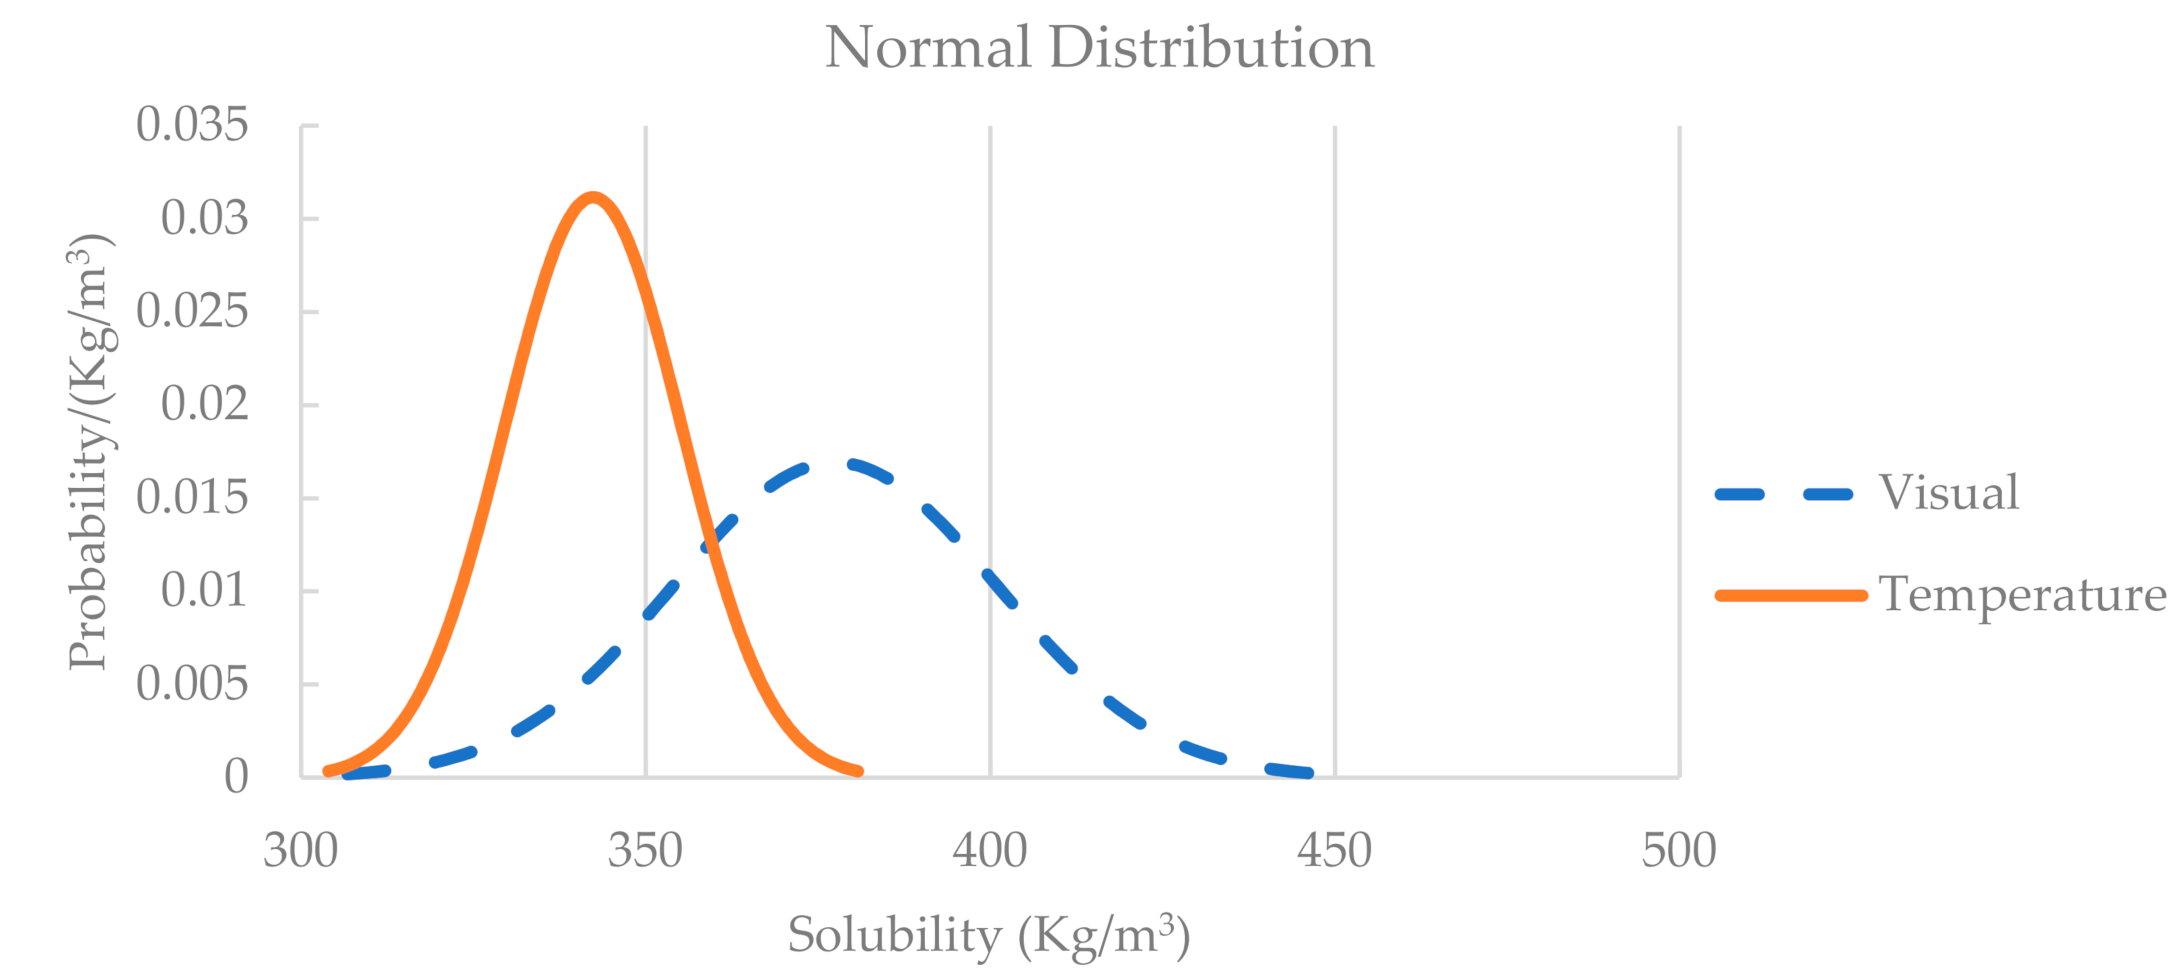
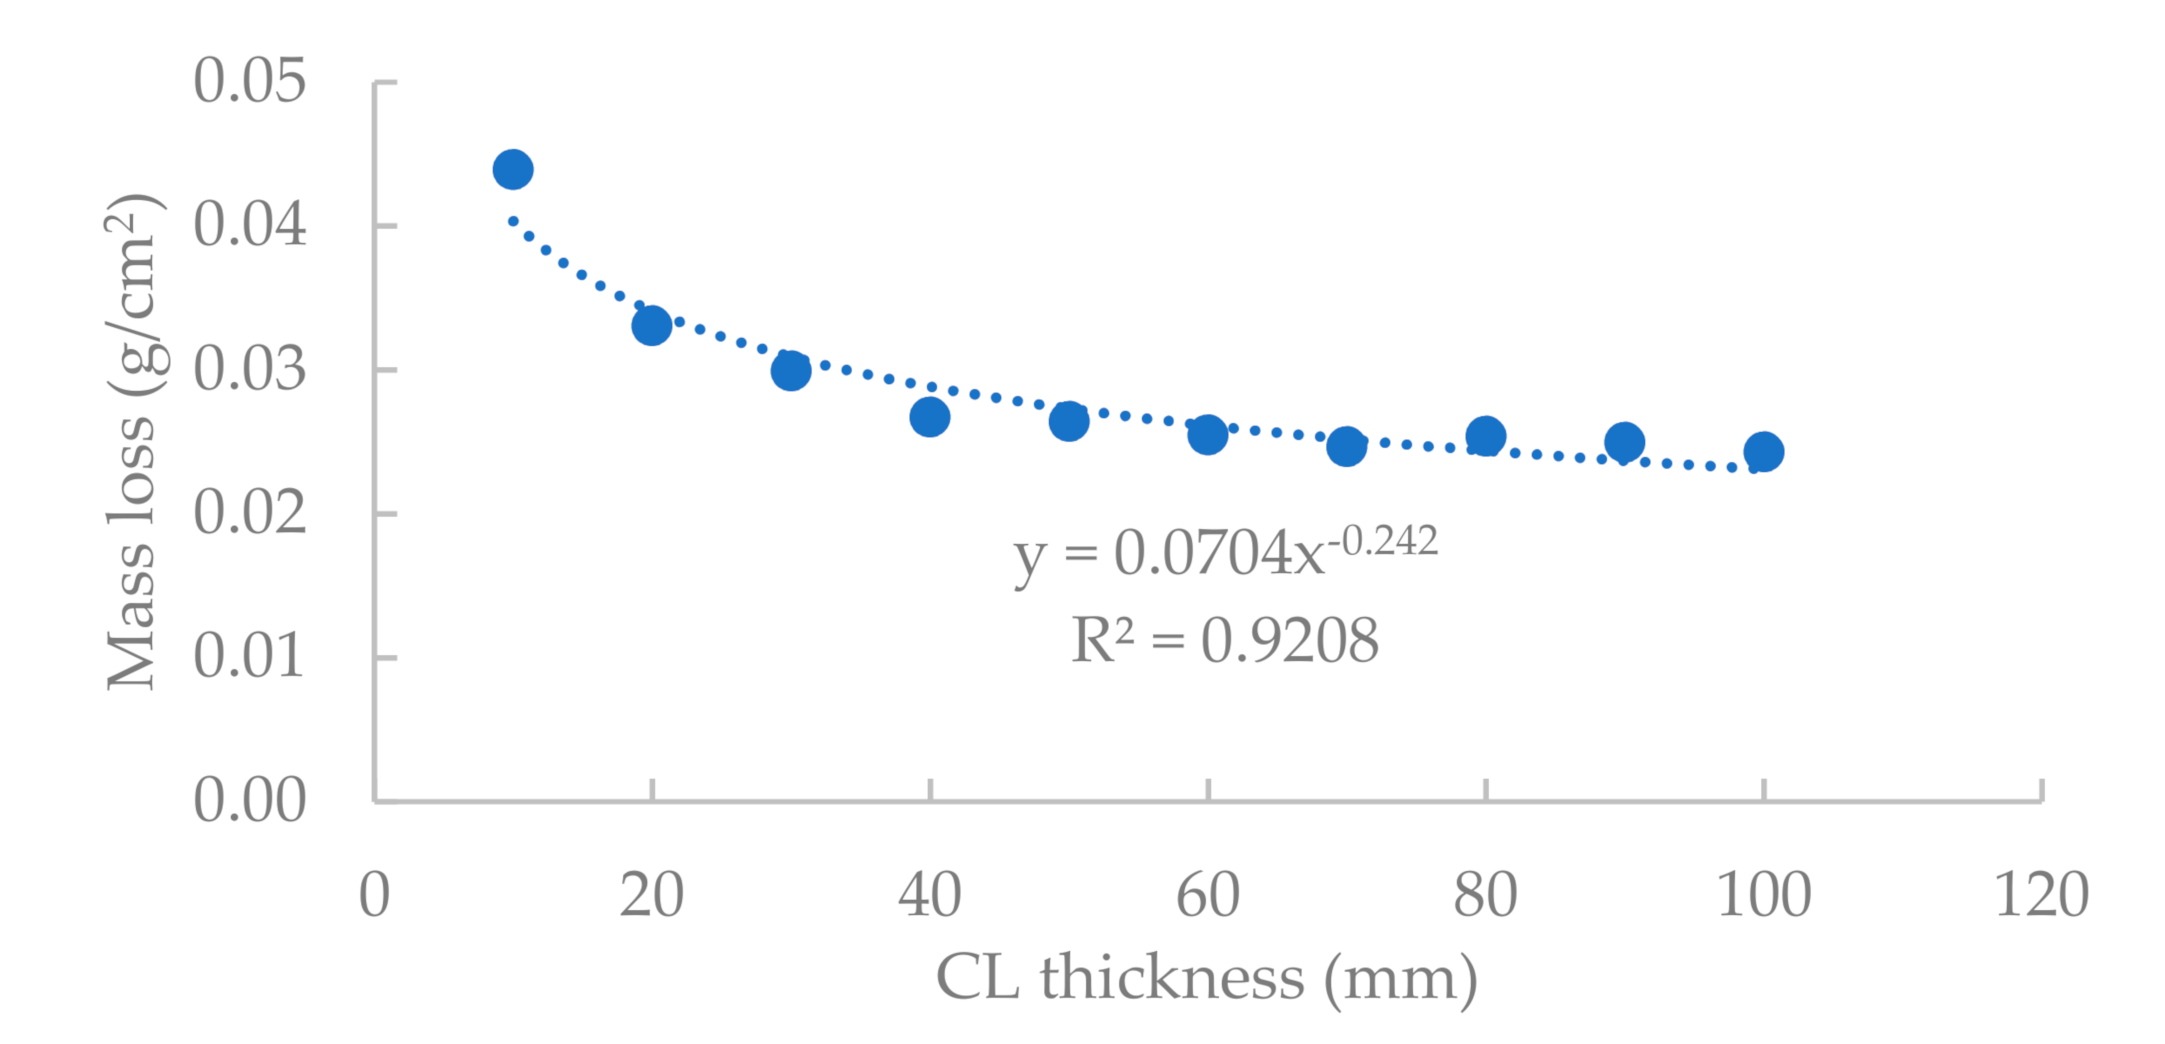
3.1. Model Parameters Calibration
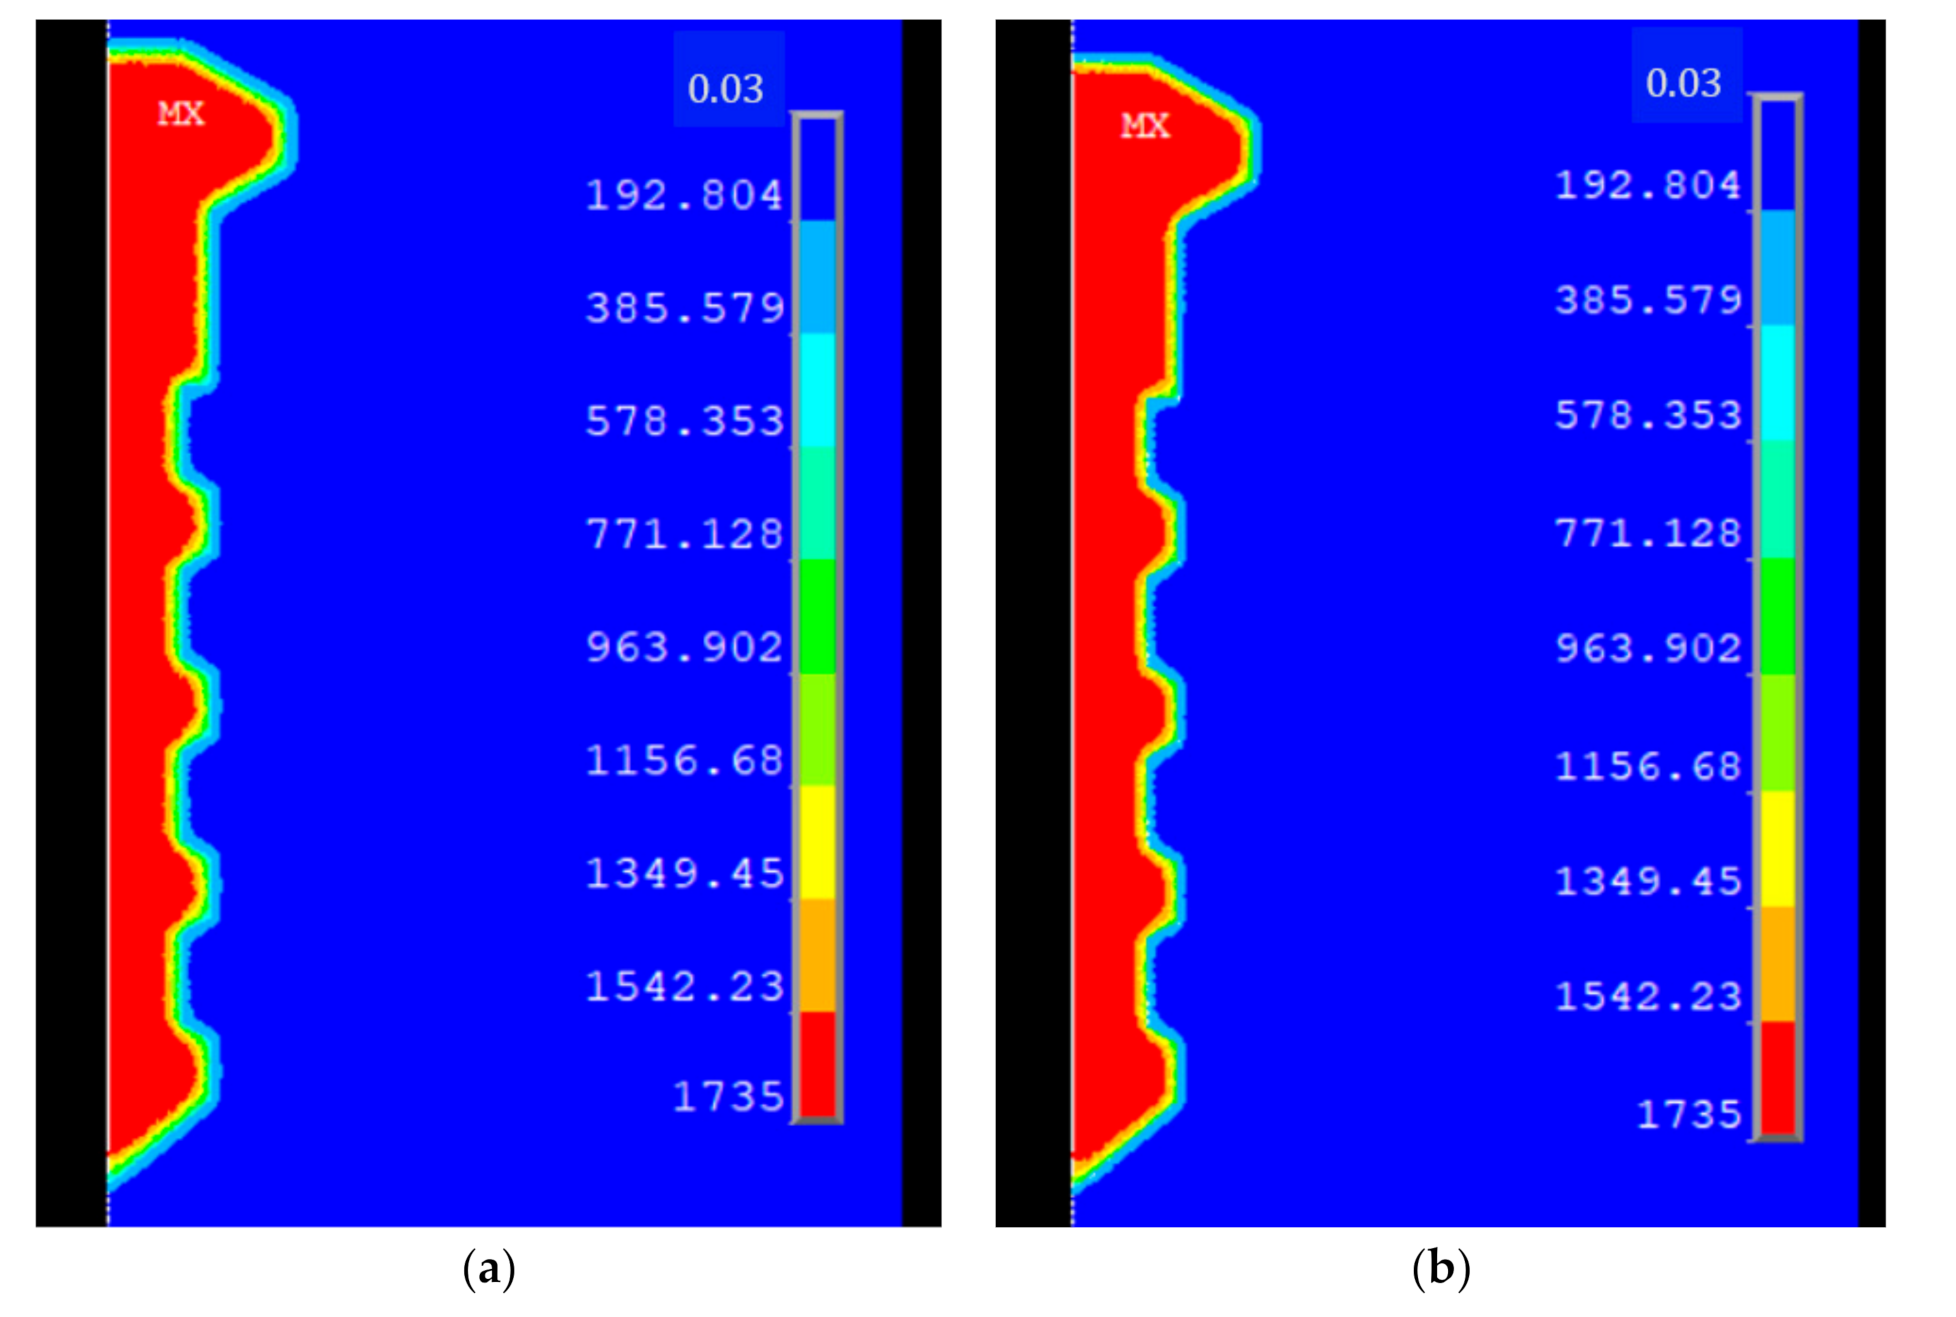
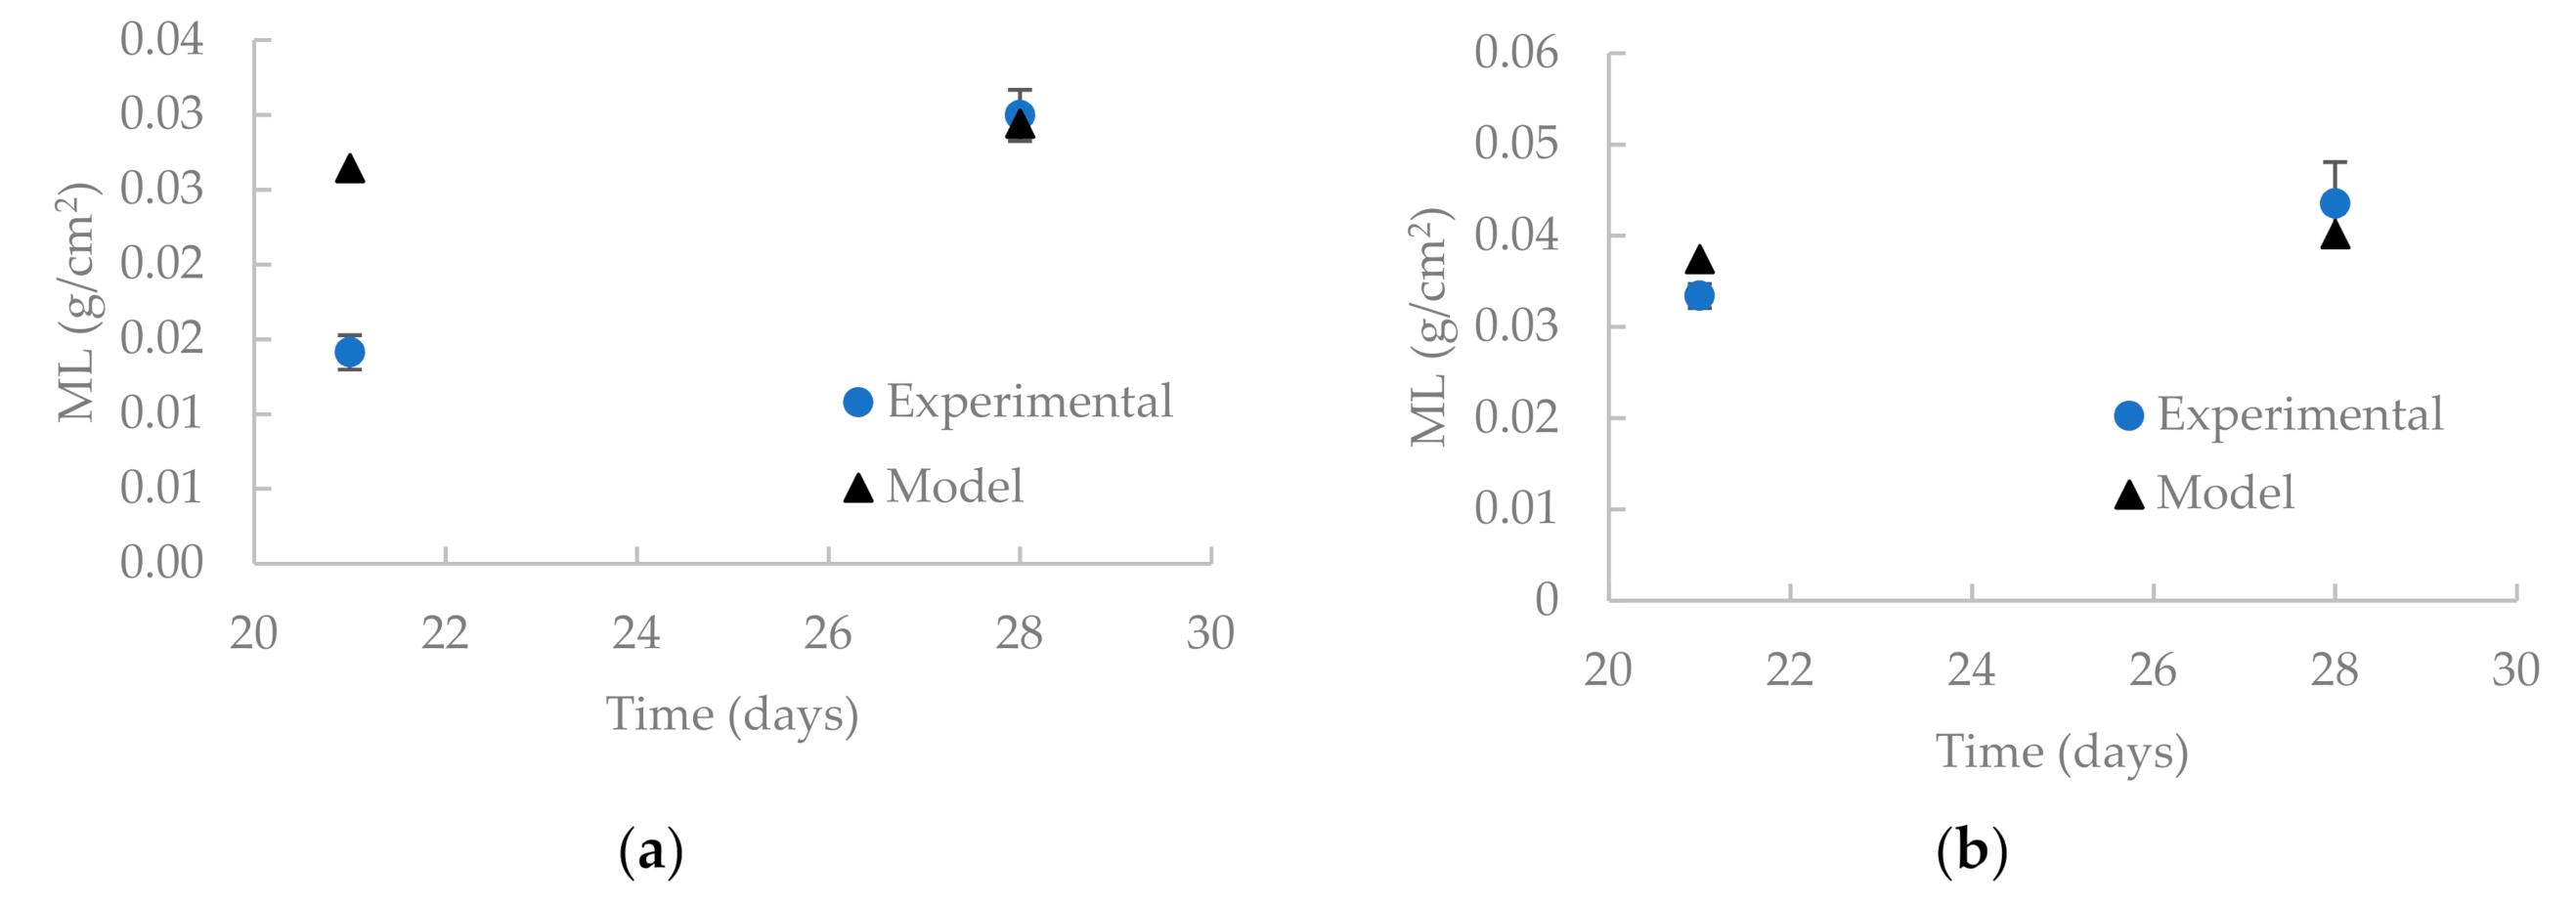
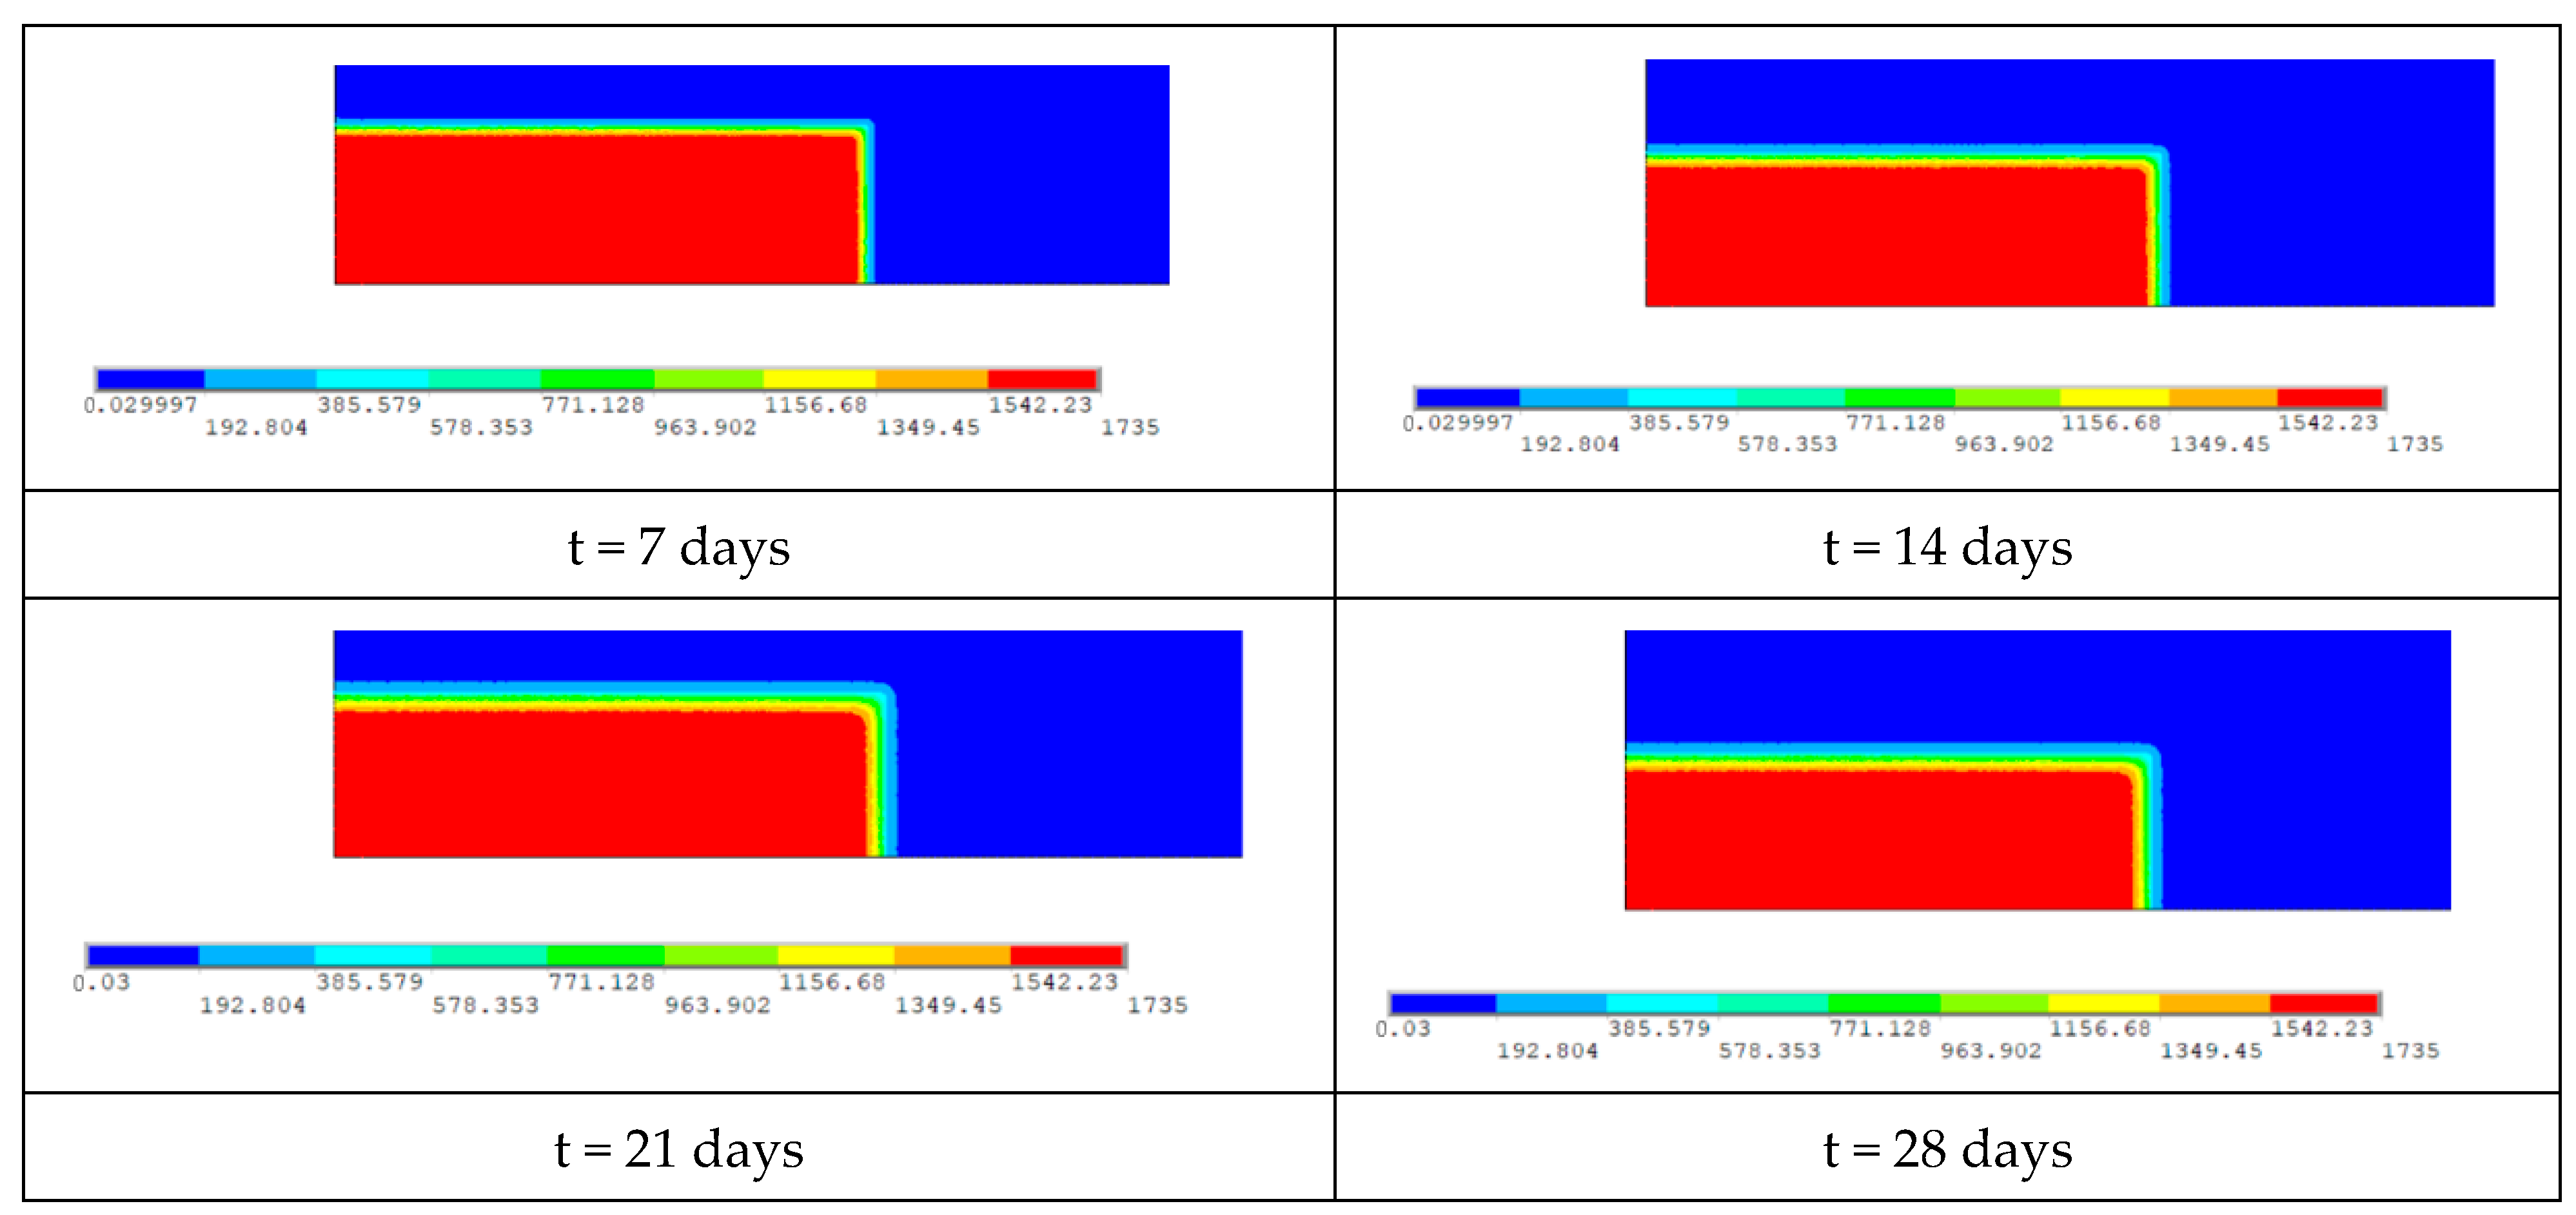
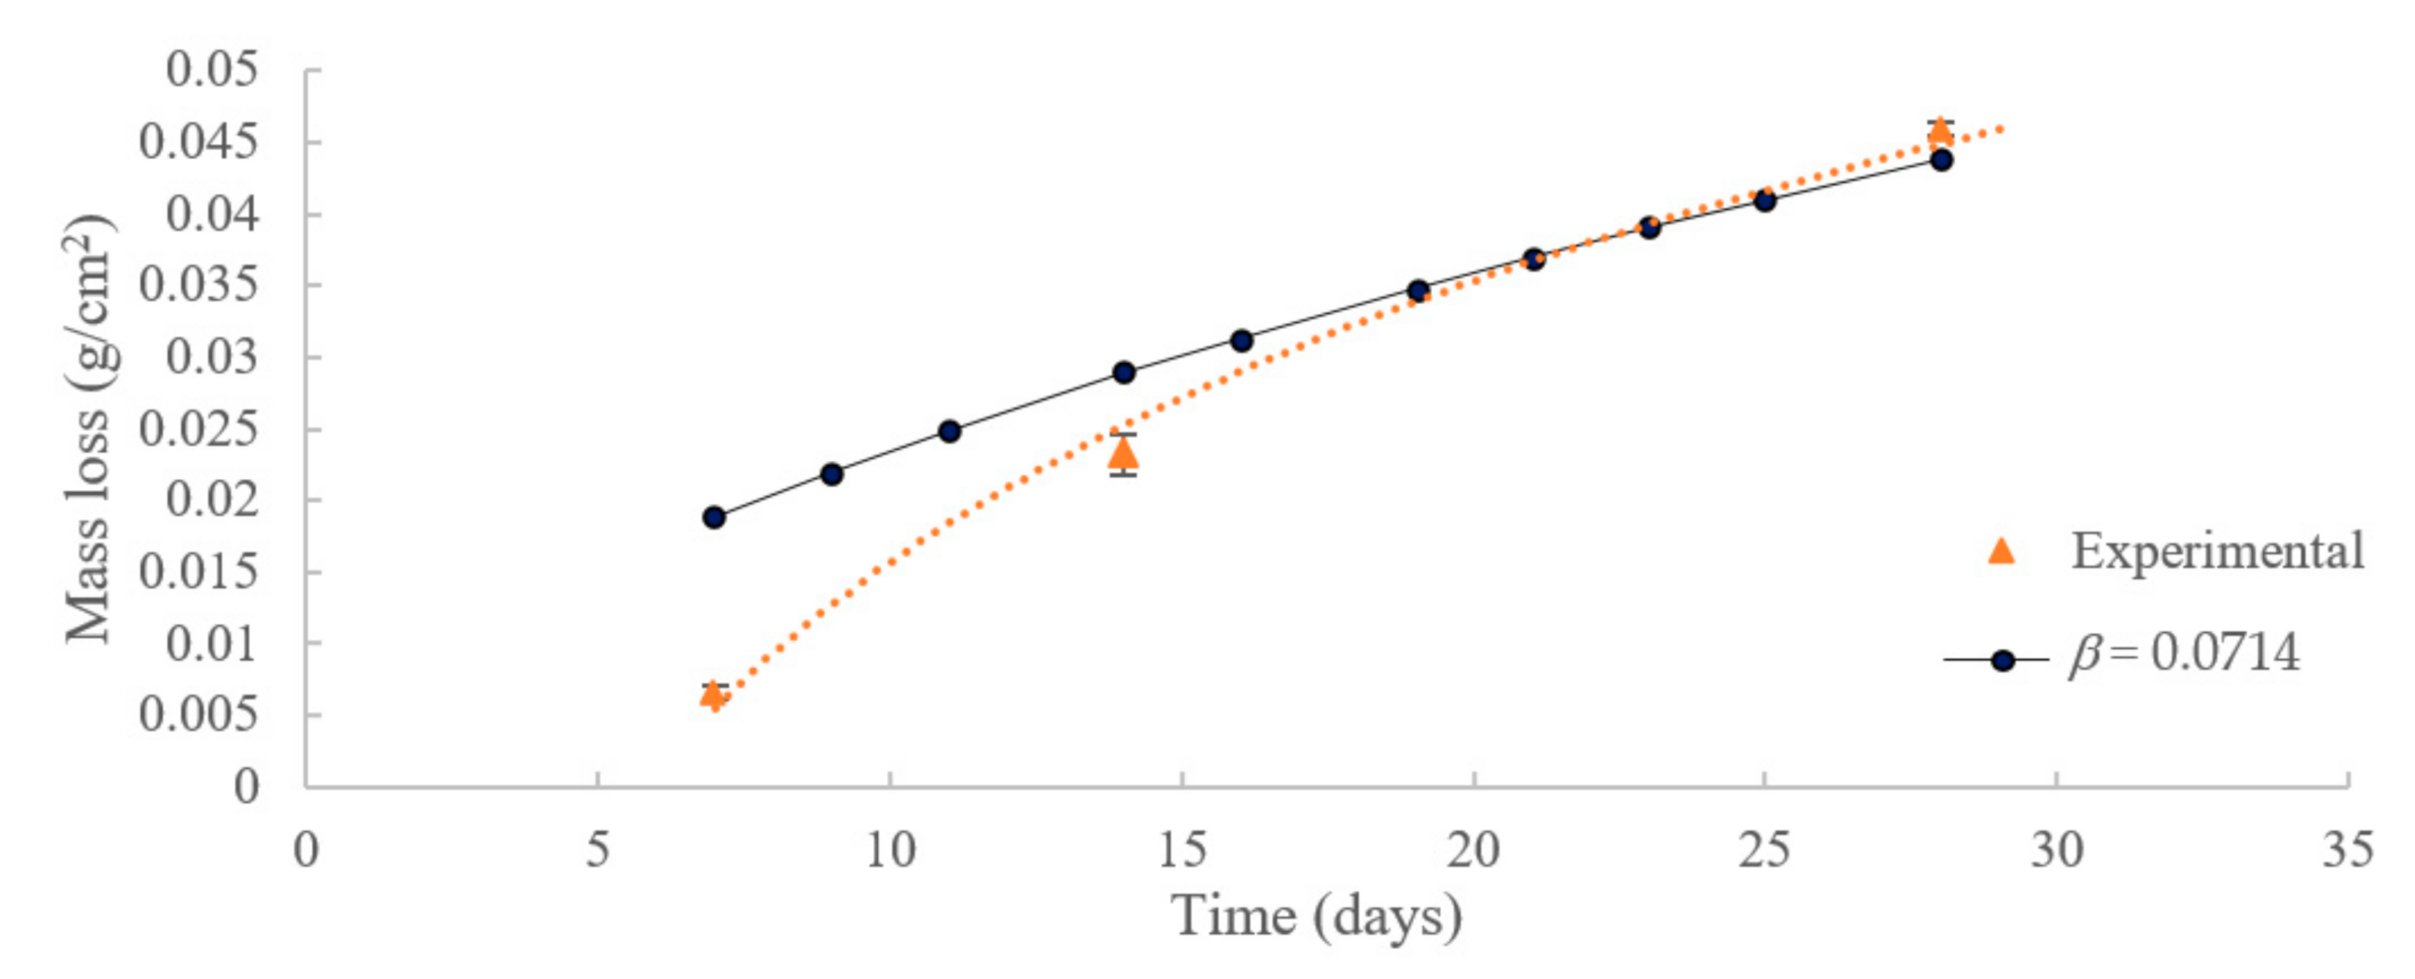
3.2. Model Validation
4. Conclusions
Author Contributions
Funding
Data Availability Statement
Acknowledgments
Conflicts of Interest
References
- Planell, J.A. Challenges of bone repair. In Bone Repair Biomaterials; Woodhead Publishing Series in Biomaterials; Planell, J.A., Best, S.M., Lacroix, D., Merolli, A., Eds.; Woodhead Publishing: Canbriage, UK, 2009; pp. 3–24. [Google Scholar]
- Abdalla, M.; Joplin, A.; Elahinia, M.; Ibrahim, H. Corrosion Modeling of Magnesium and Its Alloys for Biomedical Applications: Review. Corros. Mater. Degrad. 2020, 1, 11. [Google Scholar] [CrossRef]
- Locker, P.H.; Arthur, J.; Edmiston, T.; Puri, R.; Levine, B.R. Management of Bone Defects in Orthopedic Trauma. Bull. Hosp. Jt. Dis. 2018, 76, 278–284. [Google Scholar]
- Staiger, M.; Pietak, A.M.; Huadmai, J.; Dias, G. Magnesium and its alloys as orthopedic biomaterials: A review. Biomaterials 2006, 27, 1728–1734. [Google Scholar] [CrossRef]
- Parthiban, G.; Parthiban, T.; Ravi, R.; Saraswathy, V.; Palaniswamy, N.; Sivan, V. Cathodic protection of steel in concrete using magnesium alloy anode. Corros. Sci. 2008, 50, 3329–3335. [Google Scholar] [CrossRef]
- Ibrahim, H.; Esfahani, S.N.; Poorganji, B.; Dean, D.; Elahinia, M. Resorbable bone fixation alloys, forming, and post-fabrication treatments. Mater. Sci. Eng. C 2017, 70, 870–888. [Google Scholar] [CrossRef] [Green Version]
- Chen, F.; Zhou, H.; Yao, B.; Qin, Z.; Zhang, Q. Corrosion resistance property of the ceramic coating obtained through microarc oxidation on the AZ31 magnesium alloy surfaces. Surf. Coat. Technol. 2007, 201, 4905–4908. [Google Scholar] [CrossRef]
- Pan, Y.; He, S.; Wang, D.; Huang, D.; Zheng, T.; Wang, S.; Dong, P.; Chen, C. In vitro degradation and electrochemical corrosion evaluations of microarc oxidized pure Mg, Mg–Ca and Mg–Ca–Zn alloys for biomedical applications. Mater. Sci. Eng. C 2015, 47, 85–96. [Google Scholar] [CrossRef]
- Guo, H.; An, M.; Xu, S.; Huo, H. Microarc oxidation of corrosion resistant ceramic coating on a magnesium alloy. Mater. Lett. 2006, 60, 1538–1541. [Google Scholar] [CrossRef]
- Amerinatanzi, A.; Mehrabi, R.; Ibrahim, H.; Dehghan, A.; Moghaddam, N.S.; Elahinia, M. Predicting the Biodegradation of Magnesium Alloy Implants: Modeling, Parameter Identification, and Validation. Bioengineering 2018, 5, 105. [Google Scholar] [CrossRef] [Green Version]
- Gastaldi, D.; Sassi, V.; Petrini, L.; Vedani, M.; Trasatti, S.; Migliavacca, F. Continuum damage model for bioresorbable magnesium alloy devices—Application to coronary stents. J. Mech. Behav. Biomed. Mater. 2011, 4, 352–365. [Google Scholar] [CrossRef]
- Grogan, J.; O’Brien, B.; Leen, S.; McHugh, P. A corrosion model for bioabsorbable metallic stents. Acta Biomater. 2011, 7, 3523–3533. [Google Scholar] [CrossRef]
- Gao, Y.; Wang, L.; Gu, X.; Chu, Z.; Guo, M.; Fan, Y. A quantitative study on magnesium alloy stent biodegradation. J. Biomech. 2018, 74, 98–105. [Google Scholar] [CrossRef]
- Bajger, P.; Ashbourn, J.M.A.; Manhas, V.; Guyot, Y.; Lietaert, K.; Geris, L. Mathematical modelling of the degradation behaviour of biodegradable metals. Biomech. Model. Mechanobiol. 2017, 16, 227–238. [Google Scholar] [CrossRef]
- Debusschere, N.; Segers, P.; Dubruel, P.; Verhegghe, B.; De Beule, M. A computational framework to model degradation of biocorrodible metal stents using an implicit finite element solver. Ann. Biomed. Eng. 2015, 44, 382–390. [Google Scholar] [CrossRef]
- Deshpande, K.B. Numerical modeling of micro-galvanic corrosion. Electrochim. Acta 2011, 56, 1737–1745. [Google Scholar] [CrossRef]
- Duddu, R. Numerical modeling of corrosion pit propagation using the combined extended finite element and level set method. Comput. Mech. 2014, 54, 613–627. [Google Scholar] [CrossRef]
- Grogan, J.; Leen, S.; McHugh, P.; Grogan, J.; Leen, S.; McHugh, P. A physical corrosion model for bioabsorbable metal stents. Acta Biomater. 2014, 10, 2313–2322. [Google Scholar] [CrossRef] [Green Version]
- Abidin, N.I.Z.; Rolfe, B.; Owen, H.; Malisano, J.; Martin, D.; Hofstetter, J.; Uggowitzer, P.; Atrens, A. The in vivo and in vitro corrosion of high-purity magnesium and magnesium alloys WZ21 and AZ91. Corros. Sci. 2013, 75, 354–366. [Google Scholar] [CrossRef]
- Kirkland, N.; Birbilis, N.; Staiger, M. Assessing the corrosion of biodegradable magnesium implants: A critical review of current methodologies and their limitations. Acta Biomater. 2012, 8, 925–936. [Google Scholar] [CrossRef]
- Oyane, A.; Kim, H.-M.; Furuya, T.; Kokubo, T.; Miyazaki, T.; Nakamura, T. Preparation and assessment of revised simulated body fluids. J. Biomed. Mater. Res. 2003, 65, 188–195. [Google Scholar] [CrossRef] [PubMed]
- Ibrahim, H.; Dehghanghadikolaei, A.; Advincula, R.; Dean, D.; Luo, A.; Elahinia, M. Ceramic coating for delayed degradation of Mg-1.2Zn-0.5Ca-0.5Mn bone fixation and instrumentation. Thin Solid Films 2019, 687, 137456. [Google Scholar] [CrossRef]
- ASTM International. ASTM G1-03(2017)e1 Standard Practice for Preparing, Cleaning, and Evaluating Corrosion Test Specimens; ASTM: West Conshohocken, PA, USA, 2017. [Google Scholar]
- Grathwohl, P. Diffusion in Natural Porous Media: Contaminant Transport, Sorption/Desorption and Dissolution Kinetics; Springer Science & Business Media: Berlin/Heidelberg, Germany, 2012. [Google Scholar]
- Lin, X.; Wang, X.; Tan, L.; Wan, P.; Yu, X.; Li, Q.; Yang, K. Effect of preparation parameters on the properties of hydroxyapatite containing micro-arc oxidation coating on biodegradable ZK60 magnesium alloy. Ceram. Int. 2014, 40, 10043–10051. [Google Scholar] [CrossRef]


| Time (Days) | Mass Loss (g/cm2) | |
|---|---|---|
| Bare HP-Mg | MAO Coated HP-Mg | |
| 7 | 0.017 | 0.0066 |
| 14 | 0.04362 | 0.0232 |
| 21 | 0.05951 | - |
| 28 | 0.0693 | 0.0459 |
Publisher’s Note: MDPI stays neutral with regard to jurisdictional claims in published maps and institutional affiliations. |
© 2021 by the authors. Licensee MDPI, Basel, Switzerland. This article is an open access article distributed under the terms and conditions of the Creative Commons Attribution (CC BY) license (https://creativecommons.org/licenses/by/4.0/).
Share and Cite
Abdalla, M.; Ibrahim, H. A Physical Approach to Simulate the Corrosion of Ceramic-Coated Magnesium Implants. Appl. Sci. 2021, 11, 6724. https://doi.org/10.3390/app11156724
Abdalla M, Ibrahim H. A Physical Approach to Simulate the Corrosion of Ceramic-Coated Magnesium Implants. Applied Sciences. 2021; 11(15):6724. https://doi.org/10.3390/app11156724
Chicago/Turabian StyleAbdalla, Moataz, and Hamdy Ibrahim. 2021. "A Physical Approach to Simulate the Corrosion of Ceramic-Coated Magnesium Implants" Applied Sciences 11, no. 15: 6724. https://doi.org/10.3390/app11156724
APA StyleAbdalla, M., & Ibrahim, H. (2021). A Physical Approach to Simulate the Corrosion of Ceramic-Coated Magnesium Implants. Applied Sciences, 11(15), 6724. https://doi.org/10.3390/app11156724