Article

Pressure–Temperature Phase Diagram of Ta-H System up to 9 GPa and 600 °C

1
Quantum Beam Science Research Directorate, National Institutes for Quantum and Radiological Science and Technology, Hyogo 679-5148, Japan
2
Institute for Materials Research, Tohoku University, Sendai 980-8577, Japan
3
Department of Engineering Science and Mechanics, Shibaura Institute of Technology, Tokyo 135-8548, Japan
4
Advanced Institute for Materials Research (WPI-AIMR), Tohoku University, Sendai 980-8577, Japan
*
Author to whom correspondence should be addressed.
Appl. Sci. 2021, 11(15), 6719; https://doi.org/10.3390/app11156719
Submission received: 7 July 2021 / Revised: 19 July 2021 / Accepted: 21 July 2021 / Published: 22 July 2021
(This article belongs to the Special Issue New Vistas in Metal Hydrides and Related Materials)

Abstract

:
High-pressure hydrogenation behaviors of pure metals have not been investigated extensively, although intense research of hydrogenation reactions under high pressure has been conducted to find novel functional hydrides. The former provides us with valuable information for the high-pressure synthesis of novel functional hydrides. A pressure–temperature phase diagram of the Ta–H system has been determined using the in situ synchrotron radiation X-ray diffraction technique below 9 GPa and 600 °C in this study. At room temperature, the phase boundary obtained between distorted bcc TaH~1 and hcp TaH~2 was consistent with the previously reported transition pressure. The experimentally obtained Clapeyron slope can be explained via the entropy change caused by hydrogen evolution from TaH~2.

1. Introduction

Hydrides have a variety of functionalities, including high-temperature superconductivity [1,2,3], fast ionic conductivity [4,5], and H conduction [6,7]. Recent progress in synthesis techniques, theoretical calculations, and fundamental studies of hydrides have enabled these functionalities to be realized [8]. Applying high pressure is an essential technique for investigating functional hydrides, because novel hydrides can be synthesized under high pressure due to the extremely high chemical potential of hydrogen. On the other hand, hydrogenation reactions of pure metals have received little attention. However, such studies provide us with useful information for the high-pressure synthesis of novel functional hydrides.
Recently, the hydrogenation reaction of tantalum (Ta) monohydride (TaH) [9] has been reported to form Ta dihydride (TaH~2) [10]. The formation of TaH~2, in which Ta atoms occupy the hcp lattice’s nodes (hereafter, referred to as hcp TaH~2), has been predicted theoretically [11]. Kuzovnikov et al. confirmed that hydrogenating Ta above 5 GPa at room temperature could synthesize theoretically predicted hcp TaH~2. During depressurization at room temperature, the formed dihydride decomposed into monohydride at 2.2 GPa. The crystal structure of the monohydride has been reported to be a face-centered orthorhombic one in which lattice constant a is comparable to b and c is nearly equal to a/ 2 . The face-centered orthorhombic phase cannot be distinguished from the bcc structure by the measurement system used in the present study, which we referred to as distorted bcc TaH. They also reported that hcp TaH~2 could be recovered at ambient pressure by quenching at liquid-N2 temperature and depressurization. Based on the weight change during hydrogen desorption at ambient pressure, the hydrogen concentration was estimated to be H/M ~ 2.2. Hydrogen-induced volume expansion, dV/dx, was reported to be 2.4 Å3/H atom, where V is the unit cell volume divided by the number of atoms in the unit cell (unit cell volume/formula unit (f. u.) and x is the hydrogen concentration for TaHx. Although the hydrogenation behavior of Ta has been carefully investigated under high pressure at room temperature in ref [10], no results on the high-pressure and high-temperature hydrogenation of Ta have been reported to date.
In the present study, we determined the pressure–temperature (p–T) phase diagram of the Ta–H system using in situ synchrotron radiation X-ray diffraction measurement. At room temperature, the obtained phase boundary between distorted bcc TaH and hcp TaH~2 was consistent with the previously reported transition pressure [10]. However, no novel hydride phase was observed below 9 GPa and 900 °C.

2. Materials and Methods

We employed reagent-grade Ta powder (the Nilaco Corporation, 1-20-6 Ginza, chuo-ku, Tokyo 104-0061, Japan, purity 3N) as a starting material. The Ta powder was mixed with boron nitride (BN, the Nilaco Corporation, 1-20-6 Ginza, chuo-ku, Tokyo 104-0061, Japan, purity 2N) powder with a volumetric ratio of 2:3 to prevent solid-state grain growth of Ta under high temperature, which prevents the detection of X-ray diffraction peaks in the energy-dispersive mode. The powder mixture was compacted into a disk shape with a diameter of 0.4 mm and a height of 0.4 mm. The compacted Ta disk was inserted in a BN sample capsule, which was then placed in a high-pressure cell described below.
High pressure was generated using a cubic-type multi-anvil apparatus. A cubic pressure medium with a 6 mm edge length containing the sample was squeezed by tungsten carbide pistons with a truncation edge length of 4 mm. Using the apparatus, a combination of the pressure medium and pistons can generate up to 10 GPa pressure. High-pressure hydrogenation was achieved employing the method initially developed by Fukai [12]. The method uses an internal hydrogen source placed in a cubic pressure medium and emits hydrogen when heated while the sample is under high pressure. The emitted hydrogen is confined in a hydrogen sealing capsule made of NaCl. A 0.1 mm thin BN disk separates the internal hydrogen source from the sample, preventing unfavorable reaction between the sample and the internal hydrogen source residue after the hydrogen evolution. Hydrogen permeation through the BN disk is quite fast; compared to the Ta–H system’s hydrogenation/dehydrogenation reaction time, hydrogen permeation time through BN is negligible.
In situ synchrotron radiation powder X-ray diffraction measurement was performed at BL14B1 and SPring-8. The sample was irradiated by white X-rays generated at a bending magnet source. In the energy-dispersive mode, a germanium solid-state detector detected the diffracted white X-rays. Throughout the measurements in this study, the diffraction angle was fixed at 2θ = 6 °. The sample pressure was estimated based on the unit cell volume of the NaCl placed in the cubic pressure medium along with the sample and the state thermal equation of NaCl reported by Decker [13]. An alumel–chromel thermocouple wire was used to measure the temperature of the sample. Pressure and temperature uncertainties were less than 0.2 GPa and 10 °C, respectively.
The sample was pressurized to the target pressures (9 GPa and 7 GPa) and then heated until the in situ measurements revealed the formation of distorted bcc TaH. After the formation of distorted bcc TaH, the sample was cooled to establish the phase boundary between distorted bcc TaH and hcp TaH2. The pressure–temperature phase diagram of the Ta–H system under high pressure was then determined by repeating the depressurization, heating, and cooling steps. The typical heating or cooling rate was 20 K/min. Heating or cooling was carried out by applying a constant load to the high-pressure apparatus. Under such constant load conditions, a certain degree of pressure change occurs. Pressure values were determined by measuring the unit cell volume of NaCl before and after heating or cooling. Pressure values during heating or cooling were estimated by interpolation.

3. Results

Figure 1 shows a series of in situ synchrotron radiation powder X-ray diffraction patterns of Ta and BN powder mixture at 8.17 GPa. Discontinuous peak shifts to the lower energy sides were observed. The peak shifts correspond to lattice expansion. The hydrogenation reaction of bcc Ta resulted in distorted bcc TaH. The value of the lattice expansion was calculated as ΔV = 2.5 Å3/f. u. Using the value of the hydrogen-induced volume expansion ΔVH = 2.4 Å3/f. u. reported by Kuzovnikov et al., the hydrogen content was calculated to be TaH1.0. The observed hydrogenation temperature of 642 °C at 8.17 GPa corresponds to the decomposition pressure–temperature conditions of AlH3 [14] that were used as the internal hydrogen source in this study.
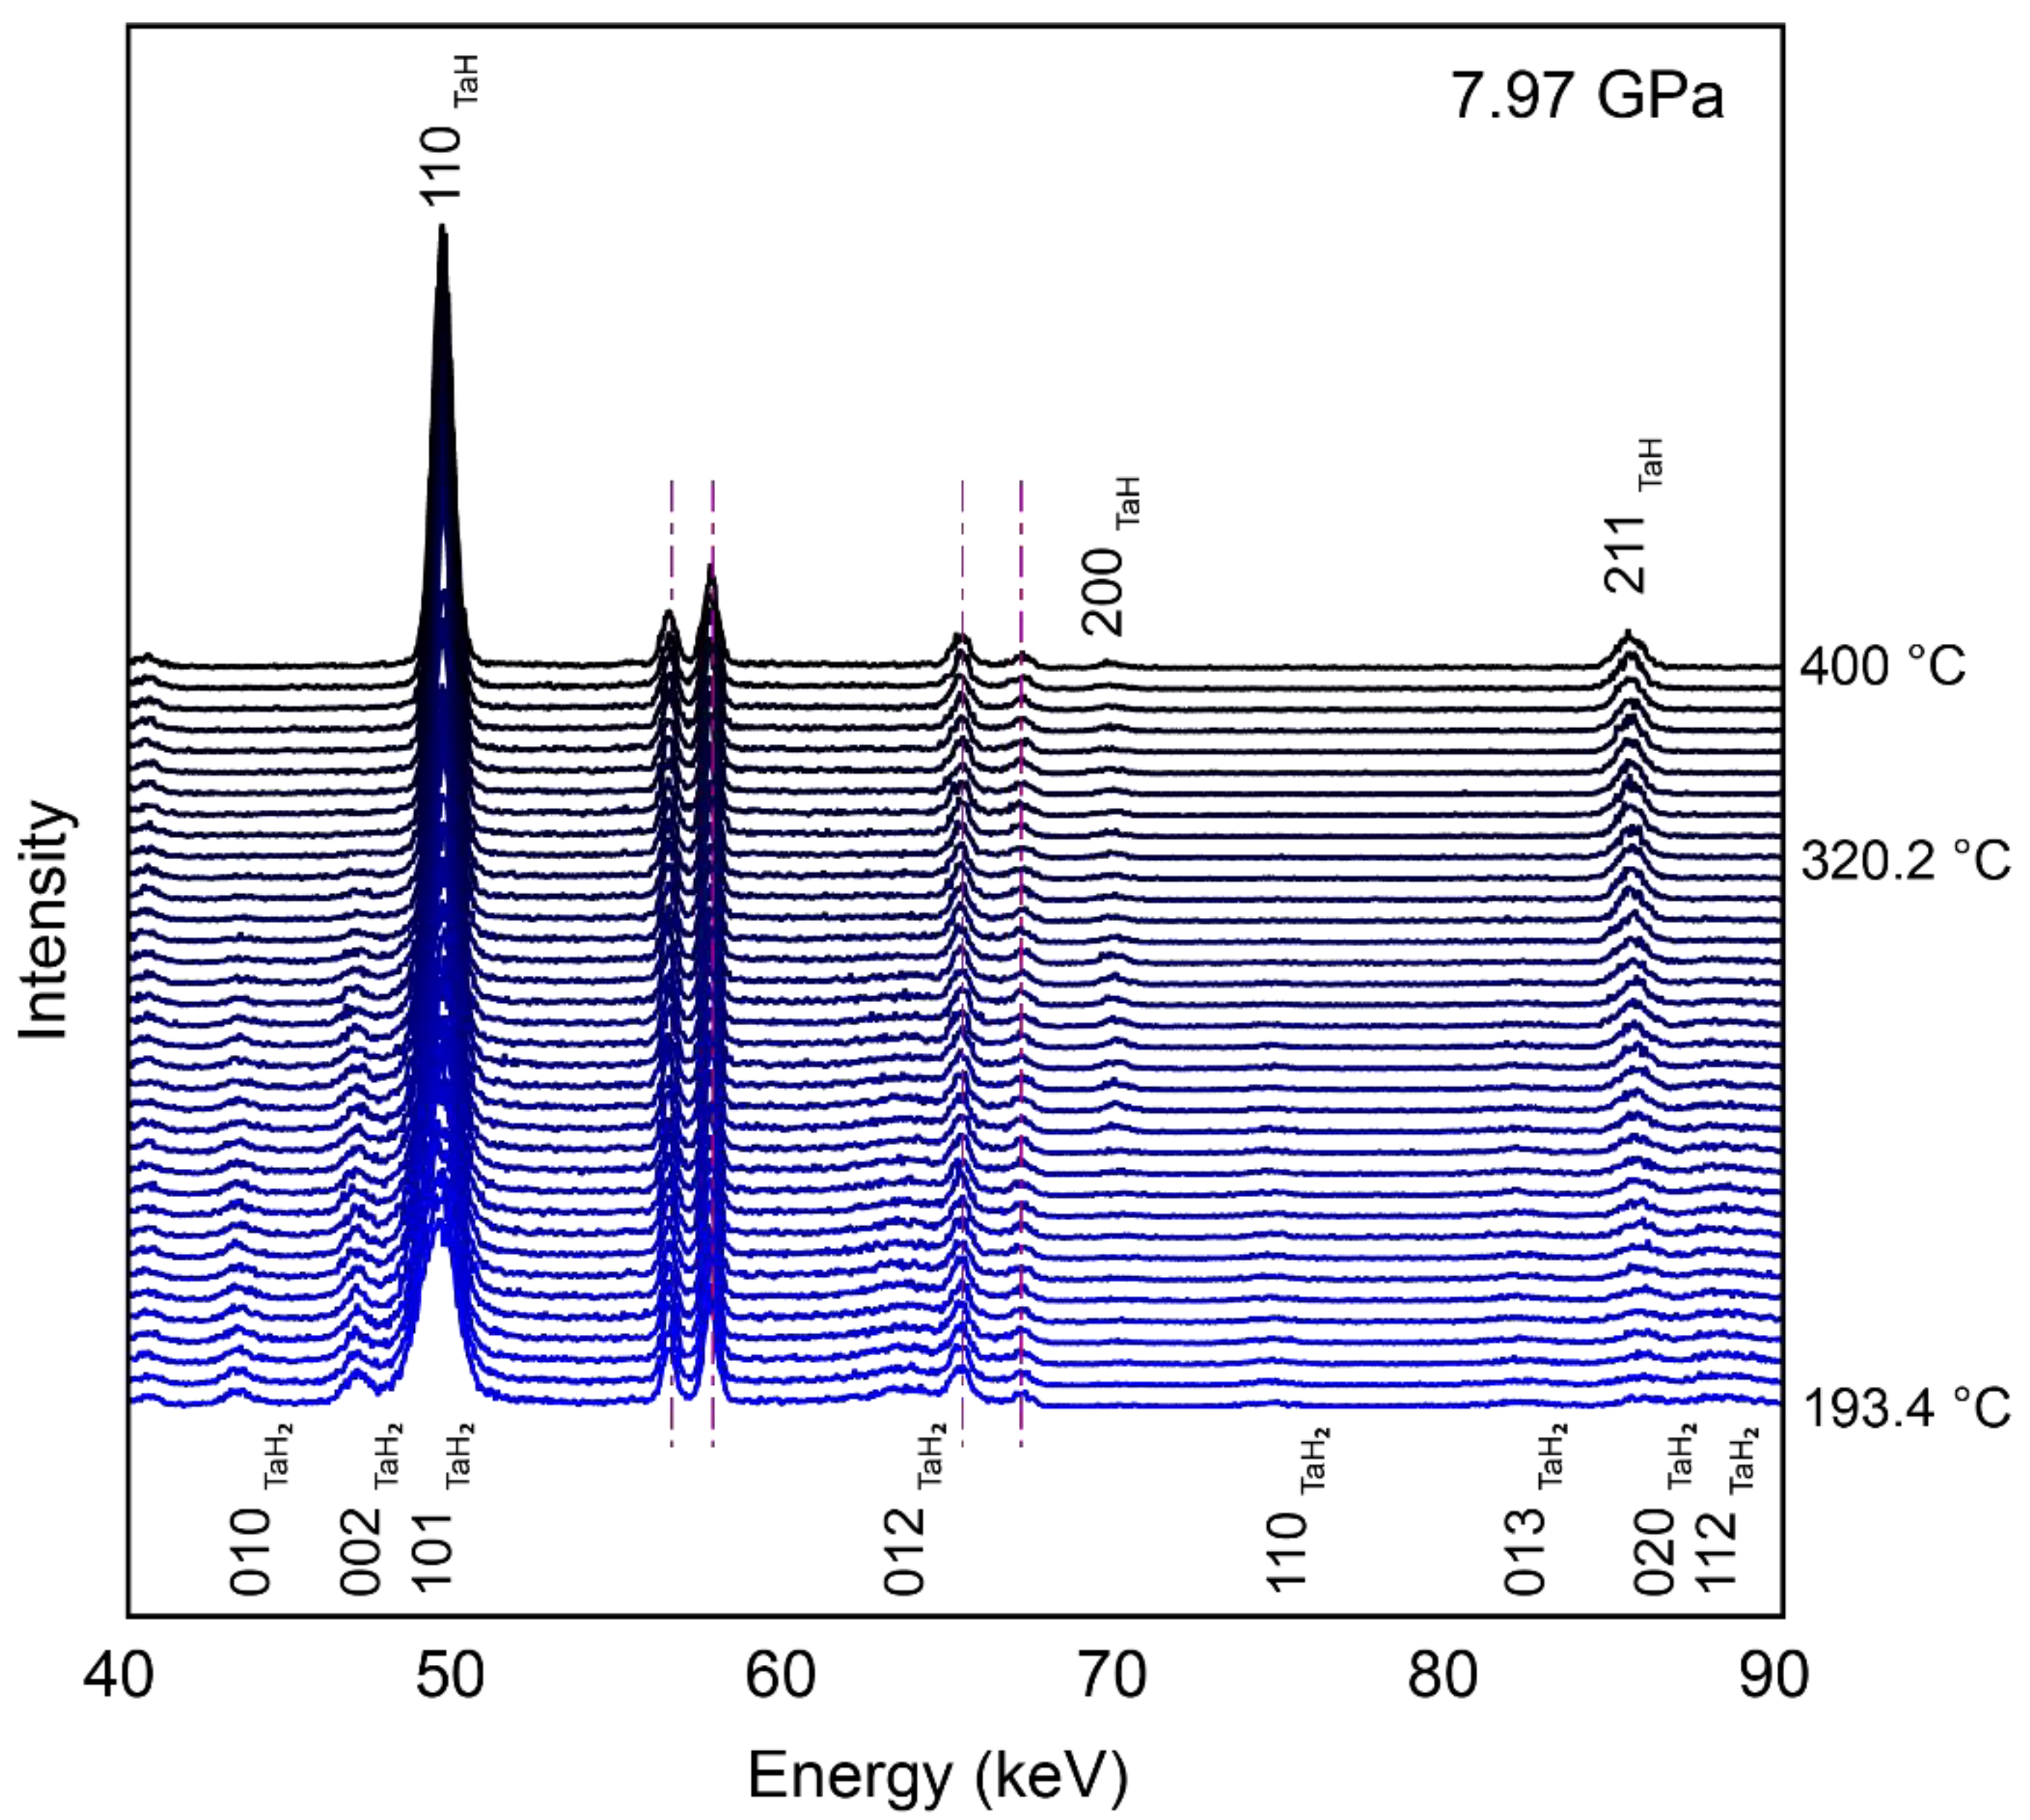
The sample was then cooled to room temperature under high pressure. Figure 2 shows a series of in situ synchrotron radiation powder X-ray diffraction patterns at 7.97 GPa. New Bragg peaks emerged at 320 °C. The peaks can be indexed to a hexagonal unit cell, indicating a phase transition from distorted bcc TaH to hcp TaH~2. The temperature at which the distorted bcc TaH Bragg peaks vanished was approximately 100 °C lower than the temperature at which hcp TaH~2 formed; distorted bcc TaH and hcp TaH~2 coexisted in the temperature region.
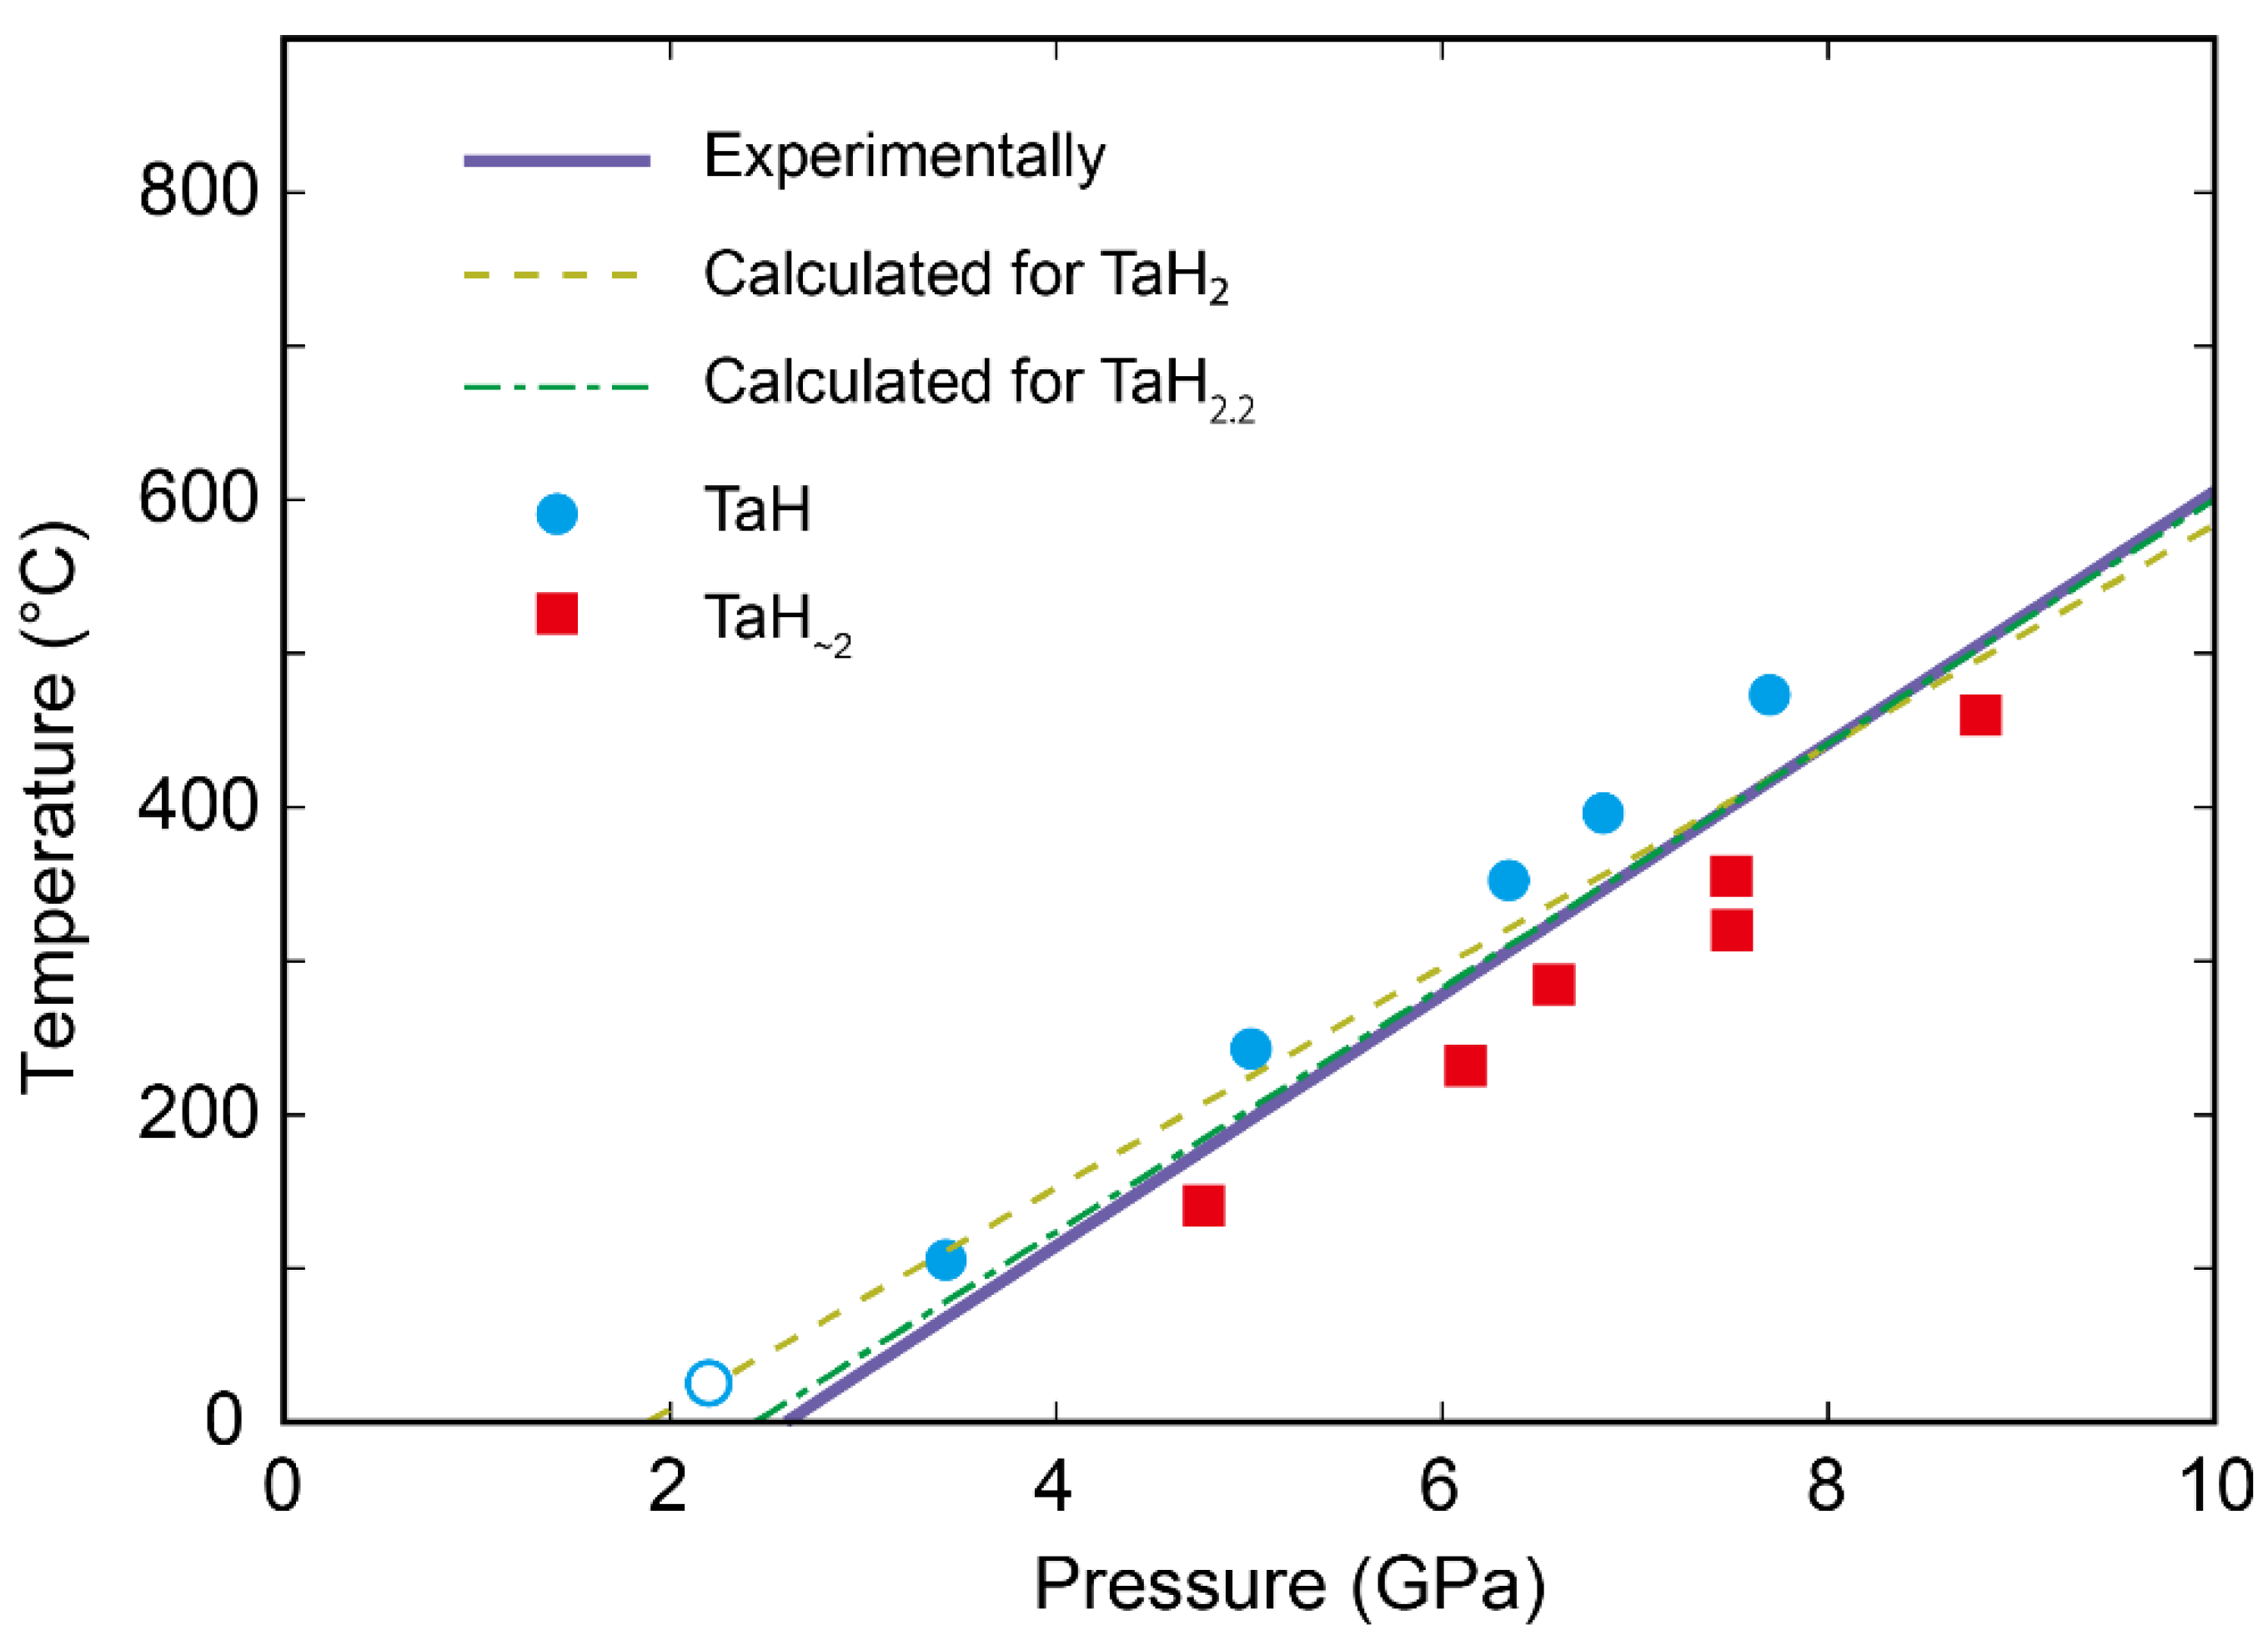
Figure 3 shows the pressure–temperature phase diagram of the Ta–H system. Cooling and heating runs were used to establish the pressure–temperature conditions at which hcp TaH2 and distorted bcc TaH formed. As can be seen in Figure 3, transition temperatures obtained during heating and cooling runs were different, indicating that the phase transition involves hysteresis.
As illustrated by the solid line in Figure 3, the phase boundary was defined as the midpoints of dehydrogenation and hydrogenation p–T conditions. The phase transition temperature monotonously increased with increasing pressure, reaching 600 °C at 10 GPa. At 2.92 GPa, the phase boundary crosses the room temperature line at T = 27 °C. This is consistent with the previously reported transition pressure (2.2 GPa) from TaH2 to TaH at room temperature (open circle in Figure 3) [10].
The lattice parameters of distorted bcc TaH and hcp TaH~2 were calculated to be a = 3.4073 ± 0.0006 Å at 3.55 GPa and a = 3.186 ± 0.005 and c = 5.069 ± 0.009 Å at 6.14 GPa, respectively. These values are comparable to those previously reported ones, e.g., a ~ 3.41 Å at 3.5 GPa and a ~ 3.19 and c ~ 5.10 Å (c/a ~ 1.6) at 6.1 GPa which were estimated from FIG. 3 in ref. [10].

4. Discussion

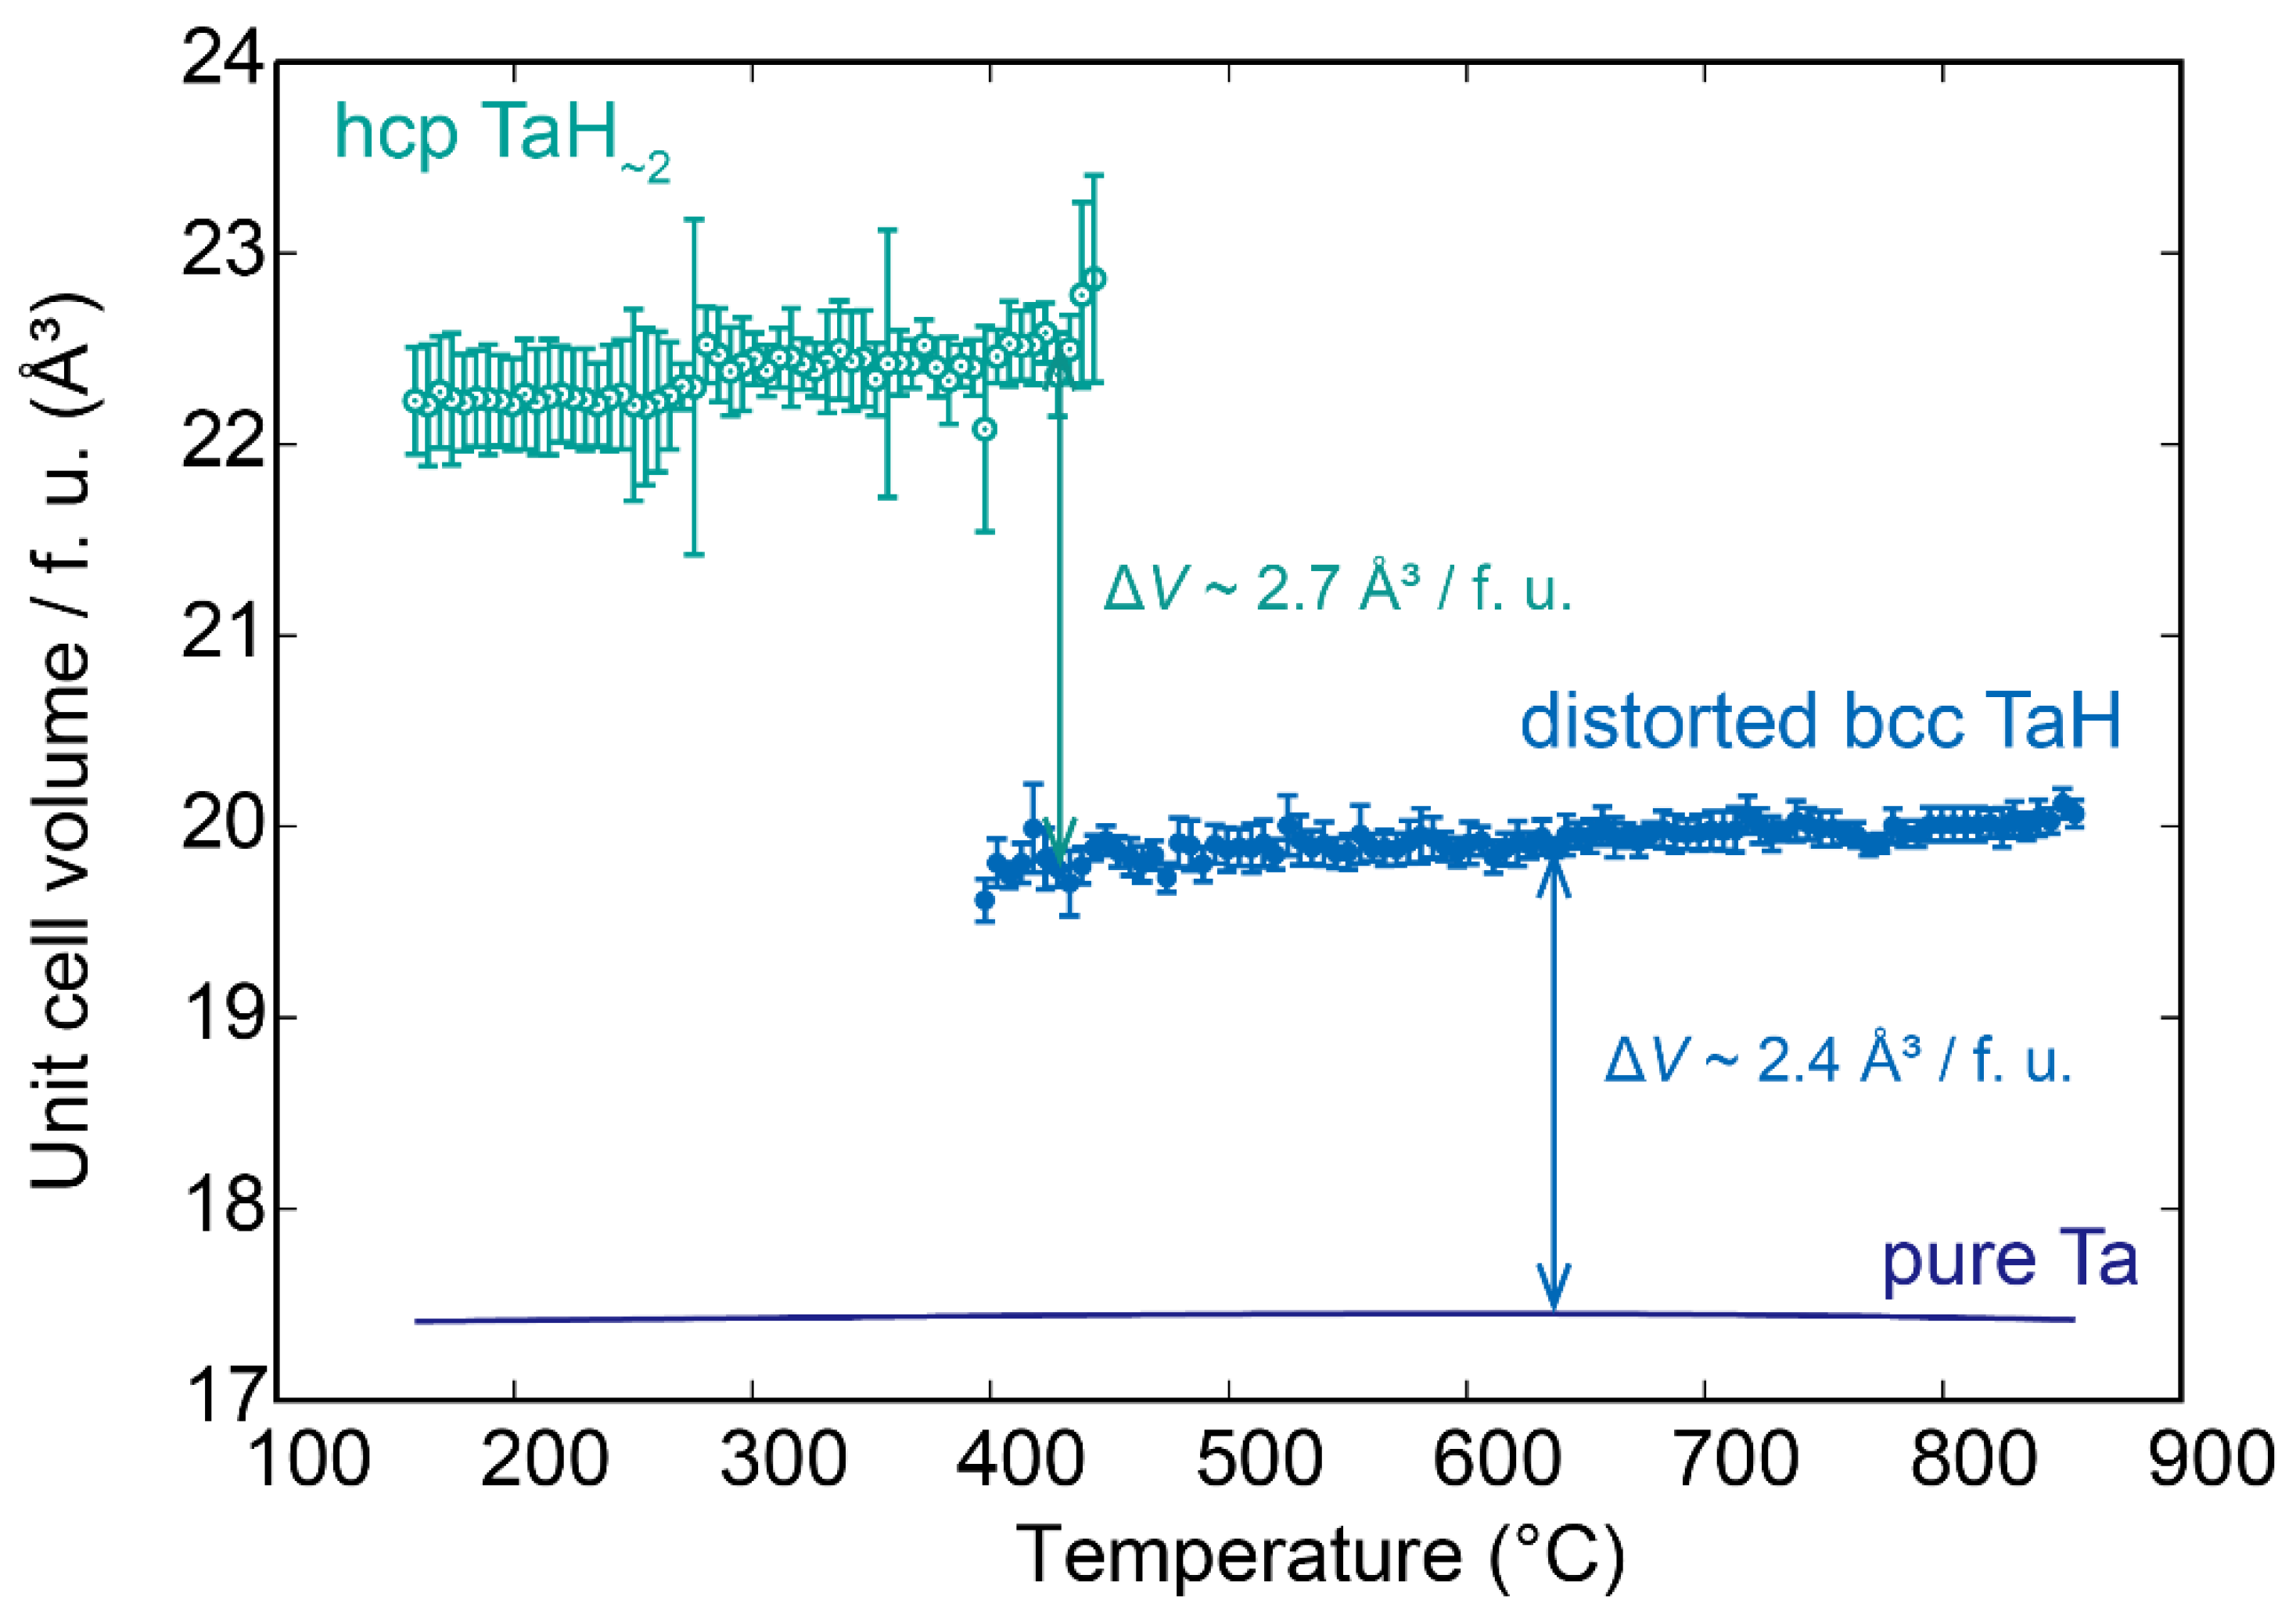
Figure 4 depicts the unit cell volume/f. u. of distorted bcc TaH and hcp TaH~2, obtained during a cooling run at a pressure range of 9.35 GPa to 8.36 GPa. Figure 4 also shows the unit cell volume/f. u. of pure Ta, which was determined by another in situ synchrotron radiation X-ray diffraction measurement. Temperature dependences of unit cell volume/f. u. of both distorted bcc TaH and hcp TaH~2 were within error bars in Figure 4, indicating that the hydrogen concentration of both distorted bcc TaH and hcp TaH~2 was constant at the observed p–T conditions. Using the value of hydrogen-induced volume expansion ΔVH = 2.4 Å3/f. u. [10], the averaged hydrogen concentration of distorted bcc TaH was estimated to be TaHx for x = 0.99 ± 0.04. The hydrogen concentration of hcp TaH~2 cannot be calculated in the same way, because unit cell volumes of hcp Ta are not accessible. The temperature dependence of the unit cell volume of hcp TaH~2, on the other hand, is within experimental error, indicating an almost constant hydrogen concentration of hcp TaH~2.
Finally, the phase boundary between TaH and TaH~2 is analyzed based on the Clausius–Clapeyron equation and possibility of the overstoichiometric composition of H/M under high pressure. The slope of the phase boundary between TaH and TaH~2 shown in Figure 3 can be calculated using the Clausius–Clapeyron equation:
d T d p = Δ V Δ S ,
where T, p, ΔV, and ΔS are temperature, pressure, volume change, and entropy change during the dehydrogenation reaction of TaH2 → TaH + 1/2 H2. At 427 °C (=700 K), ΔV was calculated to be 2.93 × 10⁻⁶ (m3) based on Figure 4, and the volume of H2 tabulated in ref. [15]. ΔS can be approximated to the entropy change caused by the evolution of hydrogen molecules (=30.3 (J/K)). The slope between the phase boundary was then calculated to be 7.19 × 10⁻⁸ (K/Pa). This value is comparable to the experimentally obtained value of 8.18 × 10⁻⁸ (K/Pa).
Next, we consider the overstoichiometric composition of H/M = 2.2, reported by Kuzonikov et al. [10]. ΔV’ and ΔS’ were calculated to be 2.93 × 10⁻⁶ (m3) and 36.9 (J/K), respectively, assuming the same hydride was formed under high pressure and high temperature. In this case, the slope of the boundary was calculated to be 7.94 × 10⁻⁸ (K/Pa), which is closer to the experimental value. It is likely that the formed Ta dihydride at high pressure and high temperature has an overstoichiometric hydrogen composition of H/M ~ 2.2.
It is required to understand the hydrogenation behaviors of pure metals to explore the synthesis of pressure–temperature conditions of novel hydrides under high pressure. However, little effort has been put into the investigation of the hydrogenation reactions of pure metals. The present study investigated the p–T phase diagram of the Ta–H system below 9 GPa and 600 °C. The obtained phase boundary between distorted bcc TaH and hcp TaH~2 agreed well with the previously reported transition pressure at room temperature. The Clausius–Clapeyron equation can be used to explain the slope of the phase boundary. The analysis suggests that the formed Ta dihydride has an overstoichiometric hydrogen composition of H/M ~ 2.2, which has previously been reported for recovered Ta hydride hydrogenated at 9 GPa and depressurized at liquid-N2 temperature. The results would help synthesize functional hydrides such as Li6TaH11, potentially with fast lithium conduction [16].

Author Contributions

Conceptualization, H.S. and S.-i.O.; investigation, H.S., S.T. and T.S.; data curation, H.S.; writing—original draft preparation, H.S.; writing—review and editing, H.S., S.T., T.S., and S.-i.O.; visualization, H.S.; supervision, H.S. and S.-i.O.; project administration, S.-i.O.; funding acquisition, H.S. and S.-i.O. All authors have read and agreed to the published version of the manuscript.

Funding

This work was supported by JSPS KAKENHI Grant-in-Aid for Scientific Research on Innovative Areas “Hydrogenomics” (No. JP18H05513) as well as grants from the Inter-University Cooperative Research Program of the Institute for Materials Research, Tohoku University (Proposal Nos. 19K0049, 20K0022, and 202012-RDKGE-0066).

Institutional Review Board Statement

Not applicable.

Informed Consent Statement

Not applicable.

Data Availability Statement

The data presented in this study are available from the corresponding author upon request.

Acknowledgments

We are grateful to Ren Hasegawa for providing technical support. The synchrotron radiation experiments were performed using a QST experimental station at the QST beamline BL14B1, SPring-8, with the approval of the Japan Synchrotron Radiation Research Institute (JASRI) (Proposal Nos. 2016A3652, 2018A3651, 2018B3651, 2019A3651, 2019B3651, 2020A3651 and 2021A3651). In situ synchrotron radiation powder X-ray diffraction profiles were analyzed using the program PDIndexer, developed by Y. Seto.

Conflicts of Interest

The authors declare no conflict of interest.

References

  1. Drozdov, A.P.; Eremets, M.I.; Troyan, I.A.; Ksenofontov, V.; Shylin, S.I. Conventional superconductivity at 203 kelvin at high pressures in the sulfur hydride system. Nature 2015, 525, 73–76. [Google Scholar] [CrossRef]
  2. Drozdov, A.P.; Kong, P.P.; Minkov, V.S.; Besedin, S.P.; Kuzovnikov, M.A.; Mozaffari, S.; Balicas, L.; Balakirev, F.F.; Graf, D.E.; Prakapenka, V.B.; et al. Superconductivity at 250 K in lanthanum hydride under high pressures. Nature 2019, 569, 528–531. [Google Scholar] [CrossRef] [PubMed] [Green Version]
  3. Somayazulu, M.; Ahart, M.; Mishra, A.K.; Geballe, Z.M.; Baldini, M.; Meng, Y.; Struzhkin, V.V.; Hemley, R.J. Evidence for Superconductivity above 260 K in Lanthanum Superhydride at Megabar Pressures. Phys. Rev. Lett. 2019, 122, 27001. [Google Scholar] [CrossRef] [PubMed] [Green Version]
  4. Matsuo, M.; Nakamori, Y.; Orimo, S.; Maekawa, H.; Takamura, H. Lithium superionic conduction in lithium borohydride accompanied by structural transition. Appl. Phys. Lett. 2007, 91, 224103. [Google Scholar] [CrossRef]
  5. Udovic, T.; Matsuo, M.; Tang, W.S.; Wu, H.; Stavila, V.; Soloninin, A.; Skoryunov, R.V.; Babanova, O.A.; Skripov, A.V.; Rush, J.J.; et al. Exceptional Superionic Conductivity in Disordered Sodium Decahydro-closo-decaborate. Adv. Mater. 2014, 26, 7622–7626. [Google Scholar] [CrossRef] [PubMed]
  6. Kobayashi, G.; Hinuma, Y.; Matsuoka, S.; Watanabe, A.; Iqbal, M.; Hirayama, M.; Yonemura, M.; Kamiyama, T.; Tanaka, I.; Kanno, R. Pure H- conduction in oxyhydrides. Science 2016, 351, 1314–1317. [Google Scholar] [CrossRef] [PubMed] [Green Version]
  7. Fukui, K.; Iimura, S.; Tada, T.; Fujitsu, S.; Sasase, M.; Tamatsukuri, H.; Honda, T.; Ikeda, K.; Otomo, T.; Hosono, H. Characteristic fast H ion conduction in oxygen-substituted lanthanum hydride. Nat. Commun. 2019, 10, 1–8. [Google Scholar] [CrossRef] [PubMed]
  8. Mohtadi, R.; Orimo, S. The renaissance of hydrides as energy materials. Nat. Rev. Mater. 2016, 2, 16091. [Google Scholar] [CrossRef]
  9. Kuzovnikov, M.A.; Antonov, V.E.; Ivanov, A.S.; Hansen, T.; Savvin, S.; Kulakov, V.I.; Tkacz, M.; Kolesnikov, A.I. Neutron scattering study of tantalum monohydride and monodeuteride. Int. J. Hydrogen Energy 2021, 46, 20630–20639. [Google Scholar] [CrossRef]
  10. Kuzovnikov, M.A.; Tkacz, M.; Meng, H.; Kapustin, D.I.; Kulakov, V.I. High-pressure synthesis of tantalum dihydride. Phys. Rev. B 2017, 96, 134120. [Google Scholar] [CrossRef] [Green Version]
  11. Zhuang, Q.; Jin, X.; Cui, T.; Ma, Y.; Lv, Q.; Li, Y.; Zhang, H.; Meng, X.; Bao, K. Pressure-Stabilized Superconductive Ionic Tantalum Hydrides. Inorg. Chem. 2017, 56, 3901–3908. [Google Scholar] [CrossRef]
  12. Fukai, Y.; Okuma, N. Evidence of Copious Vacancy Formation in Ni and Pd under a High Hydrogen Pressure. Jpn. J. Appl. Phys. 1993, 32, L1256–L1259. [Google Scholar] [CrossRef]
  13. Decker, D.L. High-Pressure Equation of State for NaCl, KCl, and CsCl. J. Appl. Phys. 1971, 42, 3239–3244. [Google Scholar] [CrossRef] [Green Version]
  14. Graetz, J.; Reilly, J.J.; Yartys, V.A.; Maehlen, J.P.; Bulychev, B.M.; Antonov, V.E.; Tarasov, B.P.; Gabis, I.E. Aluminum hydride as a hydrogen and energy storage material: Past, present and future. J. Alloy. Compd. 2011, 509, S517–S528. [Google Scholar] [CrossRef]
  15. Sugimoto, H.; Fukai, Y. Solubility of hydrogen in metals under high hydrogen pressures: Thermodynamical calculations. Acta Met. Mater. 1992, 40, 2327–2336. [Google Scholar] [CrossRef]
  16. Takagi, S.; Iijima, Y.; Sato, T.; Saitoh, H.; Ikeda, K.; Otomo, T.; Miwa, K.; Ikeshoji, T.; Orimo, S. Formation of novel transition metal hydride complexes with ninefold hydrogen coordination. Sci. Rep. 2017, 7, 44253. [Google Scholar] [CrossRef] [Green Version]
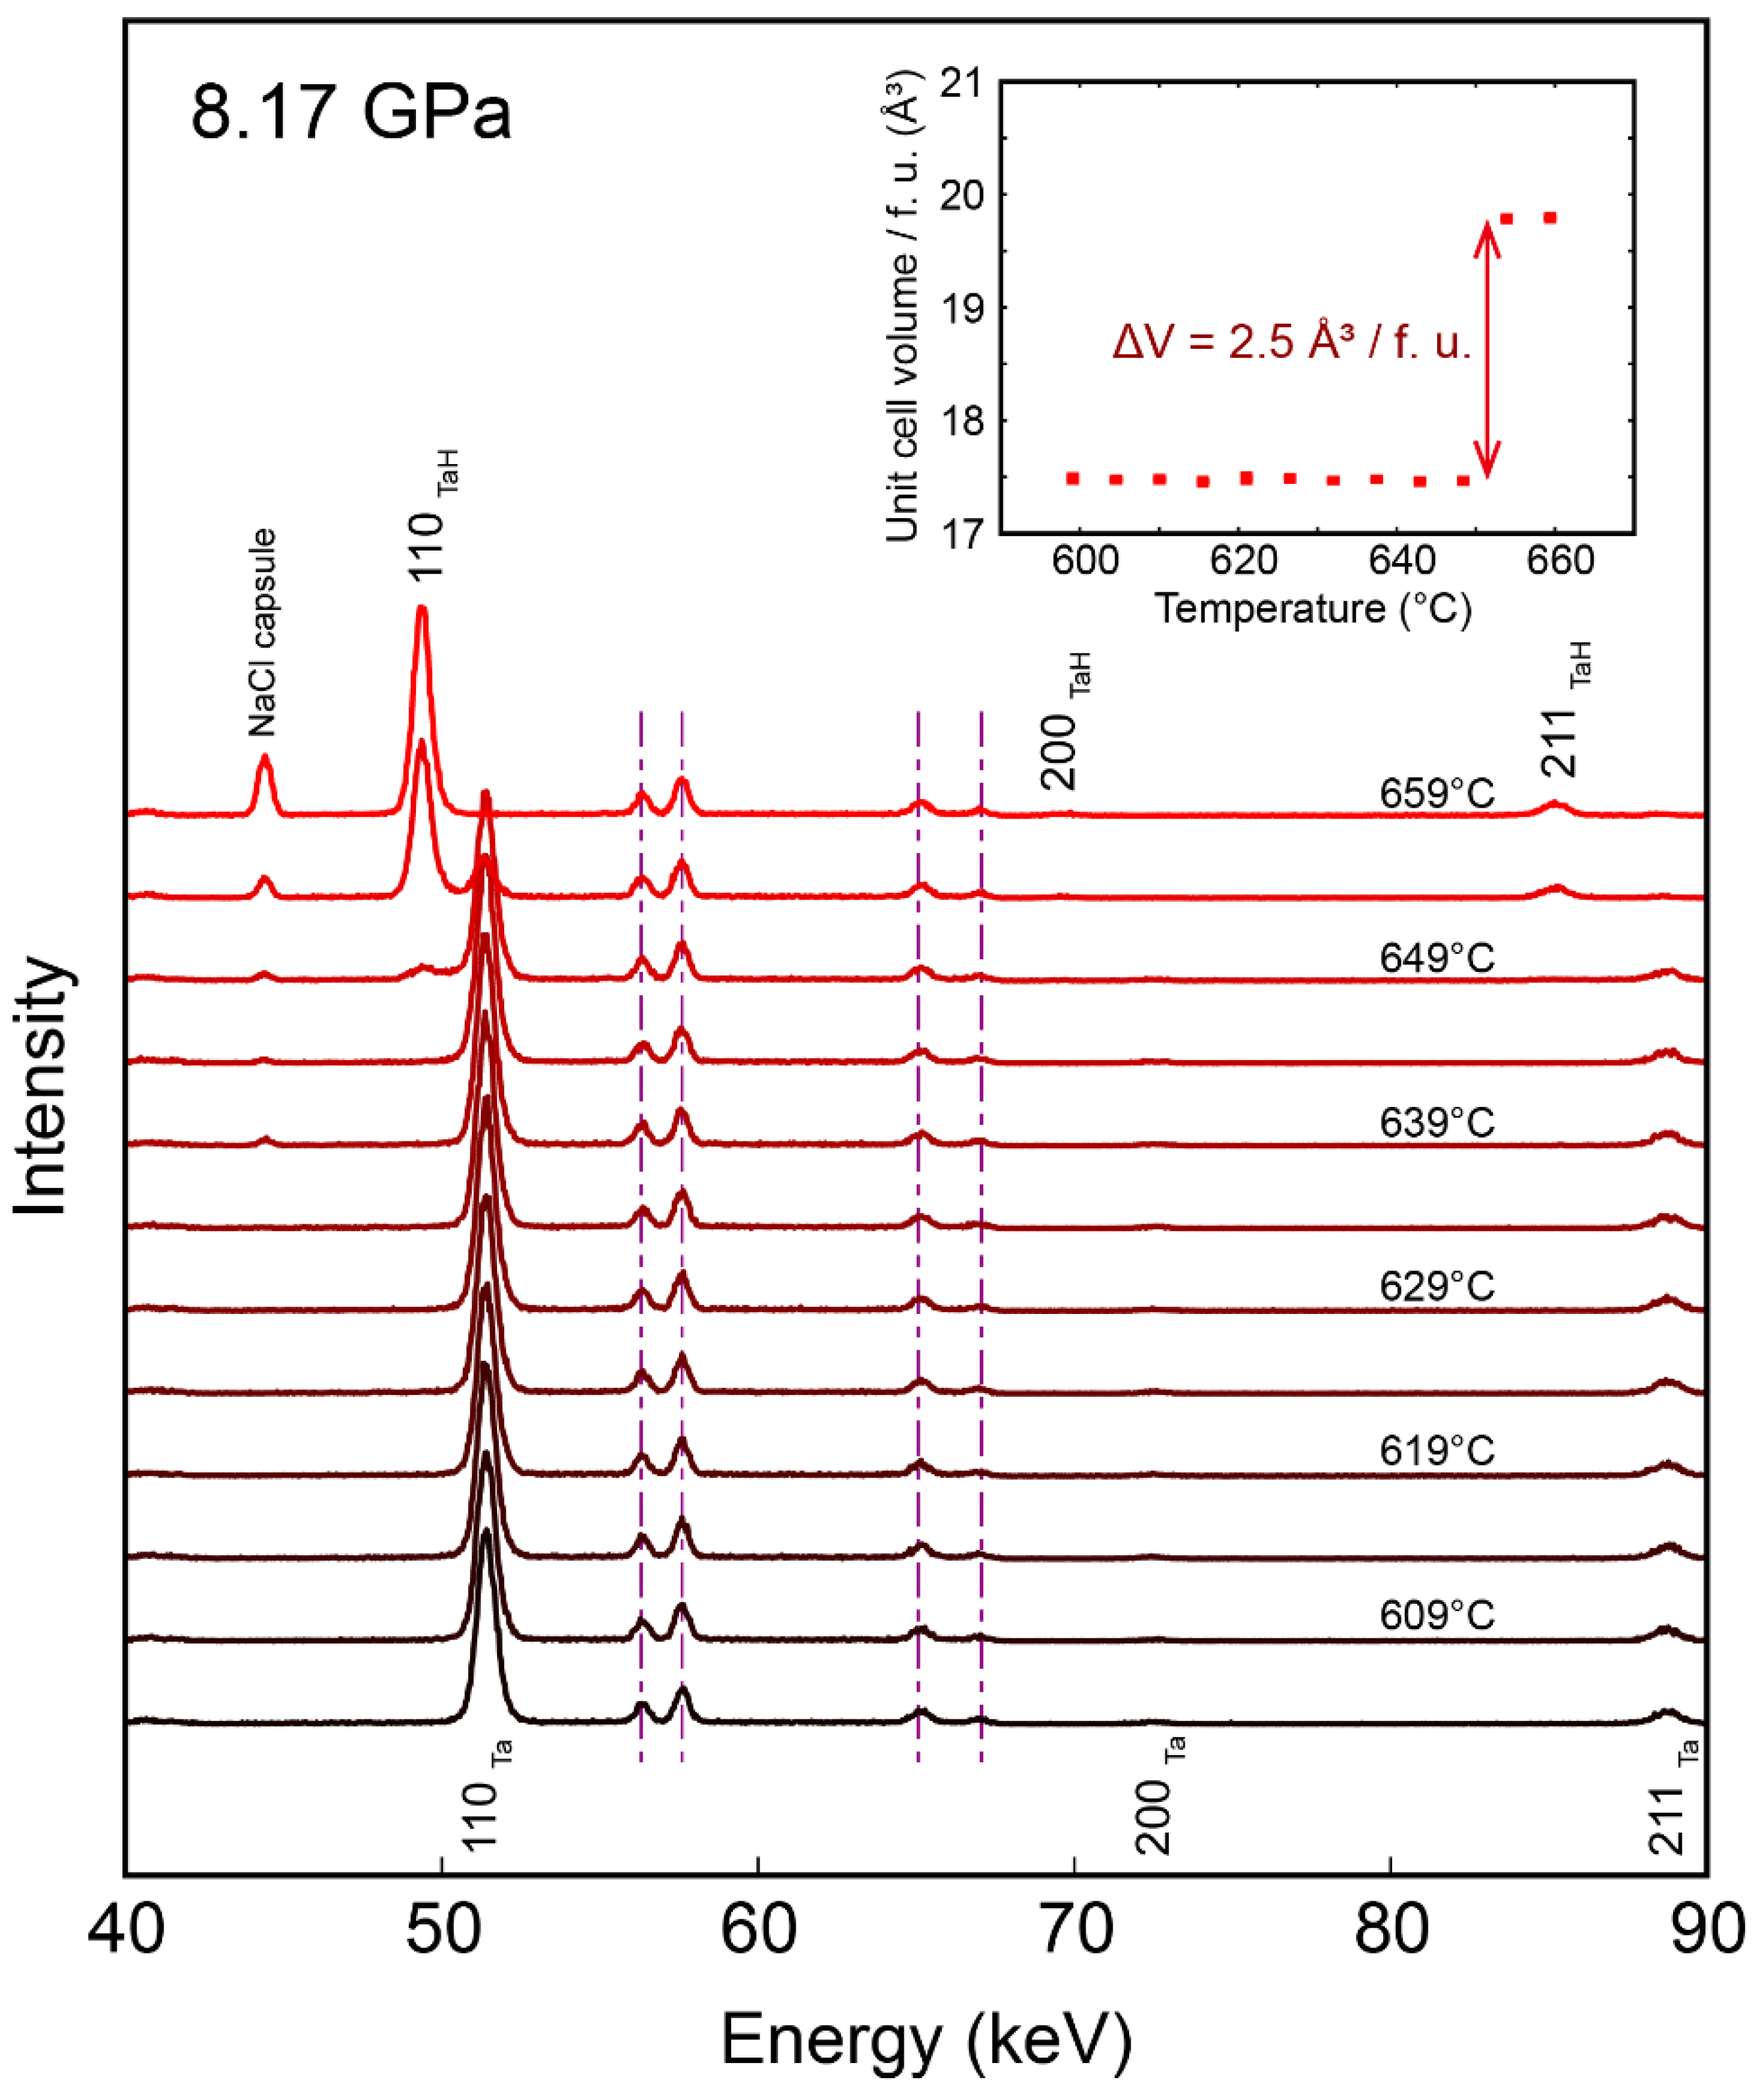
Figure 1. Series of in situ synchrotron radiation powder X-ray diffraction patterns of Ta and BN powder mixture at 8.17 GPa during heating from 599 °C to 659 °C. Discontinuous lattice expansion was observed at 642 °C and was caused by the hydrogenation reaction of bcc Ta to form distorted bcc TaH. The peaks on the dashed lines correspond to fluorescence from Ta.
Applsci 11 06719 g001
Figure 2. Series of in situ synchrotron radiation powder X-ray diffraction patterns of Ta and BN powder mixture at 7.97 GPa during cooling from 400 °C to 193.4 °C. The peaks on the dashed lines correspond to fluorescence from Ta.
Applsci 11 06719 g002
Figure 3. Pressure–temperature phase diagram of Ta–H system. Squares and circles denote the pressure–temperature conditions where the formation of hcp TaH~2 and distorted bcc TaH detected during heating and cooling runs, respectively, were observed. The solid line indicates the experimentally determined phase boundary between distorted bcc TaH and hcp TaH~2. Dotted and dashed lines depict calculated phase boundaries based on Clausius–Clapeyron equation for dehydrogenation reaction of TaH2.0 and TaH2.2, respectively. Open circle indicates the previously reported pressure–temperature conditions where TaH2 transformed into TaH [10].
Applsci 11 06719 g003
Figure 4. Unit cell volume of distorted bcc TaH and hcp TaH~2, obtained during a cooling run at a pressure range from 9.35 GPa to 8.36 GPa. Unit cell volume of pure Ta at the same pressure–temperature conditions are shown by the solid curve.
Applsci 11 06719 g004
Publisher’s Note: MDPI stays neutral with regard to jurisdictional claims in published maps and institutional affiliations.