1. Introduction
Nowadays, the topic of energy efficiency plays a central role in the research world. The climate is constantly changing, and it is thought that designing buildings with high-energy performance can mitigate its impact. In general, designing zero-energy buildings means to focus the attention on their high-energy performance, comfort conditions, and excellent levels of air quality [
1]. Many buildings suffer from high electricity consumption, mainly related to the lighting system. A proper design of the lighting system allows for achieving excellent results in terms of comfort perceived within the spaces [
2] and from energy and economic points of view [
3]. So, the optimization of artificial lighting can provide many advantages in indoor and outdoor spaces [
4]. Furthermore, the design of artificial lighting systems cannot disregard the perception of natural light within the environment. Indeed, the windows, while being a weak element with regard to energy dispersion [
5], if positioned and sized well, can provide good lighting inside the rooms, disincentivizing the abundant use of artificial lighting systems. The main difference between the exploitation of daylighting compared with artificial ones is the quality. For instance, the performance of natural light in the perception of colour is superior to other sources, even if, in recent decades, new technologies can provide light with characteristics increasingly similar to daylight. In addition, visible radiation from the sun and sky adds natural dynamics to the lighting conditions of an environment through the temporal variations in colour, contrast, and illuminance of each surface. Such effects can hardly be simulated using artificial sources [
6].
The retrofitting of schools is a topic of great importance, given their large presence and the poor quality in which many of these buildings are found [
7]. In addition, school buildings account for 19% of overall energy consumption [
8]. Many studies have been directed at improving the energy performance of school buildings, considering actions aimed at both the building envelope and the air conditioning system [
9,
10].
As far as the lighting aspect is concerned, a school is a very complex environment, as it is made up of numerous areas with different uses and therefore different requirements to be met. Optimizing lighting in a school means allowing students and staff to perform their visual tasks to their full potential without visual stress. Light plays an important role at the psychophysical level; the visual capacity is the result of the adaptation of human eyes to light over time [
11]. The lighting analysis of working spaces allows for knowing in a precise way the amount of artificial and daylight that occurs in the spaces, evaluating the illuminance, which is defined as the amount of light flow that affects a surface. Inadequate illuminance causes objects in the room to be seen incorrectly and causes eyestrain.
In the literature, there are numerous studies focused on these issues.
Lee et al. [
12] established a probabilistic approach useful for evaluating the most frequent risks of retrofitted lighting measures, such as replacing existing luminaires and installing lighting control systems. In addition, they considered factors that may affect energy performance such as occupancy hours, daylight contribution, and the condition of lighting sources and luminaires.
The work of Michael et al. [
13] led to potential improvements in visual comfort for schools in Cyprus and other areas in southern Europe with similar characteristics and climatic conditions.
Doulos et al. [
14] applied their research in a public school. They examined a range of lighting technologies (with AC and DC power) first using a stand-alone photosensor per luminaire and then using a sensor per control zone.
In [
15], an optimal lighting control strategy is proposed to minimize light energy consumption by adjusting the brightness of multiple lighting sources separately and applying the PID method to ensure the desired lighting level.
The purpose of this work is to present a useful methodology to address retrofitted design actions in lighting systems. This is applied to a public school located in a little city in southern Italy characterized by the Mediterranean climate. The study starts from dynamic analysis on an hourly and annual basis of the perception of daylight inside the school. The present artificial lighting system is analysed, and several implementation scenarios are proposed and subsequently analysed from both a technical and economic point of view.
2. Materials and Methods
The analysed building is a public school located in a Mediterranean city in southern Italy. The school was chosen as a representative because it has a similar building type and geometric distribution to other schools in the area. First of all, the perception of daylighting inside the school was analysed by considering the geometry of each room and the characteristics of the building materials and windows. This assessment was carried out by dynamic yearly calculation on an hourly basis using Daysim software [
16]. For this purpose, a set of indices to analyse the daylight contribution was calculated. The two main indices calculated were the daylight autonomy (DA) and the continuous daylight autonomy (
conDA) [
17] (defined in
Section 2.2).
Climate data were imported from Energy Plus weather data files [
18].
Regarding the current state of the artificial lighting, it consists of linear fluorescent lamps characterized by different absorbed power for the various rooms. The study of artificial light was carried out by using Dialux Evo software [
19]. First, only the artificial light (withour daylight contribution) was considered in the room to be analysed thus in the worst condition to obtain the power, and the exact number of luminaires needed to meet the regulatory requirements was found [
20].
Then, three different scenarios were proposed, of which both the technical and economic aspects were evaluated.
2.1. Cases Study
The building analysed is the “Vincenzo Lilla” public high school. It is located in Francavilla Fontana (BR), a city in the southeast of Italy which belongs to climate zone C of the Italian climatic classification. It is classified as Csa (hot summer Mediterranean climate) by the international Köppen climate classification [
21,
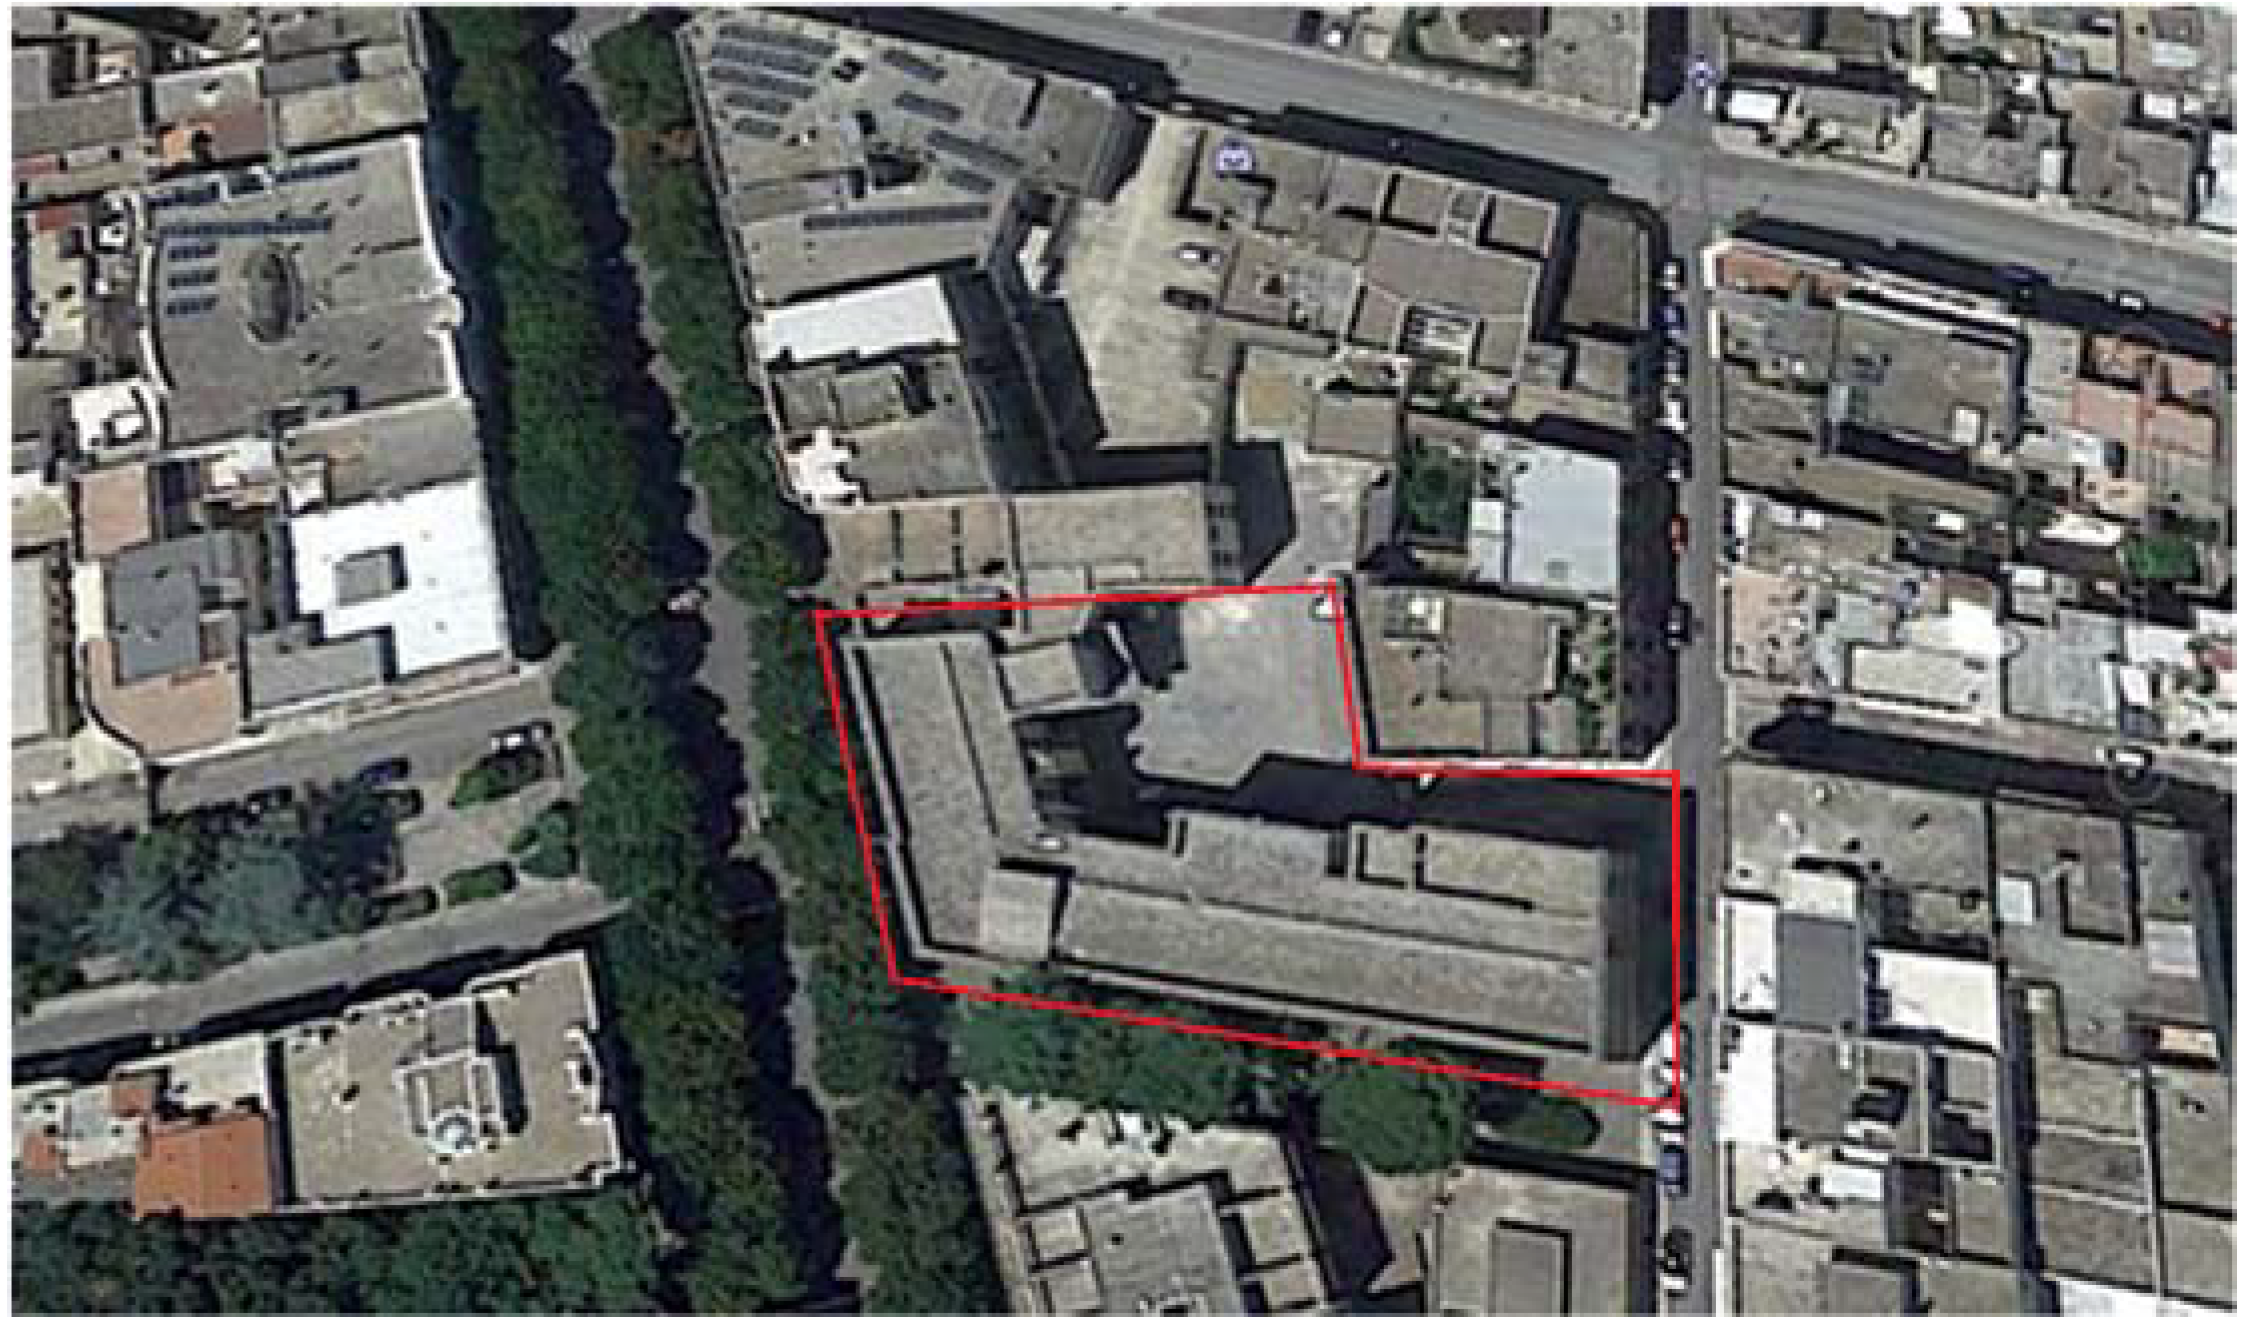
22]. As shown in
Figure 1, the school (highlighted in red) is located in the centre of town. It dates back to the early 1700s but, over time, it has undergone partial renovation and expansion.
The building complex has a plan of an irregular shape with an internal courtyard. It is spread over three levels above ground.
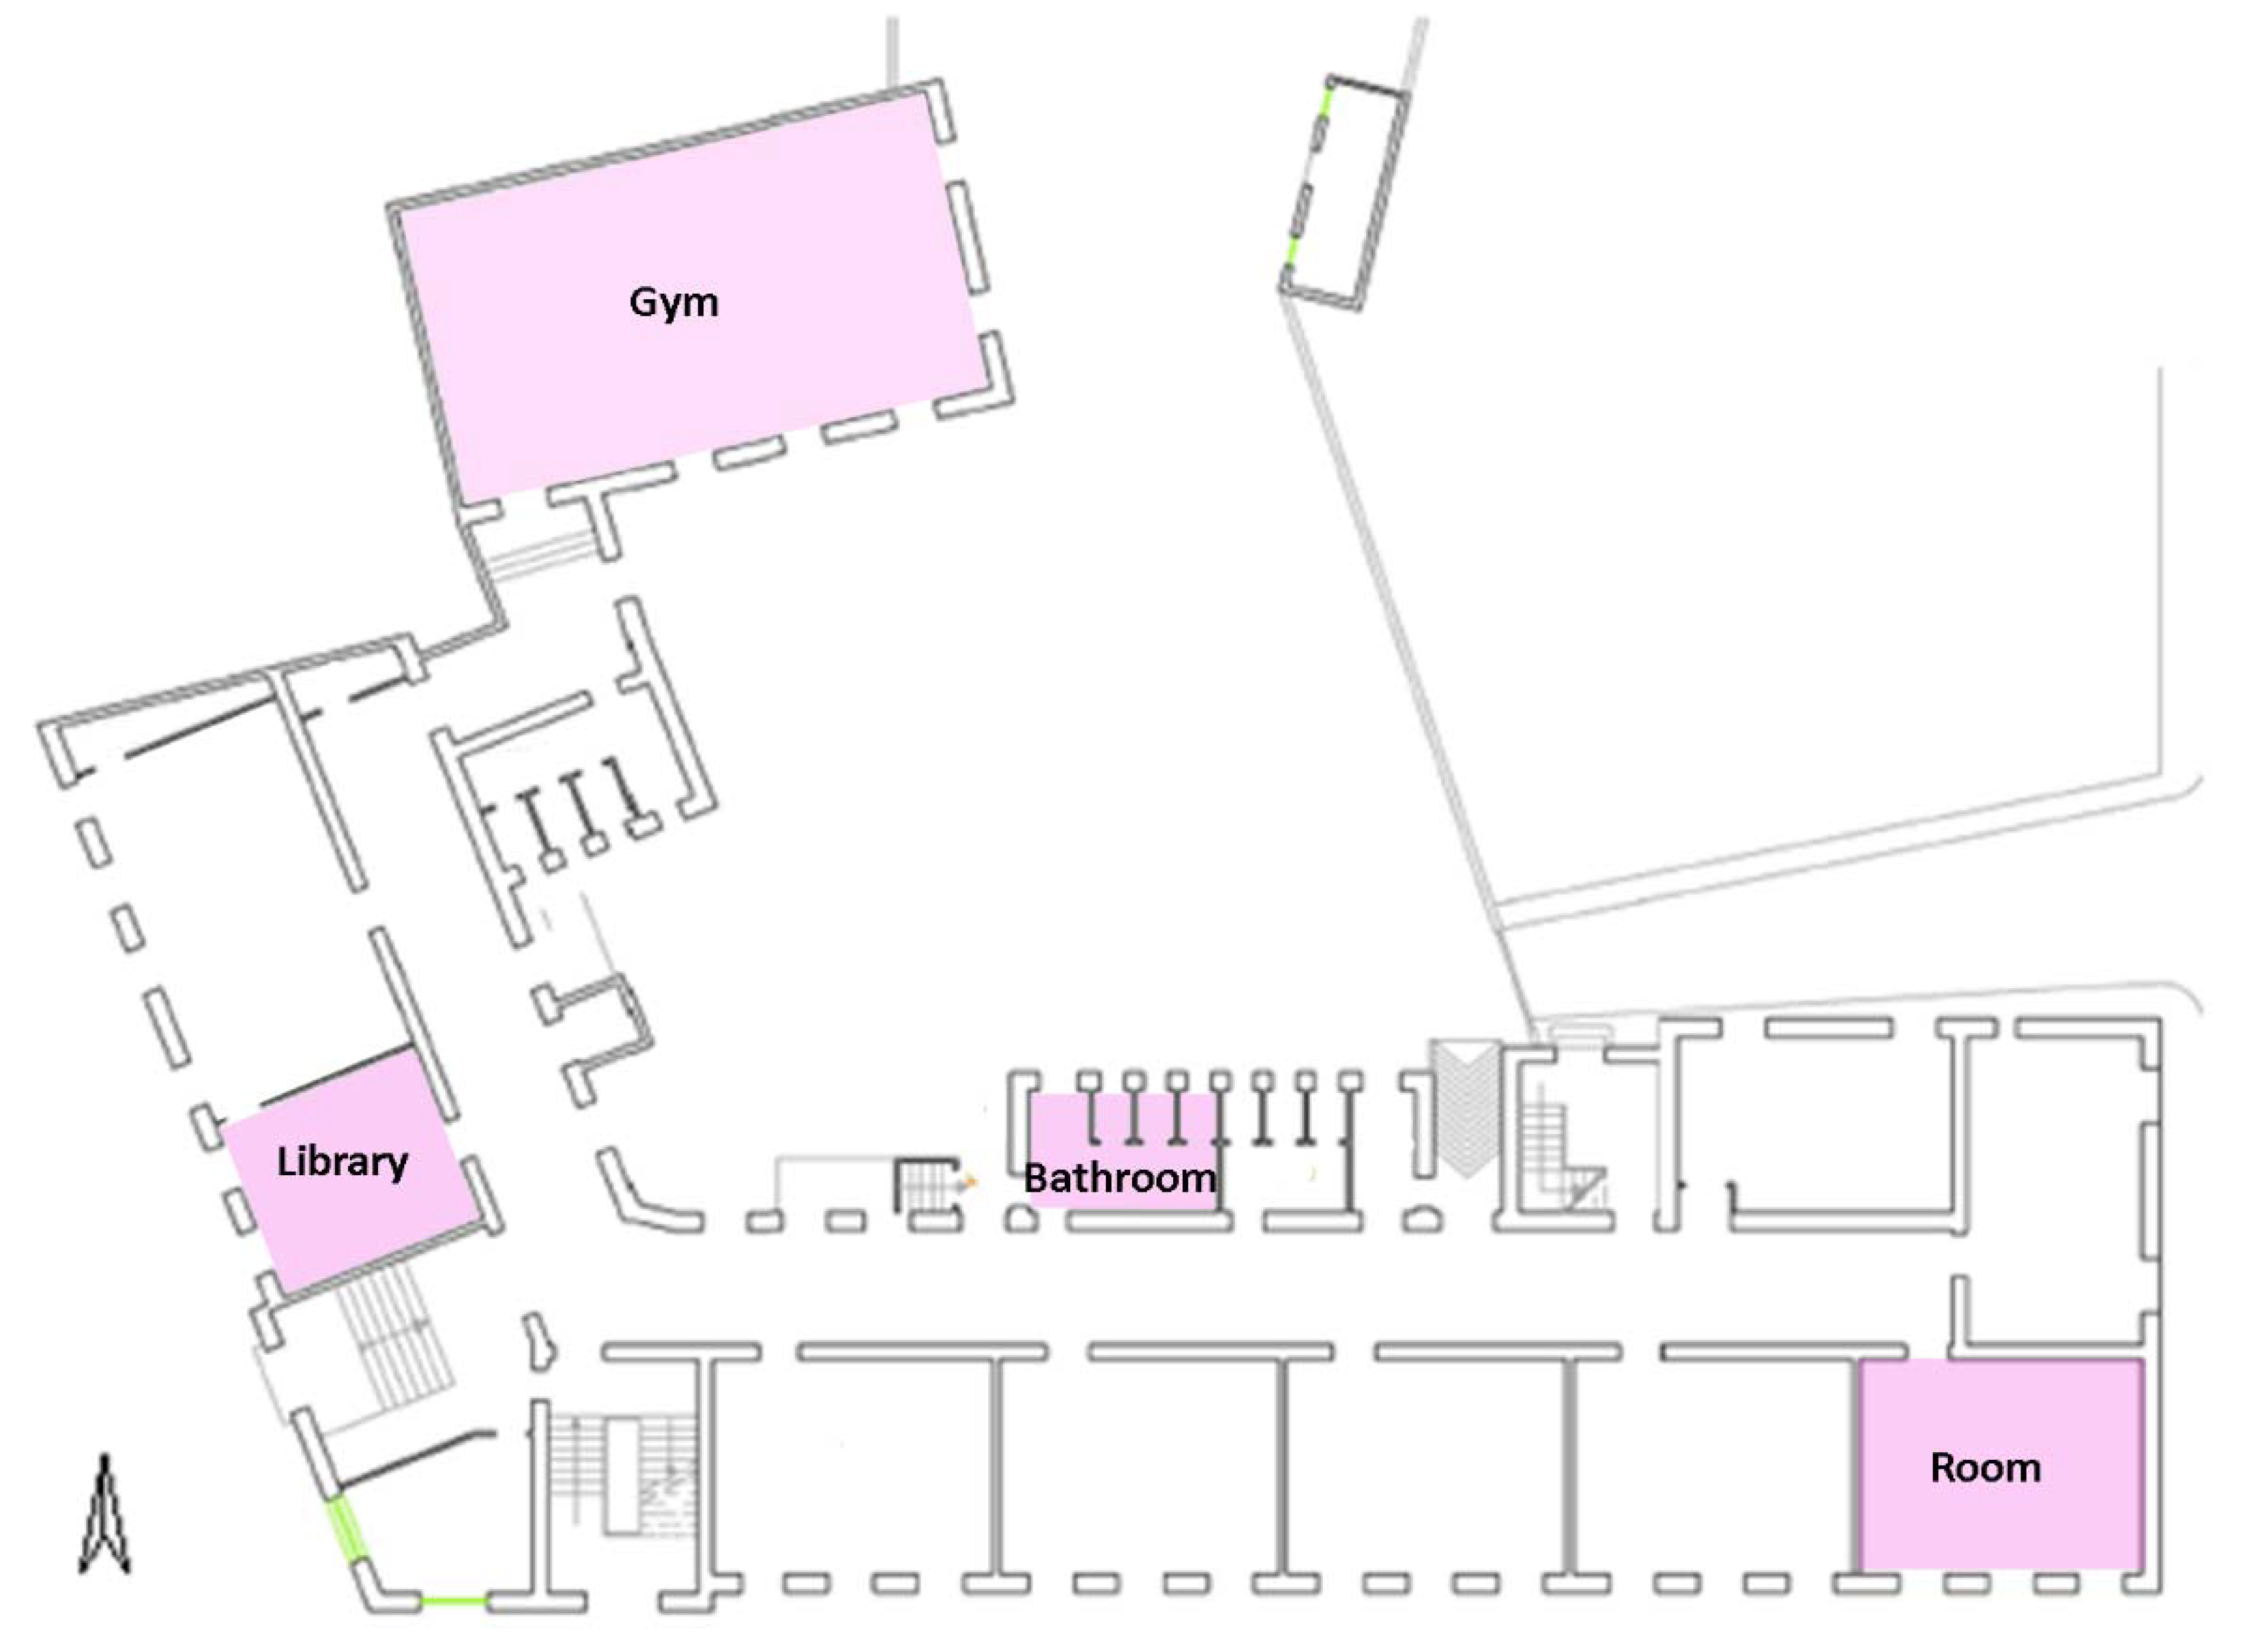
Figure 2 shows the ground floor plan; the other floors are very similar. The building has load-bearing masonry consisting of walls in blocks of tuff, whose thickness is 60 cm, plastered on the inside surface. The coverage is flat and consists of internal plaster, insulated cement brick slab, sloping screed, waterproofing bituminous sheath, and local stone flooring laid with mortar. The rooms highlighted in the plans are those that will be explored in more detail later.
On average, the school is used 9 h per day on weekdays, while school use during vacations is occasional and related solely to the presence of events.
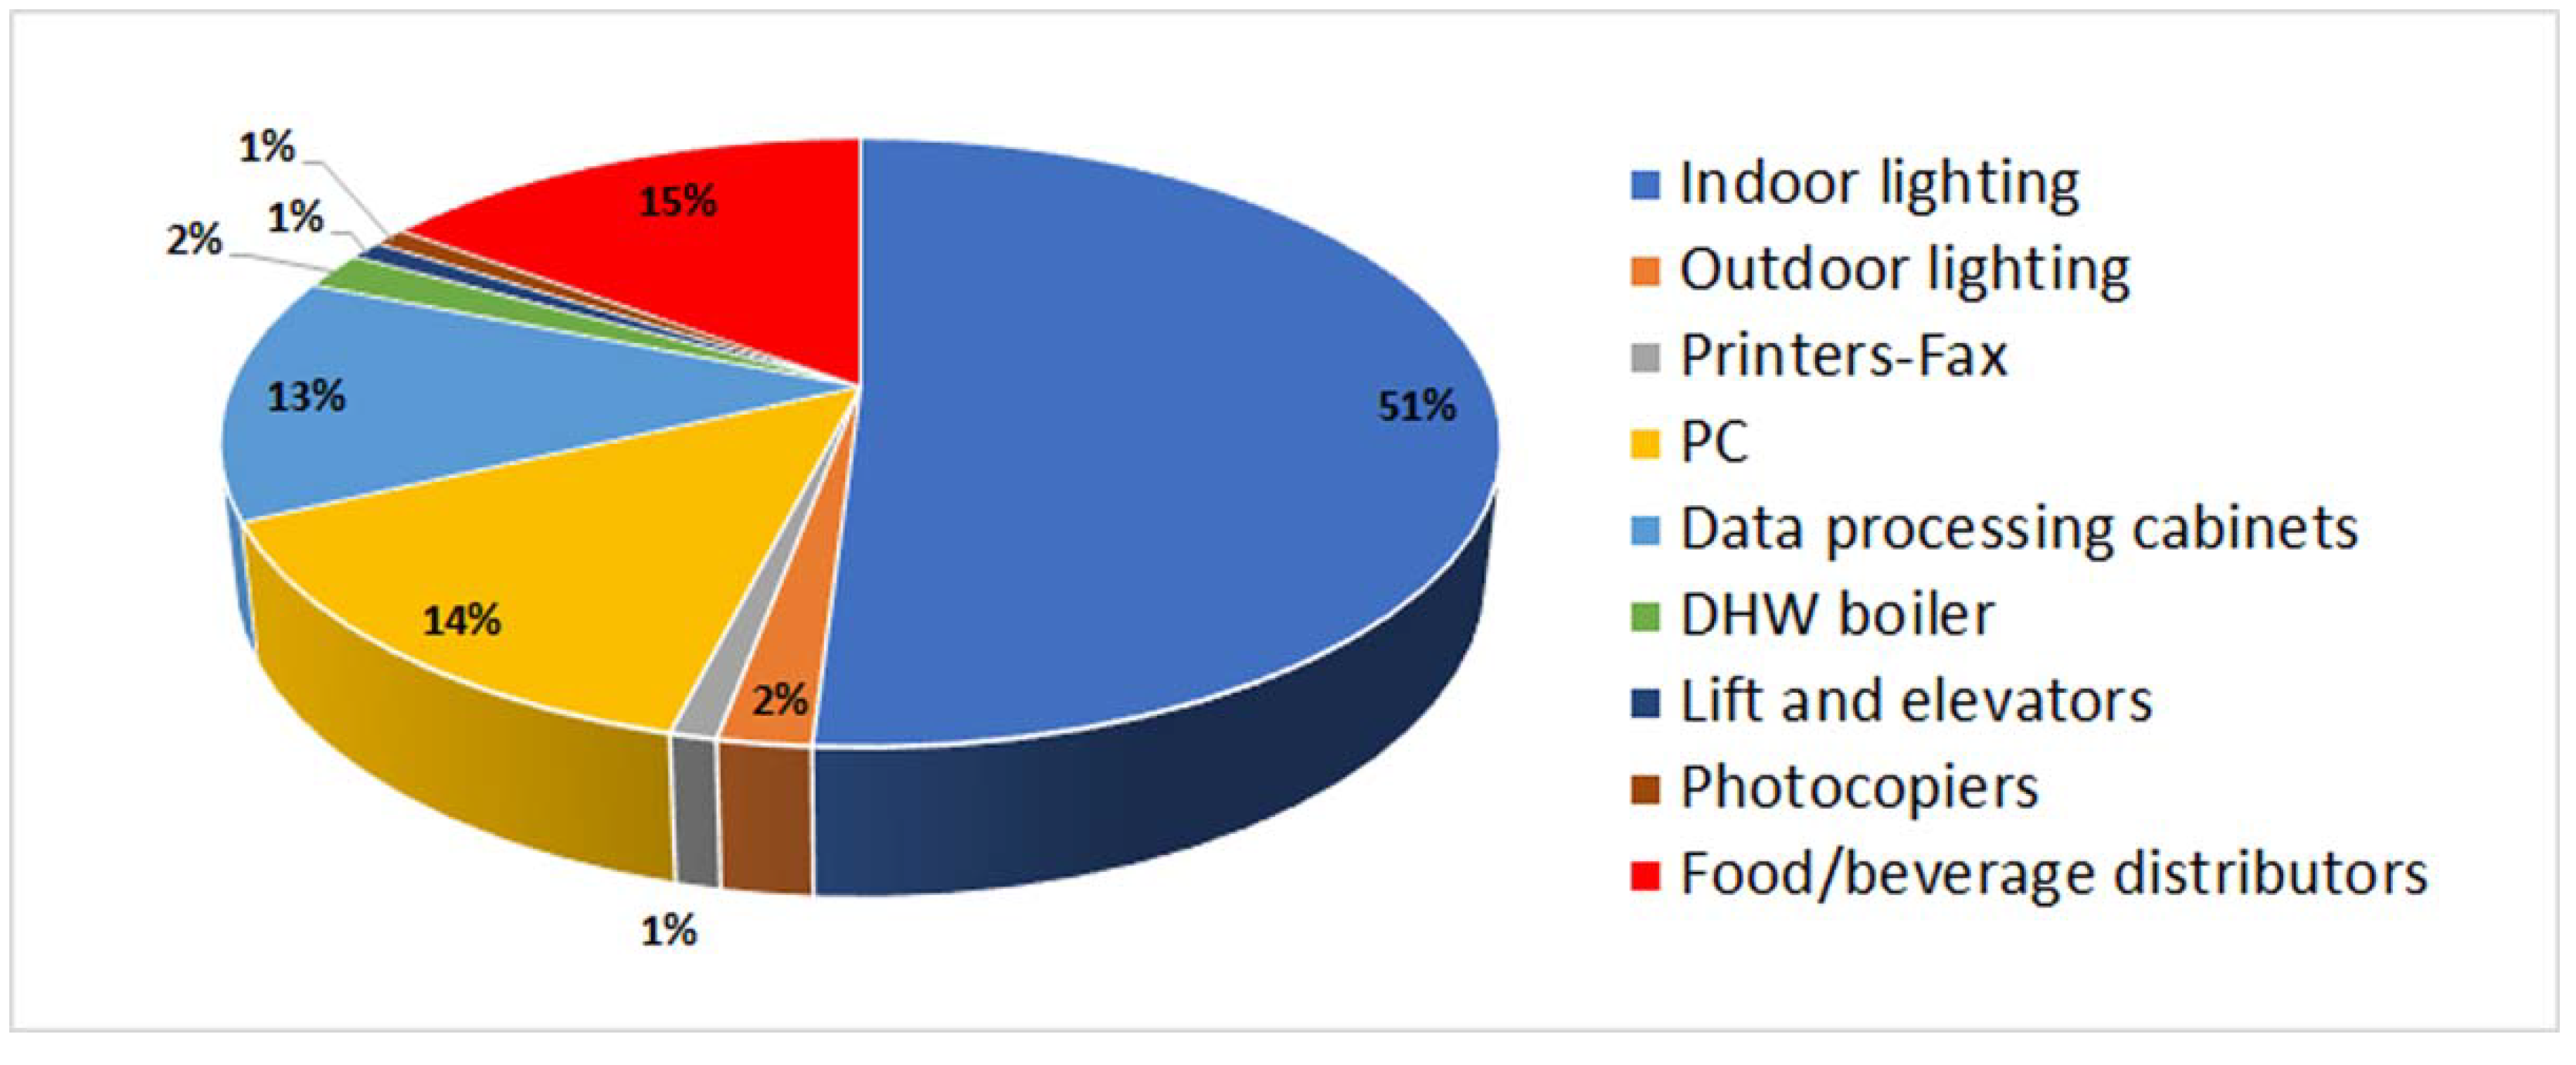
As shown in
Figure 3, the electrical energy consumption of the building is primarily related to the current lighting system. The school is currently equipped with a large number of T8 linear fluorescent lamps of different absorbed power for the various rooms. The presence of numerous fluorescent lamps results in high energy consumption. Technological and computer systems also constitute a considerable electrical load (about 14% of electrical consumption referred to the base load) together with food or beverage dispensers.
2.2. Daylighting Analysis
Analysis of the daylighting within the school was performed using Daysim. As was mentioned earlier, by using Daysim, a set of indices was calculated. Daylight autonomy (DA) is a daylight availability metric that corresponds to the percentage of occupied time when the target illuminance at a point in a space is met by daylight. The continuous daylight autonomy is the fraction of time in an annual simulation that an analysis point meets or exceeds a specified illuminance level, with proportional credit given for daylight contributions that partially meet this level. Energy Plus meteorological data files were imported into Daysim.
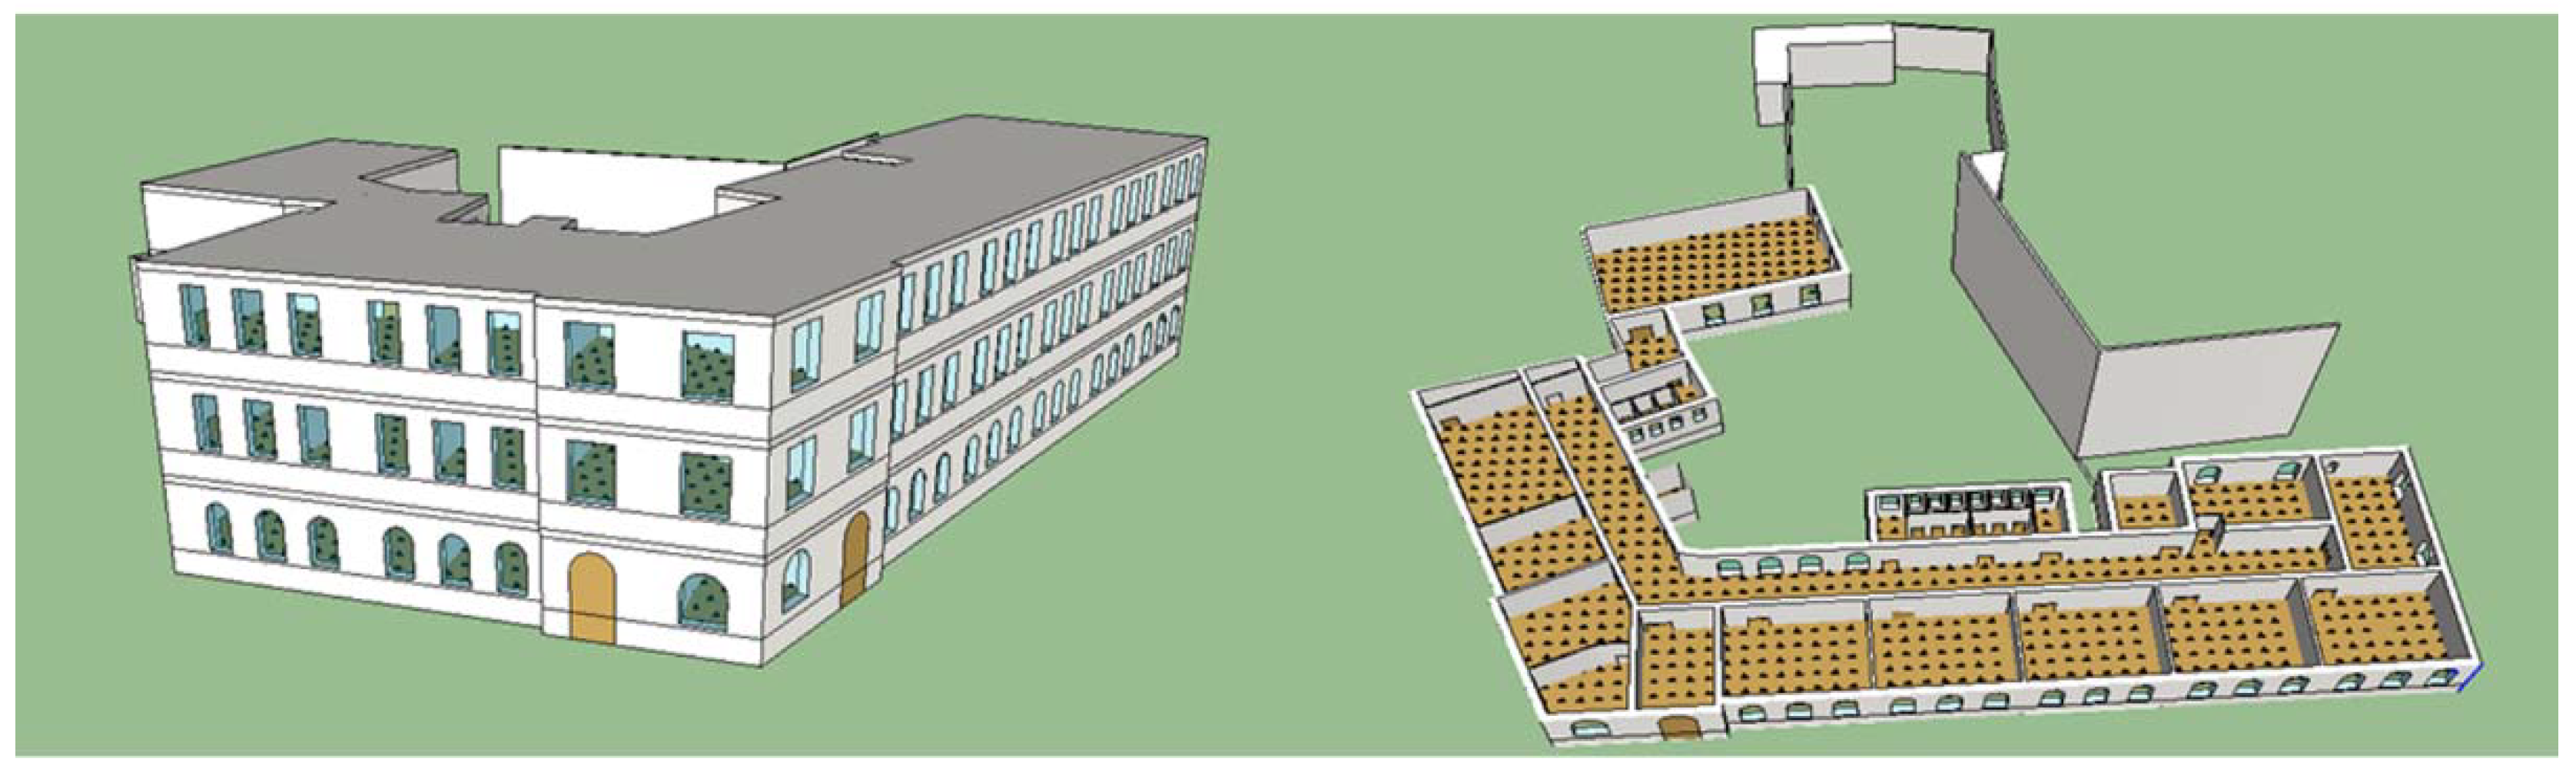
Figure 4 shows the modelling of the entire building carried out in SketchUp. The calculation grid was set with a step of 0.50 m and placed 0.80 m from the floor in order to know the values on the workplane.
Table 1 shows the values set for the simulation concerning the reflection coefficients of the building envelope materials. The reflection coefficient of the glass was set equal to 10%, while the transmittance was set equal to 90%.
The calculation points set in SketchUp were used by the Daysim software to calculate the average DA
av (average of daylight autonomy), DA
min (minimum value of daylight autonomy), and cDA (continuous daylight autonomy) for each room.
Table 2 shows for each room on the ground floor the net area, the number of calculation points set, and the resulting values of DA
av (average of the DA values), DA
min, and cDA.
av (average of the cDA values). The same values for the second and third floors are shown in
Appendix A.1 and
Appendix A.2. The values of DA
av were different for each room, ranging from a minimum of 0% to a maximum of 96.27% and varying for each floor. The DA
av was zero in rooms where there were no windows. Indeed, as it is possible to see, the rooms and the libraries had the highest daylight contributions, while the closets and the bathroom had the lowest daylight contribution. The rooms in bold below will be highlighted as s.
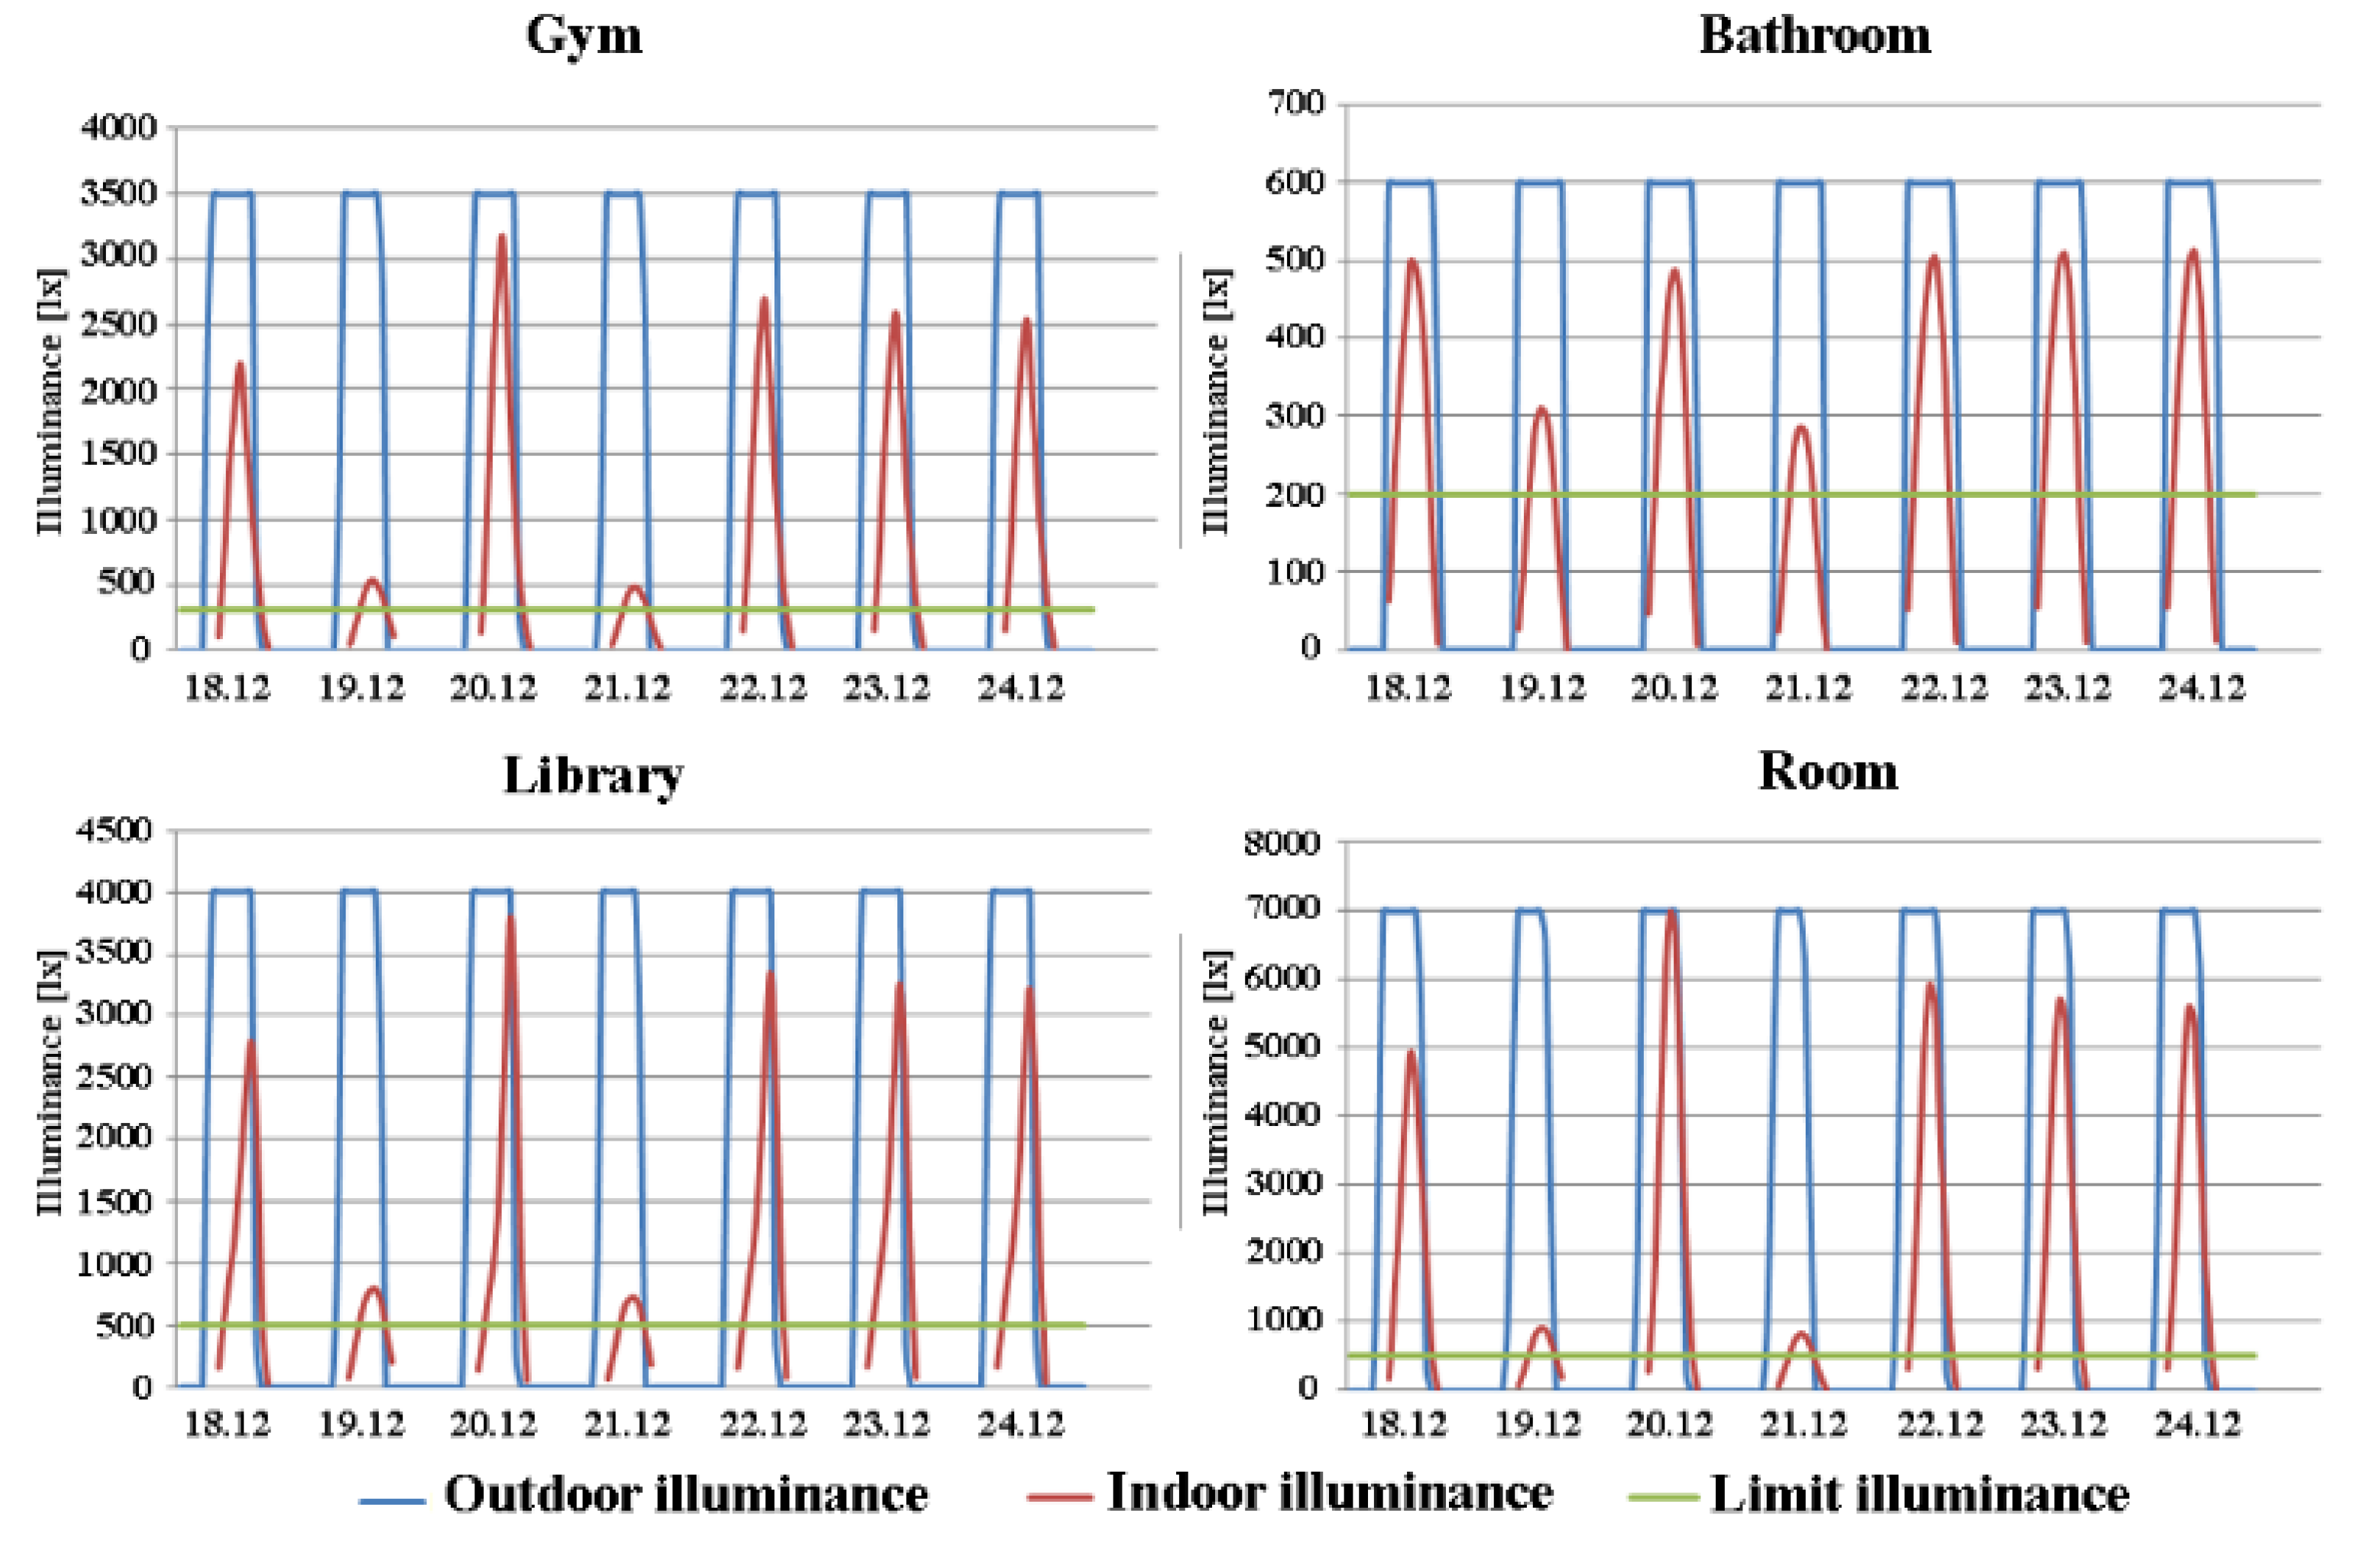
Figure 5 shows the daylighting inside the classrooms (red line), the daylighting outside the school (blue line), and the minimum illuminance value required to ensure comfort (green line) according to UNI EN 12464-1, whose limit values are reported in
Table 3. Since the study reported a large number of data, this section will highlight the improvement strategies for four rooms located on the ground floor which were characterized by different orientations and different intended uses: room 5 (south), library 1 (west), gym (east), bathroom (north).
2.3. Indoor Lighting System
Table 4 shows the number of luminaires present in the pre-intervention phase of the school, distinguished according to type, power, composition, and annual consumption based on hours of use. There were no automatic dimming systems. There were 18 W, 36 W, 58 W, 70 W fluorescent luminaires with 1 or 2 lamp compositions. The characteristics of the luminaires are shown in
Appendix A.3.
Each analysed room was studied using Dialux software, and the number of luminaires for each room to be proposed as an improvement was calculated.
Table 5 shows the number of luminaires and their characteristics proposed for the post-intervention phase. The characteristics of the new luminaires installed are shown in
Appendix A.4.
Table 6 shows for each room on the ground floor the characteristics of the luminaires installed in the pre-intervention and post-intervention phases.
Appendix A.5 and
Appendix A.6 show the values for the first and second floors. There were 10 W, 24 W, and 39 W luminaires. The 24 W lamp was also used in two-piece ceiling lights. All the sources were characterized by a correlated colour temperature of 4000 K. Furthermore, in order to take into account the possible decrease of the luminous flux, a maintenance factor (MF) of 0.8 was set. As well in this table, the rooms in bold below will be highlighted as samples.
Table 7 reports the illuminance values calculated with Dialux, considering the rooms to be completely dark and thus in the worst case. The values were reported only for the selected rooms, considering the pre- and post-intervention phases, with fluorescent luminaires and LEDs, respectively. All illuminance values were verified.
3. Results
This section proposes three post-intervention scenarios applied to artificial lighting systems. Once the replacement of fluorescent luminaires was defined, the following options focused specifically on LED lighting management were proposed:
Case 1—Manual on/off switch-on
Case 2—LED lamp dimming with single modulation
Case 3—LED lamp dimming with modulation for rows of luminaires
The three cases were analysed both from a technical and economic point of view, assessing compliance with the current regulations.
3.1. Case 1—Manual On/Off Switch-On
Once the number and absorbed power of the appliances to be installed in the interior spaces were determined, the manual on/off system was analysed. The devices installed are those proposed in
Table 6 (post-intervention, LED).
Table 8 shows the level of daylighting perceived within the spaces. As an example, the analysis was carried out for the four selected spaces. In this case, the lamps were turned off, and the objective was to evaluate in the three time periods—at 8:00 a.m., 12:00 p.m., and 4:00 p.m.—on 21 December the level of daylighting. Since this scenario included a manual luminaire on/off switch in the system, the lamps were only used when the daylighting did not meet the minimum lighting requirements. As the rooms analysed had different orientations, it was possible to see how the daylighting varied according to their layouts. The verification of illuminance was carried out (negative checks in red) according to the intended use of each room. This table suggests manually turning on the light when there is not enough daylight to positively verify illuminance values.
Table 9 shows the level of illuminance for the four rooms selected in the time periods, considering the contributions of both the lamps (lamps on) and the daylight. All the iluminance values were verified.
At 8:00 a.m., the lamps needed to be turned on in the library and bathroom to meet regulatory limits. When turning on the lights at 8:00 a.m., it can be seen that 888 lx was achieved in the library due to the artificial lighting system, and 296 lx was achieved in the bathroom.
At 12:00 p.m., the daylight was sufficient to achieve useful illuminance on the work surfaces in all rooms. When the artificial light was on, the minimum values of illuminance were exceeded for the simultaneous presence of natural and artificial light.
At 4:00 p.m., the daylight was very weak; therefore, it would be necessary to turn on the lamps in all the rooms. The minimum value of illuminance was not verified in any room; therefore, the presence of the lighting system was necessary. This happened because we analysed the worst day of the year, 21 December, when the sun set very early.
3.2. Case 2—LED Lamp Dimming with Single Modulation
The installation in the rooms of the photosensors or dimmers allowed for modulating the power of the luminaires according to the daylight inside the room itself. This led to a reduction in consumption, as will be seen later in the economic analysis. In this second case, the modulation of the lamps was unique. In the room, there was only one dimmer that captured daylight and varied the power of the luminaires in such a way as to meet the minimum regulatory requirements but not exceed them by too much.
Table 10 shows for the four spaces analysed in the three time periods what could be a dimming solution to check the regulatory requirements. These hypotheses were based on the observations of Case 1. The total switching off of the artificial light is highlighted in pink (which means that the daylighting met the requirements), the dimming with the respective value of dimmer reduction is highlighted in grey, and in green the light was turned on without dimming. All the average illuminances were verified.
At 8 a.m., in the classroom and in the gym, the luminaires were observed to be off because the useful illuminance was given by sunlight. In the library, the luminaires were observed to have their power reduced by 55%, corresponding to 17.55 W of power being absorbed. In the bathroom, absorbed power of 13.2 W was observed, reducing the initial power of 24 W by 45%.
At 12:00 p.m. in all rooms, the luminaires would assume zero power (i.e., the photosensor did not allow the lamps to turn on).
At 4:00 p.m., one can see that power reduction occurred in the library, gym, and bathroom. In the classroom, on the other hand, the luminaires would operate at 39 W of power because it was necessary to achieve minimum lighting.
3.3. Case 3—LED Lamp Dimming with Modulation for Rows of Luminaires
The design of the modular rows of luminaires implied that the luminaires would not all reduce their power by the same amount, but rather that they would do so gradually. For each row of luminaires, a dimmer was inserted that would gradually reduce the power, considering the LEDs closest to the window.
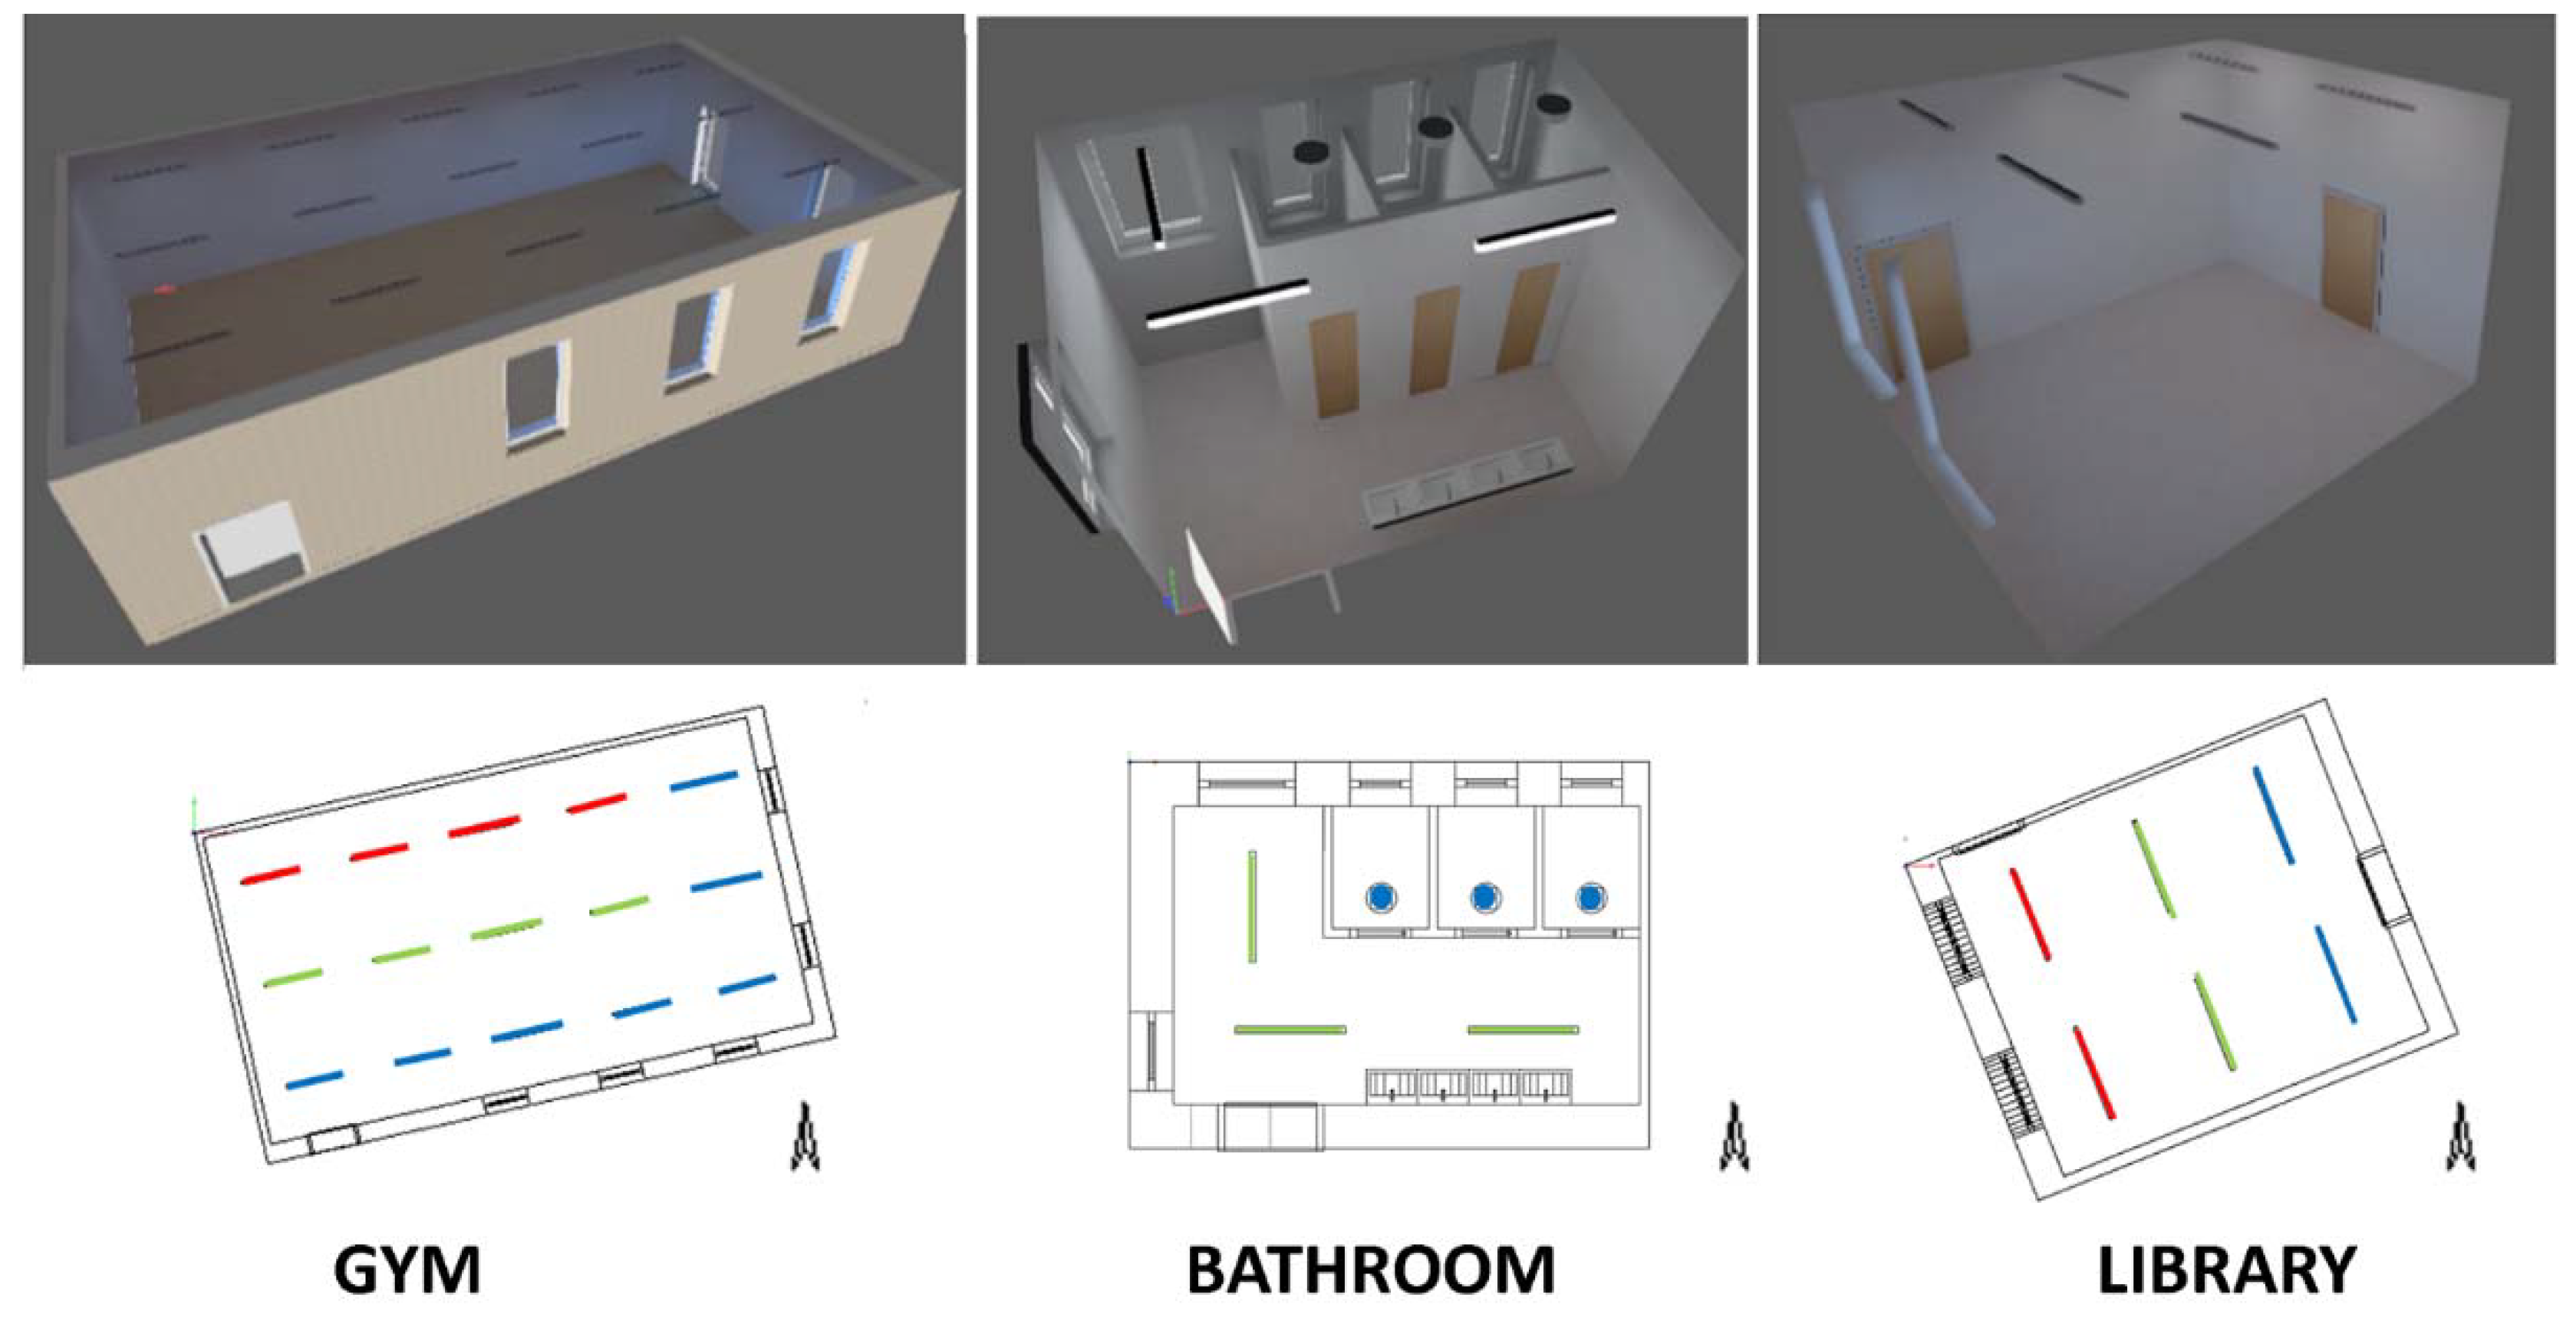
As shown in
Figure 6, the luminaires inside the rooms were divided into control groups of luminaires with different colours: blue (group 1), green (group 2), and red (group 3). It was considered from the observations of case 1 and case 2 that group modulation was not necessary for the classroom.
Table 11 shows the results obtained for the four rooms by dividing the luminaires into different groups. As in
Table 10, the total time off, dimming, and total time on have been highlighted with different colours.
At 8:00 a.m., in the classroom and gym, the lighting system was turned off, so again the power was equal to zero. In the other two rooms, however, three groups of luminaires were considered as well as two in the bathroom. In the library, the groups were reduced by 95%, 45%, and 28%, respectively, and those in the bathroom were reduced by 88% and 56%.
At 12:00 p.m., in all rooms, the power absorbed was zero; therefore, the photosensors did not allow the lamps to be turned on.
At 4:00 p.m., it was shown that in the library, gym, and men’s bathroom, control of the luminous flux took place. In the classroom, all luminaires operated at full power. Specifically, the installation of the photosensors could reduce the lamp output by 72% and 60% in the rows farthest from the window, while the first row would be completely turned off. In the gym, a reduction of 80%, 50%, and 35% could be achieved, in contrast to the bathroom, where a reduction of 90% and 45% could be achieved.
3.4. Economic Analysis
In this section, the three scenarios are investigated from an economic point of view to show the technical and economic feasibility of each intervention.
Table 12 shows the unit costs for the replacement of the LEDs and the installation of the dimmer. These costs were applied to each replacement and installation intervention. They were based on local market research.
Table 13 highlights the total consumption, intervention costs, energy savings, and payback time for each intervention applied to the entire school.
According to UNI EN 15193-1:2017 [
23], it is possible to assess the electricity consumption attributable to artificial lighting in the presence of control systems through the Lighting Energy Numeric Indicator (
LENI), which is calculated as follows:
where
E is the energy consumed on an annual basis by the plant (kWh/year) and
A is the useful surface of the considered area (m
2).
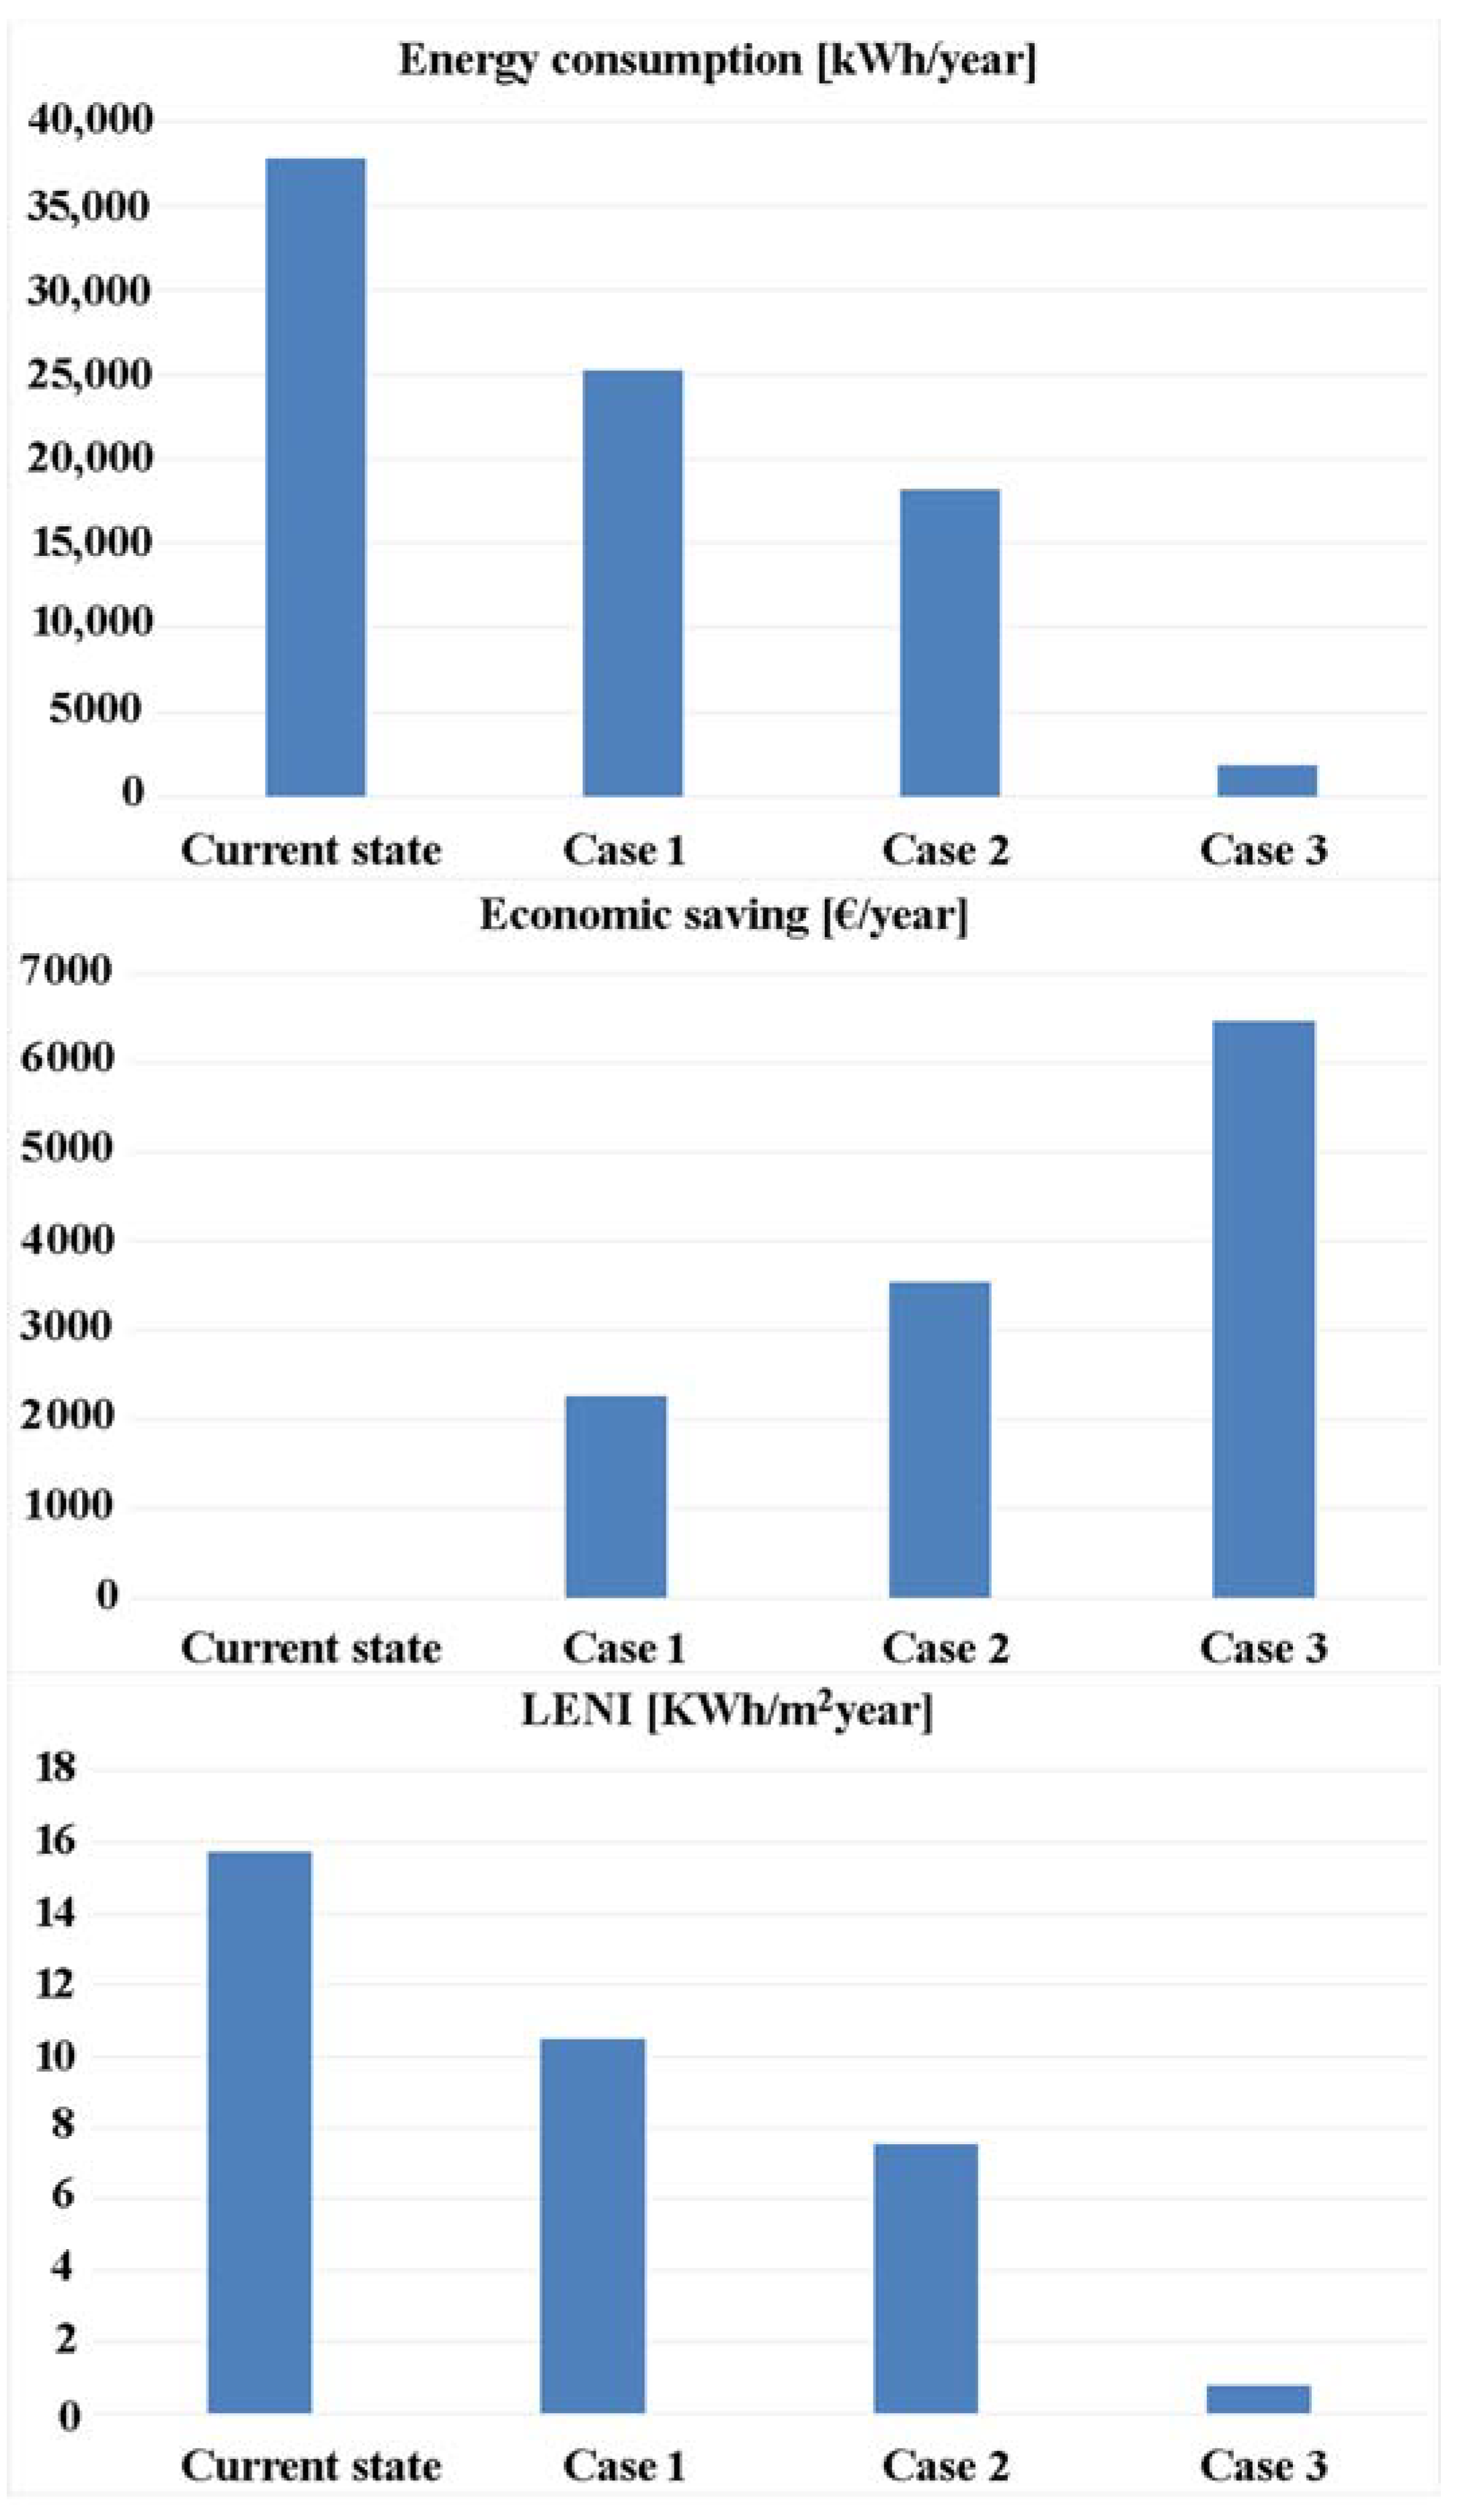
Figure 7 shows the results in reduced energy consumption, increased economic savings, and reduced LENI for all three cases.
4. Conclusions
Lighting is an important aspect in spaces where the optimal performance of visual activities must be guaranteed.
This study has taken a school as a case study. Schools are composed of numerous spaces which require different qualities of light inside them. The chosen school is located in a small town in the southeast of Italy and is characterized by a Mediterranean climate. The school can be considered representative of the area for geometry and construction techniques. Initially, it was noted that most of the electrical consumption of this school was due to the lighting system, consisting of fluorescent luminaires with manual on and off switching. This study proposed a methodology to enhance retrofitting strategies to compensate for daylight and therefore not overestimate the light inside the rooms. Several scenarios have been proposed. First, the existing lamp system was replaced with a system of LED luminaires designed for each room of the school. Once the replacement of fluorescent luminaires was defined, the following options, focused specifically on LED lighting management, were proposed:
Case 1—Manual on/off switch-on
Case 2—LED lamp dimming with single modulation
Case 3—LED lamp dimming with modulation for rows of luminaires
The three cases were analysed both from technical and economic points of view, assessing compliance with the current regulations.
The data useful to determine the values of daylight and artificial lighting were obtained through the use of software, starting with Google SketchUp for the school modelling and calculation grid positioning. Daysim was used to derive the values of illuminance due to daylight for each room, and Dialux Evo was used to design the artificial lighting.
By analysing the data obtained, it was observed that with the simple replacement of fluorescent luminaires with LED luminaires, there was a high level of energy saving. The results showed a reduction in energy consumption compared with the current state of 33% (case 1), 52% (case 2), and 95% (case 3), respectively.
Overall, case 3 (Lamp dimming with modulation for rows of luminaires) resulted in reduced energy consumption, increased economic savings, and a reduced LENI. It has to be emphasized that LED technology has some disadvantages. One of them is related to their delicate power electronics. For this reason, the LED lamps having high sensitivity to forward current is a double-edged sword. It gives lighting systems superior controllability but also makes drive current regulation enormously challenging. Another problem is the dissipation of heat. If the device junction temperature is not maintained below a set limit, this may accelerate the kinetics of failure mechanisms and generate degradation of the components of the fixtures. These disadvantages can cause failure problems and, consequently, an increase in costs. The latter was not considered in the economic analysis presented in this paper. Moreover, it must be emphasized that the reactive power was not considered in the final cost of electricity for simplicity. This is because this is relevant mainly in the case of outdoor lighting systems. If the contribution of the light load to monthly consumption is not so high, then an increase in the absorption of reactive power is not able to significantly change the average monthly power factor, for which the penalties are calculated for the users of the electricity system.
Based on the results obtained from this work, it is clear that designing a structure that favours the entry of daylight into the rooms as much as possible brings considerable energy and economic savings. Future studies could take interest in the building envelope to further reduce the economic consumption regarding summer and winter air conditioning.
Author Contributions
Conceptualization, C.B., M.B. (Marina Bonomolo), P.M.C., and M.B. (Marco Beccali); methodology, C.B., M.B. (Marina Bonomolo), P.M.C., and M.B. (Marco Beccal); software, C.B., M.B. (Marina Bonomolo), and S.A.; formal analysis, C.B., M.B. (Marina Bonomolo), and S.A.; investigation, C.B., and M.B. (Marina Bonomolo); data curation, C.B., and M.B. (Marina Bonomolo); writing—original draft preparation, C.B., and M.B. (Marina Bonomolo); writing—review and editing, C.B., and M.B. (Marina Bonomolo); visualization, C.B., M.B. (Marina Bonomolo), P.M.C., and M.B. (Marco Beccali); supervision, C.B., M.B. (Marina Bonomolo), P.M.C., and M.B. (Marco Beccal). All authors have read and agreed to the published version of the manuscript.
Funding
This research received no external funding.
Institutional Review Board Statement
Not applicable.
Informed Consent Statement
Not applicable.
Conflicts of Interest
The authors declare no conflict of interest.
Appendix A
Appendix A.1. Daylighting on the First Floor
| Spaces | Area (m2) | N° Calculation Points | DAav (%) | DAmin (%) | cDA.av (%) |
| Library | 47.4 | 48 | 92.08 | 79 | 96.29 |
| Informatic Lab. | 46.8 | 42 | 93.17 | 89 | 96.81 |
| Room 1 | 46.8 | 42 | 93.36 | 88 | 96.86 |
| Room 2 | 46.8 | 42 | 93.31 | 89 | 96.79 |
| Room 3 | 47.4 | 48 | 92.4 | 81 | 96.36 |
| Room 4 | 43.86 | 45 | 81.44 | 40 | 91.76 |
| Room 5 | 36.45 | 38 | 82.41 | 45 | 91.66 |
| Women’s Bathroom | 18.02 | 20 | 70.4 | 30 | 86.2 |
| Men’s Bathroom | 18.02 | 24 | 67.5 | 28 | 86.42 |
| Professor’s Room | 53.63 | 58 | 93.02 | 80 | 96.72 |
| Presidency | 31.2 | 32 | 86.16 | 0 | 92.28 |
| Registry | 34.8 | 34 | 87.32 | 79 | 94.26 |
| Archive | 27.16 | 27 | 88.37 | 81 | 94.78 |
| Closet 1 | 3.32 | 4 | 0 | 0 | 8 |
| Closet 2 | 4.42 | 5 | 54.2 | 36 | 78.4 |
| Bathroom 3 | 14.28 | 15 | 50.47 | 0 | 69.27 |
| Access | 23.26 | 22 | 93.91 | 87 | 97.36 |
| Great Hall | 128.61 | 133 | 84.72 | 0 | 92.17 |
| Hallway | 182.53 | 215 | 44.94 | 0 | 65.05 |
Appendix A.2. Daylighting on the Second Floor
| Spaces | Area (m2) | N° Calculation Points | DAav (%) | DAmin (%) | cDA.av (%) |
| Language Lab. | 47.4 | 48 | 92.35 | 80 | 96.4 |
| Room 1 | 46.8 | 42 | 93.31 | 89 | 96.9 |
| Room 2 | 46.8 | 42 | 93.55 | 89 | 97 |
| Room 3 | 46.8 | 42 | 93.55 | 89 | 96.93 |
| Room 4 | 47.4 | 48 | 92.58 | 81 | 96.49 |
| Room 5 | 43.86 | 45 | 82.89 | 48 | 92.53 |
| Room 6 | 36.45 | 38 | 79.74 | 29 | 91.51 |
| Women’s Bathroom | 18.02 | 20 | 69 | 26 | 85.85 |
| Men’s Bathroom | 18.02 | 24 | 68.25 | 23 | 87.08 |
| Scientific Lab. 1 | 53.63 | 58 | 93.47 | 83 | 97.02 |
| Scientific Lab. 2 | 31.2 | 32 | 86.59 | 0 | 92.47 |
| Chemical Lab. | 63.76 | 62 | 90.53 | 84 | 95.69 |
| Closet | 3.32 | 5 | 0 | 0 | 0 |
| Room 7 | 21.44 | 21 | 82.76 | 0 | 90.67 |
| Bathroom 3 | 8.07 | 7 | 34.57 | 0 | 39.14 |
| Access | 38.23 | 40 | 27.16 | 0 | 34.63 |
| Repair Shop 1 | 30.55 | 32 | 88.91 | 0 | 93.56 |
| Repair Shop 2 | 32.76 | 33 | 91.36 | 86 | 96.52 |
| Multiporpose Room | 41.49 | 45 | 86.91 | 0 | 92.09 |
| Hallway | 182.53 | 214 | 43.66 | 0 | 60.69 |
Appendix A.3. Pre-Intervention Fluorescent Luminaires
![Applsci 11 06664 i001]() | 1 × Linear fluorescent T8 (26 mm) |
| Nominal power | 18 W | Shape and size |
| Flow | 1350 lm | Lenght | 618 mm |
| Light emission | 58 lm/W | Width | 51 mm |
| Total flow | 1099 lm | Height | 88 mm |
| Total power | 19 W | Degree of protection | IP: 20 |
![Applsci 11 06664 i002]() | 2 × Linear fluorescent T8 (26 mm) |
| Nominal power | 36 w | Shape and size |
| Flow | 3350 lm | lenght | 1250 mm |
| Light emission | 51 lm/W | width | 202 mm |
| Total flow | 1842 lm | height | 85 mm |
| Total power | 36 W | Degree of protection | IP: 20 |
![Applsci 11 06664 i003]() | 2 × Linear fluorescent T8 (26 mm) |
| Nominal power | 58 W | Shape and size |
| Flow | 5200 lm | Lenght | 1550 mm |
| Light emission | 62 lm/W | Width | 202 mm |
| Total flow | 6803 lm | Height | 85 mm |
| Total power | 110 W | Degree of protection | IP: 20 |
Appendix A.4. Post-Intervention, LED Luminaires
![Applsci 11 06664 i004]() | LED |
| Nominal power | 10 W | Shape and size |
| Flow | 75 lm | Diameter | 97 mm |
| Light emission | 4 lm/W | Height | 90 mm |
| Total flow | 41 lm | | |
| Total power | 10 W | Degree of protection | IP: 20 |
![Applsci 11 06664 i005]() | LED |
| Nominal power | 24 W | Shape and size |
| Total flow | 2230 lm | Lenght | 1250 mm |
| Light emission | 93 lm/W | Width | 80 mm |
| Total power | 24 lm | Height | 90 mm |
| | | Degree of protection | IP: 65 |
![Applsci 11 06664 i006]() | LED |
| Nominal power | 24 W | Shape and size |
| Total flow | 163 lm | Diameter | 350 mm |
| Light emission | 7 lm/W | Height | 102 mm |
| Total power | 24 lm | | |
| | | Degree of protection | IP: 65 |
![Applsci 11 06664 i007]() | LED |
| Nominal power | 39 W | Shape and size |
| Total flow | 3861 lm | Lenght | 1500 mm |
| Light emission | 99 lm/W | Width | 60 mm |
| Total power | 39 lm | Height | 55 mm |
| | | Degree of protection | IP: 20 |
Appendix A.5. First Floor, Pre-Intervention and Post-Intervention Lamp Configurations
| | | | Pre-Intervention. Fluorescent Luminaires | Post-Intervention. LED |
| Spaces | Area (m2) | N° Calculation Points | DAmedio (%) | DAmin (%) | cDA.medio (%) | N° Luminaires | Composition of Luminaires | Operating Hours (h) | Power (W) | N° Luminaires | Composition of Luminaires | Operating Hours (h) | Power (W) |
| Library | 47.4 | 48 | 92.08 | 79 | 96.29 | 8 | 2 | 9 | 58 | 8 | 2 | 9 | 39 |
| Informatic Lab. | 46.8 | 42 | 93.17 | 89 | 96.81 | 8 | 2 | 9 | 58 | 8 | 2 | 9 | 39 |
| Room 1 | 46.8 | 42 | 93.36 | 88 | 96.86 | 8 | 2 | 9 | 58 | 8 | 2 | 9 | 39 |
| Room 2 | 46.8 | 42 | 93.31 | 89 | 96.79 | 8 | 2 | 9 | 58 | 8 | 2 | 9 | 39 |
| Room 3 | 47.4 | 48 | 92.4 | 81 | 96.36 | 8 | 2 | 9 | 58 | 8 | 2 | 9 | 39 |
| Room 4 | 43.8 | 45 | 81.44 | 40 | 91.76 | 8 | 2 | 9 | 58 | 8 | 2 | 9 | 39 |
| Room 5 | 36.4 | 38 | 82.41 | 45 | 91.66 | 8 | 2 | 9 | 58 | 8 | 2 | 9 | 39 |
| Women’s Bathroom | 18 | 20 | 70.4 | 30 | 86.2 | 6 | 1 | 9 | 36 | 6 | 1 | 9 | 24 |
| Men’s Bathroom | 18 | 24 | 67.5 | 28 | 86.42 | 6 | 1 | 9 | 36 | 6 | 1 | 9 | 24 |
| Professor’s Room | 53.6 | 58 | 93.02 | 80 | 96.72 | 10 | 2 | 9 | 58 | 8 | 2 | 9 | 39 |
| Presidency | 31.2 | 32 | 86.16 | 0 | 92.28 | 6 | 2 | 9 | 58 | 8 | 2 | 9 | 39 |
| Registry | 34.8 | 34 | 87.32 | 79 | 94.26 | 6 | 2 | 9 | 58 | 6 | 2 | 9 | 39 |
| Archive | 27.2 | 27 | 88.37 | 81 | 94.78 | 4 | 2 | 9 | 36 | 4 | 2 | 9 | 24 |
| Closet 1 | 3.32 | 4 | 0 | 0 | 8 | 1 | 1 | 9 | 18 | 1 | 1 | 9 | 10 |
| Closet 2 | 4.42 | 5 | 54.2 | 36 | 78.4 | 1 | 1 | 9 | 18 | 1 | 1 | 9 | 10 |
| Bathroom 3 | 14.3 | 15 | 50.47 | 0 | 69.27 | 3 | 1 | 9 | 36 | 4 | 1 | 9 | 24 |
| Access | 23.3 | 22 | 93.91 | 87 | 97.36 | 2 | 1 | 9 | 36 | 2 | 1 | 9 | 24 |
| Great Hall | 128.6 | 133 | 84.72 | 0 | 92.17 | 16 | 2 | 9 | 36 | 16 | 2 | 9 | 39 |
| Hallway | 182.5 | 215 | 44.94 | 0 | 65.05 | 26 | 2 | 9 | 36 | 26 | 2 | 9 | 24 |
Appendix A.6. Second Floor, Pre-Intervention and Post-Intervention Lamp Configurations
| | | | Pre-Intervention. Fluorescent Luminaires | Post-Intervention. LED |
| Spaces | Area (m2) | N° Calculation Points | DAmedio (%) | DAmin (%) | cDA.medio (%) | N° Luminaires | Compos. of Luminaires | Operating Hours (h) | Power (W) | N° Lumin. | Composit. of Luminaires | Operating Hours (h) | Power (W) |
| Language Lab. | 47.4 | 48 | 92.35 | 80 | 96.4 | 8 | 2 | 9 | 58 | 8 | 2 | 9 | 39 |
| Room 1 | 46.8 | 42 | 93.31 | 89 | 96.9 | 8 | 2 | 9 | 58 | 8 | 2 | 9 | 39 |
| Room 2 | 46.8 | 42 | 93.55 | 89 | 97 | 8 | 2 | 9 | 58 | 8 | 2 | 9 | 39 |
| Room 3 | 46.8 | 42 | 93.55 | 89 | 96.93 | 8 | 2 | 9 | 58 | 8 | 2 | 9 | 39 |
| Room 4 | 47.4 | 48 | 92.58 | 81 | 96.49 | 8 | 2 | 9 | 58 | 8 | 2 | 9 | 39 |
| Room 5 | 43.86 | 45 | 82.89 | 48 | 92.53 | 8 | 2 | 9 | 58 | 8 | 2 | 9 | 39 |
| Room 6 | 36.45 | 38 | 79.74 | 29 | 91.51 | 8 | 2 | 9 | 58 | 8 | 2 | 9 | 39 |
| Women’s Bathroom | 18.02 | 20 | 69 | 26 | 85.85 | 6 | 1 | 9 | 36 | 6 | 1 | 9 | 24 |
| Men’s Bathroom | 18.02 | 24 | 68.25 | 23 | 87.08 | 6 | 1 | 9 | 36 | 6 | 1 | 9 | 24 |
| Scientific Lab. 1 | 53.63 | 58 | 93.47 | 83 | 97.02 | 6 | 2 | 9 | 58 | 6 | 2 | 9 | 39 |
| Scientific Lab. 2 | 31.2 | 32 | 86.59 | 0 | 92.47 | 8 | 2 | 9 | 58 | 8 | 2 | 9 | 39 |
| Chemical Lab. | 63.76 | 62 | 90.53 | 84 | 95.69 | 12 | 2 | 9 | 58 | 12 | 2 | 9 | 39 |
| Closet | 3.32 | 5 | 0 | 0 | 0 | 1 | 1 | 9 | 18 | 1 | 1 | 9 | 10 |
| Room 7 | 21.44 | 21 | 82.76 | 0 | 90.67 | 8 | 2 | 9 | 58 | 8 | 2 | 9 | 39 |
| Bathroom 3 | 8.07 | 7 | 34.57 | 0 | 39.14 | 3 | 1 | 9 | 36 | 3 | 1 | 9 | 24 |
| Access | 38.23 | 40 | 27.16 | 0 | 34.63 | 4 | 1 | 9 | 36 | 4 | 1 | 9 | 24 |
| Repair Shop 1 | 30.55 | 32 | 88.91 | 0 | 93.56 | 4 | 2 | 9 | 36 | 4 | 2 | 9 | 24 |
| Repair Shop 2 | 32.76 | 33 | 91.36 | 86 | 96.52 | 4 | 2 | 9 | 36 | 4 | 2 | 9 | 24 |
| Multiporpose Room | 41.49 | 45 | 86.91 | 0 | 92.09 | 8 | 2 | 9 | 58 | 8 | 2 | 9 | 39 |
| Hallway | 182.53 | 214 | 43.66 | 0 | 60.69 | 26 | 2 | 9 | 36 | 26 | 2 | 9 | 24 |
References
- Al-Saadi, S.N.; Shaaban, A.K. Zero energy building (ZEB) in a cooling dominated climate of Oman: Design and energy performance analysis. Renew. Sustain. Energy Rev. 2019, 112, 299–316. [Google Scholar] [CrossRef]
- Leccese, F.; Salvadori, G.; Rocca, M.; Buratti, C.; Belloni, E. A method to assess lighting quality in educational rooms using analytic hierarchy process. Build. Environ. 2019, 168, 106501. [Google Scholar] [CrossRef]
- Kim, A.A.; Wang, S.; McCunn, L.J. Building value proposition for interactive lighting systems in the workplace: Combining energy and occupant perspectives. J. Build. Eng. 2019, 4, 100752. [Google Scholar] [CrossRef]
- Beccali, M.; Bonomolo, M.; Galatioto, A.; Pulvirenti, E. Smart lighting in a historic context: A case study. Manag. Environ. Qual. Int. J. 2017. [CrossRef]
- Malvoni, M.; Baglivo, C.; Congedo, P.M.; Laforgia, D. CFD modeling to evaluate the thermal performances of window frames in accordance with the ISO 10077. Energy 2016, 111, 430–438. [Google Scholar] [CrossRef]
- Gugliermetti, F.; Bisegna, F.; Monti, L. Enea—Ricerca Di Sistema Elettrico—Linee Guida Per L’utilizzazione Della Luce Naturale. Available online: http://www.enea.it/it/Ricerca_sviluppo/documenti/ricerca-di-sistema-elettrico/fabbisogni-consumi-energetici/20-la-sapienza-report1.pdf (accessed on 18 July 2021).
- Baglivo, C. Dynamic Evaluation of the Effects of Climate Change on the Energy Renovation of a School in a Mediterranean Climate. Sustainability 2021, 13, 6375. [Google Scholar] [CrossRef]
- Bonomolo, M.; Baglivo, C.; Bianco, G.; Congedo, P.M.; Beccali, M. Cost optimal analysis of lighting retrofit scenarios in educational buildings in Italy. Energy Procedia 2017, 126, 171–178. [Google Scholar] [CrossRef]
- Congedo, P.M.; D’Agostino, D.; Baglivo, C.; Tornese, G.; Zacà, I. Efficient solutions and cost-optimal analysis for existing school buildings. Energies 2016, 9, 851. [Google Scholar] [CrossRef] [Green Version]
- Moazzen, N.; Ashrafian, T.; Yilmaz, Z.; Karagüler, M.E. A multi-criteria approach to affordable energy-efficient retrofit of primary school buildings. Appl. Energy 2020, 268, 115046. [Google Scholar] [CrossRef]
- Baglivo, C.; Bonomolo, M.; Congedo, P.M. Modeling of Light Pipes for the Optimal Disposition in Buildings. Energies 2019, 12, 4323. [Google Scholar] [CrossRef] [Green Version]
- Lee, P.; Lam, P.T.I.; Lee, W.L. Performance risks of lighting retrofit in Energy Performance Contracting projects. Energy Sustain. Dev. 2018, 45, 219–229. [Google Scholar] [CrossRef]
- Michael, A.; Heracleous, C. Assessment of natural lighting performance and visual comfort of educational architecture in Southern Europe: The case of typical educational school premises in Cyprus. Energy Build. 2017, 140, 443–457. [Google Scholar] [CrossRef]
- Doulos, L.T.; Kontadakis, A.; Madias, E.N.; Sinou, M.; Tsangrassoulis, A. Minimizing energy consumption for artificial lighting in a typical classroom of a Hellenic public school aiming for near Zero Energy Building using LED DC luminaires and daylight harvesting systems. Energy Build. 2019, 194, 201–217. [Google Scholar] [CrossRef]
- Yin, C.; Huang, X.; Dadras, S.; Cheng, Y.; Cao, J.; Malek, H.; Mei, J. Design of optimal lighting control strategy based on multi-variable fractional-order extremum seeking method. Inf. Sci. 2018, 465, 38–60. [Google Scholar] [CrossRef]
- Daysim Software Website. Available online: http://daysim.ning.com/ (accessed on 18 July 2021).
- Reinhart, C.F.; Mardaljevic, J.; Rogers, Z. Dynamic daylight performance metrics for sustainable building design. Leukos 2006, 3, 7–31. [Google Scholar] [CrossRef] [Green Version]
- Energyplus Website. Available online: https://energyplus.net/weather (accessed on 18 July 2021).
- Dilaux Software Website. Available online: https://www.dial.de/en/dialux/ (accessed on 18 July 2021).
- UNI EN 12464-1:2011. Lighting of Work Places—Part 1: Indoor Work Places. Available online: https://www.ahjzu.edu.cn/_upload/article/files/50/b5/4e0248ef47278e4dead0447bd16a/89a6cb4c-2303-42e6-97a3-34d8adc7a5eb.pdf (accessed on 18 July 2021).
- Chen, D.; Chen, H.W. Using the Köppen classification to quantify climate variation and change: An example for 1901–2010. Environ. Dev. 2013, 6, 69–79. [Google Scholar] [CrossRef]
- Arnfield, A.J. Köppen Climate Classification, Encyclopædia Britannica, Encyclopædia Britannica, Inc. 2020. Available online: https://www.britannica.com/science/Koppen-climate-classification (accessed on 11 February 2021).
- UNI EN 15193-1:2017. Energy Performance of Building—Energy Requirements for lighting—Part 1: Specifications, Module M9. Available online: https://www.en-standard.eu/csn-en-15193-1-energy-performance-of-buildings-energy-requirements-for-lighting-part-1-specifications-module-m9/ (accessed on 18 July 2021).
| Publisher’s Note: MDPI stays neutral with regard to jurisdictional claims in published maps and institutional affiliations. |
© 2021 by the authors. Licensee MDPI, Basel, Switzerland. This article is an open access article distributed under the terms and conditions of the Creative Commons Attribution (CC BY) license (https://creativecommons.org/licenses/by/4.0/).


 ,
, 


 Switched off;
  Dimming;
  Switched on.