1. Introduction
Porous materials can be simply defined as materials in which a fraction of the solid is replaced by pores [
1]. Depending on their open or closed form, they exist as isolated cavities, ordered channels or percolating networks of passages [
1]. The relative volume fraction occupied by pores and their distribution inside the matrix determine, to various extents, several properties of the porous material [
2]. Among this class of materials, porous metals in both forms, metal foams [
3] and nanoporous (NP) [
4], which differ due to their different morphology and pore sizes, are extensively studied because of their potential applications in several technological fields [
4,
5].
The combination of high stiffness with very low specific weight, high compression strengths and good energy absorption characteristics made metal foams attract interest from companies and industries, which finally led to a significant expansion of knowledge on manufacturing and possible applications [
3]. Both closed- and open-cell metal foams have a wide spectrum of potential applications, ranging from the automotive and aerospace industry to shipbuilding and civil engineering [
5]. The investigation of structure–property relationships appeared immediately crucial for interpreting experimental findings and tailoring the foam mechanical properties to specific applications.
NP metals exhibit physical and chemical properties that promise application in several science and engineering areas [
6]. The entire set of properties stems from the unique morphology of NP metals characterized by a disordered and intricate structure with a remarkable specific surface [
7,
8,
9]. NP metals offer great potential as structural materials. They combine, indeed, the properties and workability of bulk metals with a much lower density. In addition, scale effects that originate for characteristic lengths in the nanometer range could result in stronger NP metal foams than bulk metal counterparts by at least one order of magnitude [
10].
NP metals are typically obtained by dealloying, i.e., by the selective removal of the less noble constituents from the precursory alloy [
11]. Although, with the due shrewdness, noble metals can be readily fabricated in NP form by chemical etching in an aqueous solution, possibly assisted by electrochemical forcing. NP Au is the most studied NP metal, thanks to the solid solubility with Ag and its low reactivity. Its bicontinuous nanoporous structure confers to NP Au better mechanical properties than corresponding bulk metals; however, its high costs hinder the use of this material for structural applications.
In this regard, the ability to fabricate other metals in NP form is crucial in order to facilitate their access to commercial applications, such as structural ones. Nevertheless, the fabrication of NP structures remains challenging for most base metals because of their propensity to oxidation. In order to overcome this drawback, different fabrication methods have been reported. For example, some of them (such as Ti, Ta, Si, Nb) have been obtained replacing the aqueous solution with a liquid metal [
12,
13,
14]. In this respect, vapor-phase dealloying (VPD) has been recently developed [
15]. This method takes advantage of the differences in the vapor pressures of elemental metals to selectively remove one or more alloy constituents, regardless of the propensity to oxidation.
Among metals, aluminum shows important applications in transportation and construction because of its properties such as plasticity, a lightweight nature and passivation capability. In this regard, NP Al fabrication represents an essential goal for possible and innovative further applications in relevant advanced fields. Indeed, recently in the literature, it has been shown that NP Al is a promising material for hydrogen generation [
16] and ultraviolet (UV) plasmonic applications, such as Surface Enhanced Raman Spectroscopy (SERS) and Metal Enhanced Fluorescence (MEF) [
17]. Plasmon resonance of Al nanostructures can be tuned by varying their size, structure, and oxide content from UV to near-infrared (NIR) [
18,
19]. These features make this material a promising valuable low-cost, self-supported, and tunable substrate for UV and visible-light SERS and MEF. Moreover, NP Al could also be of interest as a catalyst by matching the unique surface area and catalytic properties of NP metals with the Al catalytic activity for various organic reactions [
20]. Furthermore, the use of self-standing nanostructured material such as a NP metal for catalytic purposes could allow taking the advantages of both homogeneous and heterogeneous catalysis without the pelletizing process, which can be required when nanoparticles are employed as catalysts [
21,
22].
NP Al fabrication is challenging because of the high Al reactivity toward oxygen and water. The first of the few papers illustrating the preparation of a NP Al has been reported by Suárez et al.; it describes a fabrication method based on the electrochemical dealloying of Zn or Mg [
23]. Later, Corsi et al. [
16] demonstrated that NP Al could be prepared by this method in non-aqueous electrolytes under an Ar atmosphere, thus preventing both Al oxidation during its removal and the ligament coarsening observed by Yang et al. [
24] during Galvanic Replacement Reaction.
In this work, we address the production of NP aluminum by VPD by treating an Al20Zn80 nanocomposite at a relatively high temperature under a vacuum. Three steps are involved in the fabrication method: mechanical alloying of Al and Zn powders under an Ar atmosphere, cold-pressing of powders into pellets, and Zn removal during a thermal treatment under vacuum conditions. Although ligament coarsening could occur because of the relatively high temperature required with VPD, this preparation method is promising because of its ease and the possibility of fabricating relatively large amounts of materials.
Structure features have been investigated at different magnifications by Scanning Electron Microscopy (SEM) and Serial Block Face-Scanning Electron Microscopy (SBF-SEM), while surface area and pore volume have been characterized by N2 physisorption measurements.
Since mechanical properties of NP Al are not studied in an exhaustive way, nanoindentation tests have been performed to estimate Young’s modulus for the first time.
A further investigation of microstructure morphology has been performed by using a phenomenological model based on fractal geometry. Moreover, relevant applications of fractal modeling show its reliability not only to reproduce structure features of several materials, but also to predict their behavior under different conditions [
25,
26,
27]. In this case, it has been possible to calculate the specific surface (by simple geometrical measurements) and Young’s modulus (by resolving series and parallel springs’ patterns after model conversion), which have then been successfully compared with experimental measurements.
2. Materials and Methods
2.1. NP Preparation
Experiments were carried out using granular Al with a particle size of <1 mm and 99.7% purity, and Zn powders with a particle size of <0.149 mm and 99.8% purity. Elemental metals were mixed to prepare Al
20Zn
80 powder mixtures. The corresponding Al
20Zn
80 alloy was obtained by subjecting the powder mixtures to mechanical processing in a SPEX Mixer/Mill 8000 (SPEX SamplePrep, LLC, Metuchen, NJ, USA). To this aim, 10 g of powder mixture were placed inside a cylindrical hardened steel reactor together with two 8 g stainless steel balls. Paraffin oil was used as a process-control agent to avoid powder agglomeration. The reactor was sealed under an Ar atmosphere with impurities below 2 ppm. The mechanical processing was interrupted after 48 h. The structural and microstructural evolution of processed powders was investigated by X-ray Diffraction (XRD). XRD measurements were carried out with a Rigaku Miniflex II Diffractometer (Rigaku, Tokyo, Japan) equipped with a 600 W X-ray source using Cu K
α1, with an incident beam angle 2θ ranging from 30 to 100 degrees. Quantitative phase and microstructural analyses were performed using the Rietveld method [
28]. Processed powders were cold-pressed in the form of cylindrical pellets about 1.3 cm in diameter and 0.3 mm in thickness. The pellets were placed in the glass tube of a tubular furnace. The sample was kept for 1 h under high-vacuum conditions with pressure around 10
−2 Pa. Then, the temperature was raised at 25 °C min
−1 up to 550 °C. The sample was annealed at 550 °C for 1 h and then cooled gradually under high-vacuum conditions.
2.2. SEM Characterization
The resulting material was investigated by SEM using a Zeiss (Oberkochen, Germany) Merlin microscope equipped with a Schottky electron source, working with an acceleration voltage of 5 kV and an electron current of 150 pA at a short working distance (high-resolution mode). Secondary electrons (SE) were collected to provide fine details on the surface morphology, while backscattered electrons (BSE) were collected to detect differences in local composition. SE and BSE were gathered using an in-lens detector and a multiple-sector detector placed on the bottom of the SEM objective lens, respectively. SEM-Energy Dispersive Spectroscopy (EDS) measurements were performed with an Oxford silicon drift detector (SDD) (Oxford Instruments, Abingdon, UK) with a detection area of 60 mm2, collecting EDS spectra from 6 diverse, rectangular-shaped cross-sectional areas placed at increasing depths in the sample, aiming at finally covering the entire 224 µm-thick sample. In order to properly compare the results obtained, rectangular zones with the same surface area were scanned by the electron beam, and an EDS spectrum from each of them was collected keeping the same SEM working conditions: acceleration voltage (30 kV), electron probe current (1 nA), and collection real-time (5 min per spectrum).
SEM images were subjected to image analysis (IA) using AutoCad® (Version 24.0) to identify pores. To account for their irregular shapes, different characteristic lengths were roughly estimated per each pore, and average pore size was eventually calculated.
SBF-SEM Imaging
For SBF-SEM imaging, the specimen was first embedded in EM-dedicated epoxy resin to obtain a small and compact block, then such a block was mounted on an Al specimen. Silver paint was used to electrically ground as much as possible the edges of the block to the aluminum pin. The entire block was then sputter-coated with a layer of gold capable of reflecting light to perform the fine SBF-SEM alignment. The block containing NP Al was then imaged using a ThermoFischer (Waltham, MA, USA) VolumeScope (VS) device, mounted into a ThermoFischer Teneo FEG SEM equipped with a Schottky field emission electron source, operating at an accelerating voltage of 2 kV, with a beam current of 50 pA, and under low-vacuum conditions (50 Pa). Serial BSE-SEM images were acquired by a dedicated detector after cutting the specimen with a thickness of 100 nm at different magnifications, and with resolution and dwell times chosen adequately to prevent further local specimen charging. For 3D reconstruction, rendering, and analysis, serial SEM images were aligned and stacked into a volume using AVIZO software (version 2020.3) (ThermoFischer). Three-dimensional structures in image stacks containing hundreds or thousands of 2D ortho slices were traced individually in each plane and automatically surface rendered. From SBF-SEM stacks analysis, the features of larger pores (such as area, shape, characteristic lengths, and pore profile roughness) were estimated through a semi-automatic tool (Analyze Particles) using Fiji program (version 1.53c plus) [
29]. Fractal dimension was estimated by using “Fractal Box Count” tool of Fiji [
29].
2.3. N2 Physisorption Measurements
N
2 physisorption measurements were carried out using a Micromeritics (Norcross, GA, USA) ASAP2020 apparatus. Adsorption and desorption isotherms were measured at 77 K. The Brunauer–Emmett–Teller (BET) method was utilized to estimate the specific surface area [
30].
2.4. Mechanical Properties Measurements
The mechanical properties of suitably prepared NP Al samples were measured at room temperature using ex situ depth-sensing nanoindentation. To this aim, a NanoTest Vantage Micro Materials indenter (Micro Materials, Wrexham, UK), equipped with a calibrated three-sided pyramid diamond Berkovich tip about 200 nm in radius, was used. Measurements were carried out within the indentation load range between 400 and 2400 μN. The loading rate was kept constant at 500 μN s−1. Loading and unloading curves were measured on 36 indents per sample. The slope of the linear part of each unloading curve provides an estimate of the Young’s modulus. The average Young’s modulus was calculated by taking into account all the measured values.
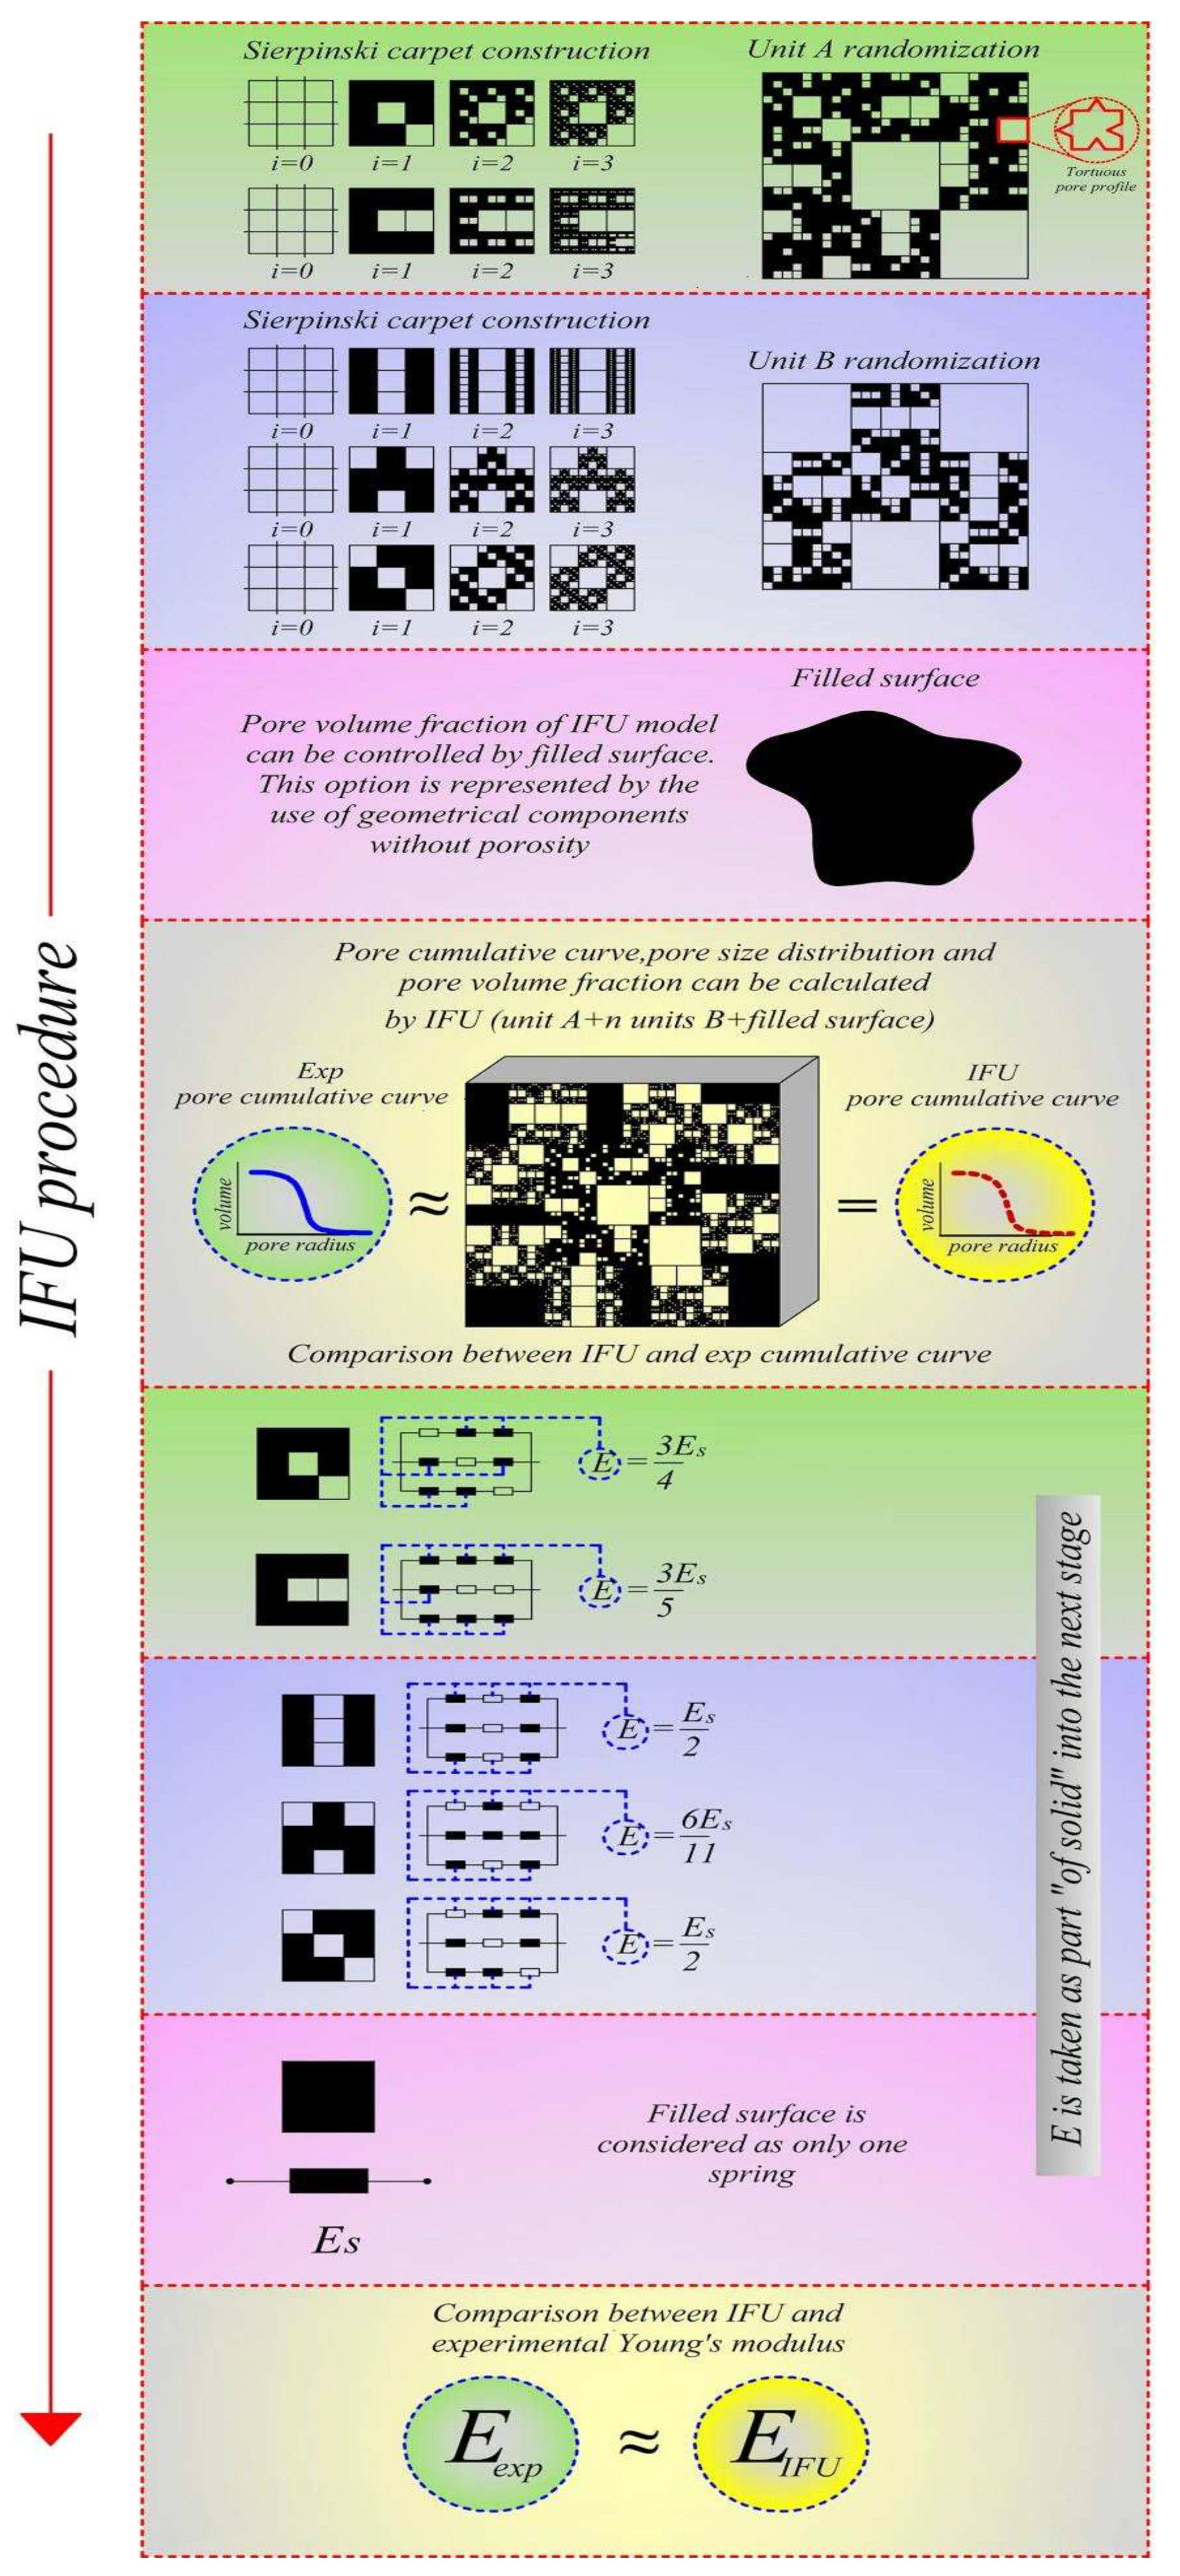
2.5. Fractal Model
A phenomenological model based on fractal geometry was developed with the aim to reproduce the porous structural features (pore size distribution, pore size range, pore fraction) and predict the specific surface area and Young’s modulus of NP Al [
25]. In particular, the proposed fractal model, called IFU, was obtained by using Sierpinski carpet, a well-known example of fractal geometry as a base unit. This fractal figure was constructed by starting from a square in which each side (
l) is divided by a numerical factor
F generating equal sub-squares (Equation (1)). Some of these sub-squares can be removed by creating a structure formed by solids and voids with the same characteristic length [
25].
The obtained objects were characterized by the non-integer dimension calculated by
where
NRSQ denotes the number of sub-squares not removed at the first iteration. The described step was repeated on all sub-squares, generating a self-similar pattern in which at the
n-th iteration, the size of the voids was:
Iteration by iteration, it was possible to note that new classes of voids were generated, and monotonic pore size distribution could be obtained. However, real materials in general have different pore size distribution curves (non-monotonic) in which one or more maxima can be found in correspondence with any pore class. These structures could be approximated by a modeling procedure based on IFU. The number of unit base type was related to the complexity of the cumulative curve of porous structures, one unit for every inflection point. For the investigated systems, two structural types of units’ bases were used: 1-unit Sierpinski carpet A and Sierpinski carpet B (for simplicity unit A and unit B), with different characteristic lengths and Df.
The pore fraction resulting from intermingling was given by:
where
,
,
, and
are the total areas and total pore areas of A and B units, respectively. After porosimetric tests or image analysis, it was possible to use the experimental measurement value for calculating
where
is the experimental pore fraction. In order to improve the versatility of the model, different settings could be used, such as: (a) maintain solid some sub-squares of unit A and units B forever; (b) introduce non-porous surfaces to control the pore fraction of the entire model; (c) make the pore profile tortuous in a longitudinal or transverse direction for reproducing specific surface and morphological characteristics. In particular, concerning the tortuous pore profile, it can be characterized by rough path
which was calculated by
where
is tortuous fractal dimension and
A tortuous pore profile was constructed around the square edge of a void to leave the solid and void fraction unaffected. Consequently, the pore cross-sectional area was considered constant and independent of the specific profile. Since the IFU is the smallest representative part of a microstructure, a method to compare data with IA (referred to the examined surface) had to be used. For this, the total length of pore profiles was divided by total model surface (
AIFU),
Moreover, it was possible to calculate specific surface area by considering IFU unitary model extrusion along the transversal direction and the specific weight of material solid phase,
:
After phenomenological reconstruction of the microstructure, the fractal model can be converted into an analytical multi-scale homogenization pattern composed of springs allocated in series and parallel. Starting from the smallest cell (generated by the last iteration
n), the effective Young’s modulus
was computed, and the result was used as the modulus of a solid part at
n − 1 iteration [
25].
At the
n iteration, an analytical expression for stiffness of each spring was represented by
where
is a characteristic function which is equal to 0 for pore and 1 for solid,
Es denotes the elastic modulus of the solid phase,
represents the cross-sectional area (per unit out-of-plane thickness), and
stands for the length of the corresponding sub-square. These last geometrical features were the same in all sub-squares. The effective Young’s modulus was calculated by
where
[
25].
The Young’s modulus of the entire fractal structure was given by the harmonic average of the Young’s modulus of each base unit and filled surface. The three-dimensional structure was reproduced by giving an arbitrary unit thickness to the IFU.
3. Results and Discussion
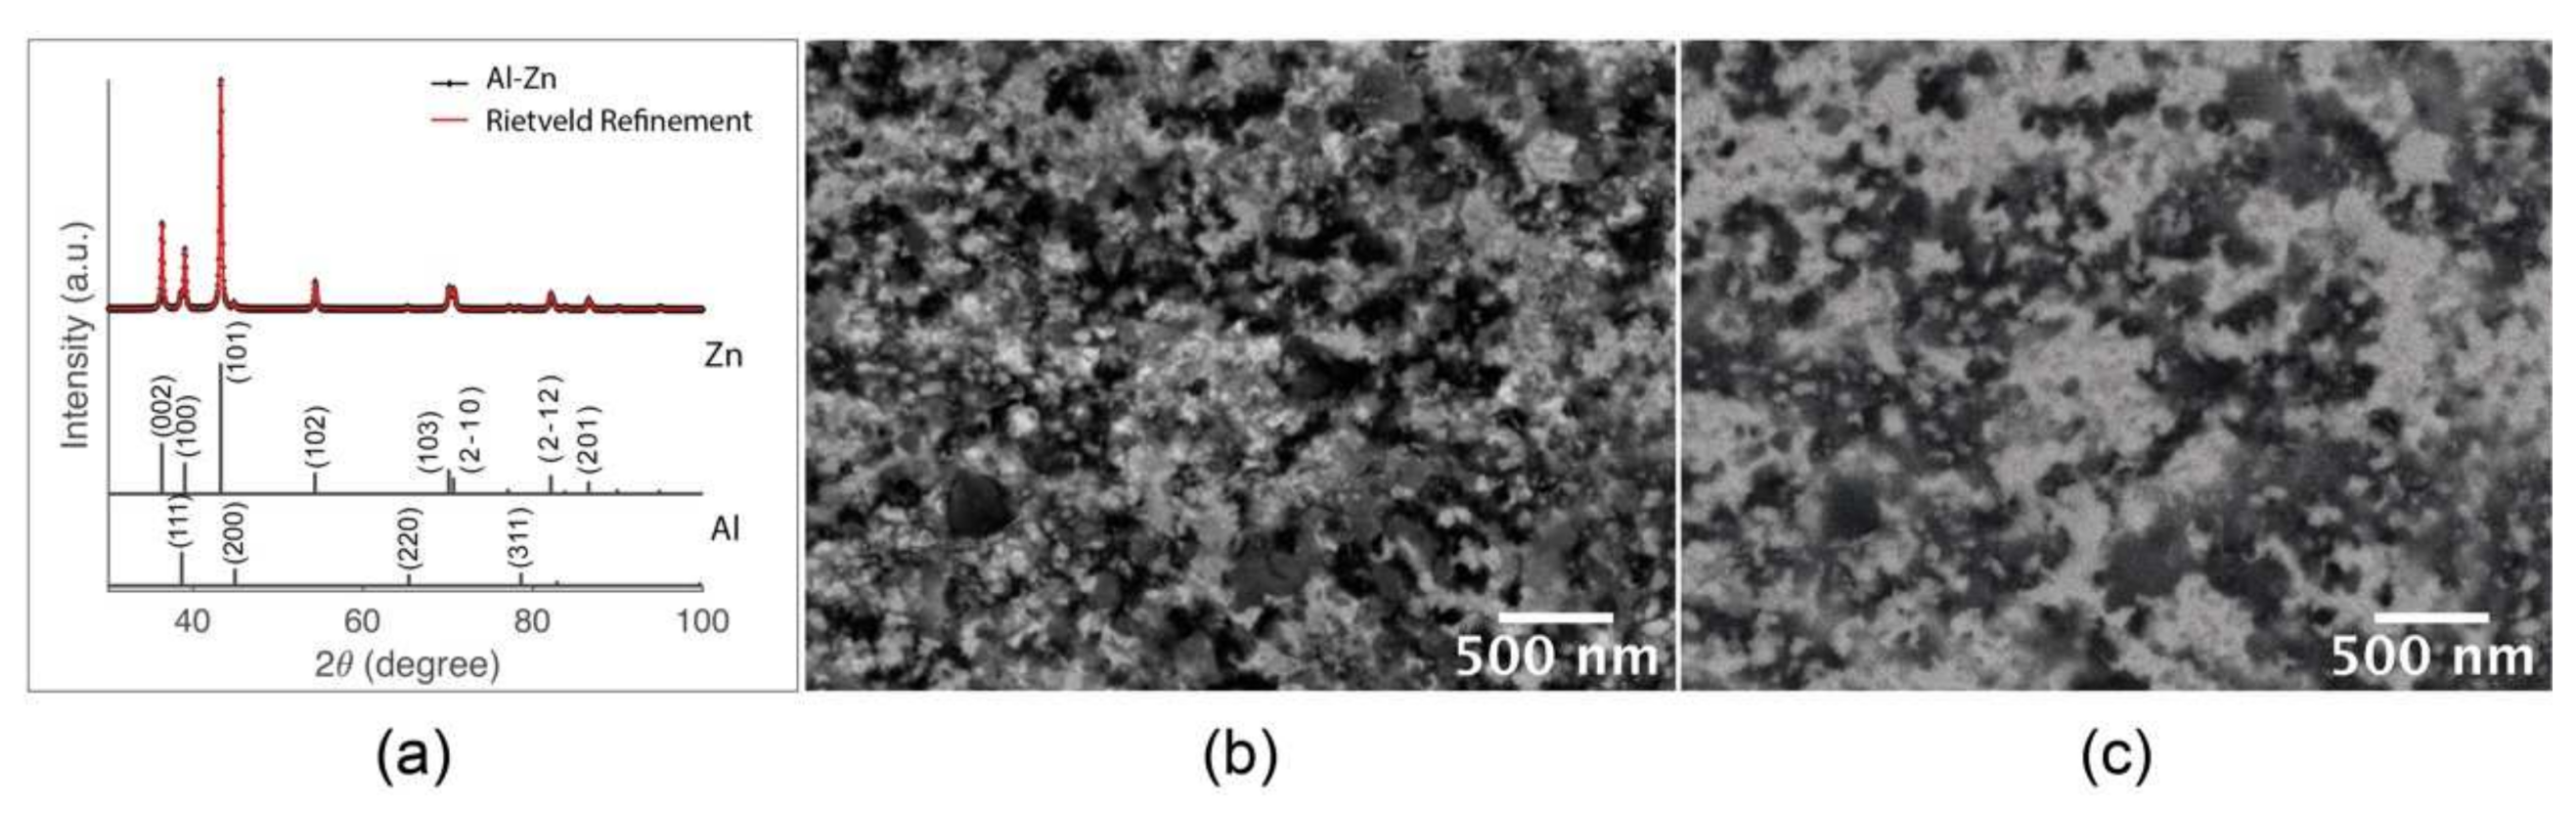
The XRD pattern of the Al
20Zn
80 powder mixture mechanically processed for 48 h is shown in
Figure 1a and compared with the reference XRD patterns of pure Al and Zn. The mechanical processing made Al reflections disappear and Zn ones broaden. The Rietveld analysis indicates that broadening can be ascribed to the reduction of grain size from the initial value of about 100 nm to the final one of about 70 nm. A small downward shift of about 0.1° in the angular position of Zn peaks is detected. Based on the Al and Zn atomic radii [
31], it can be ascribed to a terminal solid solubility of Al in Zn [
32], with the two elements remaining substantially segregated.
Therefore, it can be concluded that the mechanical processing of the Al
20Zn
80 powder mixtures induces the formation of a nanocomposite. The SEM micrographs, such as the ones shown in
Figure 1b,c, provide support for this conclusion. In particular, the SEM-BSE imaging indicates that the nanocomposite consists of finely dispersed nanocrystalline phases with diverse atomic numbers. Specifically, the zones appearing brighter have a higher atomic number, i.e., a higher Zn percentage. As shown by the SEM micrographs reported in
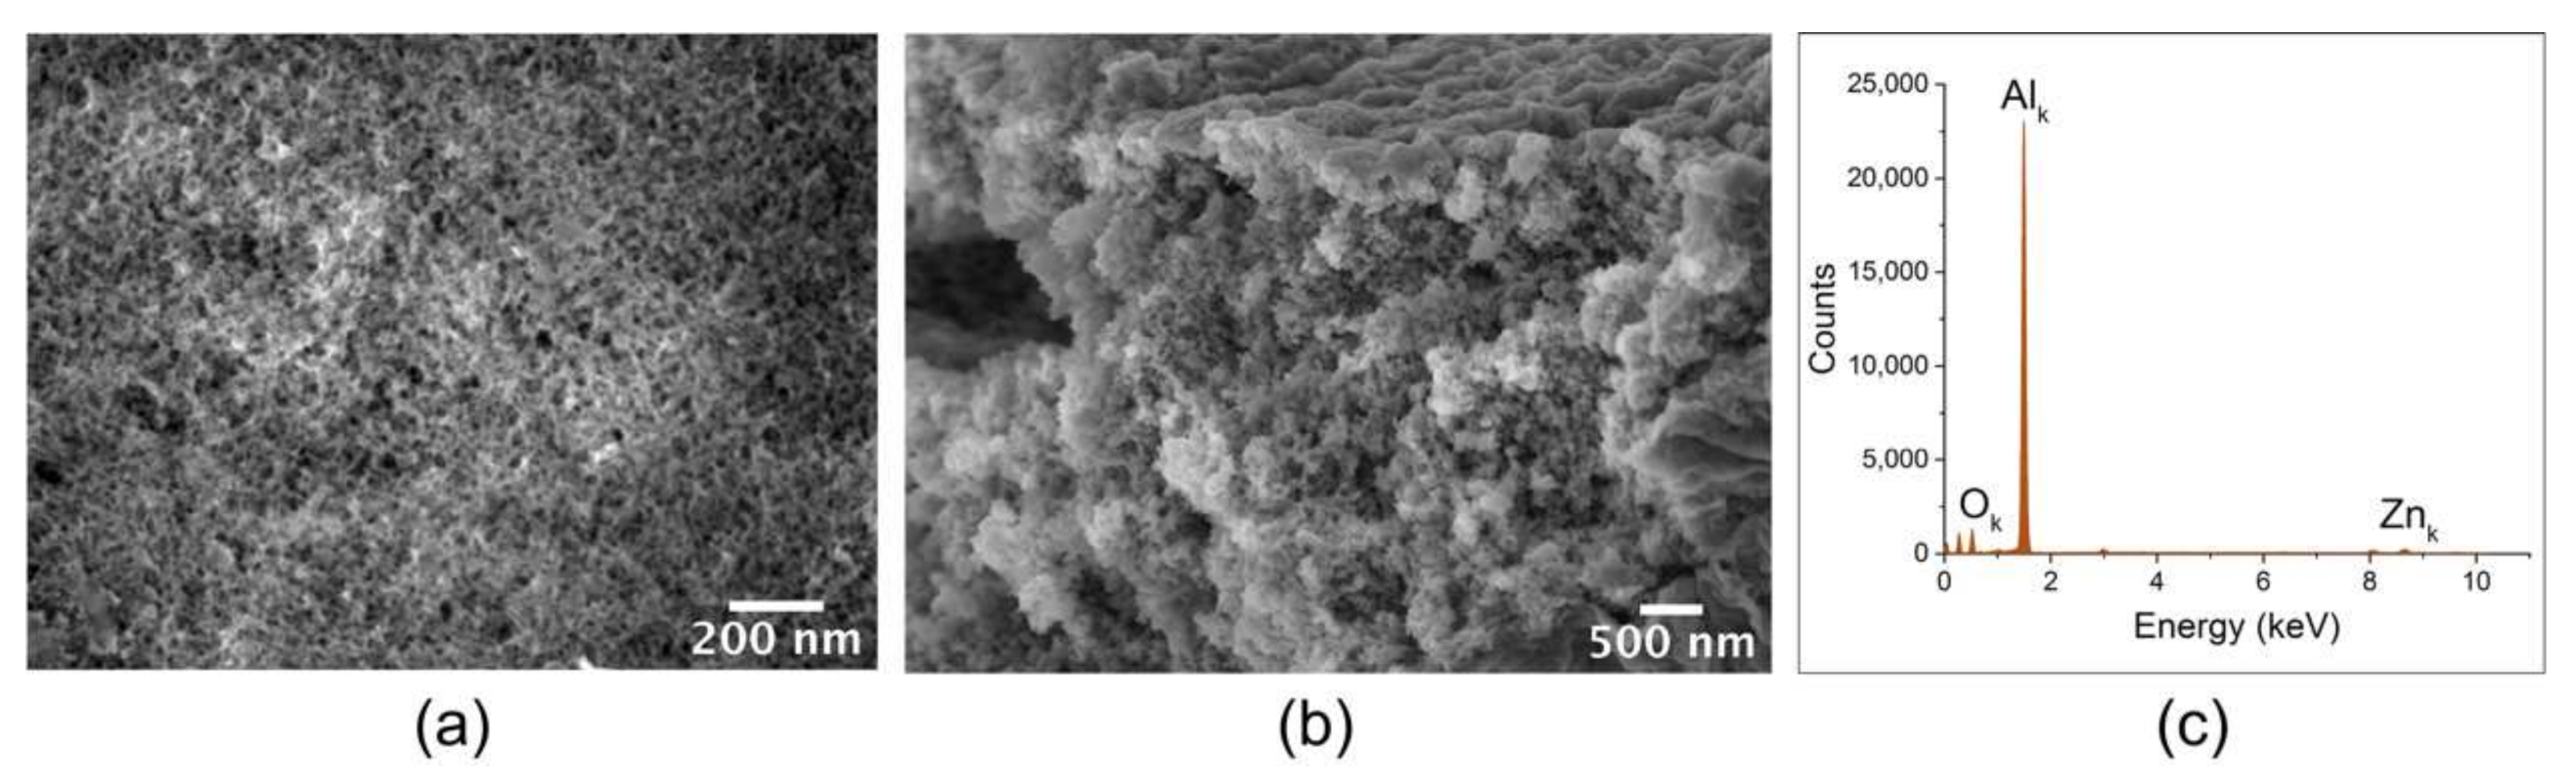
Figure 2, the annealing at 550 °C under high-vacuum conditions for 1 h drastically changes the material microstructure. As shown in
Figure 2a, the sample surface exhibits the typical appearance of NP metals with nanosized ligaments and pores (approximately 10 nm). The SEM micrograph in
Figure 2b reveals that the NP architecture is maintained inside the sample, although the ligament size appears to be larger.
EDS measurements shown in
Figure 2c and
Figure S1 indicate that the Zn atomic percentage, normalized with respect to the sum of the Al and Zn ones, mostly averages around 1% near the pellet surface, while it increases up to about 3% near the opposite surface. Therefore, Zn has been almost completely removed from the sample. The O content is related to the oxidation of the Al surface, with consequent formation of a thin passivation layer [
33].
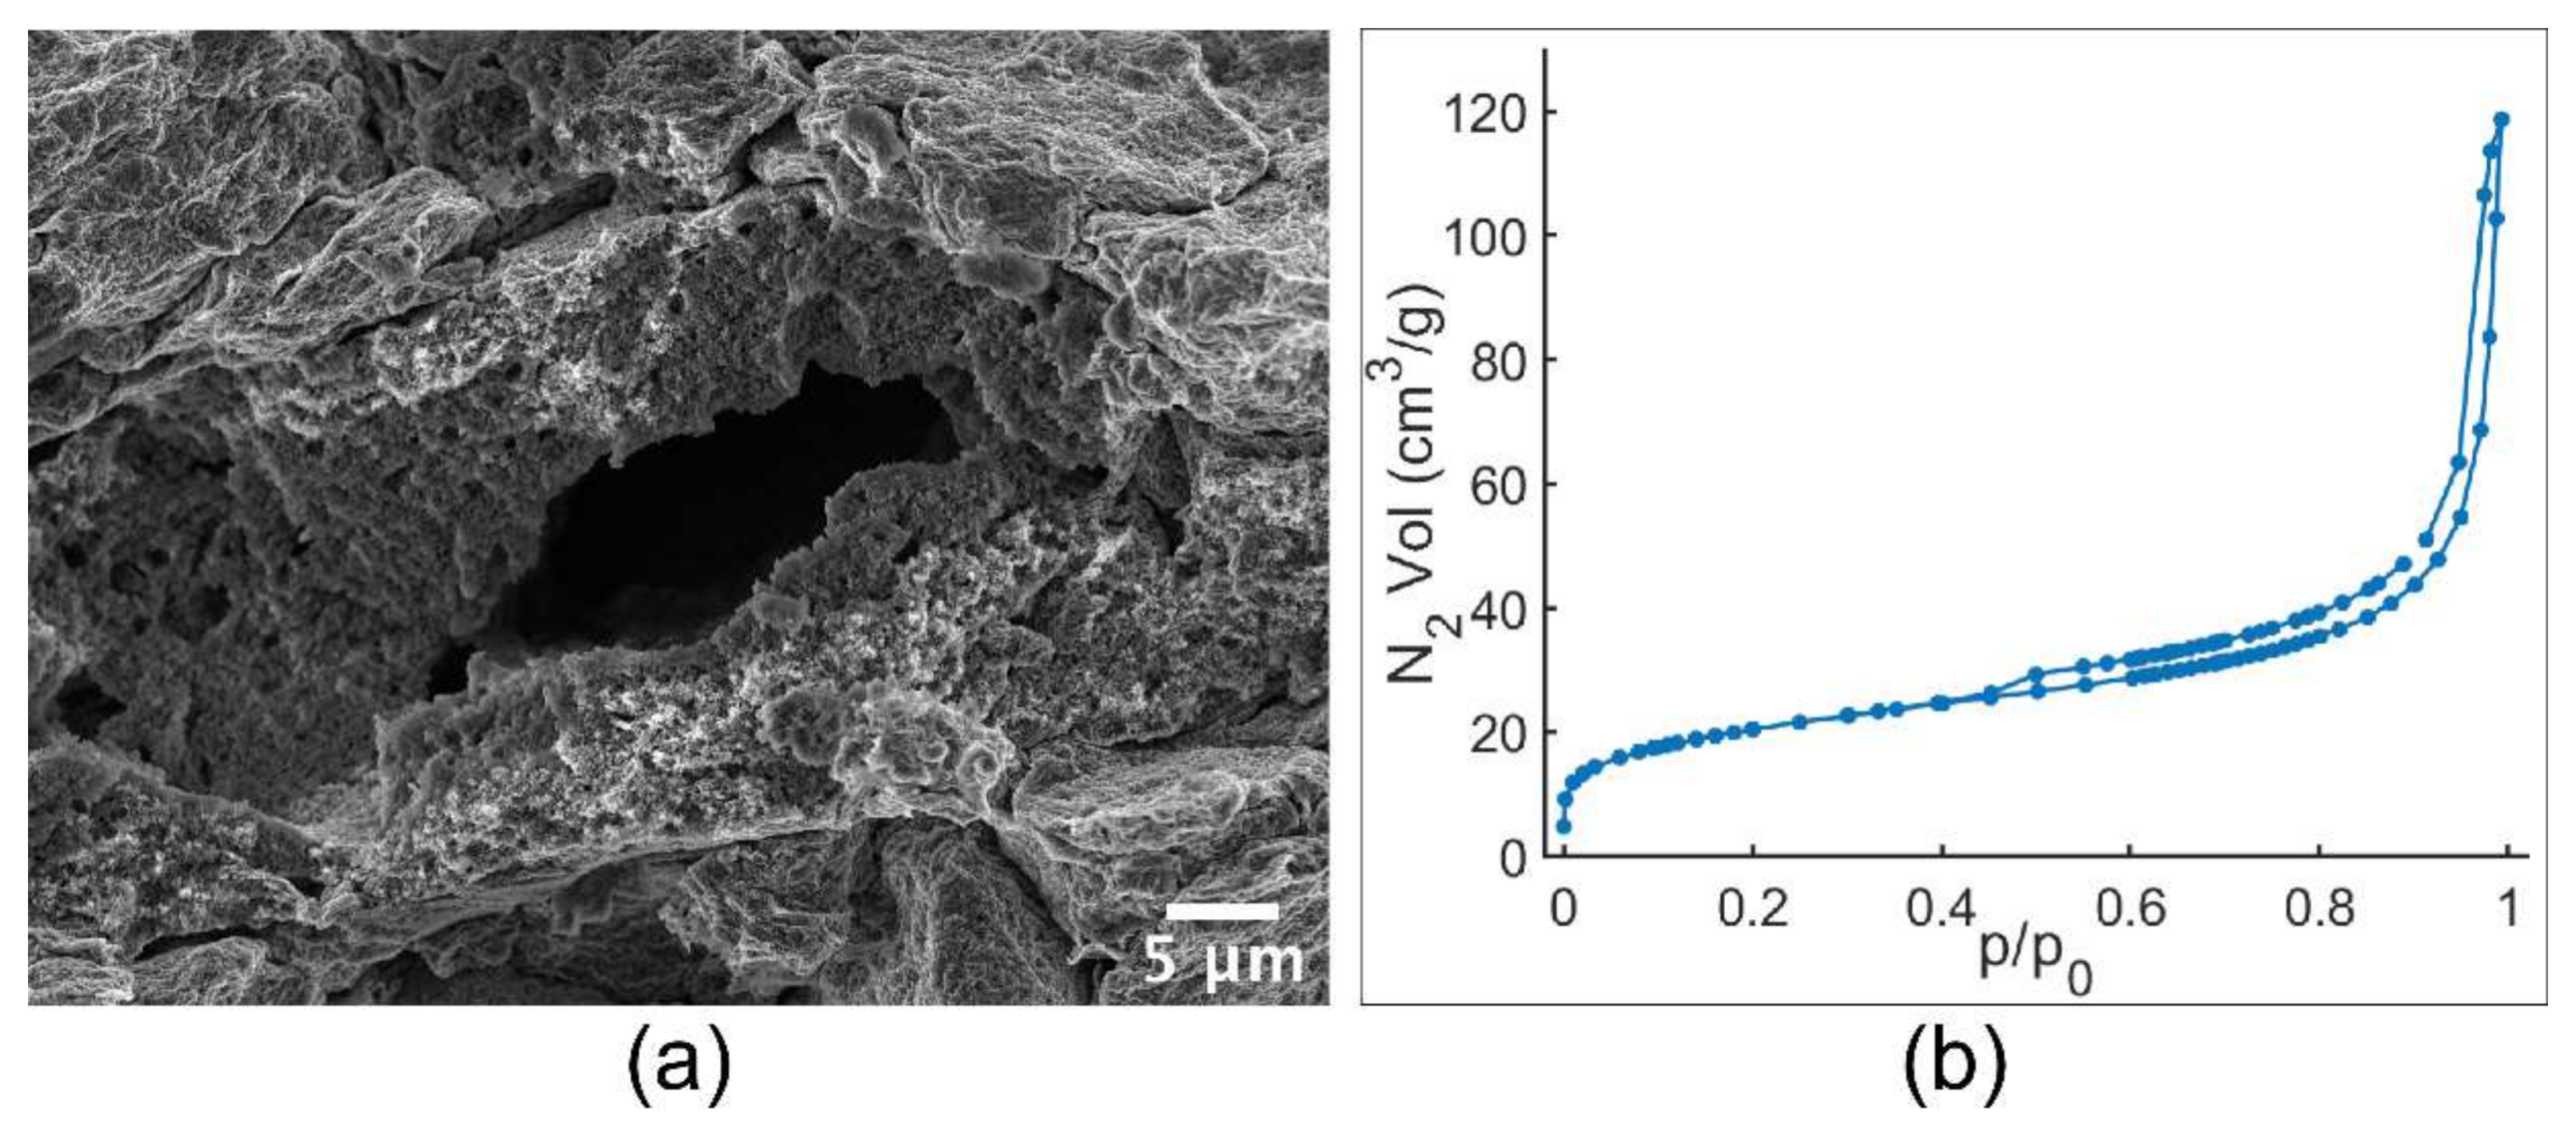
The experimental evidence heretofore presented definitely suggests that we have been able to fabricate almost pure NP Al. The architecture we observe can be well described in terms of open cells with irregular morphologies that tessellate the entire sample volume. Therefore, the NP Al can be considered a truly NP metal with ligaments characterized by a relatively high aspect ratio, which gives them their stocky appearance. It is possible to note that the sample shows a porous structure over its whole volume. However, relatively large voids, such as the one shown in
Figure 3a, have been observed. Our first hypothesis is that they are due to the incomplete compaction of the nanocomposite powders during the preparation of pellets.
The shape of the N
2 physisorption isotherms shown in
Figure 3b is associated with the occurrence of a hysteresis loop and does not strictly match with a specific classification, supporting the NP Al structure’s inhomogeneity [
34]. The NP Al specific surface area, as obtained by BET analysis, is nearly 73 m
2 g
−1, a remarkably large value that compares well with the highest literature values for NP metals [
35,
36]. Although limitations associated to surface area determination by physisorption routes have been reported, the correlation with the structural features has been pointed out [
35,
36,
37]. For instance, NP Au can have a specific surface area as large as 85 m
2 g
−1 when its ligaments are about 7 nm in size [
35]. From pore volume evaluation, a porosity of 40% can be estimated, relative to those pores smaller than 300 nm.
The presence of nanosized ligaments and pores represents a fundamental aspect of a NP materials. However, it is well known that the performances of this kind of material also depend on larger-scale cavities by influencing various parameters, such as the mass transport of fluids, mechanical properties, and electrical and thermal conductivity [
38,
39]. Thus, aiming at investigating the overall porous structure of the specimen, a technique capable of revealing its internal 3D structure appeared of pivotal importance. As a consequence, an SBF-SEM experiment was carried out on it. By this technique, the sample 3D structure along the entire 270 µm cross-section profile was determined (example images of the cross-section at two different magnifications are shown in the
Supplementary Materials, Figure S2) and the obtained micrographs allow analysis of NP Al at different scales with a resolution of 300 nm.
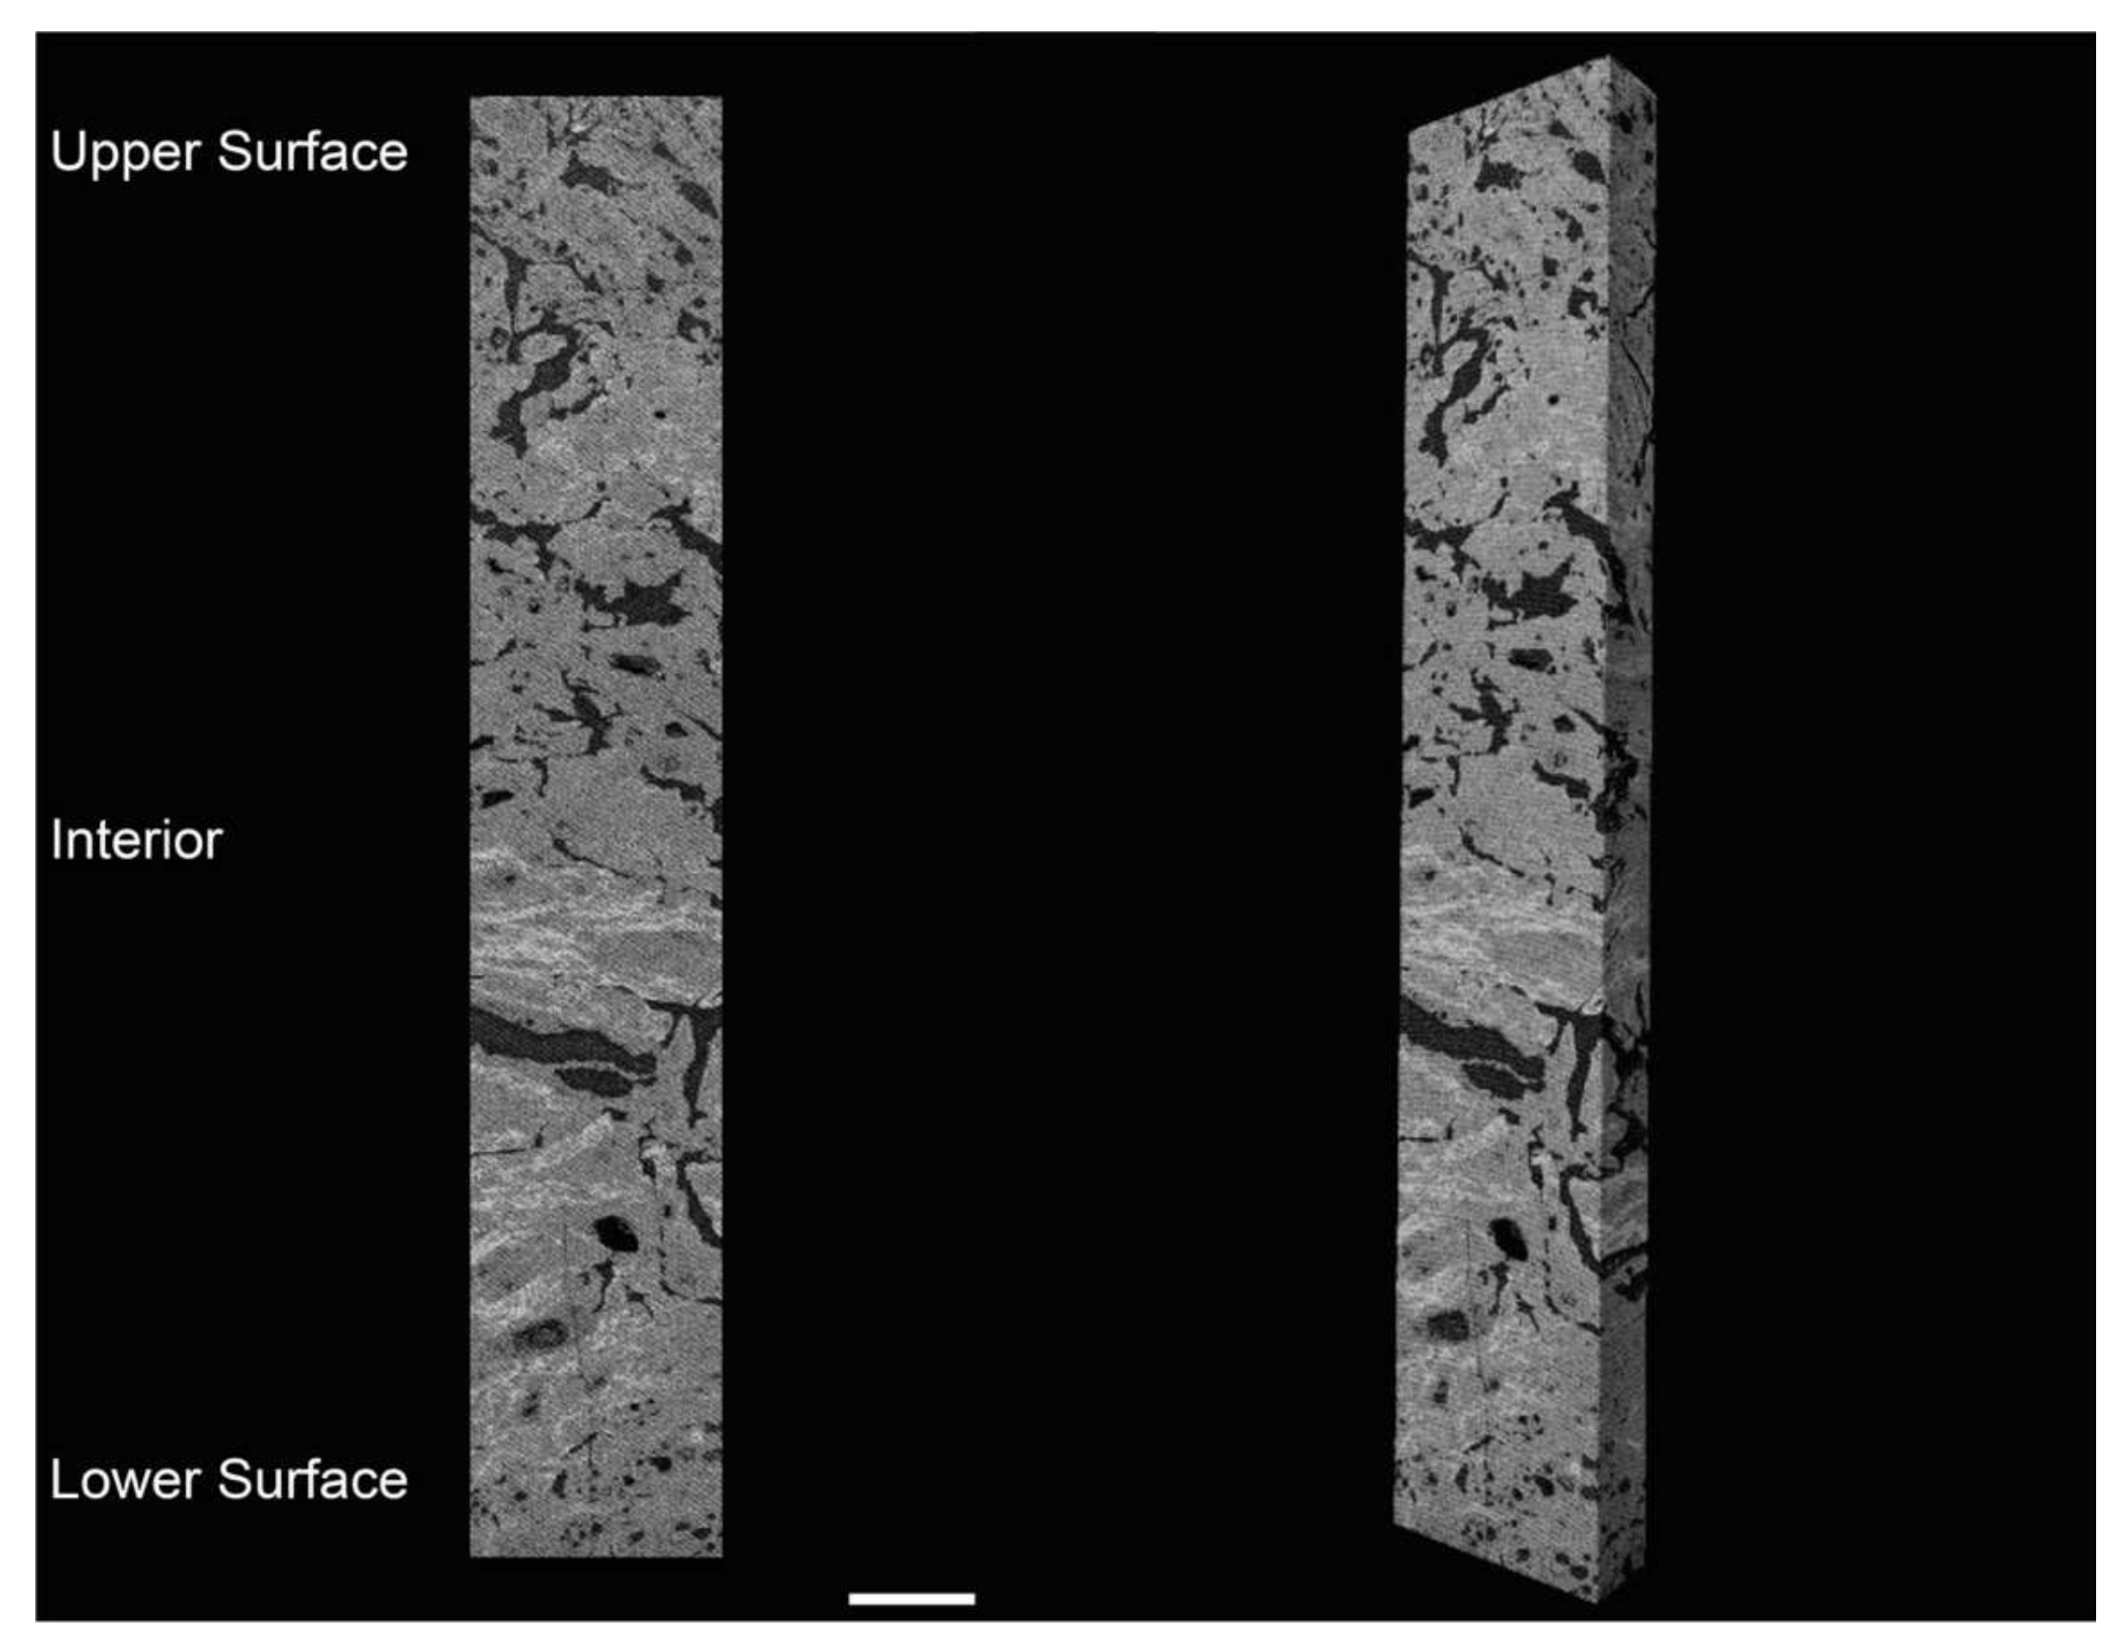
From the SBF-SEM measurements, the 3D reconstruction and a representative video of the porous structure evolution during the subsequent cuts of the entire cross-section profile are shown in
Figure 4 and in
Video S1, respectively. Quantitative analysis of SBF images was focused near the surfaces and in the interior of the sample (see
Figure S3). Indeed, it can be observed that the two surfaces have smaller pores and a higher overall porosity with respect to the inner part of the sample, as can also be clearly seen by the 3D reconstructions at a low (
Figure 4) and higher (
Figure S4) magnification. Moreover, the dense areas of the sample manifest different brightness levels, associated with a higher concentration of Zn in the brightest areas (and a lower one in the inverted images in
Figures S2 and S3). The Zn-richest areas are found to be more prevalent in the interior of the specimen due to the slower Zn removal in the inner part of the sample.
From SBF-SEM analysis and by using IA techniques, it has been possible to estimate an additional porosity of 10% related to pores larger than 300 nm, which cannot be estimated by N
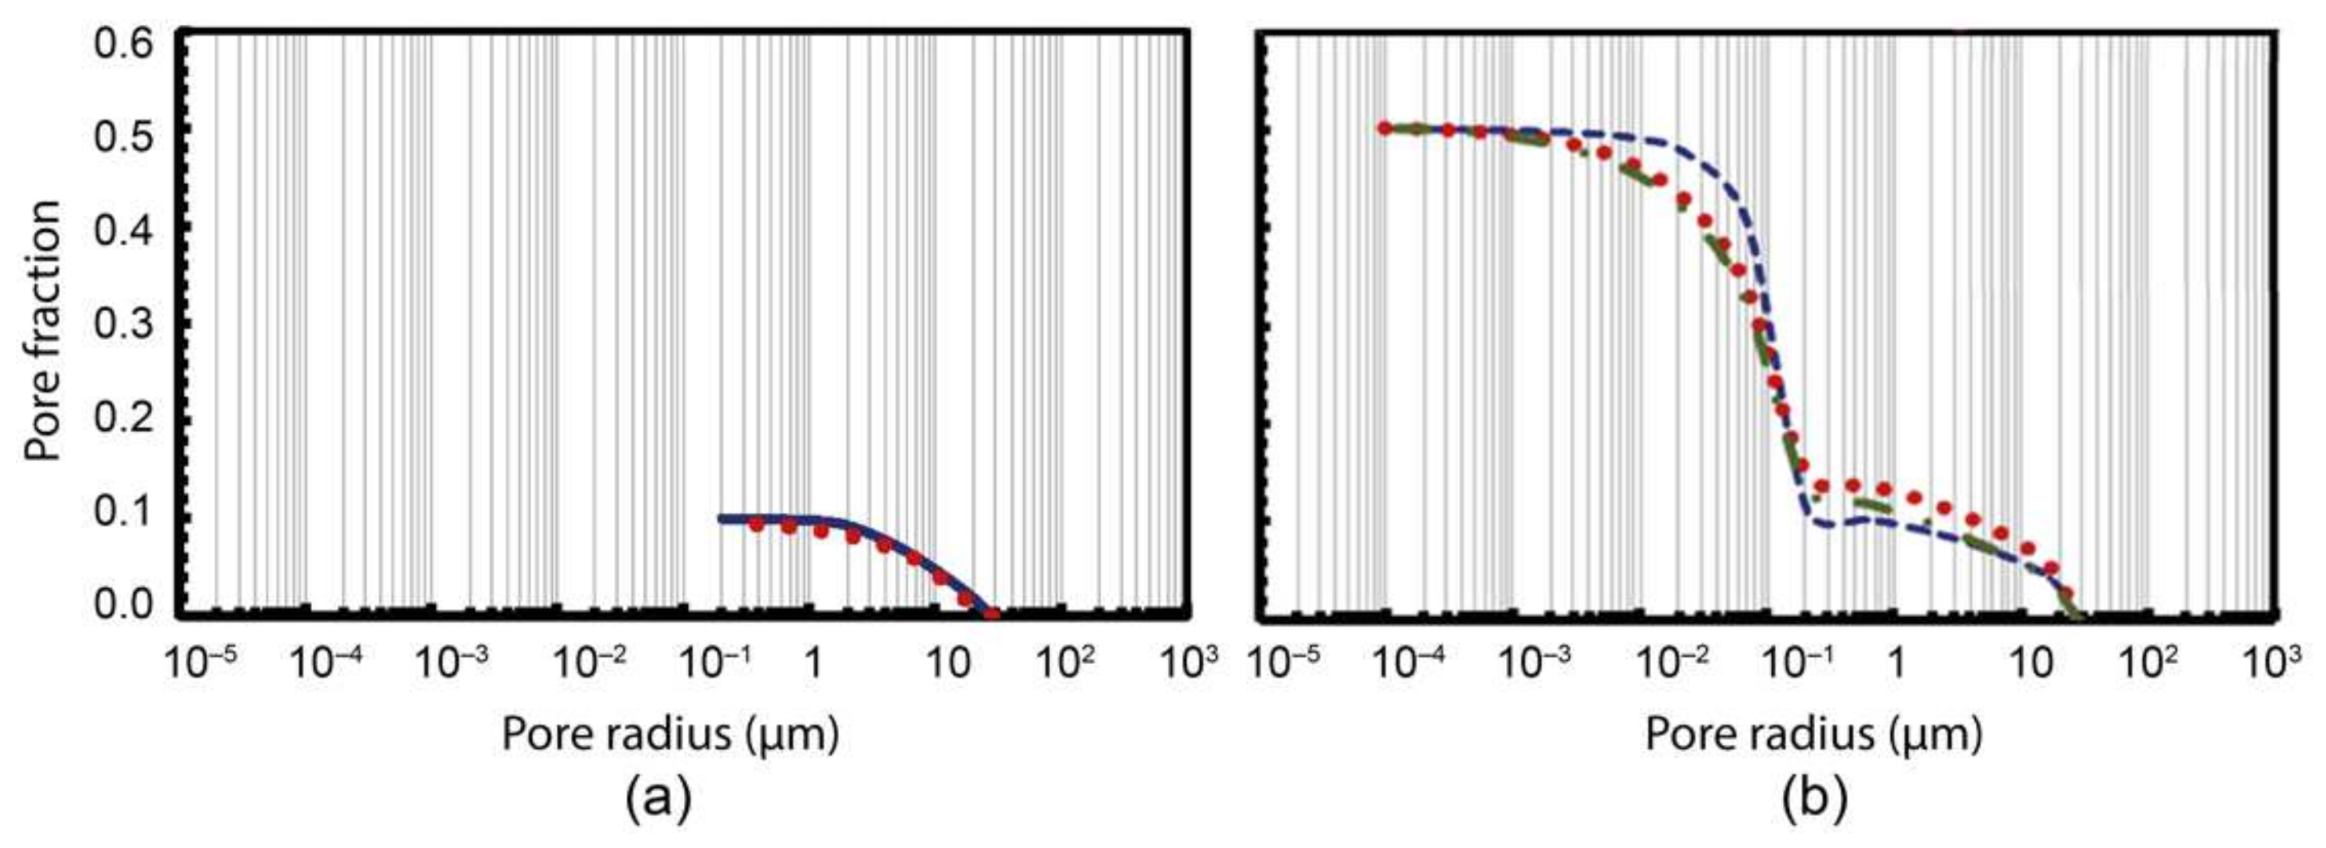
2 physisorption measurements. Therefore, by adding this value to the porosity relative to pores smaller than 300 nm, a rough estimation of the overall porosity lies at around 50%. IA of SBF-SEM images was also carried out to elaborate pore cumulative curves for voids with characteristic lengths higher than 300 nm. Consequently, in order to reproduce these experimental findings, an IFU model (see
Figure 5) has been applied and input data has been reported in
Table 1. In
Figure 6a, a cumulative curve obtained by IA elaborations has been compared with fractal pore structure. It is possible to observe that the proposed model can reproduce the experimental data. Moreover, IA allows calculating the fractal dimension (Dt) of pores that is about 1.17 ± 0.02. By using Equation (8), it is possible to estimate the length of the tortuous profile of each pore. Furthermore, in this case, the measured and calculated data, referred per unit of surface, are very comparable, 0.33 µm
−1 and 0.30 µm
−1, respectively. However, the pore fraction relative to IA observation is only ⅕ of the total porosity (equal to 50%). In order to have an overall description of porosity, IFU models have been used to design possible pore size distributions. These designed cumulative curves are built considering pore size ranges from SEM observations and overall porosity from SBF-SEM stacks and N
2 physisorption measurements. In
Figure 6b, pore size distributions designed by using input data reported in
Table 2 have been shown. It is possible to notice that, as supposed, pore size range and pore fraction are equal for every cumulative curve, yet they have different pore size distributions. The remarkable capability of the model to reproduce experimental data is confirmed by the calculated specific surface (Equation (8)), which is equal to 73 ± 7 m
2/g vs. about 73 ± 1 m
2/g, obtained by BET.
The capability of the fractal model to describe porous structures allows using it for predicting elastic properties [
25]. Based on Equation (10), the Young’s modulus is estimated to be about 18 ± 2 GPa. As mentioned above, the first experimental estimation of elastic behavior for NP Al is reported in this paper. Mechanical tests allow estimation of the value of the nanoindentation Young’s modulus which is equal to 18.3 ± 1.4 GPa, which is very close to that predicted by the model.


 ,
, 


