Featured Application
The presented model can be used as a baseline model for the implementation of peak demand response systems in Jordan. The day-ahead prediction model can aid in giving better demand predictions in order to achieve more optimized day-ahead unit commitment scheduling for the Jordanian power sector.
Abstract
In this paper, a comprehensive demand response model for the residential sector in the Jordanian electricity market is introduced, considering the interaction between the power generators (PGs), grid operators (GOs), and service providers (SPs). An accurate day-ahead hourly short-term load forecasting is conducted, using deep neural networks (DNNs) trained on four-year data collected from the National Electric Power Company (NEPCO) in Jordan. The customer behavior is modeled by developing a precise price elasticity matrix of demand (PEMD) based on recent research on the short-term price elasticity of Jordan’s residential and the analysis of the different types of electrical appliances and their daily operational hours according to the latest surveys. First, the DNNs are fine-tuned with a detailed feature analysis to predict the day-ahead hourly electrical demand and achieved a mean absolute percentage error (MAPE) of 1.365% and 1.411% on the validation and test datasets receptively. Then the predictions are used as input to a detailed model of the Jordanian power grid market, where a day-ahead peak-time demand response policy for the residential sector is applied to the three distribution power companies in Jordan. Based on different PEMD analyses for the Jordanian residential sector, the results suggest a reduction potential of 5.4% in peak demand accompanied by a cost reduction of USD 154,505 per day for the Jordanian power sector.
1. Introduction
1.1. Background
The world energy demand grew by 2.3% in 2018, which is the fastest growth within the last decade [1]. The rapid increase in the global economy and population has resulted in more energy demand in certain regions, particularly in developing countries like India and China. With energy demand being on the rise, the world is faced with high dependence on fossil fuels, leading to increased greenhouse emissions and global climate change. With the overall increase in fossil fuel demands, even though renewable energy is growing fast, it is not growing fast enough to meet the rise in energy demand at 1% for developed countries and 5% for developing ones [2].
With very limited resources, Jordan faces significant challenges in its energy sector due to heavy reliance on importing most of its energy resources. Losing access to Iraq’s crude oil in 2003 and Egypt’s natural gas, the country was put under critical economic conditions that had an adverse impact on both private and public sectors, placing the country under massive debt. By 2015, the total accumulated commercial loans and the advances from the Ministry of Finance (MoF) reached 4.9 Billion JDs by the national electric power company (NEPCO), which was 18.8% of Jordan’s GDP and accounted for one-quarter of the total consolidated public-sector debt, limiting the borrowing capacity of the government [3]. In 2018, the imported crude oil and natural gas accounted for 92% of the total energy requirements, constituting 10% of the country’s GDP [4]. A shortage in affordable energy supplies directly affects the public sector, increasing the budget deficit and leading to revenue-boosting measures (hike taxes and fees). In contrast, private sectors face immense production costs due to high energy costs and higher taxes, leading to lower productivity and profitability. With Jordan’s annual energy demand growing at a rate of 3% [5] and the surge of Syrian refugees estimated between 660,000 and 1.26 million [6], coupled with the previous challenges mentioned, the government had a strong commitment to reform its energy sector.
In 2013, the National Energy Efficiency Action Plan (NEEAP) was introduced in Jordan to set the targets for achieving 20% energy saving and increasing the share of renewable energy to cover 10% of the national energy consumption by the year 2025. To this aim, a five-year electricity tariff plan adjustment was implemented between 2013 and 2017 to increase NEPCO’s revenue, and an automatic electricity tariff adjustment mechanism (AETAM) was adopted in 2016 to reflect global oil price changes in consumer’s tariffs, except those under 300 kWh per month, in order to protect poor households [7]. Due to the tremendous efforts, financial incentives, and government promotion to attract overseas investments and expertise, there has been significant progress in the renewable energy sector, reaching a capacity of 1470 MW by late 2019, which represents 25.7% of total generation capacity, with solar accounting for approximately 75% of renewable power [8]. Renewable energy’s contribution to the total electricity generation reached 15.1%, with solar energy, wind power, and hydropower accounting for 10.4%, 4.4%, and 0.1%, respectively [8]. While this sheds hope for the future of the Jordanian energy sector and increases energy resilience [9], an increase in renewable energy in both transmission and distribution levels introduces grid-level operational challenges that must be met to achieve optimized and efficient operation. Renewable energy sources such as solar and wind are non-dispatchable power units characterized by uncertainty, stochasticity, and being intermittent as they are dependent on variable weather conditions, which increase the flexibility needed to achieve supply–demand balance [10] and the need for energy storage systems [11,12]. On transmission levels, a fluctuation in renewable energy supply causes a sudden decrease or increase in power flow, while on distribution and consumer levels, a sudden change in weather conditions can lead to a reduction in renewable energy generation that causes a sudden load increase, affecting the grid voltage and frequency levels. Hence, grid operators need to rely on the frequent operation of high-ramping power supply units, which are costly to operate, where a sudden decrease in renewable energy occurs. In high renewable energy scenarios, the minimum power output of conventional power plants is an extremely sensitive factor to avoid plant shutdown, which is economically a worst-case scenario, causing challenges to conventional power generators’ unit commitment and operation [13].
Demand-side management (DSM) and demand response (DR) systems introduce a form of flexibility from the consumer side [14]. In DR systems, the power distributors and grid operator (GO) can influence consumers to shift, shed and reschedule their energy consumption and electrical appliances usage by providing incentives or implementing dynamic pricing methods [15]. Jordan is rapidly installing smart meters around the country, with great potential for implementing many DSM methods such as time of use (TOU) pricing, peak pricing, and real-time pricing schemes. Implementation of a DR scheme targeted to the residential sector can guarantee flexibility in unit commitment planning and hourly operation to achieve optimized demand–supply matching and avoiding the need to use fast-starting and costly power units in times of high energy demand or low renewable energy generation. With the domestic and government buildings accounting for 46.12% of the electrical energy demand in 2019, implementation of the DR and DSM programs is highly recommended for the Jordanian power sector [8].
DR had already proven benefits in Jordan. A pilot project was implemented for the principal consumers of NEPCO with smart meters installed, considering incentives, compensations, and non-peak times price penalties. The pilot project resulted in 6 million dollars indirect savings of operating costs and indirectly increased efficiency in the transmission system with reduced bottlenecks and recommended future expansion on commercial and residential consumers, taking into consideration the effect of renewable energy generation [16]. Figure 1 shows the power demand (MW) for a day in December-2019, together with the wind and solar (PV) energy generated through the day.
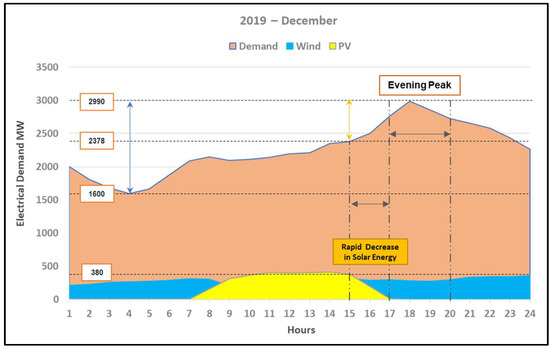
Figure 1.
Jordan’s power demand and renewable energy generation for a day in winter at the end of 2019.
As can be observed in this figure, the evening peak occurs after the rapid decline in renewable energy from 3 to 5 PM, losing almost 380 MW of solar power, while gaining 612 MW in evening load peaking at 6 PM Hence, a deficit of 992 MW needs to be provided by the GO, NEPCO, between 3 and 6 PM, which amounts to 44% of the average load (2256 MW) of that day. It would be highly favorable for the GO to shift and reduce demand from the evening peak to any other time of the day, especially that period with high solar energy. It is notable that, unit commitment planning for optimized power dispatch is based on planning which power plants to operate at what hours. Each power plant has its startup time; combined cycle (CC) power plants need approximately 3 h to operate. Each power plant has different minimum generation limits, depending on whether it operates in a single cycle (SC) or a CC and the number of activated units. Hence, a DR scheme that targets the evening peak in winter can lead to more flexibility in power dispatch operation and shifting from peak power, which forces the GO to operate fast and expensive power plants to ensure reliable operation in peak times. The dual challenge of minimum power and the start-up time of power plants can be solved by using day-ahead unit commitment optimization that relies on day-ahead hourly predictions of the load, power plant availability, energy cost, and available power Egypt’s interconnection. Figure 2 depicts the effects of influencing electrical demand consumption in peak demand periods [17,18]. The price axis represents the cost liability on the GO for meeting specific power demand in the gird, where the cost of producing energy for standard power demand is relatively low, using conventional power generators, but grows extremely high in peak periods. The original demand represented by Demand Curve 1 is influenced by DR at peak time, leading to a decrease in demand (Demand Curve 2) and lower energy prices on the GO.
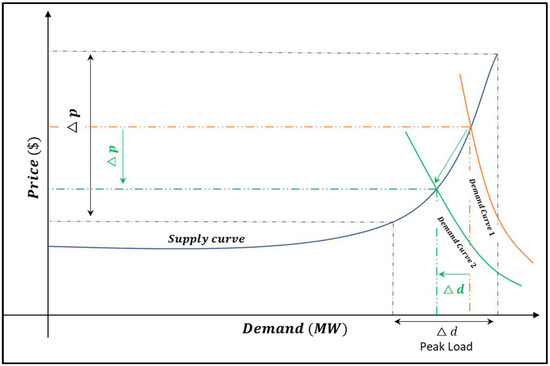
Figure 2.
Standard supply–demand curve of electrical energy markets.
1.2. Literature Review
DR systems can be mainly classified into time-based and incentive-based pricings as well as other subcategories such as direct load control (DLC), demand bidding (DB), emergency DR programs (EDRP), time-of-use (ToU), real-time pricing (RTP), and critical peak pricing (CPP) [19,20]. Aalami et al. introduced a DR model considering interruptible/curtailable loads as well as capacity market programs where they combined the price elasticity of demand model with the customer benefit. Their model applied to the Iranian power grid peak load data can aid GOs in improving the power load curve, while considering customer well-being [21]. Moghaddam et al. introduced a mathematical model for incentive-based and time-based DR programs to consider the correct balance of penalty and incentive rates to achieve DR’s best performance for given demand levels [22]. Baboli et al. discussed observations based on psychology and economy that consumers react differently to both incentive (reward) and price (punishment) based DR systems which are not considered in conventional DR models [18]. Qu et al. proposed an improvement to the price elasticity matrix of demand (PEMD) to unify the modeling of rigid and flexible loads by introducing a weighting factor and measured the effect of price policies and load types on calculating the elasticity matrix [23]. Wang et al. implemented an optimal strategy for both bidding and scheduling for aggregators of distributed energy resources (DER) who manage distributed solar and wind energies and battery storage systems under uncertain consumer response to real-time pricing (RTP) considering uncertainties of renewable energy generation and consumer response [24]. Hlalele et al. presented an optimization model that considers the combination of direct load control demand response and economic dispatch under renewable obligation policies, where the model maintains a predefined renewable energy share in the mix of different energy sources [25]. Zeng et al. proposed a demand response modelling approach for increasing the efficiency of renewable energy deployment, which considers operational improvements and a system planning perspective. Their model captures the correlation of uncertain variables such as renewable energy generation, customer demand and changing responsiveness to DR and utilizes clustering methods to implement a scenario reduction that reduces the computational complexity of the model [26]. Balasubramanian and Balachandra formulated a modeling approach to optimally implement an incentive-based demand response to match the variations of electrical demand and supply. Their model is coupled with a focus on assessing voluntary-based consumer-centric demand response systems that are less complex and cost-effective to other methods [27].
The employment of DR systems depends on precise knowledge of future wholesale electricity market prices and customer demands and future renewable energy generation. Hence, researchers have combined both machine learning algorithms and DR models to overcome these challenges. Lu and Hong proposed a novel real-time incentive-based DR system that utilized both deep learning and reinforcement learning (RL) algorithms combining two deep neural networks (DNNs) for day ahead price and demand predictions [28]. Wen et al. implemented a modified deep learning (MDL) algorithm to predict 24-ahead power demand, prices, and PV energy generation in incentive-based demand response models utilizing recurrent neural networks (RNN) architectures [29]. Pramono et al. presented an improvement in short-term load forecasting for DR systems using an ensemble of two DL approaches; convolutional neural networks (CNN) and long short-term memory (LSTM)-RNN, showing higher performance over conventional models [30]. Table 1 shows recent DR studies systems on multiple scales of the residential sector using different DR schemes.

Table 1.
Recent studies on Residential DR systems.
1.3. Research Gap and Originality Highlights
Very few studies discussed the possibilities of DR and DSM in Jordan. Tawalbeh et al. addressed the potential of residential peak shaving to reduce peak demands [38]. They showed that an average of 3.5 kWh of peak load reduction per day could be achieved through adjusting the residential tariffs in peak times from 5 to 8 pm, using TOU pricing. Another research conducted by Jarad and Ashhab emphasized the potential for energy saving in the Jordanian residential sector through energy efficiency measures, where they reported a saving of 15% in energy consumption and 22% in cost could be achieved through the use of efficient lighting and solar heaters by applying for an hourly analysis program (HAP) software [38]. The insight gained from these studies highlights further the potential of DR in giving more incentives for residential and commercial users to pursue energy-efficient electrical appliances and usage. However, this potential has not yet been exploited because there is no understanding of the factors that amplify this potential. This is mainly due to the lack of a conceptual framework and methodological approach that can be applied to a robust data set to quantify the main implications of using DR applications in the Jordanian power sector. This research aims to fill the gap by presenting a detailed day-ahead price-based demand response model for the residential sector in Jordan with the following contributions:
- A well-defined and optimized deep learning model for accurate day-ahead hourly short-term load forecasting (STLF) is trained on four-years of Jordan’s hourly electrical demand from 2016 to 2019. The model’s architecture and input features follow state-of-the-art feature engineering based on recent research discussed in detail. Up to date, there are very few Jordanian case studies that examined daily hourly STLF rather than day-ahead hourly STLF, such as [39], where they used only one year of electrical demand data. This research proposes a new set of time series features that are novel to previous works on Jordan’s electrical demand forecasting.
- A comprehensive demand response model for the Jordanian power sector is introduced, considering the interaction between the power generators (PGs), GOs, and service providers (SPs), which uses the estimated day-ahead hourly demand STLF, considering the detailed data on generation capacities and costs of Jordan’s power suppliers as well as bulk consumers’ peak load and bulk supply prices. A precise PEMD estimation was implemented for Jordan’s residential sector based on recent research on the short-term price elasticity of Jordan’s residential and the analysis of the different types of electrical appliances and their daily operational hours according to the latest surveys and studies present. To the best of our knowledge, this is the first study in Jordan’s electricity market to estimate the DR impact on the residential sector and find the potential implications in peak demand reduction and generation savings.
2. Jordan’s Electricity Sector
Figure 3 shows the overall architecture of the Jordanian electricity sector, which is mainly composed of three layers: generation, transmission, distribution, and consumers [40]. NEPCO, operated by the government, manages acts as the GO of the power grid under a single buyer model as well as the transmission sector operator. The long-term strategy of the power grid is under the responsibility of the Ministry of Energy and Mineral Resources (MEMR), whereas the Energy and Mineral Regulatory Commission (EMRC) is responsible for establishing regulations and licensing on all levels of the power grid from generation to distribution as well as setting laws and tariffs in the electricity sector [40,41]. Generation is mainly composed of thermal power plants with the respective nominal generating power shown in Figure 3. Generation capacities can be slightly higher or lower depending on hot or cold seasons. Generation can be classified into: Government-owned/partially owned power plants, independent power suppliers (IPPs), and the Egyptian interconnection. The government holds 100% of the shares of the Samra Electricity Power Company (SEPCO), being the largest energy producer, while having only 40% of the shares of the Central Electricity Generation Company (CEGCO), being the second-largest energy producer. Distribution compromising the bulk energy supply is composed of three private distribution companies: Jordan Electric Power Company (JEPCO), Irbid District Electricity Company (IDECO, Jordan north area), and Electricity Distribution Company (EDCO), that are distribute energy to consumers in the central, northern and southern parts of Jordan respectively [40]. Besides, two categories of large energy consumers (principal consumers), PC1 and PC2, are a part of the bulk energy supply. The consumption load types and percentages are calculated according to the 2019 NEPCO report, without taking into account the PC1 and PC2, where domestic and governmental consumers reach up to 49.1% of the main energy consumption, where 6% of it accounts for the governmental buildings and 1.5% for others [8].
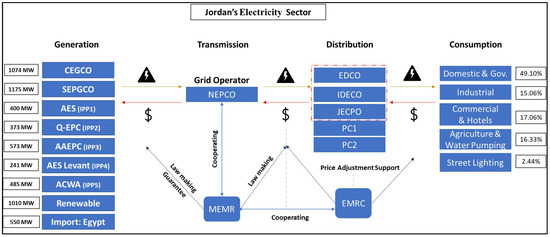
Figure 3.
Jordan’s electrical sector—2019.
The renewable energy capacity only includes the transmission level suppliers, not the distribution and consumer level generation. Jordan is interconnected with Egypt with a total capacity of 550 MW, utilizing a 400 kV submarine cable, where up to 250 MW can be used according to energy availability and other factors, while the rest are reserved for operational purposes [42]. Table 2 shows the details of each respective power supplier by 2019 [40].

Table 2.
Jordanian power plants—2019.
The average costs shown in Table 2 are based on NEPOC’s 2019—annual report, which are calculated according to the total amount of energy purchased divided by the total amount of money paid to the respective power plants in 2019 [8]. Generation costs include many factors such as the base costs, capacity costs, daily unit start-up costs, fuel price. RISHA is a special case, where its natural gas is extracted from Jordan; hence it is always maxed out according to the available gas. IPP3 and IPP4 are the most expensive units since they are composed of small and fast starting 15 MW generators that are used in peak demand when sudden and rapid changes in energy demand occur. Renewable energy is under the contract of take-or-pay, where unit commitment scheduling and operation aim to utilize all the energy produced. All power plants operate on natural gas as a primary fuel, where heavy and light fuel oils (HFO and LFO) are used as secondary fuels. Table 3 shows the five bulk consumers, which are the main customers of NEPCO, with JEPCO being the largest consumer with 61.26% of peak demand, out of all the bulk consumers. The bulk supply prices are categorized into: day energy pricing from 8:00–24:00, night energy pricing from 00:00–7:00, and peak tariff, which depicts the demand capacity cost of the highest hourly electrical demand within the period of peak demand tariff as announced by MEMR in the day with the highest electrical demand as can be seen in Table 4 [43,44,45]. The peak periods are between 5:00 PM and 9:30 PM, representing the evening peak where the demand is highest throughout the year. The total peak demand of the three distribution companies accounts for almost 96% of the total peak demand in the bulk consumer, which shows there is great potential for the DR system targeting their respective consumers. As previously discussed, domestic and governmental buildings account for almost 49% of their energy consumption.

Table 3.
Bulk supply prices and peak demand 2019.

Table 4.
Peak tariff periods for 2020.
3. Problem Formulation
3.1. DR Optimization Model
A dynamic price or incentive-based hourly DR is extremely invasive to consumers since they are less likely to have enough time to reschedule their demands well ahead of time and be more stressful for residential consumers. Hence, a day ahead DR model is more appropriate for residential consumers, having enough time to adjust the loads impacting their electricity bills the most, and incentivizing them to increase their efficiency in energy usages, such as optimizing their heating and cooling loads. The proposed DR model in this study is depicted in Figure 4, which is supposed to be implemented by the GO targeting the residential consumers.
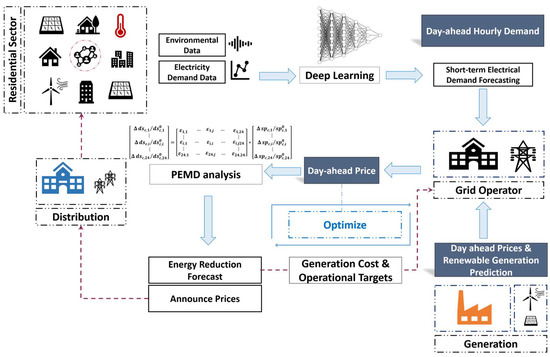
Figure 4.
Proposed day-ahead demand response model for Jordan in this study.
Precise day-ahead information on electrical demand, generation availability, generation costs, and the expected amount of renewable energy generated are highly crucial to implementing the DR system [17]. The GO (NEPCO) aims to reduce the cost of energy production, especially at peak periods, to reduce the expensive energy purchased from IPP3 and IPP4, while increasing the demand in off-peak periods to maximize its net profit. The DR system can influence consumer behavior from peak to off-peak and allow the grid higher flexibility acting as a safety margin in cases of high expected demand. NEPCO’s main responsibility is to implement a precise day-ahead hourly demand prediction to estimate the demand every hour for the next day. Since the GO, as per grid regulations, provides the fuel for the power plants, the day-ahead cost of energy purchase is correlated to fuel prices known by the GO; therefore, the generation costs are given. Furthermore, the GO utilizes the PEMD to predict the effects of different prices on the residential consumers and decide the best price to achieve the required goals relating to peak demand reduction and off-peak filling by increasing the prices at peak loads and reducing them at off-peak periods. It is noted that the prices are announced to the distribution companies at the start of each day, where they announce them to their consumers through specially designed schemes.
In this study, it is assumed that the generation schedule is given through unit commitment analysis done by the GO by communicating with the power suppliers, where the renewable energy plants also provide the renewable generation predictions. The profit-seeking maximization model of the GO, considering the Jordanian power grid consumers, excluding the energy exports, can be expressed by:
Subject to:
where is the income at hour from the bulk consumer of type , which is a function of bulk supply price ()and the demand sold () at hour for consumer . is the cost purchasing power from power supplier at hour , which is a function of the buying price () estimated by the average prices shown in Table 2, and the demand purchased (). At each hour , all the costs of purchasing demand from each depict the total hourly cost depending on which power plants were utilized, according to the unit commitment by the GO. is the peak capacity income per consumer which is a function of the highest demand peak () for the respective consumer and their demand peak price (). ps denotes the total power supply units utilized at the respective hour. and are the upper and lower ranges of the bulk supply price, as determined by the GO.
and represent the self and cross-price elasticities of demand, respectively, where they capture the effect of electricity price change for customers on their electricity consumption. This relationship lies at the heart of DR systems to determine the price set by utilities to achieve economic benefits in the power market and technical benefits related to the operation of the power system [19]. To capture the price elasticity of demand on 24 h under the assumption that the rescheduling of the production does not go beyond a 24-h interval, the PEDM is formulated as [19,20]:
The PEMD relates the effect of the change of price in any hour of the day depicted by to the change in demand of the hour itself as well as other hours depicted by represents the self-elasticity, which relates the change of price in the period to the change in demand in that period, whereas represents the cross-elasticity, relating the change of demand in hour i to the change in price in another period j, which are shown as and in Equation (2), respectively.
The proposed model was developed under the following assumptions:
- Daily environmental and residential demand data are available with an hourly sample rate.
- The day-ahead generation electric power prices are available as a single value for each power plant.
- The day-ahead selected power plants for dispatch by unit commitment are available for each day.
- Both self-elasticity and cross elasticities for each hour are known and available for the grid operator each day, where they were assumed constant in this research.
- The demand response algorithm is run and implemented at 00:00 of the new day, when the final demand hour of the previous day is received, then the new prices are announced up to 24 h.
- The response to the change in prices for the residential sector is assumed at the distributer level, where when the distributer receives the new prices, they have their methods of implementing the DR to each different section and types of their consumers by means of having the same effect as if the prices where directly increased for the consumers.
3.2. Consumer Behavior Modeling
The PEMD reflects the consumer response to a DR program which is represented by the values of self and cross elasticities, as well as their distribution in the PEMD, where different DR policies and consumer response patterns to the price change can impact the estimation of the PEMD. Figure 5 represents the two types of PEMD modeling a day-head DR policy and an hour-ahead DR policy . In day-ahead DR polices, prices are announced one day earlier or at the start of the day, where consumers can re-schedule their demand for each interval of the day, hence all elements in the PEMD can be non-zero. Whereas in hour-ahead DR, consumers can only reschedule the price of the next hour, where they only have information on the current price and hour ahead price, hence it is unlikely that they can reschedule their demands ahead of time, making all cross-elasticities above the diagonal zero [23]. Some researchers considered all off-diagonals to be zero in this case [24].
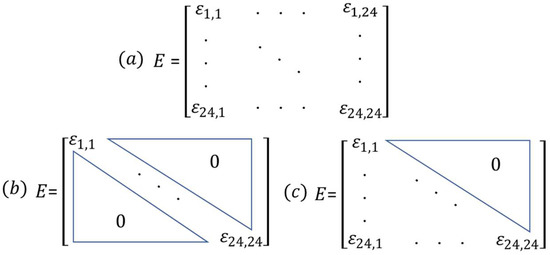
Figure 5.
PEMD under different policies: (a) day-ahead DR, (b,c) hour-ahead DR.
The PEMD estimation is also correlated to how consumers in different markets reschedule their demands to different hours of the day, represented by the cross elasticities’ distribution in the PEMD. Figure 6 shows the different types of consumer rescheduling, which can be assumed into five different categorical behaviors [46]:
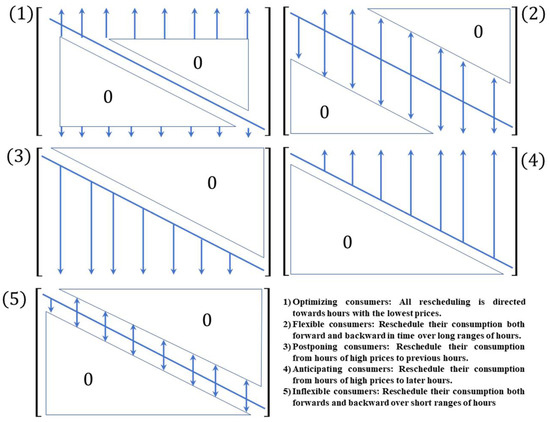
Figure 6.
Different consumer rescheduling behaviors in DR markets.
The categories of behaviors for day-ahead demand response are (1), (2), and (5), where the last two are the most probable, as it is unlikely that consumers are extremely optimized to fully reschedule their demand to hours of least price. The difference between flexible and inflexible consumers is the time horizon to where demand at a certain hour is rescheduled to other hours of the day, depicted by the arrow lengths in Figure 6. The selection of this horizon is based on a detailed analysis of the types of loads that exist, where water heating, for example, can be shifted to a larger time horizon prior to periods of high demand than other appliances such as lighting [47].
3.3. Day-Ahead Hourly Demand Estimatio
In this study, the deep neural networks (DNNs), which have widely been established and used in different fields, especially macroscopic short-term load forecasting (STLF) of electrical demand, are utilized and trained to perform the demand prediction [48,49]. DNNs are neural networks with more than three layers [50], used for supervised learning, in which the algorithm trains the computer to learn from given data and make future predictions or classifications. As can be seen in a [28], due to their intricate connections and nonlinear activations, DNNs can model any non-linear function [51].
Neurons are the building blocks of a neural network, as shown in Figure 7b [50], where the output for the th neuron in hidden layer with an activation is depicted as follows:
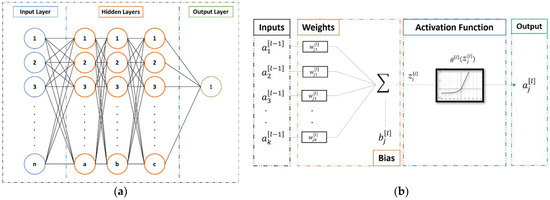
Figure 7.
(a) Neural network representation, and (b) a single neuron.
represents the output of the neuron prior to the activation in the hidden layer , where is the weight vector of that neuron, is the bias and is the input to the neuron from the th training example. The choice of greatly affects the performance of training the network. A detailed comparison of the popular activation functions currently in use and their comparison can be found in [52]. In this study, the exponential linear unit (Elu), which is an improved variant of the RELU (rectified linear unit), is used as the activation functions due to its higher speed of converging and performance [53], better sparsity [54] and avoiding the dying neuron problem where the saturation plateau in its negative region allows for more enhanced learning of robust representations [52].
The main objective of training a neural network is to update all the weights and biases in the hidden and output layer to decrease the error of the neural network, where the mean squared error (MSE) is used for regression problems. The total error is calculated by forward propagating the input data into the network and is used to measure the performance of the neural network at each training iteration, and the error function is used with the backward propagation algorithm to update the parameters ()s of the model using gradient descent [55]:
In the above equation, each weight at training step t is updated by calculating the partial derivative of the error function relative to each parameter in the network using the chain rule. denotes the learning rate and determines the speed of gradient descent, where choosing a very big value might cause the model not to converge towards the global minimum or too low a value slows down the learning process. Currently, there are advanced versions of gradient descent, with the most popular being momentum [56], RMSprop [57], and adaptive moment estimation (Adam) [58]. Since Adam is a combination of both momentum and RMSprop, it has been used in this research for its well-known high performance, with more details found in [55].
Finally, Figure 8 depicts the training and tunning process for the proposed deep neural network model used in this study to predict the day-ahead 24-h demands. The model predicts the day-ahead demand at a specific hour starting from the end of the previous day; the model is run 24 times to predict the next day’s hourly demand hour by hour. The selection and detailed analysis of the input features is discussed in detail in the following section. The four-year hourly demand dataset was split into 90% training data to train the model, 5% validation data to tune the hyperparameters and select the best architecture, and 5% testing data coupled with the last month of 2019 used as a final test of the model’s generalization performance. Achieving high prediction accuracy is essential for the DR model and is achieved through careful feature selection coupled with selecting an optimal neural network architecture. In addition, since deep neural networks are prone to overfitting, both regularization [59] and the dropout [60] techniques were applied coupled with early stopping to increase the generalization performance of the model [61]. The final model performance is compared across all the data splits mentioned using the mean absolute percentage error (MAPE), and the root mean square error (RMSE) [62].
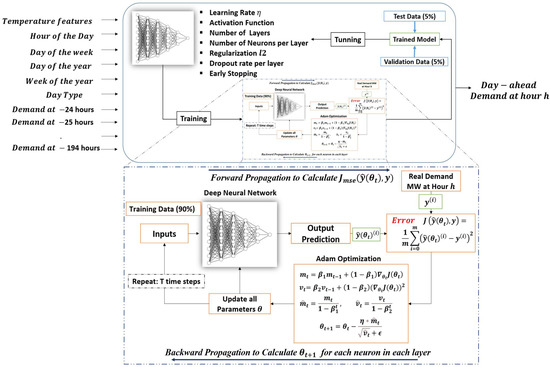
Figure 8.
Day-ahead deep learning model for demand prediction at hour h.
4. Results and Discussion
4.1. Day-Ahead Hourly STLF
4.1.1. Electrical Demand’s Feature Analysis Results
In this study, the four-years hourly electrical demand of NEPCO between 2016 and 2019 is used to train the deep learning model to predict the day-ahead hourly STLF for the Jordanian power grid, which is shown in Figure 9. It can be observed that, the highest peaks out of all the years happened in 2019, reaching 3380 MW in winter. It is due to the increase in urbanization, growth in population, as well as the rise in penetration of different types of electrical appliances to households, while for the same year, the lowest demand was recorded at 1195 MW in spring.
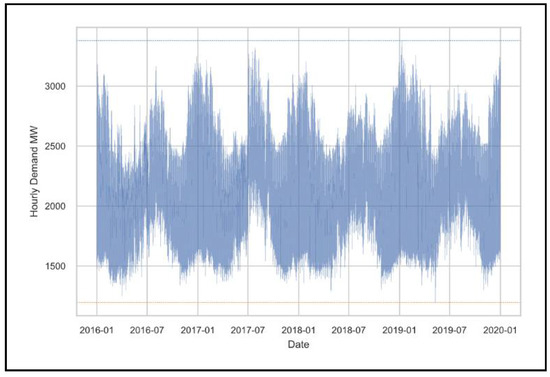
Figure 9.
Yearly variation in Jordan’s electrical demand.
The electrical demand is a highly complex time series that is a function of human daily and seasonal behaviors and weather conditions, making it heterogeneous and uncertain. In Figure 10 the weekly variation of the electrical demand is represented by the probability density distribution for different days of the week. An apparent increase in peak demand occurs from Saturday through Wednesday, then declining towards Friday, where Friday and Saturday represent the weekend holidays. As previously shown in Figure 1 the daily demand is also affected by the hour of the day, where the peak demand occurred for that specific day at 6 PM, while the lowest occurred at 4 AM. Hence, time-series features such as an hour of the day, day of the week, as well day of the year carry essential information for the STLF [63]. In Figure 11, and for each quarter of the year (Q1–Q4), where Q1 represents the first three months starting from January, the variation of hourly demand with the change of temperature is shown. Electrical demand peaks at winter (end of Q4–Q1) and summer (end of Q2–Q3) temperatures, as consumers are more likely to use space heating and cooling. On days characterized with thermal comfort between 20 and 30 °C, the average demand is lower. The curves on top and to the right of the figure show the probability density distribution for demand and temperatures per quarter, where it can be observed that the third quarter depicting two thirds of the summer season, had the highest demands on average.
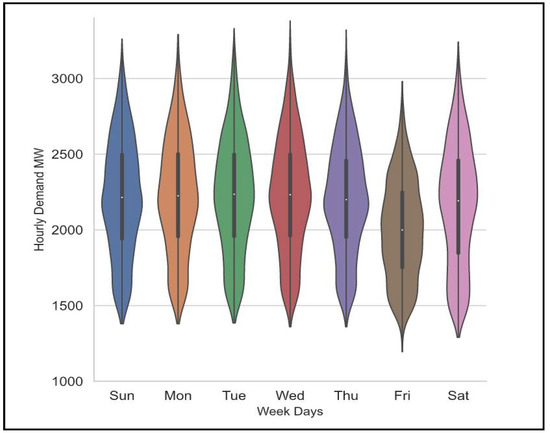
Figure 10.
Weekly variation electrical demand, 2016–2019.
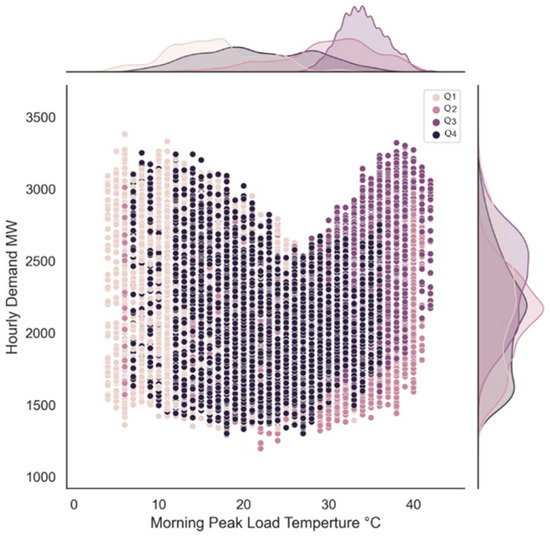
Figure 11.
Demand vs. morning peak load temperatures, 2016–2019.
Finally, the autocorrelation analysis represents the correlation of the demand at a certain hour to its lagged values shown in Figure 12 indicating which previous hours of the demand hold the highest correlation to be used as predictive features in STLF [21,58].
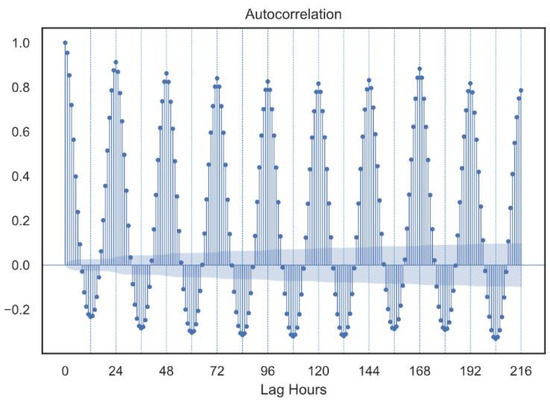
Figure 12.
Autocorrelation of the electrical time-series signal with previous hours.
Lagged demands at (−1, −24, −168, −48) hours showed the highest correlation, respectively, representing the demand at the same hour in the previous two days in the current week and the same day in the prior week. Table 5 illustrates the exogenous features related to demand at the hour to be predicted. The endogenous features related to the demand at previous hours of the week are given in Table 6.

Table 5.
Exogenous related to demand at the hour to be predicted.

Table 6.
Endogenous input features related to the demand at previous hours of the week.
In the above tables, the first three features are assumed to be collected from day-ahead weather predictions at the times of the expected morning, evening, and minimum peak times of the day where the demand is to be predicted. Features 4 to 16 represent the time series features, specifying the hour of the day, day of the week, day of the year, week of the year, and whether the day is a national holiday, the month of Ramadan, or a typical day [28,63]. The lagged demand features were selected according to the autocorrelation analysis, where [28] considered the previous two days only, which can make a problem when weekends are involved as discussed by [63], hence, the same day and its previous day from the last week were used as inputs to the model.
4.1.2. Deep Learning Model’s Training and Optimization
The Deep Neural Network architecture has been selected based on sensitivity analysis, where the four-year hourly demand data was split into 90% training data to train the model, 5% validation-data to tune the hyperparameters and select the best architecture, and 5% testing-data coupled with the last month of 2019 used as a final test the model’s generalization performance. The data were then normalized using the Z-scoring method relative to the training data’s mean and standard deviation. A sensitivity analysis was used to select the final model’s hidden layers’ (referred to as HL) configuration shown in Table 7.

Table 7.
Final deep neural network architecture.
The architecture starts with a high number of neurons, then descends to lower numbers, which aligns with recent works such as [48], and the elu activation function showed slightly higher performance than the RELU activation function. Dropouts were only applied to the first two layers, which showed better performance in combination with regularization. Table 8 shows the final performance results for the training, validation, and testing data.

Table 8.
Final deep learning model results on training, validation and testing data.
The MAPE error for the test data achieved a 1.411% error, just above the validation and training error; hence, the model achieves good generalization and high accuracy. Finally, the predictions of the last month of 2019, which is the final test of the model as it was not used to train the model, similar to the validation and testing data, are shown in Figure 13. The final model prediction results achieved a MAPE error just above the testing data at 2.03% since it is the hardest to predict at the end of the training period. This shows the importance of the continuous training of the model every day when new data is acquired to sustain high accuracy and generalization.
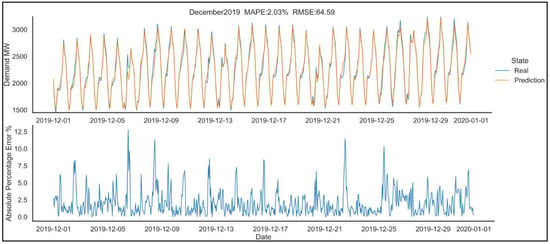
Figure 13.
December-2019 prediction results.
To better investigate the occurrence of high errors in the proposed prediction in Figure 13 and Figure 14 depicts the hourly Absolute Percentage Error for each day in December 2019, where each day has been labeled according to its weather description as observed in NEPCO’s data. First, the relatively high errors can occur between 8:00 and 17:00, with the largest errors being mainly in the range of 10:00 to 13:00 around noon time. High prediction errors can occur for many reasons that cause an abnormal change in consumer behavior or affect the production of PV energy on distribution levels. It can be observed in the figure that rainy days such as the 6th, 8th and 9th of December had very high errors during noon, this can be related to more people staying in the door as well as a reduction in distribution and consumer level PV production that the grid operator sees as a sudden increase in electrical demand as was observed in Figure 13. Cloudy days, depending on the area of cloud coverage in Jordan and the time of cloud coverage, can also disrupt PV generation, as can be seen in both the 2nd and 10th of December from 11:00 to 17:00. On the 25th, the Christmas holidays could be a critical factor for the change in morning load between 8:00 and 10:00, causing higher errors in the period. Finally, regarding Sunday, the 22nd of December, a sudden change in demand was traced for the 4 Sundays from the 1st to the 22nd, for example, at 11:00 going from 1876 MW, 2519 MW, 2354 MW to 2118 MW on the 22nd. The first major increase in demand was due to both the rainy day observed and a large decrease in temperature, dropping from a 21 °C morning on the temperature on the 1st to a 12 °C on the 8th, then the temperature slowly rose to 13 °C then 18 °C at the 22nd. Since the model relies on the demand from the same day at the previous week as one of its features, these sudden changes in weather conditions can have a significant impact on any specific day that has a large change in demand, especially at certain periods, and especially that Sunday depicts the starting day of the working day in Jordan.
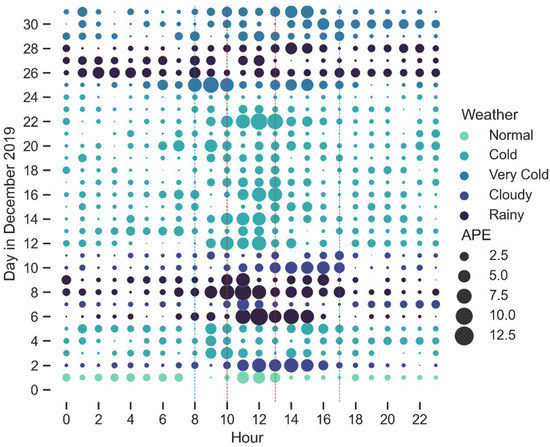
Figure 14.
Absolute percentage error of the forecasted results in December 2019 and related weather conditions.
4.2. PEMD Analysis
4.2.1. Residential PEMD Analysis
Pre-implementation of DR requires a well-established estimation of the PEMD to analyze the impact of price ranges on demand. The short-term price elasticity is the best estimation for self-elasticity () as it shows the negative relationship between price and demand change in short periods. Based on an analysis of residential tariffs for the periods between 1984 to 2014, the short-term price elasticity of electrical demand for the residential sector in Jordan was estimated at −0.0575 [47].
Although, since price responsiveness of demand varies at different hours of the day, two scenarios are assumed: (1) is assumed constant for every hour, (2) is assumed to be double in peak periods. Hourly cross-elasticity represents the amount of energy shifted from one hour to other hours of the day both backwards and forwards in time. To estimate the amount of potential shiftable energy in peak load hours, as well as its time horizon, a detailed analysis of the different loads impacting DR and their penetration in the residential sector is conducted, which is represented in Table 9.

Table 9.
Power consumption and penetration rates of different electrical appliances in Jordan’s residential sector.
The data in Table 9 was used to estimate the normalized weight of each appliance’s energy consumption relative to other appliances, which is shown in Figure 15. The figure depicts an estimation of the weight of each appliance’s share of the residential electrical demand for the loads discussed in this study, where it is more probable that it holds in the evening load period when consumers return from work and need to use both water and space heating.
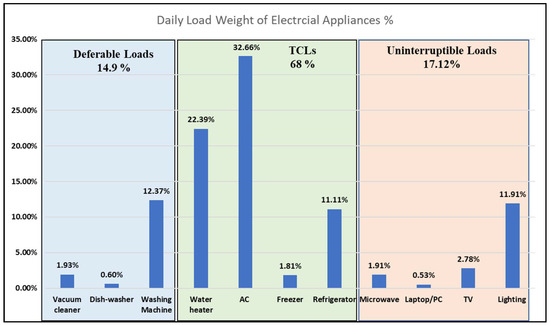
Figure 15.
Daily load weights of electrical appliances in Jordan’s residential sector.
Residential loads can be classified into different types according to their flexibility and DR characteristics: Thermostatically controlled loads (TCLs), deferrable loads, uninterruptible loads [66]. TCLs are highly correlated to temperature and environmental factors, where due to their thermal storage properties, their demand can be more flexible with a lower impact on consumer comfort. Deferrable loads refer to appliances that are flexible to use and can also be shifted with low impact on consumer comfort. Finally, uninterruptible loads refer to the appliances that require continuous energy demand while being used and are highly correlated to consumer comforts where they usually have little DR potential. Both TCLs and deferrable loads are estimated to represent 82.9% of the residential sector which amounts to a significant potential for DR in Jordan’s residential sector. Water heating and deferrable appliances can be easily shifted in peak demand periods resulting in peak shaving. According to the previous discussion, cross-elasticity is estimated under two scenarios related to the amount of energy re-allocated in peak time:
- A lossless-case scenario: Reduced energy at a certain hour is re-allocated into other hours of the day without a loss in total energy consumption. Hence, the summation of all cross elasticities in every column in the PEMD is equal in magnitude to the self-elasticity at that hour.
- A 75% re-allocation scenario: 75% of the reduced demand is re-allocated to other hours, and 25% is not used by the consumers, such as lighting, TV, or AC usage that users simply do not use again. Therefore, the summation of all cross elasticities in every column in the PEMD is equal in magnitude to 75% of the self-elasticity at every hour.
4.2.2. Peak Period DR Policy Impact on PEMD Estimation
The proposed DR policy in this study is implemented by changing the peak-period prices only to reduce the peak-load according to operational and security goals of the GO, which has a direct impact on the estimation of the DR behavior of the residential sector. The period of DR is assumed to start one hour before (4–5) PM and after (8–9) PM the announced peak periods that were discussed in Table 3 for the winter season are constant for the whole period. The PEMD under this price policy in the winter peak-time is depicted in Figure 16, where it incentivizes consumers to shift their energy consumption outside of the peak demand period only due to the constant peak period price. Since the prices only change in the peak period, the areas on the left and right of the peak period are ignored and were considered zero based on the policy proposed.
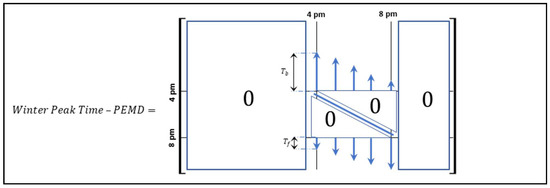
Figure 16.
Winter peak time—PEMD under the proposed DR policy.
Consumers are inclined to shift their demand to the closest hours outside of the peak period [67], as depicted in Figure 16. The time-horizon (: backward time horizon and : forward time horizon) of the demand re-allocation depends on the type of appliances shifted. In the case that most of the appliances shifted are deferrable loads or water heating, it is assumed that the time-horizon of shifting is 4 h closest to the hour under peak pricing, where the cross-elasticates have the same value as reported in Table 10. It is also assumed that, in the last hour of the peak period, a part of their demand is shifted to the next day after 24:00, which is not considered in the current PEMD models. If more AC usage is shifted, the weight of the cross-elasticity of the peak hour period is doubled for the closest 2 h, as represented in Table 11.

Table 10.
Base self-elasticity, lossless PEMD with no AC shifting scenario.

Table 11.
Base self-elasticity, lossless PEMD with AC shifting scenario.
Table 12 shows the structure of the finalized PEMD in this study. Cases 1 to 4 represent the base self-elasticity which equals the short-term self-elasticity for the residential sector of Jordan, while Cases 5 to 8 assume that the peak period will have double the elasticity. Cases [1,2,5,6] represent a lossless PEMD, where the summation of the cross-elasticities is equal to the cross elasticity in magnitude, while their counterparts take the 75% case scenario mentioned previously. Finally, cases [3,4,7,8] consider more AC usage participated in DR, where the second level of cross elasticity (L2) with double the weights of (L1) is used, as was shown in Table 10 and Table 11.

Table 12.
Finalized PEMD.
4.3. Dispatching Scenario and Prediction Performance
To simulate a real dispatch case scenario, the unit commitment and dispatched power plants for a day in December- 2019 were acquired coupled with the expected demands for that day as predicted by NEPCO. The detailed information of the dispatched power plants is given in Table 13. All units for that day operated with combined cycles with their real capacities shown. The available power from Egypt is assumed at 150 MW for the whole day with priority above IPP4 and Risha’s power at maximum capacity with its cost not considered, being based on natural gas extracted from Jordan. The real hourly PV and wind energy from renewable power plants are assumed to be the predicted values and are subtracted from the demand, then the table is used to find the cheapest combination.

Table 13.
Power plant dispatched for the case-study in December 2019.
Figure 17 shows the real and predicted values of electricity Sunday, 8 December 2019, as well as the PV and wind generation, where Sunday represents the start of the working week in Jordan. The proposed model’s prediction achieved a MAPE of 3.59% and is compared to NEPCO’s prediction, which performed worse. One reason is that NEPCO’s prediction is usually provided before 4 PM in the previous day, while our model achieves the prediction of the whole day at the end of the previous day. Nevertheless, the proposed model achieved higher results throughout the period. It is to be noted that, hour 0:00 indicates the average demand from 0:00 to 1:00.
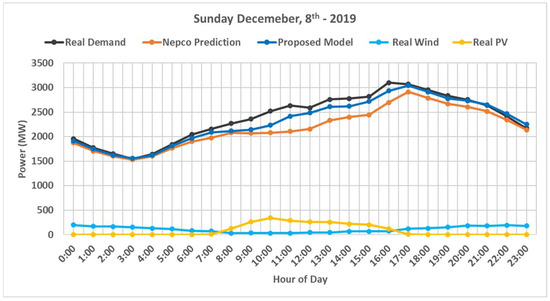
Figure 17.
Selected case study day in December 2019.
4.4. Day-Ahead Demand Response Model for the Selected Case Study
The proposed day-ahead DR system for the residential sector’s demand is shown in Figure 18, which was applied to a selected day in December 2019. The contribution of JEPCO, IDECO, and EDCO in providing the total residential electricity demand is considered about 32.4%, 5.08%, and 9.98%, respectively. This is calculated by multiplying the peak power of each distribution company by the percentage of residential and commercial energy consumption for each company. The estimated demand is also used to calculate the amount of power purchased from each power plant, after deducting the usage of the renewable power. Finally, after the peak bulk prices are selected for each distribution company, the model is applied to each PEMD case scenario to estimate the potential generation cost savings, peak demand reduction, and load factor improvements.
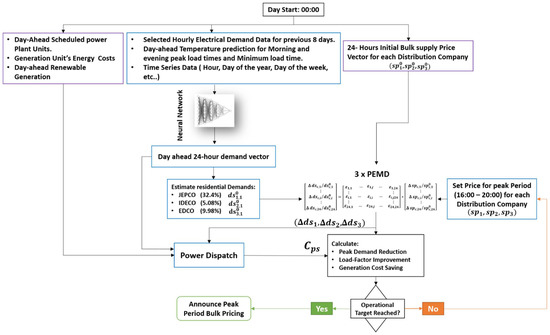
Figure 18.
Applied Day-ahead DR Model for a selected day.
4.5. PEMD Scenarios Analysis
The day-ahead DR model was applied to all the PEMD case scenarios discussed in Table 12, assuming the maximum peak prices for the period of each distribution company to be set at 200%, 250%, and 300% of their initial values. The three different price scenarios were applied to the profit maximization model presented in Equation (1) by maximizing the daily profit from the three distribution companies without considering the monthly capacity charge. Figure 19 shows the impact of applying the proposed DR model on Sunday, 8 December 2019, considering all case scenarios. The profit maximization model always selects the maximum peak price for the given price scenarios.

Figure 19.
Hourly demand impact of DR-model under different case scenarios.
It can be observed that, the PEMD cases scenarios [C1–C4] show a lower peak drop in the peak period due to having lower price elasticity in comparison to [C5–C8], indicating the higher the peak period price, the higher the peak drops in the peak period. The periods after and before the peak period, especially from 2–4 PM and 9–11 PM, are extremely important. This is because the demand removed from the peak period is rescheduled towards them. Therefore, the new peaks might form, especially in case scenarios with high self-elasticities [C5–C8], indicating the more demand is reduced in the peak period, the higher the new peaks’ demand is. C6 represents the worst-case scenario, especially at higher peak prices, representing a lossless-PEMD with double the weight for the closest two hours outside the peak period. C2 represents the highest new peak formed among the cases [C1–C4], although since it has half the self-elasticity of C6, the new peak was not as severe.
There is a clear trade-off between the demand reduced from the peak period and newly formed peaks. Figure 20 shows the peak reduction percentage for the whole day for each case scenario. C6 shows an increase in the peak by −1.46% at 300% peak price. It is noted that, in the case scenarios with low self-elasticity [C1–C4], a price increase leads to a steady decrease in the day’s peak demand. In contrast, in the cases scenarios with high self-elasticity [C5–C8], higher prices can lead to a lower day’s peak reduction due to the newly formed peaks. More than 5%-day peak reduction can be achieved in most cases except for C2 and C6, which are the worst cases among all case scenarios. C6 was the only scenario to show an increase in peak demand at 300% peak price, which is due to two main reasons: first, C6 depicts the high self-elasticity scenario where consumers are highly responsive to the price change, leading to more demand being shifted to hours outside of the peak period. Secondly, C6 depicts the scenario with both the lossless case where all demand removed from any hour will be allocated to other hours and the case where the weight of demand shifted to the closest two hours is doubled. Hence, the higher the price increase, the more demand is re-allocated with a higher concentration on the hours outside the peak period being 15:00 and 21:00, as seen in Figure 19. Other cases such as C5 had a slightly less bad case at 300% peak prick as there was an even redistribution of demand reallocated to the surrounding 4 h of the peak period, making the newly formed peak less than C6, while in C8, there was 25% less demand shifted, making the new peaks also less than C6. Although the peak price is low enough in high elasticity scenarios, even with more demand shifted to closer hours, a high peak reduction can still be achieved.
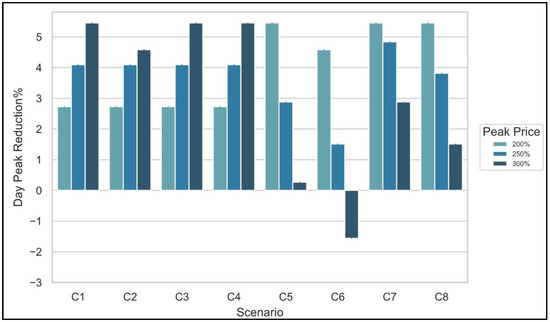
Figure 20.
Day peak demand reduction percentage.
The load factor is calculated by dividing the mean demand for the whole day by the maximum demand. Figure 21 represents the comparison between the load factor for each scenario with the original demand. The results show that, the load factor can be improved around 5%, by setting high prices in low self-elasticity cases and lower prices in high self-elasticity cases.
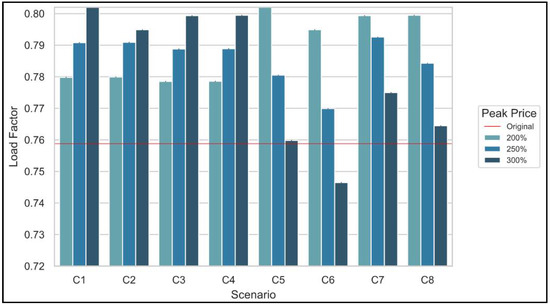
Figure 21.
Load factor analysis.
The main objective of the DR program is to reduce energy consumption from costly peak power suppliers. Figure 22 shows the amount of saving in electricity usage from IPP3, which is the most expensive power plant, where both cases C8 and C7 achieved the highest savings, especially at 250% peak pricing. It is also notable that, the worst-case scenario (C6) at 300% peak pricing also achieved savings, which is mainly because the new high peak formed at 9 PM has a smaller width (time horizon) than the original peak and drops more sharply, whereas, for the peak formed at 3 PM, PV power was available. This shows the importance of shifting demands towards periods where renewable energy is available, where in this case, even if the peak demand increased, the overall demand from IPP3 can still be reduced. Cases [C3, C4, C7, C8] achieved better savings in both self-elasticity scenarios, since 25% of the demand reduced at each hour in the peak period is removed from the grid.
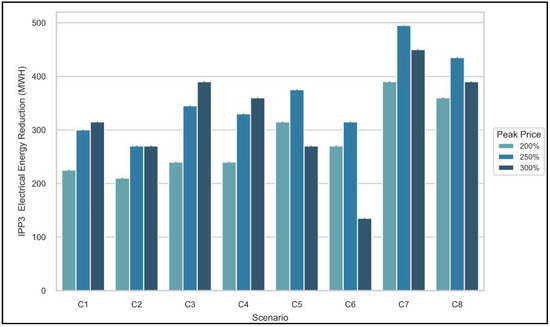
Figure 22.
Savings in electricity purchased from supplier IPP3.
Figure 23 shows the energy cost savings in all scenarios. Energy cost-saving does not follow the same pattern as energy saving because the decrease in electricity purchased from IPP3 causes an increase in IPP4 power usage in hours, where the demand rises from 2 PM to 4 PM and 9 PM to 11 PM. The best- and worst-case scenarios in cost-saving are C7 at 300% peak and C2 at 250%, with the detailed results of the peak reduction, load factor, and cost-saving for each case scenario are reported in Table 14 and Table 15 and the best results based on peak prices for each case are highlighted in green.
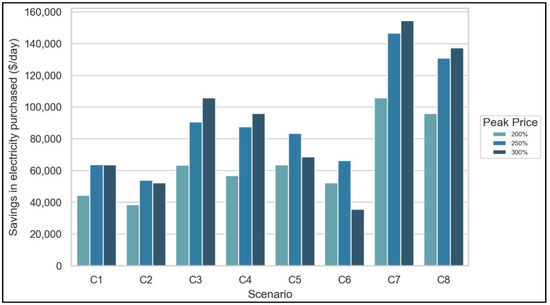
Figure 23.
Cost saving.

Table 14.
Cases [C1–C4] results.

Table 15.
Cases [C5–C8] results.
The results revealed that, in the case scenarios with base self-elasticity, the best improvement on all indicators could be achieved by increasing the prices, especially in C3 and C4, where due to the low-price elasticity in the peak time, newer high peaks after and before the peak period were not formed, as less energy was removed from the peak period. In these cases, peak demand reduction ranged from 4.582% to 5.458%, load factor rose to (0.780–0.802), and cost savings ranged from 53,856 to 105,859 dollars per day. The higher peak period price elasticity, the higher demand shifts from the peak period caused newer peaks to form at high energy prices.
The highest energy cost reductions do not align with the other indicators, ranging from 66,149 to 154,505 dollars. This indicates that the prices should be set based on the priority of the GO, whether direct profit in terms of cost-saving has higher priority or indirect profits by peak reduction and load factor improvement that increase operational performance. The power plant shares for the C7 having the best cost saving at 300% peak price can be seen in Figure 24, where the share of power purchased from IPP3 was reduced from 1.49% to 0.68%.
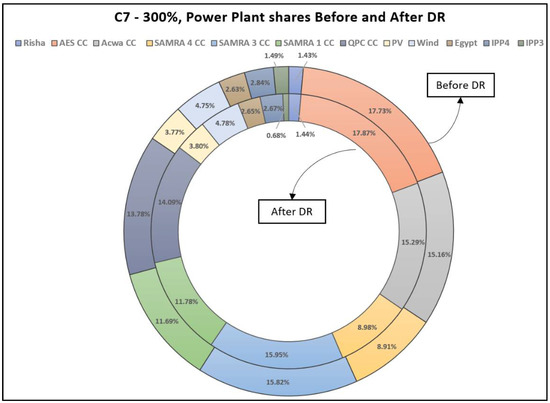
Figure 24.
Power plant shares for the Case of C7-300% before and after DR.
5. Conclusions
This paper aimed at presenting a comprehensive demand response model for the Jordanian power sector, based on the maximization of the profit for the service provider, considering its interaction with the power generators and customers. To this aim, a peak period, day-ahead DR based on the deep neural networks model, was introduced, and applied to the residential sector, which holds a large portion of the daily demand. The hourly day-ahead demand prediction, which is one of the main inputs to the DR model, was achieved by training a deep neural network on four-years of demand data showed perfect estimation with a MAPE error of 1.411% on the first test data set and 2.03% on the second one at the end of the four years training period. Besides, a precise PEMD estimation of Jordan’s residential sector was based on recent research on the short-term price elasticity of Jordan’s residential and the analysis of the different electrical appliances and daily operations. The results of the DR model applied for multiple case scenarios of the PEMD showed that peak reductions, load factor improvements, as well as high potential for significant cost saving could be achieved with the proposed DR model.
The proposed model at its current state faces the following limitations that should be taken into consideration for further development. First, due to the unavailability of a detailed electricity dispatching model for the Jordanian power sector, this part was simplified. Therefore, only the average prices and costs of the dispatched power plants were used in this study. By obtaining and including a more general and comprehensive dispatch model, more accurate modeling of the profit and saving calculation can be achieved, and a more precise optimization can be implemented. Second, in the presented model, the hourly residential demand of each distribution company was assumed to be a constant percentage of its share of the peak demand. Third, the hourly renewable energy power is considered given data to the model provided by each renewable power plant. Thus, a comprehensive prediction model should be combined with the current DR model to assess the impact of the climate conditions on balancing electricity supply and demand and predicting the demand response. In the presented model, and due to the lack of full data related to weather conditions, these features were not fully integrated aside from the temperature.
With that said, both the Government and all key players in the power sector must take action to hasten the development of DR response systems for the different sectors of the Jordanian electricity sector and take into consideration policies to further increase the deployment of residential smart meters. Furthermore, research towards viable DR programs both price and incentive-based that attract the residential and different sectors in Jordan’s power sector should be implemented, as well as pushing awareness campaigns to the importance of DR systems and mature energy usage to achieving a smarter grid that can handle the increasing challenges faced by high demands and high penetration of renewable energies as well as achieve environmental goals. In addition, to hasten the development of a smarter Jordanian grid, where DR systems are a part of, the government should provide more incentive to enable researchers and related personals by implementing policies that can facilitate easier access to available data, expertise and connect said parties further to accelerate development and research in these promising areas.
For future work, the model will further be extended to consider periods outside of the peak period, including forecasting models for solar and wind, using a more detailed power dispatch model, and testing different DR models for the Jordanian power grid.
Author Contributions
Conceptualization and methodology: A.S. and H.F.; Prediction modelling: A.S., H.F. and H.A.; investigation: A.S. and H.F.; writing: A.S. and H.F.; review, editing H.F.; Supervising: H.F. All authors have read and agreed to the published version of the manuscript.
Funding
This research was supported by the Kyushu Natural Energy Promotion Organization, Japan.
Institutional Review Board Statement
Not applicable.
Informed Consent Statement
Not applicable.
Acknowledgments
The authors would like to thank NEPCO represented by Almuatasim Dyab (Operation Department) and Anas Abu Rayyan (Production Planning Department) for providing electrical demand and renewable energy generation data as well as data and expertise related to power plant dispatch.
Conflicts of Interest
The authors declare no conflict of interest.
References
- IEA. Global Energy Demand Rose by 2.3% in 2018, Its Fastest Pace in the Last Decade. 2019. Available online: https://www.iea.org/news/global-energy-demand-rose-by-23-in-2018-its-fastest-pace-in-the-last-decade (accessed on 7 May 2021).
- IEA. Global Energy and CO2 Status Report. Oecd-Iea. 2018. Available online: https://www.iea.org/publications/freepublications/publication/GECO2017.pdf (accessed on 14 December 2019).
- World Bank. Implementation Completion and Results Report (Ibrd-85300) on Ibrd Loans with the Concessional Financing Facility Support in the Aggregate Amount of Us$500 Million to the Hashemite Kingdom of Jordan for the First and Second Programmatic Energy and Water Sector Reforms Development Policy Loans. 2018. Available online: http://documents1.worldbank.org/curated/en/222301546546705732/pdf/icr00004657-12282018-636818041906584165.pdf (accessed on 13 April 2021).
- Ministry of Energy and Mineral Resources, Jordan. Energy 2019—Facts & Figures. 2019. Available online: https://www.memr.gov.jo/ebv4.0/root_storage/en/eb_list_page/bruchure_2019.pdf (accessed on 18 April 2021).
- Abu-Rumman, G.; Khdair, A.I.; Khdair, S.I. Current status and future investment potential in renewable energy in Jordan: An overview. Heliyon 2020, 6, e03346. [Google Scholar] [CrossRef] [PubMed]
- Tsourapas, G. The Syrian Refugee Crisis and Foreign Policy Decision-Making in Jordan, Lebanon, and Turkey. J. Glob. Secur. Stud. 2019, 4, 464–481. [Google Scholar] [CrossRef]
- World Bank. International Bank for Reconstruction and Development Program Document for a Proposed Loan with the Concessional Financing Facility Support in the Amount of US$250 Million to the Hashemite Kingdom of Jordan for a Second Pro-Grammatic Energy and Water Sector Reforms Development Policy. 2016. Available online: https://documents1.worldbank.org/curated/en/803731480820472849/pdf/1480820471543-000A10458-Jordan-Energy-Water-DPL-PD-11112016.pdf (accessed on 22 June 2021).
- NEPCO—National Electric Power Company. Annual Report 2019 NEPCO. 2019. Available online: https://www.nepco.com.jo/store/DOCS/web/2019_en.pdf (accessed on 13 April 2021).
- Hinokuma, T.; Farzaneh, H.; Shaqour, A. Techno-Economic Analysis of a Fuzzy Logic Control Based Hybrid Renewable Energy System to Power a University Campus in Japan. Energies 2021, 14, 1960. [Google Scholar] [CrossRef]
- Ma, J.; Silva, V.; Belhomme, R.; Kirschen, D.S.; Ochoa, L. Evaluating and Planning Flexibility in Sustainable Power Systems. IEEE Trans. Sustain. Energy 2013, 4, 200–209. [Google Scholar] [CrossRef]
- Shaqour, A.; Farzaneh, H.; Yoshida, Y.; Hinokuma, T. Power control and simulation of a building integrated stand-alone hybrid PV-wind-battery system in Kasuga City, Japan. Energy Rep. 2020, 6, 1528–1544. [Google Scholar] [CrossRef]
- Yoshida, Y.; Farzaneh, H. Optimal Design of a Stand-Alone Residential Hybrid Microgrid System for Enhancing Renewable Energy Deployment in Japan. Energies 2020, 13, 1737. [Google Scholar] [CrossRef]
- Impram, S.; Nese, S.V.; Oral, B. Challenges of renewable energy penetration on power system flexibility: A survey. Energy Strat. Rev. 2020, 31, 100539. [Google Scholar] [CrossRef]
- Kirschen, D.S.; Rosso, A.; Ma, J.; Ochoa, L.F. Flexibility from the demand side. In Proceedings of the 2012 IEEE Power and Energy Society General Meeting, San Diego, CA, USA, 22–26 July 2012; pp. 1–6. [Google Scholar] [CrossRef]
- Lund, P.D.; Lindgren, J.; Mikkola, J.; Salpakari, J. Review of energy system flexibility measures to enable high levels of variable renewable electricity. Renew. Sustain. Energy Rev. 2015, 45, 785–807. [Google Scholar] [CrossRef]
- Alnabulsi, M.; Ibrahim, A. Jordan Embraces Demand Response: Rapid Load Growth in Jordan Motivates the Use of a Cost-Effective Demand-Response Management System. 2017. Available online: https://www.tdworld.com/grid-innovations/asset-management-service/article/20969752/jordan-embraces-demand-response (accessed on 13 April 2021).
- Kirschen, D.S. Demand-side view of electricity markets. IEEE Trans. Power Syst. 2003, 18, 520–527. [Google Scholar] [CrossRef]
- Baboli, P.T.; Eghbal, M.J.; Moghaddam, M.P.; Aalami, H. Customer behavior based demand response model. In Proceedings of the 2012 IEEE Power and Energy Society General Meeting, San Diego, CA, USA, 22–26 July 2012; pp. 1–7. [Google Scholar] [CrossRef]
- Aalami, H.; Moghaddam, M.P.; Yousefi, G. Modeling and prioritizing demand response programs in power markets. Electr. Power Syst. Res. 2010, 80, 426–435. [Google Scholar] [CrossRef]
- Farzaneh, H.; MalehMirchegini, L.; Bejan, A.; Afolabi, T.; Mulumba, A.; Daka, P.P. Artificial Intelligence Evolution in Smart Buildings for Energy Efficiency. Appl. Sci. 2021, 11, 763. [Google Scholar] [CrossRef]
- Aalami, H.; Moghaddam, M.P.; Yousefi, G. Demand response modeling considering Interruptible/Curtailable loads and capacity market programs. Appl. Energy 2010, 87, 243–250. [Google Scholar] [CrossRef]
- Moghaddam, M.P.; Abdollahi, A.; Rashidinejad, M. Flexible demand response programs modeling in competitive electricity markets. Appl. Energy 2011, 88, 3257–3269. [Google Scholar] [CrossRef]
- Qu, X.; Hui, H.; Yang, S.; Li, Y.; Ding, Y. Price elasticity matrix of demand in power system considering demand response programs. IOP Conf. Ser. Earth Environ. Sci. 2018, 121, 052081. [Google Scholar] [CrossRef]
- Wang, F.; Ge, X.; Yang, P.; Li, K.; Mi, Z.; Siano, P.; Duić, N. Day-ahead optimal bidding and scheduling strategies for DER aggregator considering responsive uncertainty under real-time pricing. Energy 2020, 213, 118765. [Google Scholar] [CrossRef]
- Hlalele, T.G.; Zhang, J.; Naidoo, R.M.; Bansal, R.C. Multi-objective economic dispatch with residential demand response programme under renewable obligation. Energy 2021, 218, 119473. [Google Scholar] [CrossRef]
- Zeng, B.; Liu, Y.; Xu, F.; Liu, Y.; Sun, X.; Ye, X. Optimal demand response resource exploitation for efficient accommodation of renewable energy sources in multi-energy systems considering correlated uncertainties. J. Clean. Prod. 2021, 288, 125666. [Google Scholar] [CrossRef]
- Balasubramanian, S.; Balachandra, P. Effectiveness of demand response in achieving supply-demand matching in a renewables dominated electricity system: A modelling approach. Renew. Sustain. Energy Rev. 2021, 147, 111245. [Google Scholar] [CrossRef]
- Lu, R.; Hong, S.H. Incentive-based demand response for smart grid with reinforcement learning and deep neural network. Appl. Energy 2019, 236, 937–949. [Google Scholar] [CrossRef]
- Wen, L.; Zhou, K.; Li, J.; Wang, S. Modified deep learning and reinforcement learning for an incentive-based demand response model. Energy 2020, 205, 118019. [Google Scholar] [CrossRef]
- Pramono, S.H.; Rohmatillah, M.; Maulana, E.; Hasanah, R.N.; Hario, F. Deep Learning-Based Short-Term Load Forecasting for Supporting Demand Response Program in Hybrid Energy System. Energies 2019, 12, 3359. [Google Scholar] [CrossRef]
- Monfared, H.J.; Ghasemi, A.; Loni, A.; Marzband, M. A hybrid price-based demand response program for the residential micro-grid. Energy 2019, 185, 274–285. [Google Scholar] [CrossRef]
- Pallonetto, F.; De Rosa, M.; Milano, F.; Finn, D.P. Demand response algorithms for smart-grid ready residential buildings using machine learning models. Appl. Energy 2019, 239, 1265–1282. [Google Scholar] [CrossRef]
- Mengelkamp, E.; Bose, S.; Kremers, E.; Eberbach, J.; Hoffmann, B.; Weinhardt, C. Increasing the efficiency of local energy markets through residential demand response. Energy Inform. 2018, 1, 11. [Google Scholar] [CrossRef]
- Di Cosmo, V.; Lyons, S.; Nolan, A. Estimating the Impact of Time-of-Use Pricing on Irish Electricity Demand. Energy J. 2014, 35, 117–136. [Google Scholar] [CrossRef]
- Yoon, J.H.; Bladick, R.; Novoselac, A. Demand response for residential buildings based on dynamic price of electricity. Energy Build. 2014, 80, 531–541. [Google Scholar] [CrossRef]
- Alfaverh, F.; Denai, M.; Sun, Y. Demand Response Strategy Based on Reinforcement Learning and Fuzzy Reasoning for Home Energy Management. IEEE Access 2020, 8, 39310–39321. [Google Scholar] [CrossRef]
- Wang, Z.; Munawar, U.; Paranjape, R. Stochastic Optimization for Residential Demand Response with Unit Commitment and Time of Use. IEEE Trans. Ind. Appl. 2021, 57, 1767–1778. [Google Scholar] [CrossRef]
- Jarada, J.; Ashhab, M.S. Energy savings in the Jordanian residential sector. Jordan J. Mech. Ind. Eng. 2017, 11, 51–59. [Google Scholar]
- Techniques, O.; Alhmoud, L.; Nawafleh, Q. Short-term load forecasting for Jordan’s Power System Using Neural Network based Different. In Proceedings of the 2019 IEEE International Conference on Environment and Electrical Engineering and 2019 IEEE Industrial and Commercial Power Systems Europe (EEEIC/I&CPS Europe), Genova, Italy, 11–14 June 2019; pp. 1–6. [Google Scholar] [CrossRef]
- Japan International Cooperation Agency (JICA). Project for the Study on the Electricity Sector Master Plan in the Hashemite Kingdom of Jordan Final Report. 2017. Available online: https://openjicareport.jica.go.jp/pdf/12283693_01.pdf (accessed on 13 April 2021).
- NEPCO—National Electric Power Company, NEPCO Transmission Grid Code. Available online: https://www.emrc.gov.jo/echobusv3.0/systemassets/$rk0lzm8.pdf (accessed on 25 April 2021).
- NEPCO—National Electric Power Company, Electricity Interconnection Projects. Available online: https://www.nepco.com.jo/en/electrical_interconnection_en.aspx#:~:text=Jordan%20is%20electrically%20interconnected%20with,capabilities%20of%20(550)%20MW (accessed on 25 April 2021).
- EMRC—Jordan, Electricity Tariff. Available online: https://www.emrc.gov.jo/EchoBusV3.0/SystemAssets/Electricity_Sector/pdfs/08ad1e0d-f03f-4e52-96f6-2936634dcc9c_guidea_2020.pdf (accessed on 25 April 2021).
- EMRC, BULK SUPPLY CODE DRAFT—Jordan. Available online: https://www.emrc.gov.jo/echobusv3.0/systemassets/$rp7tbdk.pdf (accessed on 25 April 2021).
- EMCR, Periods of Peak Demand—2021. Available online: https://www.emrc.gov.jo/echobusv3.0/systemassets/abb02815-d8a7-49ac-910f-a6ba3e7dcf60_%D9%81%D8%AA%D8%B1%D8%A9%20%D8%A7%D9%84%D8%B0%D8%B1%D9%88%D8%A9%20%D8%A7%D8%B9%D8%AA%D8%A8%D8%A7%D8%B1%D8%A7%D9%8B%20%D9%85%D9%86%201-1-2021%20%20%D9%84%D8%A7%D8%BA%D8%B1%D8%A7%D8%B6%20%D8%A7%D9%84%D9%85%D9%88%D9%82%D8%B9.pdf (accessed on 25 April 2021).
- Kirschen, D.S.; Strbac, G.; Cumperayot, P.; De Mendes, D.P. Factoring the elasticity of demand in electricity prices. IEEE Trans. Power Syst. 2000, 15, 612–617. [Google Scholar] [CrossRef]
- Ajlouni, S. Price and Income Elasticities of Residential Demand for Electricity in Jordan: An ARDL Bounds Testing Approach to Cointegration. Dirasat Adm. Sci. 2016, 43, 335–349. [Google Scholar] [CrossRef][Green Version]
- Del Real, A.J.; Dorado, F.; Durán, J. Energy Demand Forecasting Using Deep Learning: Applications for the French Grid. Energies 2020, 13, 2242. [Google Scholar] [CrossRef]
- Zhang, R.; Dong, Z.Y.; Xu, Y.; Meng, K.; Wong, K.P. Short-term load forecasting of Australian National Electricity Market by an ensemble model of extreme learning machine. IET Gener. Transm. Distrib. 2013, 7, 391–397. [Google Scholar] [CrossRef]
- Ryu, S.; Noh, J.; Kim, H. Deep Neural Network Based Demand Side Short Term Load Forecasting. Energies 2017, 10, 3. [Google Scholar] [CrossRef]
- Leshno, M.; Lin, V.Y.; Pinkus, A.; Schocken, S. Multilayer feedforward networks with a nonpolynomial activation function can approximate any function. Neural Netw. 1993, 6, 861–867. [Google Scholar] [CrossRef]
- Nwankpa, C.E.; Ijomah, W.; Gachagan, A.; Marshall, S. Activation functions: Comparison of trends in practice and research for deep learning. arXiv 2018, arXiv:1811.03378. [Google Scholar]
- Krizhevsky, A.; Sutskever, I.; Hinton, G.E. ImageNet classification with deep convolutional neural networks. Commun. ACM 2012, 60, 84–90. [Google Scholar] [CrossRef]
- Clevert, D.A.; Unterthiner, T.; Hochreiter, S. Fast and accurate deep network learning by exponential linear units (elus). In Proceedings of the 4th International Conference on Learning Representations, ICLR 2016, San Juan, Puerto Rico, 2–4 May 2016; pp. 1–14. [Google Scholar]
- Ruder, S. An overview of gradient descent optimization algorithms. arXiv 2016, arXiv:1609.04747. [Google Scholar]
- Qian, N. On the momentum term in gradient descent learning algorithms. Neural Netw. 1999, 12, 145–151. [Google Scholar] [CrossRef]
- Hinton, G.; Srivastava, M.; Swersky, K. Overview of mini-batch gradient descent. Available online: https://www.cs.toronto.edu/~hinton/coursera/lecture6/lec6.pdf (accessed on 13 April 2021).
- Kingma, D.P.; Ba, J. Adam: A method for stochastic optimization. In Proceedings of the 3rd International Conference on Learning Representations ICLR 2015, San Diego, CA, USA, 7–9 May 2015; pp. 1–15. [Google Scholar]
- Hastie, T.; Tibshirani, R.; Friedman, J. The Elements of Statistical Learning; Springer: New York, NY, USA, 2009. [Google Scholar]
- Srivastava, N.; Hinton, G.; Krizhevsky, A.; Sutskever, I.; Salakhutdinov, R. Dropout: A Simple Way to Prevent Neural Networks from Overfitting. J. Mach. Learn. Res. 2014, 15, 1929–1958. [Google Scholar]
- Prechelt, L. Automatic early stopping using cross validation: Quantifying the criteria. Neural Netw. 1998, 11, 761–767. [Google Scholar] [CrossRef]
- Kong, W.; Dong, Z.Y.; Jia, Y.; Hill, D.J.; Xu, Y.; Zhang, Y. Short-Term Residential Load Forecasting Based on LSTM Recurrent Neural Network. IEEE Trans. Smart Grid 2019, 10, 841–851. [Google Scholar] [CrossRef]
- Lahouar, A.; Slama, J.B.H. Day-ahead load forecast using random forest and expert input selection. Energy Convers. Manag. 2015, 103, 1040–1051. [Google Scholar] [CrossRef]
- The Department of Statistics (DoS)—Jordan, Distribution of Housing Units by Household Appliances and Private Car and Governorate and Urban-Rural (%). 2017. Available online: http://www.dos.gov.jo/dos_home_e/main/linked-html/household/2017/G1/Table6G1_King.pdf (accessed on 6 May 2021).
- Energy use calculator, Electricity usage of a Water Heater. Available online: https://energyusecalculator.com/electricity_waterheater.htm (accessed on 6 May 2021).
- Johnson, B.J.; Starke, M.R.; Abdelaziz, O.A.; Jackson, R.K.; Tolbert, L.M. A dynamic simulation tool for estimating demand response potential from residential loads. In Proceedings of the 2015 IEEE Power & Energy Society Innovative Smart Grid Technologies Conference (ISGT), Washington, DC, USA, 18–25 February 2015; pp. 1–5. [Google Scholar] [CrossRef]
- Wang, Z.; Paranjape, R. Optimal Residential Demand Response for Multiple Heterogeneous Homes with Real-Time Price Prediction in a Multiagent Framework. IEEE Trans. Smart Grid 2015, 8, 1173–1184. [Google Scholar] [CrossRef]
Publisher’s Note: MDPI stays neutral with regard to jurisdictional claims in published maps and institutional affiliations. |
© 2021 by the authors. Licensee MDPI, Basel, Switzerland. This article is an open access article distributed under the terms and conditions of the Creative Commons Attribution (CC BY) license (https://creativecommons.org/licenses/by/4.0/).