
Novel Approach for Suppression of Ettringite Formation in Sulfate-Bearing Soil Using Blends of Nano-Magnesium Oxide, Ground Granulated Blast-Furnace Slag and Rice Husk Ash


Abstract
:1. Introduction
2. Materials and Methods
2.1. Materials
2.2. Sample Preparation
2.3. Experiments
2.3.1. Linear Expansion Test (Swelling) (LP) Test
2.3.2. Unconfined Compressive Strength (UCS) Test
2.3.3. Flexural Strength (FS) Test
2.3.4. Microstructure Analysis (SEM/EDX)
3. Results and Discussion
3.1. Unconfined Compressive Strength (UCS) Test
3.1.1. Effects of M-RHA on UCS
3.1.2. Effects of M-GGBS on UCS
3.1.3. Effects of M-GGBS-RHA on UCS
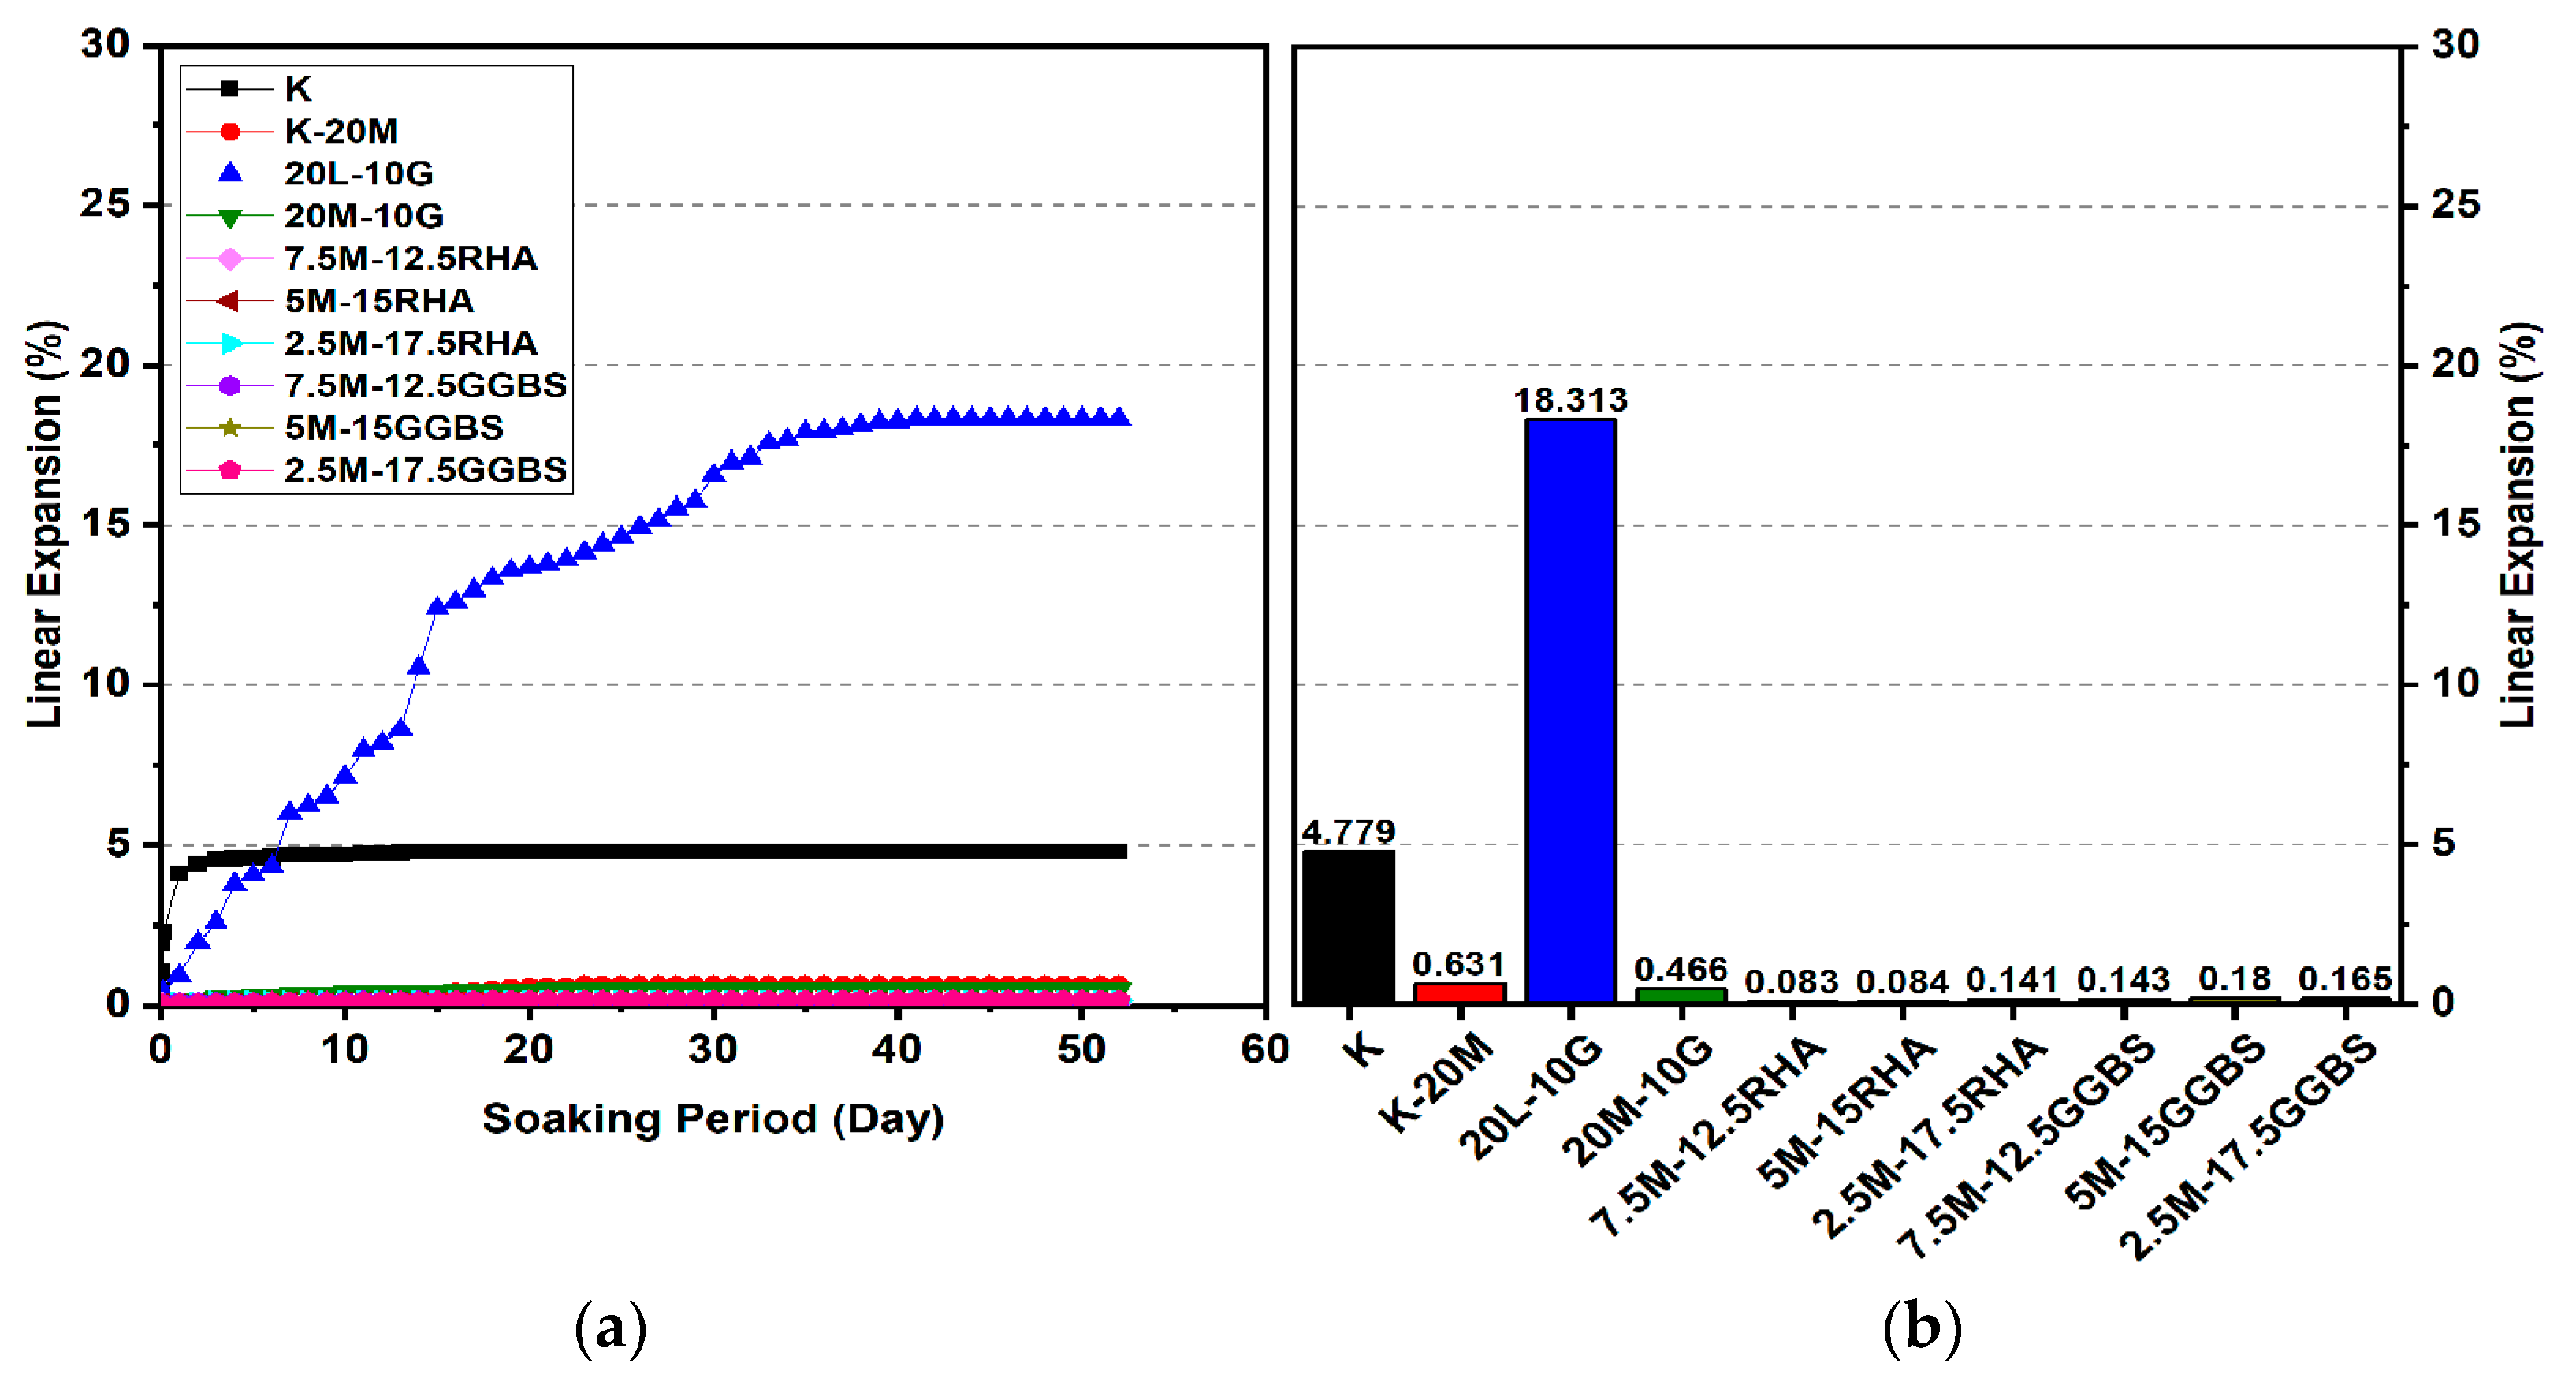
3.2. Linear Expansion Test (Swelling) (LP) Test
3.2.1. Effects of M-RHA on Swelling
3.2.2. Effects of M-GGBS on Swelling
3.2.3. Effects of M-GGBS-RHA on Swelling
3.3. Flexural Strength Flexural (FS)
3.4. SEM and EDX Analysis
4. Conclusions
- The minimum swelling values of M-RHA-, M-GGBS-, and M-GGBS-RHA-stabilized gypseous soils with 20% doses (0.011%, 0.001%, and 0.001%) were lower than that of lime-stabilized soil.
- The optimum strength values of M-RHA-, M-GGBS, and M-GGBS-RHA-stabilized soils after soaking with 20% (2.7, 12.8, and 9.7 MPa) were notably higher than that of lime-stabilized soil (0.9 MPa).
- The curing time had a significant impact on the resistance to sulfate attack as a result of the hydration process; an increase in the curing period from 7 to 90 days resulted in adequate hydration and improved strength in the presence of sulfate (gypsum).
- The results of the SEM and EDX showed that no ettringite was formed in the M-RHA-, M-GGBS-, or M-GGBS-RHA-stabilized soils.
- The formation of cementing gels such as MSH, MAH, CSH, and CAH improved the UCS values of the stabilized samples, as these gels occupied the voids and improved the bonding between the soil particles. As a result, the treated soils’ UCS values were improved.
Supplementary Materials
Author Contributions
Funding
Institutional Review Board Statement
Informed Consent Statement
Data Availability Statement
Acknowledgments
Conflicts of Interest
References
- Aldaood, A.; Bouasker, M. Mechanical Behavior of Gypseous Soil Treated with Lime. Geotech. Geol. Eng. 2020, 39, 719–733. [Google Scholar] [CrossRef]
- Li, W.; Yi, Y.; Puppala, A.J. Suppressing Ettringite-Induced Swelling of Gypseous Soil by Using Magnesia-Activated Ground Granulated Blast-Furnace Slag. J. Geotech. Geoenviron. Eng. 2020, 146, 06020008. [Google Scholar] [CrossRef]
- Kalipcilar, I.; Mardani-Aghabaglou, A.; Sezer, A.; Altun, S.; Inan Sezer, G. Sustainability of cement-stabilised clay: Sulfate resistance. Proc. Inst. Civ. Eng. Eng. Sustain. 2016, 171, 254–274. [Google Scholar] [CrossRef]
- Adeleke, B.; Kinuthia, J.; Oti, J. Strength and Swell Performance of High-Sulphate Kaolinite Clay Soil. Sustainability 2020, 12, 10164. [Google Scholar] [CrossRef]
- Yao, K.; Wang, W.; Li, N.; Zhang, C.; Wang, L. Investigation on strength and microstructure characteristics of nano-MgO admixed with cemented soft soil. Constr. Build. Mater. 2019, 206, 160–168. [Google Scholar] [CrossRef]
- Seco, A.; del Castillo, J.M.; Espuelas, S.; Marcelino, S.; García, B. Sulphate soil stabilisation with magnesium binders for road subgrade construction. Int. J. Pavement Eng. 2020. [Google Scholar] [CrossRef]
- Raja, P.S.K.; Thyagaraj, T. Effect of compaction time delay on compaction and strength behavior of lime-treated expansive soil contacted with sulfate. Innov. Infrastruct. Solut. 2020, 5, 14. [Google Scholar] [CrossRef]
- Chegenizadeh, A.; Keramatikerman, M.; Miceli, S.; Nikraz, H. Investigation on Recycled Sawdust in Controlling Sulphate Attack in Cemented Clay. Appl. Sci. 2020, 10, 1441. [Google Scholar] [CrossRef] [Green Version]
- Yi, Y.; Liska, M.; Jin, F.; Al-tabbaa, A. Mechanism of reactive magnesia—ground granulated blastfurnace slag (GGBS) soil stabilization. Can. Geotech. J. 2016, 55, 773–782. [Google Scholar] [CrossRef]
- Bazyar, M.H.; Ebrahimi, M.; Lenjani, M.Z.; Makarchian, M. The Effect of Rice Husk Ash on Mechanical Properties of Clayey Soils Stabilized with Lime in the Presence of Sulphate. J. Eng. Geol. 2017, 11, 23–52. [Google Scholar]
- Abdi, M.R.; Askarian, A.; Safdari Seh Gonbad, M. Effects of sodium and calcium sulphates on volume stability and strength of lime-stabilized kaolinite. Bull. Eng. Geol. Environ. 2019, 79, 941–957. [Google Scholar] [CrossRef]
- Eyo, E.U.; Abbey, S.J.; Ngambi, S.; Ganjian, E.; Coakley, E. Incorporation of a nanotechnology-based product in cementitious binders for sustainable mitigation of sulphate-induced heaving of stabilised soils. Eng. Sci. Technol. Int. J. 2020, 24, 436–448. [Google Scholar] [CrossRef]
- Kampala, A.; Jitsangiam, P.; Pimraksa, K.; Chindaprasirt, P. An investigation of sulfate effects on compaction characteristics and strength development of cement-treated sulfate bearing clay subgrade. Road Mater. Pavement Des. 2020. [Google Scholar] [CrossRef]
- Khadka, S.D.; Jayawickrama, P.W.; Senadheera, S.; Segvic, B. Stabilization of highly expansive soils containing sulfate using metakaolin and fly ash based geopolymer modified with lime and gypsum. Transp. Geotech. 2020, 23, 100327. [Google Scholar] [CrossRef]
- Seco, A.; Miqueleiz, L.; Prieto, E.; Marcelino, S.; García, B.; Urmeneta, P. Sulfate soils stabilization with magnesium-based binders. Appl. Clay Sci. 2017, 135, 457–464. [Google Scholar] [CrossRef]
- Celik, E.; Nalbantoglu, Z. Effects of ground granulated blastfurnace slag (GGBS) on the swelling properties of lime-stabilized sulfate-bearing soils. Eng. Geol. 2013, 163, 20–25. [Google Scholar] [CrossRef]
- Pal, S.C.; Mukherjee, A.; Pathak, S.R. Investigation of hydraulic activity of ground granulated blast furnace slag in concrete. Cem. Concr. Res. 2003, 33, 1481–1486. [Google Scholar] [CrossRef]
- McCarthy, M.J.; Csetenyi, L.J.; Sachdeva, A.; Dhir, R.K. Identifying the role of fly ash properties for minimizing sulfate-heave in lime-stabilized soils. Fuel 2012, 92, 27–36. [Google Scholar] [CrossRef]
- Indraratna, B.; Qi, Y.; Tawk, M.; Heitor, A.; Rujikiatkamjorn, C.; Navaratnarajah, S.K. Advances in Ground Improvement Using Waste Materials for Transportation Infrastructure. Proc. Inst. Civ. Eng. Ground Improv. 2020, 1–20. [Google Scholar] [CrossRef]
- Yu, B.W.; Du, Y.J.; Jin, F.; Liu, C.Y. Multiscale study of sodium sulfate soaking durability of low plastic clay stabilized by reactive magnesia-activated ground granulated blast-furnace slag. J. Mater. Civ. Eng. 2016, 28, 04016016. [Google Scholar] [CrossRef]
- Václavík, V.; Dirner, V.; Dvorský, T.; Daxner, J. The use of blast furnace slag. Metalurgija 2012, 51, 461–464. [Google Scholar]
- Jin, F.; Al-Tabbaa, A. Evaluation of novel reactive MgO activated slag binder for the immobilisation of lead and zinc. Chemosphere 2014, 117, 285–294. [Google Scholar] [CrossRef] [Green Version]
- Cai, G.H.; Liu, S.Y.; Zheng, X. Influence of drying-wetting cycles on engineering properties of carbonated silt admixed with reactive MgO. Constr. Build. Mater. 2019, 204, 84–93. [Google Scholar] [CrossRef]
- Yi, Y.; Liska, M.; Al-Tabbaa, A. Initial investigation into the use of GGBS-MgO in soil stabilisation. Grouting Deep Mix. 2012, 2012, 444–453. [Google Scholar]
- YI, Y.; LI, C.; LIU, S.; AL-TABBAA, A. Resistance of MgO–GGBS and CS–GGBS stabilised marine soft clays to sodium sulfate attack. Géotechnique 2014, 64, 673–679. [Google Scholar] [CrossRef]
- Yi, Y.; Liska, M.; Al-Tabbaa, A. Properties of Two Model Soils Stabilized with Different Blends and Contents of GGBS, MgO, Lime, and PC. J. Mater. Civ. Eng. 2014, 26, 267–274. [Google Scholar] [CrossRef]
- Yi, Y.; Gu, L.; Liu, S.; Jin, F. Magnesia reactivity on activating efficacy for ground granulated blastfurnace slag for soft clay stabilisation. Appl. Clay Sci. 2016, 126, 57–62. [Google Scholar] [CrossRef]
- Sarkkinen, M.; Kujala, K.; Gehör, S. Efficiency of MgO activated GGBFS and OPC in the stabilization of highly sulfidic mine tailings. J. Sustain. Min. 2019, 18, 115–126. [Google Scholar] [CrossRef]
- Tawk, M.; Qi, Y.; Indraratna, B.; Rujikiatkamjorn, C.; Heitor, A. Behaviour of a Mixture of Coal Wash and Rubber Crumbs under Cyclic Loading. J. Mater. Civ. Eng. 2021, 33, 04021054. [Google Scholar] [CrossRef]
- Nidzam, R.M.; Kinuthia, J.M. Sustainable soil stabilisation with blastfurnace slag—A review. Proc. Inst. Civ. Eng. Constr. Mater. 2010, 163, 157–165. [Google Scholar] [CrossRef]
- Pai, R.R.; Patel, S.; Bakare, M.D. Applicability of Utilizing Stabilized Native Soil as a Subbase Course in Flexible Pavement. Indian Geotech. J. 2020, 50, 289–299. [Google Scholar] [CrossRef]
- Truong, S.B.; Thi, N.N.; Thanh, D.N. An Experimental Study on Unconfined Compressive Strength of Soft Soil-Cement Mixtures with or without GGBFS in the Coastal Area of Vietnam. Adv. Civ. Eng. 2020, 2020, 20–25. [Google Scholar]
- Ghorbani, A.; Salimzadehshooiili, M. Dynamic Characterization of Sand Stabilized with Cement and RHA and Reinforced with Polypropylene Fiber. J. Mater. Civ. Eng. 2019, 31, 1–24. [Google Scholar] [CrossRef]
- British Standards Institution. BS EN ISO 17892-4:2016: GGeotechnical Investigation and Testing. Laboratory Testing of Soil Part. 4: Determination of Particle Size Distribution; BSI Standards Ltd.: London, UK, 2014. [Google Scholar]
- Phanikumar, B.R.; Nagaraju, T.V. Effect of Fly Ash and Rice Husk Ash on Index and Engineering Properties of Expansive Clays. Geotech. Geol. Eng. 2018, 36, 3425–3436. [Google Scholar] [CrossRef]
- Yatawara, M.; Athukorala, S. Potential of replacing clay soil by rice husk ash (RHA) in enhancing the properties of compressed earth blocks (CEBs). Environ. Dev. Sustain. 2020, 23, 3474–3486. [Google Scholar] [CrossRef]
- Nayel, I.H.; Burhan, S.K.; Nasr, M.S. Characterisation of prepared rice husk ash and its effects on strength development in recycled aggregate concrete. In Proceedings of the 2nd International Conference on Engineering Sciences, Kerbala, Iraq, 26–28 March 2018. [Google Scholar]
- He, J.; Li, Z.X.; Wang, X.Q.; Shi, X.K. Durability of Soft Soil Treated with Soda Residue and Ground Granulated Blast Furnace Slag in a Soaking Environment. J. Mater. Civ. Eng. 2020, 32, 06019018. [Google Scholar] [CrossRef]
- Gu, K.; Jin, F.; Al-Tabbaa, A.; Shi, B.; Liu, C.; Gao, L. Incorporation of reactive magnesia and quicklime in sustainable binders for soil stabilisation. Eng. Geol. 2015, 195, 53–62. [Google Scholar] [CrossRef]
- National Academies of Sciences, E.A.M. Recommended Practice for Stabilization of Sulfate-Rich Subgrade Soils; The National Academies Press: Washington, DC, USA, 2009; ISBN 9780309429825. [Google Scholar]
- Puppala, A.J.; Talluri, N.; Chittoori, B.C.S. Calcium-based stabiliser treatment of sulfate-bearing soils. Proc. Inst. Civ. Eng. Ground Improv. 2014, 167, 162–172. [Google Scholar] [CrossRef]
- Talluri, N.; Puppala, A.J.; Congress, S.S.C.; Banerjee, A. Experimental Studies and Modeling of High Sulfate Soil Stabilization. J. Geotech. Geoenviron. Eng. 2020, 146, 1–16, in press. [Google Scholar] [CrossRef]
- British Standards Institution. BS EN 13286-2:2010: Unbound and Hydraulically Bound. Mixtures Part. 2: Test. Methods for Laboratory Reference Density and Water Content—Proctor Compaction; BSI Standards Ltd.: London, UK, 2012. [Google Scholar]
- British Standards Institution. BS EN 13286-49:2004: Unbound and Hydraulically Bound. Mixtures Accelerated Swelling Test. for Soil Treated by Lime and/or Hydraulic Binder; BSI Standards Ltd.: London, UK, 2004. [Google Scholar]
- British Standards Institution. BS EN ISO 17892-7:2018: Geotechnical Investigation and Testing. Laboratory Testing of Soil Part. 7: Unconfined Compression Test. Strength; BSI Standards Ltd.: London, UK, 2018. [Google Scholar]
- Yong, L.L.; Namal Jayasanka Perera, S.; Syamsir, A.; Emmanuel, E.; Paul, S.C.; Anggraini, V. Stabilization of a residual soil using calcium and magnesium hydroxide nanoparticles: A quick precipitation method. Appl. Sci. 2019, 9, 4325. [Google Scholar] [CrossRef] [Green Version]
- Estabragh, A.R.; Jahani, A.; Javadi, A.A.; Babalar, M. Assessment of different agents for stabilisation of a clay soil. Int. J. Pavement Eng. 2020. [Google Scholar] [CrossRef]


| Properties | Value |
|---|---|
| Liquid limit (%) | 57.78 |
| Plastic limit (%) | 38.13 |
| Shrinking limit (%) | 4.4 |
| Plasticity index | 19.65 |
| Sand (%) | - |
| Silt (%) | 88.35 |
| Clay (%) | 11.65 |
| Electric conductivity (µS/cm) | 320 |
| pH | 5 |
| Specific gravity (Gs) | 2.46 |
| Water content (%) | 1.01 |
| Optimum moisture content (%) | 29 |
| Maximum dry density (Mg/m3) | 1.326 |
| Sulfate Type | Common Name | Chemical Formula | Solubility |
|---|---|---|---|
| Calcium | Selenite, gypsum | CaSO4 × 2H2O | 1.44 |
| Potassium | Arcanite | K2SO4 | 130 |
| Magnesium | Epsomite | MgSO4 × 7H2O | 225 |
| Sodium | Themadite, mirabilite | Na2SO4 × 10H2O | >225 |
| Oxides | Characteristic (%) | |||||
|---|---|---|---|---|---|---|
| Kaolin Clay | L | M | G | GGBS | RHA | |
| CaO | - | - | - | - | 37 | 0.41 |
| CaOH2 | - | 92 | - | - | - | - |
| SiO2 | 58 | 2.5 | - | - | 32.7 | 93.1 |
| Al2O3 | 38 | 0.9 | - | - | 15.3 | 0.21 |
| Ca2SO4 | - | 0.1 | - | 99 | - | - |
| SO3 | - | - | 0.03 | - | 4.7 | - |
| MgO | - | 3.5 | 99.5 | - | 8.1 | 1.59 |
| Cl | - | - | 0.01 | 0.005 | - | - |
| Fe | - | 0.06 | 0.01 | 0.005 | - | 0.21 |
| H2O | - | 0.7 | 0.2 | - | - | - |
| Loss on ignition | 11–14 | 0.24 | 0.25 | 0.99 | 2.2 | 4.48 |
| pH | 5 | 11.85 | 10.83 | 7.5 | 10.23 | 8.97 |
| Specific gravity | 2.46 | 2.23 | 3.58 | 2.34 | 2.96 | 2.11 |
| Risk Level | Sulfate Concentration | |
|---|---|---|
| Parts per Million | Percentage of Dry Weight | |
| Low risk | >3000 ppm | >3% |
| Moderate risk | 3000–5000 ppm | 3–5% |
| Moderate to high risk | 5000–8000 ppm | 5–8% |
| High to unacceptable risk | >8000 ppm | >8% |
| Unacceptable risk | >10,000 ppm | >10% |
| Mix Code | Binder Composition | Binder Ratio (%) | Dosage (%) |
|---|---|---|---|
| Unary | |||
| K | K | - | - |
| K-M | M | 100 | 10, 20 |
| K-L-G | L | 100 | 10, 20 |
| K-M-G | M | 100 | 10, 20 |
| Binary | |||
| K-M-RHA-G | M:RHA | 3:1, 1:1, 1:3 | 10, 20 |
| K-M-GGBS-G | M:GGBS | 3:1, 1:1, 1:3 | 10, 20 |
| Ternary | |||
| K-M-GGBS-RHA-G | M:GGBS:RHA | 1:0.5:0.5, 1:1:2, 1:2:1, 1:2.5:0.5 | 10, 20 |
| Swelling (%) | Risk |
|---|---|
| 0 | No swell |
| 0–0.1 | Negligible |
| 0.1–0.5 | Light |
| 0.5–1.0 | Medium |
| 1.0–2.0 | Strong |
| Over 2.0 | Very strong |
Publisher’s Note: MDPI stays neutral with regard to jurisdictional claims in published maps and institutional affiliations. |
© 2021 by the authors. Licensee MDPI, Basel, Switzerland. This article is an open access article distributed under the terms and conditions of the Creative Commons Attribution (CC BY) license (https://creativecommons.org/licenses/by/4.0/).
Share and Cite
Ehwailat, K.I.A.; Ismail, M.A.M.; Ezreig, A.M.A. Novel Approach for Suppression of Ettringite Formation in Sulfate-Bearing Soil Using Blends of Nano-Magnesium Oxide, Ground Granulated Blast-Furnace Slag and Rice Husk Ash. Appl. Sci. 2021, 11, 6618. https://doi.org/10.3390/app11146618
Ehwailat KIA, Ismail MAM, Ezreig AMA. Novel Approach for Suppression of Ettringite Formation in Sulfate-Bearing Soil Using Blends of Nano-Magnesium Oxide, Ground Granulated Blast-Furnace Slag and Rice Husk Ash. Applied Sciences. 2021; 11(14):6618. https://doi.org/10.3390/app11146618
Chicago/Turabian StyleEhwailat, Khaled Ibrahim Azarroug, Mohd Ashraf Mohamad Ismail, and Ali Muftah Abdussalam Ezreig. 2021. "Novel Approach for Suppression of Ettringite Formation in Sulfate-Bearing Soil Using Blends of Nano-Magnesium Oxide, Ground Granulated Blast-Furnace Slag and Rice Husk Ash" Applied Sciences 11, no. 14: 6618. https://doi.org/10.3390/app11146618
APA StyleEhwailat, K. I. A., Ismail, M. A. M., & Ezreig, A. M. A. (2021). Novel Approach for Suppression of Ettringite Formation in Sulfate-Bearing Soil Using Blends of Nano-Magnesium Oxide, Ground Granulated Blast-Furnace Slag and Rice Husk Ash. Applied Sciences, 11(14), 6618. https://doi.org/10.3390/app11146618