Article

Comparative Analysis of Current Approaches to Quality Estimation for Neural Machine Translation

Department of Computer Science and Engineering, Korea University, 145, Anam-ro, Seongbuk-gu, Seoul 02841, Korea
*
Author to whom correspondence should be addressed.
These authors contributed equally to this work.
Appl. Sci. 2021, 11(14), 6584; https://doi.org/10.3390/app11146584
Submission received: 6 May 2021 / Revised: 1 July 2021 / Accepted: 15 July 2021 / Published: 17 July 2021
(This article belongs to the Special Issue Current Approaches and Applications in Natural Language Processing)

Abstract

:
Quality estimation (QE) has recently gained increasing interest as it can predict the quality of machine translation results without a reference translation. QE is an annual shared task at the Conference on Machine Translation (WMT), and most recent studies have applied the multilingual pretrained language model (mPLM) to address this task. Recent studies have focused on the performance improvement of this task using data augmentation with finetuning based on a large-scale mPLM. In this study, we eliminate the effects of data augmentation and conduct a pure performance comparison between various mPLMs. Separate from the recent performance-driven QE research involved in competitions addressing a shared task, we utilize the comparison for sub-tasks from WMT20 and identify an optimal mPLM. Moreover, we demonstrate QE using the multilingual BART model, which has not yet been utilized, and conduct comparative experiments and analyses with cross-lingual language models (XLMs), multilingual BERT, and XLM-RoBERTa.

1. Introduction

Quality estimation (QE) refers to automatically predicting translation quality using only source sentence and machine translation (MT) output [1]. The goal of QE is to estimate translation quality scores or categories for MT outputs without reference sentences at various levels of granularity (i.e., sentence, phrase, word). It is necessary to compare the MT output with a reference sentence to determine the quality of the translation in general. However, it is not easy to obtain a reference sentence, and constructing such a sentence requires large costs and human labor. Based on these issues, the need for QE research is increasing, and a considerable number of studies are being conducted in this area.
In the QE process, the quality of the MT output is indicated using quality annotations, such as numerical values or error tags. This allows the user to select or rank the system that exhibits the best translation results [2]. In addition, for low-quality sentences, efficiency can be increased during automatic post editing [3] by modifying only the low-quality words or phrases using quality annotations. Therefore, QE is an important process that can be widely applied.
According to recent research trends, there are a number of cases in which the QE task is conducted based on multilingual pretrained language models (mPLMs) [4,5,6]. mPLM is a case where a multilingual representation is learned by extending pretrained language model to multiple languages. In QE, where two languages are concatenated and entered as input, such a representation is required, so mPLMs are mostly used in this task. However, most studies are focused on improving performance by simply applying data augmentation while finetuning the QE task based on a large-capacity mPLM such as multilingual BERT (mBERT) [7], cross-lingual language model (XLM) [8], or XLM-RoBERTa (XLM-R) [9]. In addition, there are many cases in which QE models are trained based on XLM-R, which is the latest model with a state-of-the-art (SOTA) performance for cross-lingual transfer tasks [10,11] achieved by pretraining using an extremely large dataset [5,12,13,14]. However, unlike evaluation benchmarks for cross-lingual understanding that deal with multiple languages, QE differs from these because it requires measuring translation quality while referencing two languages at the same time. Thus, performance comparisons with other models should be preceded, but many papers tend to overlook this and simply use the XLM-R model [15].
Zhou et al. [16] compare the performance difference between mBERT and XLM-MLM for sub-task 1, and Baek et al. [13] additionally compare the performance difference of XLM-CLM, Ranasinghe et al. [17] compare the performance of mBERT and XLM-R. However, XLM models including the English and German languages are quite diverse, and, in particular, there has been no comparison with XLM-TLM models that learn information between languages in addition to multiple languages.
Unlike other previous studies that mostly utilize the SOTA model, we remove the effects of data augmentation that are utilized to achieve performance improvement and perform a comparative study between representative mPLMs based on sub-tasks 1 and 2 from WMT20. Each mPLM has a different capacity, training data size, or pretraining objective, and even the same model has different performance depending on how many languages it contains. Therefore, comparative analysis of various mPLMs in QE can serve as a good indicator of which model performs well for each task in future studies. In addition, because we compare pure performance, we can expect high performance by using data augmentation and new methodologies based on the model with high performance.
This study addresses two questions:
  • Which mPLM is best for QE sub-tasks?
  • Does the input order of the source sentence and the MT output sentence affect the performance of the model?
Considering the first question, the finetuning performance of mPLMs for a QE task can be validated using a quantitative analysis. To achieve this, we apply multilingual BART (mBART) [18], which has not been used in previous QE studies, and compare it with the existing mBERT, XLM, and XLM-R models. For XLM, we conduct performance comparisons between the causal language model (CLM), mask language model (MLM), and translation language model (TLM). In the case of XLM-MLM, the performances are compared according to the number of languages used for learning.
Considering the second question, it is possible to determine the criteria indicating which input structure should be adopted for QE embedding. Previous studies have used the input structure of [BOS] Source sentence [EOS] [EOS] MT output [EOS] or [BOS] MT output [EOS] [EOS] Source sentence [EOS] without a clear standard. Therefore, we investigate this process through a quantitative analysis by utilizing different input structures for all mPLMs. The contributions of this study are as follows:
  • We conduct comparative experiments on finetuning mPLMs for a QE task, which is different from research concerning the performance improvement of the WMT shared-task competition. This quantitative analysis allows us to revisit the pure performance of mPLMs for the QE task. To the best of our knowledge, we are the first to conduct such research;
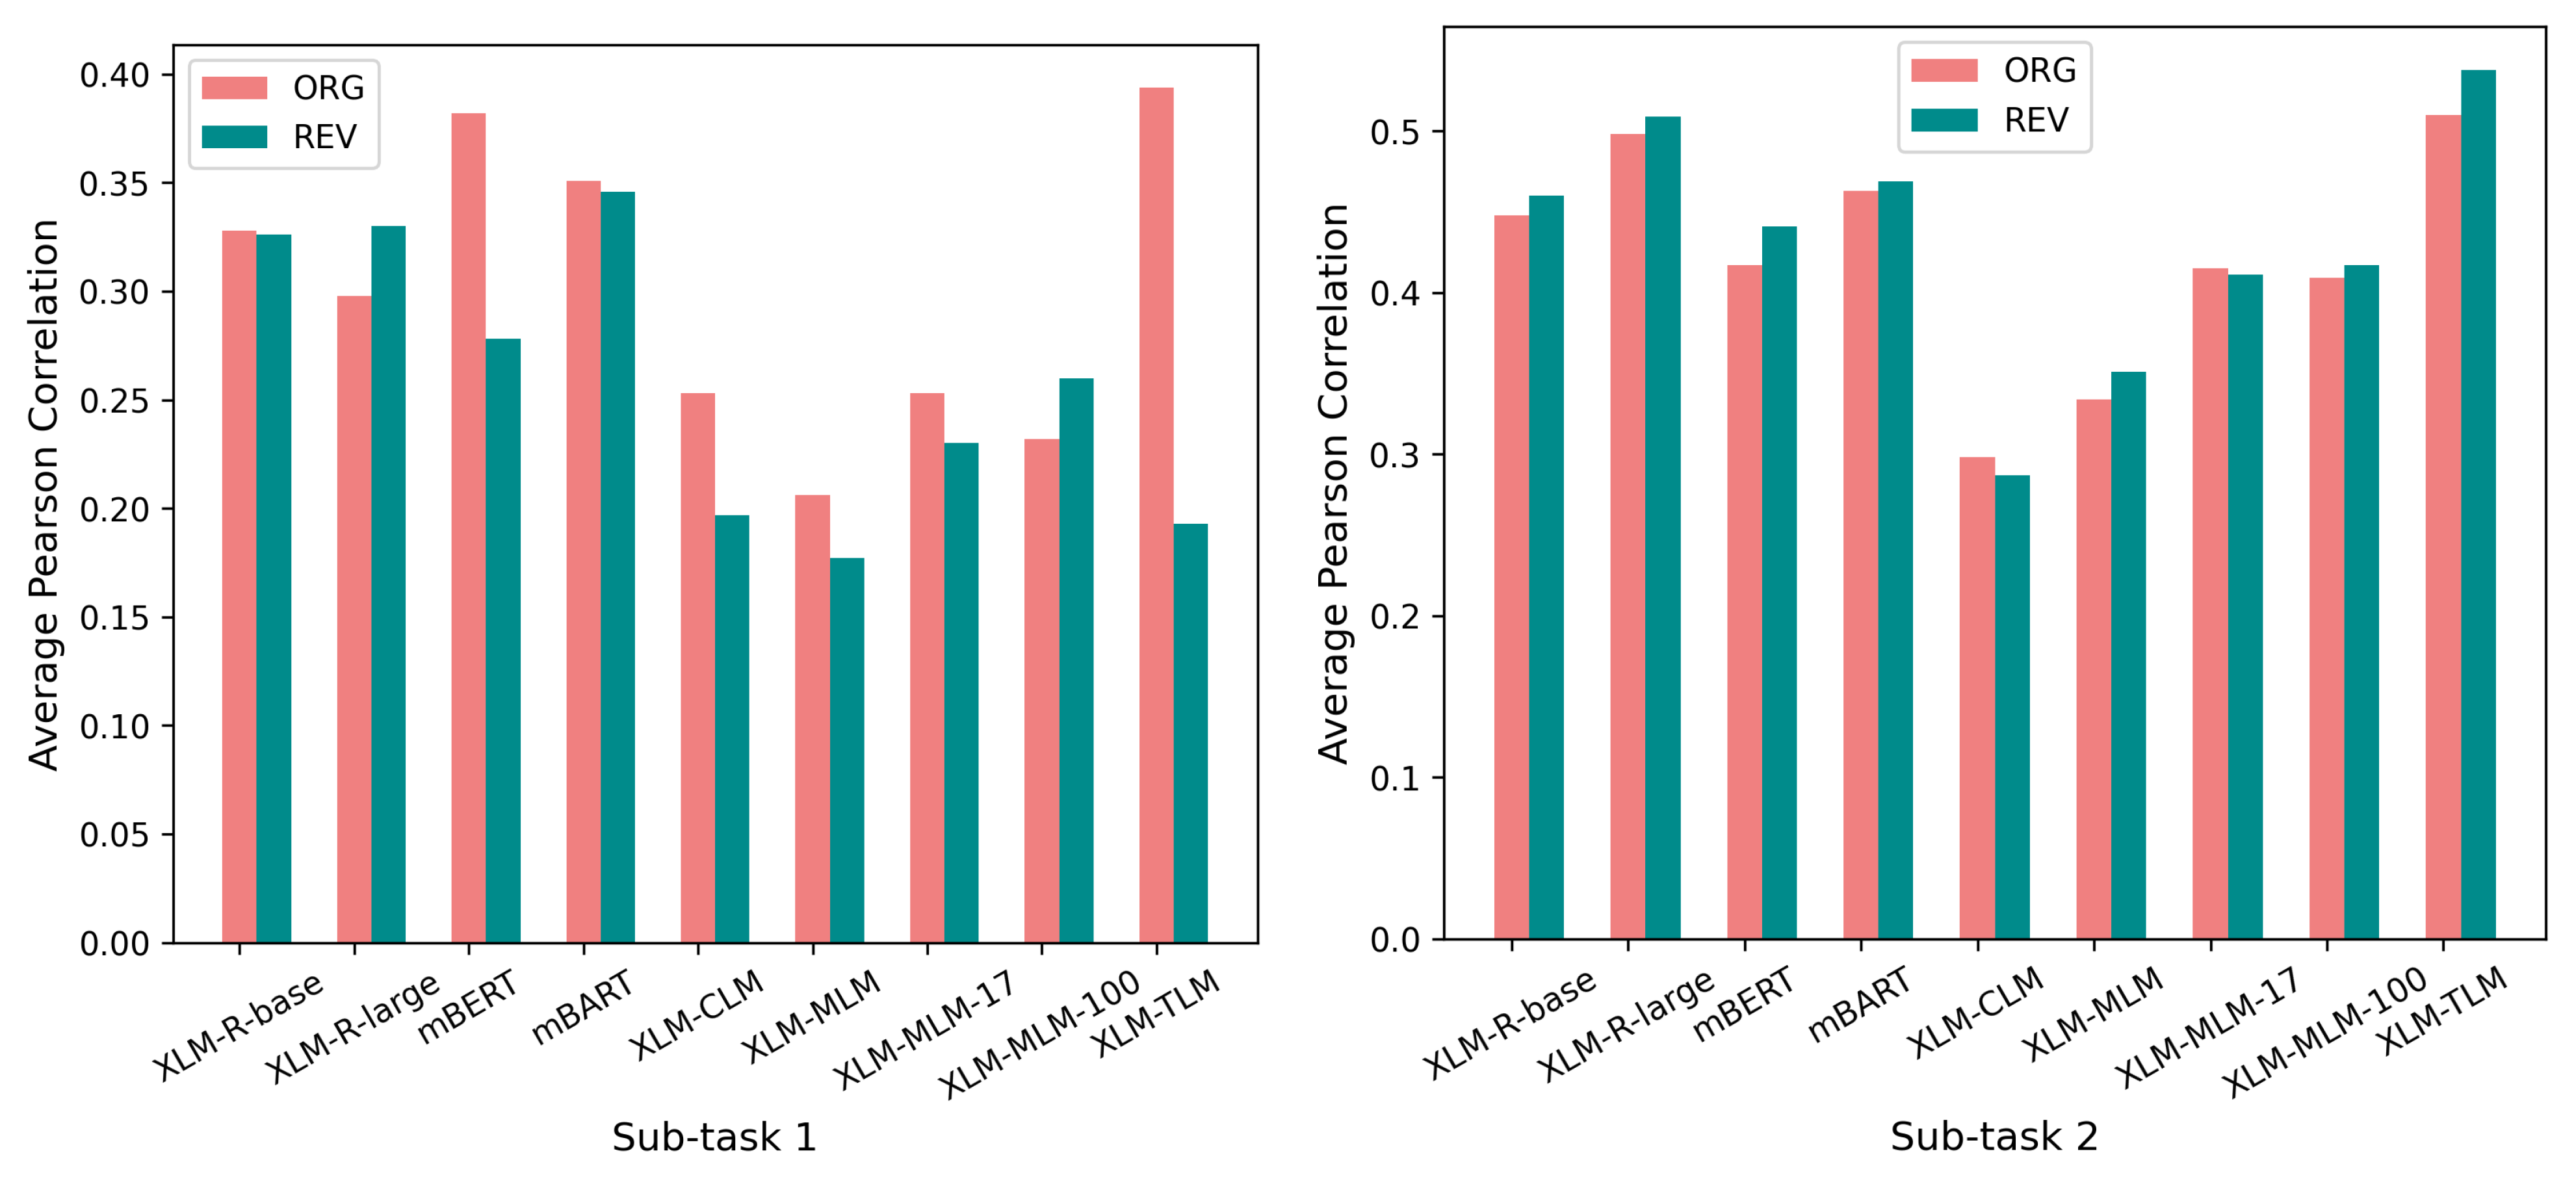
  • Through a comparative analysis concerning how to construct an appropriate input structure for QE, we reveal that the performance can be improved by simply changing the input order of the source sentence and the MT output;
  • In the process of finetuning mPLMs, we only use data officially distributed in WMT20 (without external knowledge or data augmentation) and use the official test set to ensure objectivity for all experiments.

2. Related Work and Background

A quality estimation (QE) task is a branch of machine translation. Representative metrics of NMT such as BLEU [19], METEOR [20] require reference sentences to evaluate quality of MT output. QE does not require access to reference outputs, and quality is indicated by OK/BAD tokens, numerical values, or spans, etc. QE research can be divided into three categories: the use of statistical methods, the use of recurrent neural networks (RNN) and long short-term memory (LSTM) after the advent of deep learning, and the use of pre-training and finetuning approaches with the advent of pretrained language models.
Most conventional QE studies have been conducted by extracting or selecting features to evaluate the quality of MT. When selecting such features, machine learning algorithms, such as Gaussian processes [21,22], support vector machines [23,24], and regression trees [1,25] are used. In the case of feature extraction, some studies have extracted useful features, such as linguistic features [26] and pseudo-reference features [27], using external resources such as parsers, taggers, and named entity recognizers [23,28]. However, these studies are focused on determining the complex relationship between features and references, and the process of selecting and extracting optimized features requires heuristic processes and high costs.
With the advent of deep learning, research using RNN and LSTM was mainly conducted in QE, and it achieved much higher performance improvement than statistical methods [29,30]. Kim et al. [31] proposed a new structure referred to as predictor-estimator. Predictor is a bilingual and bidirectional RNN-based word prediction model, which randomly selects and masks a word in a target sentence from a parallel corpus and then generates feature vectors by predicting it. In estimator, the generated feature vector is used as transferred knowledge to learn the QE model. This structure was able to alleviate the issue of data shortage while allowing an additional parallel corpus to be utilized for a limited amount of QE data, and it led to a dramatic performance improvement. Similar to this architecture, Wang et al. [32] constructed a QE brain model with two phases. In the first phase, features were extracted with the transformer model to be used as prior knowledge, and in the QE phase, these features were combined with human-craft features and fed into the Bi-LSTM structure to train for QE. A superior performance was also obtained using this method.
Since the advent of pre-trained language models (PLMs), the research flow of QE is mostly done based on mPLM. By designing the QE model based on the large-scale pretrained model, the performance is greatly improved. Kepler et al. [33] replaced the predictor component with a pretrained BERT or XLM model while training using the structure of a predictor-estimator. Kim et al. [34] finetuned the QE task based on mBERT. Ranasinghe et al. [35] proposed two unique approaches: MonoTransquest and SiameseTransquest. The former finetuned for a single XLM-R, while the latter used two separate XLM-R models for each of the source and target sentences, and the cosine similarity of both outputs was measured to predict the translation quality at the sentence level. Lee [12] performed data augmentation using a parallel corpus and pretrained pseudo data with XLM-R. After the process, finetuning was performed using QE data provided by WMT. Wang et al. [36] considered the pretrained transformer model as a predictor and the task-specific regressors or classifiers as an estimator instead of mPLM. In the learning process, a bottleneck adapter layer was newly added to improve the efficiency of transfer learning and prevent over-fitting.

3. Multilingual Pretrained Language Models for QE

In this section, we describe mPLMs for QE performance comparison. We used mBERT, XLM, XLM-R, and mBART, which are multilingual pretrained models that include English and German.

3.1. Multilingual BERT

BERT [37] is built on a transformer [38] architecture, which consists solely of an encoder structure.
BERT performs a self-supervised learning process for large-scale mono-lingual corpus. Because the self-supervised learning process performs supervision on raw text on its own, it does not require labeled data, so it can utilize large amounts of raw data. After performing user-defined problems such as masked language model (MLM) and next sentence prediction (NSP) on unlabeled raw data, transfer learning is performed for downstream tasks. More specifically, the user generates arbitrary tasks and labels for raw text to learn language information, and uses the representations obtained through this process as initialization values for downstream tasks. For the case of BERT, MLM, and NSP are used as pretraining schemes.
MLM is a procedure of randomly masking tokens in the original sentence with [MASK] tokens. The objectives is to correctly predict these masked tokens based on left and right context of the sentence. In particular, the last hidden vector corresponding to the mask token goes through softmax and returns as the word with the highest probability in the vocabulary. In the process of masking, 15% of the original sentences are randomly sampled, then among them, 80% of these selected tokens are replaced by [MASK], 10% are replaced by random tokens in the vocabulary, and 10% remain unchanged. Through this masking process, a defective sentence X ¯ = { x ¯ 1 , x ¯ 2 , , x ¯ n } is generated from an unlabeled monolingual sentence X = { x 1 , x 2 , , x n } . In the training process, X ¯ is fed into a BERT model, which is parameterized by θ , and the model is then trained to return X. This task can be described by Equation (1).
max θ ( X , X ¯ ) D i = 1 n log P ( x i x ¯ 1 , , x ¯ n , θ )
This equation indicates that a model is trained to predict an original token x i by considering a defective sentence X ¯ . By referring to nearby context while restoring a [MASK] token, a model can be trained using bidirectional contextual representation.
NSP is a binary classification task that aims to train by understanding sentence relationships. In the training process, two sentences are concatenated to construct inputs, and these sentences are then selected from an unlabeled monolingual corpus based on a probability. Successive sentences are selected for half of the time, while randomly picked sentences are chosen otherwise. The main objective of NSP is to distinguish whether these input sentences are successive or not. Through this training process, a model can obtain an improved understanding of relationships between sentences.
Multilingual BERT (mBERT) [7] is a BERT-based multilingual model. The same pretraining schemes as BERT (MLM and NSP) are adopted for mBERT. However, unlike BERT, mBERT is trained with a multilingual unlabeled corpus, which is comprised of 104 languages.
The way we adapt mBERT to a QE task is as follows. For the assessment of an entire sentence, we leverage the first hidden representation obtained from the mBERT model. By applying a linear classification head without the activation function, we can obtain the final prediction score of the sentence. Therefore, the sentence assessment score s c o r e s e n t e n c e is derived from an encoded representation of the input sentence, H = { h 1 , h 2 , , h m } , as shown in Equation (2).
s c o r e s e n t e n c e = W · h 1 + b
In Equation (2), W R 1 × h i d d e n and b R 1 × 1 are trainable parameters where h i d d e n indicates the hidden layer size of pretrained mBERT. During the QE training process, the mean squared error (MSE) loss between s c o r e s e n t e n c e and the label score is considered.

3.2. Cross-Lingual Language Model

XLM [8] is a transformer-based model that extends existing language model pretraining methods, which mainly focus on a monolingual language representation, to the multiple language representation. XLM is pretrained through MLM and CLM by leveraging a multilingual unlabeled corpus. To achieve a better multilingual language understanding, TLM, which is a pretraining scheme utilizing a parallel corpus, is applied. Unlike mBERT, NSP is not considered during pretraining.
CLM is a pretraining scheme in which the objective is to model the probability of a word given the previous words in a sentence. This can be described as in Equation (3).
max θ X D i = 1 n log P ( x i x t < i , θ )
It can be said that the goal of CLM is to maximize the probability of a token based on preceding tokens. Through this process, a model can obtain an improved language understanding.
TLM is an extension of MLM and improves cross-lingual understanding by utilizing parallel data in the pretraining phase. The source and target sentences of a parallel corpus are first connected, and then some tokens in these sentences are replaced with [MASK] tokens. The training objective of TLM predicts masked tokens the same as in mBERT. However, masked tokens can be predicted by referring to the surrounding context of the masked tokens, as well as sentences from other languages concatenated. It is characterized by TLM that by predicting masked tokens by referencing both languages simultaneously, a representation containing information between languages can be obtained.
This can be described as shown in Equation (4).
max θ ( X , Y , X ¯ , Y ¯ ) D i M x log P ( x i X ¯ : Y ¯ , θ ) + j M y log P ( y j X ¯ : Y ¯ , θ )
In Equation (4), X ¯ : Y ¯ indicates corrupted input data where X ¯ is a source sentence component and Y ¯ is a target sentence component. M x and M y are index sets that consist of the indices indicating masked tokens in the source and target sentences, respectively. When predicting a masked word in a source sentence during the training process, a model can refer to the nearby source language context, as well as target sentence. This can encourage the model to acquire a better understanding of multilingual representation. Additionally, to obtaining decent multilingual representation, distinct language embeddings, and respective position embeddings are applied to each language.
XLM utilizes Wikipedia data for the pretraining of various languages. As the amount of established Wikipedia data differs for each language, bias towards high-resource languages can be obtained if such data are utilized without any preprocessing. To alleviate the data imbalance problem, different sampling ratios are applied in the training process. The applied sampling ratios are determined using a multinomial distribution, which is denoted in Equation (5).
q i = p i α j = 1 N p j α where p i = n i j = 1 N n j
Here, q i indicates a sampling ratio for the i t h language data, with amount n i , among the total dataset that comprises N languages. α is a hyperparameter that is set to 0.7 for the pretraining of XLM, such that the sampling ratio is increased for low-resource languages and decreased for high-resource languages.
For the XLM-based QE model, the overall training process is similar to Section 3.1, except that positional embeddings that encode absolute positions and language embeddings that indicate the language of each token are applied.

3.3. XLM-RoBERTa

Because XLM learns using Wikipedia, there is a limitation in that data on low resource language is insufficient. In XLM-R [9], the data are expanded to a much larger scale. XLM-R is a multilingual masked language model that adopts large-scale pretraining by utilizing CommonCrawl data [39], which comprises 100 languages. XLM-R gains state-of-the-art performance for cross-lingual classification, question answering, and sequence labeling. Among the three pretraining schemes for XLM, only MLM is utilized for XLM-R training, and MLM proceeds in the same way as XLM. By expanding the model capacity and leveraging larger data sizes than permitted for XLM, XLM-R alleviates the performance degradation caused by the curse of multilinguality.
The curse of multilinguality represents a trade-off between the number of languages in the training data and the model performance at a fixed model capacity. Increasing the number of languages in training data can encourage an improved performance for monolingual and cross-lingual benchmarks to a certain extent because the understanding of low-resource languages is supported by similar high-resource languages. However, if the model capacity is fixed, an excessive number of languages will lead to the overall performance degradation of this method because of the decrease in the per-language capacity. XLM-R alleviates this problem by extending the number of model parameters.
XLM-R adopts a multinomial distribution (5) for applying different sampling ratios to each language. Unlike XLM, XLM-R sets α to 0.3 to strengthen the sampling ratio of low-resource languages. The training process for the XLM-R-based QE model is similar to that of Section 3.1.

3.4. Multilingual BART

BART [40] is a denoising autoencoder that corrupts the text by adding arbitrary noise and trains the model to restore it to the original text. mBART [18] is an extension of BART that has been applied to large monolingual corpora across multiple languages. mBART was trained using a 25-language corpus from CommonCrawl data (CC25).
BART utilizes 5 pretraining schemes leveraging a monolingual corpus: token masking, token deletion, text infilling, document rotation, and sentence permutation. Among these pretraining schemes, mBART adopts text infilling and sentence permutation. In the case of text filling, unlike MLM in which one token in the original sentence is replaced with one [MASK] token, spans of tokens are replaced with one masked token. The total number of selected tokens is 35% of the entire sentence, and the length of the masked token is determined based on the Poisson distribution, which is described in Equation (6).
f ( n : λ ) = λ n e λ n !
Here, f ( n : λ ) indicates the probability of selecting n as the masking length. mBART sets λ to 3.5 for pretraining. By training to reconstruct masked sentences, which are generated by text infilling, a model can be trained for bidirectional contextual understanding, as well as to determine how many tokens should be restored from a single mask token.
In the case of sentence permutation, the text is corrupted by changing the order of the sentences within each instance. In the process of restoring the noise injected by sentence permutation to the original text, the model can understand information about the relationship between sentences.
Similar to XLM and XLM-R, mBART adopts an up-down sampling method to achieve improved training for low-resource languages. The sampling ratio λ i applied to the i t h language data is provided by Equation (7).
λ i = 1 p i p i α j = 1 N p j α
Here, p i is the percentage of each language in the total dataset. The amount of training data for each language are rebalanced according to Equation (7), and, therefore, sampling from high-resource languages is relatively suppressed while sampling from low-resource languages is encouraged. The training process of the QE model leveraging mBART is similar to that of Section 3.1, wherein the same input structure as in pretraining is utilized.

4. Brief Introduction of the WMT20 QE Sub-Tasks

4.1. Sub-Task 1

Sub-task 1 is a sentence-level direct assessment task. This task consists of scoring MT output according to a perceived quality score called direct assessment. A limitation of human translation error rate (HTER) [41] is that it does not capture the extent to which MT errors affect the overall quality of a sentence. The objective of sub-task 1 is to measure the overall quality of sentences through direct assessment (DA) by translation experts. One of the goals of QE in relation to this task is to investigate the relationship between a model for predicting DA scores and a model trained to predict post-editing tasks [15]. The DA score is a value obtained by evaluating the quality of the MT output from 0 to 100 by at least three professional translators. Using a total of 7K training data and 1K evaluation data, systems participating in this sub-task measure quality by predicting the mean z-standardized DA score of the MT output.

4.2. Sub-Task 2

Sub-task 2 is word- and sentence-level post-editing efforts. The objective of sub-task 2 is to improve post-editing by tagging which tokens have been mistranslated, along with the overall quality of the sentence. At the word level, this task consists of evaluating whether the translation was successful for each token in the MT output and source sentence based on the human post-edited sentences. The tokens of the source and target sides are tagged as OK or BAD. In the case of the target sentences, a gap tag is added considering the case of missing words between the tokens. If the number of tokens in the target sentence is N, the total number of tag tokens is 2N+1. Participating systems predict tags for MT output tokens and source sentence tokens.
Similar to sub-task 1, a sentence-level post-editing effort task is used to measure the quality score for the MT output based on the human translation error rate (HTER) [41]. HTER is similar to the translation error rate (TER), wherein the TER compares the MT output with a reference translation and counts how many edits (substitutions, deletions, and insertions) must be performed to obtain a correct sentence. This value divided by the reference length is the TER score. HTER differs from TER in that humans create new reference translations for the MT output. Using these new reference translations can lead to correct sentences with minimal modifications compared to the use of other reference translations. Referring to the source sentence and the MT output, the participating system predicts the quality of the MT output sentence based on the HTER.

5. Question 1: Which mPLM Is Best for QE Tasks?

5.1. Dataset Details

In this study, we conducted experiments concerning sub-tasks 1 and 2 at the sentence-level of WMT20 based on various mPLMs. We experimented using the English–German language pair and used train, dev and test data provided by WMT20 (http://www.statmt.org/wmt20/quality-estimation-task.html, accessed on 15 July 2021). Table 1 shows a summary of the data for each sub-task.
In the case of sub-task 1, there is a total of 7k training data, and the numbers of source and MT output tokens are 98,127 and 97,453, respectively. The average of the mean z-standardized DA score is −0.008 and the median is 0.162. The development and test data consist of a total of 1K data, and there are approximately 14K source and MT output tokens. The development and test data provide average scores of −0.049 and 0.040, and the respective median scores are slightly higher at 0.211 and 0.319.
In the case of sub-task 2 at the sentence-level, the number of sentences is 7K in the training data and 1K in each of the development and test data, as in sub-task 1. The average HTER score is distributed around 0.3, and the median value either does not significantly differ or is slightly lower than the average value. HTER is centered around values lower than the error rate of 0.5.

5.2. Model Details

We conducted a finetuning performance comparison using a total of 9 models including XLM-R base, XLM-R large, mBERT, mBART, XLM-CLM, XLM-MLM, XLM-MLM-17, XLM-MLM-100, and XLM-TLM. English–German was used as the language pair for this experiment, and performance comparisons were conducted for each mPLM at sub-task 1 and sub-task 2 sentence-levels. These models are described as follows:
  • XLM-R-base: Pretraining was performed with 220M parameters, 12 layers, 8 heads, and 768 hidden states.
  • XLM-R-large: Pretraining was performed using 550M parameters. The hidden states were expanded to 1024, and 24 layers, and 16 heads were used, which is twice the scale of the base model.
  • mBERT: The model parameters of mBERT were 110M, 12 layers, 768 hidden states, and 12 heads.
  • mBART: mBART was pretrained with 610M parameters, 24 layers, 1024 hidden states, and 16 heads.
  • XLM-CLM: A pretrained CLM for English and German. In total, 6 layers, 1024 hidden states, and 8 heads were used.
  • XLM-MLM: A pretrained MLM for English and German. In total, 6 layers, 1024 hidden states, and 8 heads were used.
  • XLM-MLM-17: Pretraining was conducted by expanding the MLM into 17 languages. It was trained using 570M parameters, 16 layers, 1280 hidden states, and 16 heads.
  • XLM-MLM-100: Pretraining was conducted by expanding the MLM into 100 languages. It was trained using 570M parameters, 16 layers, 1280 hidden states, and 16 heads.
  • XLM-TLM: TLM was performed for 15 languages. In total, 12 layers, 1024 hidden states, and 8 heads were used.
We performed finetuning using the pretrained model released in HuggingFace’s transformers library [42]. We did not proceed with additional pretraining and data augmentation so that the pure performances of the mPLMs could be objectively evaluated and compared in the QE task.
In preprocessing, we performed subword tokenization using the tokenizer provided for each model in HuggingFace. For the model input, we added segment embeddings for mBERT, listing tokens separated by 0 and 1 to give a distinction between sentence 1 and sentence 2. XLM has added a position embedding that gives a number corresponding to the token index for each source sentence and MT output, as well as a language embedding that is segmented by a unique number for each language.
As a training procedure for finetuning, we first load mPLMs to initialize the parameters. After that, additional embeddings for each model are put as input to the model along with the sentences concatenated with the source and target sentences. We put the output corresponding to the position of the [CLS] token among the last hidden states as an input to the linear classifier and measured the loss between the predicted value and the label. We use the mean squared error (MSE) loss as the loss function.
We found that the model has a diverse range of performance fluctuations depending on the seed value, and we attempted to reduce the effect of the seed value on the general performance of the model. To achieve this, we conduct five experiments using the same model and compare the average values, as well as the minimum and maximum performance values, thereby increasing the reliability of the experimental results.

5.3. Experimental Results for Question 1

5.3.1. Sub-Task 1

To check which model out of various mPLMs performs well for the QE task, we raise question 1, and proceed with finetuning using mPLMs. The experimental results for the QE of sub-task 1 (i.e., the direct assessment at the sentence-level) are shown in Table 2.
As a result of the experiment, XLM-TLM showed the highest performance for sub-task 1 with a Pearson correlation coefficient of 0.442. In terms of the minimum and average performances, this system consistently demonstrated the highest performance compared to the other models. To investigate the cause of this result, we need to focus on the input data of XLM-TLM in the pretraining process.
The XLM-TLM model utilizes parallel data during pretraining and can refer to the context of either side when predicting the source- and target-side masked words. Likewise, in the QE field, the concatenating sentences of the source and target language are provided as an input to the model. This is similar to the form of the input for the XLM-TLM model in that it provides sentences in both languages as the input, while the other models use the mono data of multiple languages. According to Lample and Conneau [8], when predicting a masked word during XLM-TLM learning, the model can be encouraged to align the source and target language representations by attending the translated sentence along with the surrounding masked word. Therefore, when using the aligned representation derived between the source and target languages in the XLM-TLM model for QE, it is possible to infer what part of the translated sentence is wrong. The model with the second highest average performance is the mBERT model. This model provided approximately 0.012 less than that of the first-ranked model and demonstrates a comparable performance. mBART did not show a strong performance in the regression task, but the maximum value only showed a difference of about 0.005 compared to the mBERT model. Both models apply various noising schemes during pretraining, and it can be predicted that this strategy will help improve their performance.
In the case of XLM-R-large, many research groups that participated in WMT20 used this model; however, for sub-task 1, it was not ranked high. When comparing the average Pearson correlation coefficients of the models based on XLM, XLM-MLM-17 was 0.021 higher than that of XLM-MLM-100, and XLM-MLM, which learned only English and German, showed the lowest performance. XLM-MLM-17 and XLM-MLM-100 are approximately twice the size of XLM-MLM considering the number of layers and hidden states, etc. and the languages were also expanded to 17 and 100 languages, respectively. It can be inferred that the number of languages and model capacity helped to improve the performance for QE.
To answer subtask 2, we refer back to the question we posed. Which mPLM is best for QE tasks? For the question, XLM-TLM model that learned cross-lingual understanding performed the best in sub-task 1.

5.3.2. Sub-Task 2

The finetuning results for sub-task 2 (sentence-level post editing effort) are shown in Table 3. High performances were achieved in the descending order of XLM-TLM, XLM-R-large, mBART, XLM-R-base, mBERT, XLM-MLM-17, XLM-MLM-100, XLM-MLM, and XLM-CLM based on the average Pearson correlation coefficient. As a result of this experiment, XLM-TLM showed the highest performance based on the average, minimum, and maximum Pearson correlation coefficients, similar to the previous experimental results for sub-task 1. As analyzed in sub-task 1, because XLM-TLM was induced to learn alignment information for language pairs using parallel corpus, it can be predicted that this process contributes significantly to its performance improvement for QE, which requires knowledge of relationships between languages. In sub-task 2, the XLM-R-large model showed the best performance after XLM-TLM. A fairly comparable performance was demonstrated with an average Pearson correlation coefficient of 0.498. XLM-R-large is the latest model among the mPLM models considered in this study. As mentioned in Section 3.3, a state-of-the-art performance among cross-lingual models was achieved by expanding the number of parameters considering the large amount of data and the curse of multilinguality. Nevertheless, XLM-R did not learn the relationship between the source and target sentences because it learned the mono corpus in an unsupervised manner. In QE, the source sentence and MT output are referenced together to determine which part has been incorrectly translated, and, therefore, this characteristic did not produce an optimal effect compared to XLM-TLM. Although mBART is a sequence-to-sequence model, it ranks third in the regression task with a higher performance than all XLM models. As an extension of MLM, mBART uses a pretraining scheme referred to as text infilling and sentence permutation, and an average Pearson correlation coefficient of 0.463 was obtained. This result was significantly higher than those of XLM-MLM (0.334), XLM-MLM-17 (0.415), and XLM-MLM-100 (0.409), which used only MLM. Therefore, it can be confirmed that the additional strategy of mBART had a positive effect on the improvement of QE performance during finetuning. mBERT showed an average Pearson correlation coefficient of 0.417 in sub-task 2 and did not demonstrate a very high performance when compared with the sub-task 1 results. Considering the comparison of the various XLMs, XLM-MLM-17 performed slightly better than XLM-MLM-100 (as in sub-task 1), while XLM-CLM ranked lower than XLM-MLM, which exhibited the lowest performance in sub-task 1.
To answer subtask 2, we refer back to the question we posed. Which mPLM is best for QE tasks? For the question, we can explain that the XLM-TLM model also performed best in sub-task 2.

6. Question 2: Does the Input Order of the Source Sentence and the MT Output Sentence Affect the Performance of the Model?

6.1. Revisiting the QE Input Structure

In this section, we investigate the differences between the input structures used for QE training. Existing QE studies generally construct an input using the following shapes: [BOS] Source sentence [EOS] [EOS] MT output [EOS] or [BOS] MT output [EOS] [EOS] Source sentence [EOS], where the beginning of sentence (BOS) and end of sentence (EOS) tokens can be viewed as [CLS] and [SEP], respectively, depending on the pretraining methods that were used. Previously, Baek et al. [13], Fomicheva et al. [14], Ranasinghe et al. [35] adopted a prior structure as an input, while Moura et al. [4], Kepler et al. [33] adopted a posterior structure. Although decent performances can be achieved by adopting these structures, sufficient investigations concerning the selection of an input structure have not been conducted. In other words, clear criteria for constructing an adequate input structure have not yet been presented. Here, we focus on the inconsistent input structures utilized in current QE studies and quantitatively analyze the differences derived from adopting different input structures.

6.2. Experimental Results for Question 2

In order to check whether the order of the input sentence affects the performance while performing QE finetuning, we raise question 2 and compare the sentence order with the reversed sentence order when constructing the input sequence. The experimental results for sub-task 1 are shown in Table 4. As a result of this experiment, it can be observed that the model performance changes by simply reversing the order of the input sentence. In this table, we denote Avg Diff as the difference between the average Pearson correlation coefficients of the original input and reverse orders. As can be seen from the Avg Diff values, when the input sentence order was reversed, the average Pearson correlation coefficient of XLM-R-large improved by +0.032, while that of XLM-MLM-100 improved by +0.008. However, for all other models, the performance deteriorated when the order of the input sentences was reversed. Likewise, in Figure 1, it was confirmed that the overall reversed order input sentences in sub-task 1 did not help to improve the performance of the model.
Conversely, in the case of sub-task 2, the result of reversing the input sentences provided a better overall performance. As can be seen in Table 5 and Figure 1, only two models of XLM-CLM and XLM-MLM-17 declined in performance based on the average Pearson correlation coefficient, while all other models consistently exhibited improved performances. In particular, the range of performance fluctuations was high in both XLM-TLM and mBERT. These two models also showed the highest variation in sub-task 1, and it can, therefore, be said that these models respond most sensitively to the input sentence order. The models with the lowest performance fluctuations were XLM-MLM-17 and mBART. In the case of mBART, there was little change in performance even in sub-task 1, and there was no significant change in the performance in response to the varied input structure.
We refer again to the question we asked. Does the input order of the source sentence and the MT output sentence affect the performance of the model? Through these experiments, we determined that the performance fluctuation of the input order varies depending on the sub-task. To the question, we can answer that the structure of the input is a factor that affects the performance of the model, and it must, therefore, be considered before conducting such experiments.

7. Conclusions

Most recent studies of QE apply data augmentation with finetuning based on state-of-the-art large scale mPLM, such as XLM-R, to obtain a high performance for a WMT shared task. In this study, unlike typical QE research that focused on the competition involving a shared task, we conducted a pure performance comparison between various mPLMs. As a result of the experiments, we confirmed that the XLM-TLM model performed best on both sub-tasks, and that the induced learning of alignment between languages during pre-training had a positive impact. Additionally, we conducted experiments using mBART for the first time, and its additional noising schemes had a positive effect on QE research. Therefore, we confirmed the feasibility of using the mBART model in further QE research. We demonstrated that the order of the input sequence between the source sentence and its MT output can affect the model performance. In the future, we will further investigate data-centric issues that are not model-based [43,44]. By filtering data based on the HTER score, we will explore which score ranges contribute significantly to the performance of a model and provide a basis for future data-centric research on QE. In addition, we plan to conduct an in-depth study on low resource language QE. We plan to study a methodology that can automatically generate data based on a semi-supervised learning method.

Author Contributions

Conceptualization, C.P.; methodology/software, S.E.; validation, S.E. and H.M.; formal analysis, S.E. and C.P.; investigation, S.E. and H.M.; review and editing, H.M. and J.S.; supervision/project administration, C.P.; funding acquisition, H.L. All authors have read and agreed to the published version of the manuscript.

Funding

This research was supported by the MSIT (Ministry of Science and ICT), Korea, under the ITRC (Information Technology Research Center) support program (IITP-2018-0-01405) supervised by the IITP (Institute for Information & Communications Technology Planning & Evaluation) and the MSIT, Korea, under the ICT Creative Consilience program (IITP-2021-2020-0-01819) supervised by the IITP. Additionally, this work was supported by Institute for Information & communications Technology Planning & Evaluation (IITP) grant funded by the Korea government (MSIT) (No. 2020-0-00368, A Neural-Symbolic Model for Knowledge Acquisition and Inference Techniques).

Institutional Review Board Statement

Not applicable.

Informed Consent Statement

Not applicable.

Data Availability Statement

Publicly available datasets were analyzed in this study. The data can be found here: WMT20 English-German QE dataset: http://www.statmt.org/wmt20/quality-estimation-task.html (accessed on 15 July 2021).

Conflicts of Interest

The authors declare no conflict of interest.

References

  1. Specia, L.; Shah, K.; De Souza, J.G.; Cohn, T. QuEst-A translation quality estimation framework. In Proceedings of the 51st Annual Meeting of the Association for Computational Linguistics: System Demonstrations, Sofia, Bulgaria, 4–9 August 2013; pp. 79–84. [Google Scholar]
  2. Specia, L.; Raj, D.; Turchi, M. Machine translation evaluation versus quality estimation. Mach. Transl. 2010, 24, 39–50. [Google Scholar] [CrossRef]
  3. do Carmo, F.; Shterionov, D.; Moorkens, J.; Wagner, J.; Hossari, M.; Paquin, E.; Schmidtke, D.; Groves, D.; Way, A. A review of the state-of-the-art in automatic post-editing. Mach. Transl. 2020, 1–43. [Google Scholar] [CrossRef]
  4. Moura, J.; Vera, M.; van Stigt, D.; Kepler, F.; Martins, A.F. Ist-unbabel participation in the wmt20 quality estimation shared task. In Proceedings of the Fifth Conference on Machine Translation, Online, 19–20 November 2020; pp. 1029–1036. [Google Scholar]
  5. Nakamachi, A.; Shimanaka, H.; Kajiwara, T.; Komachi, M. Tmuou submission for wmt20 quality estimation shared task. In Proceedings of the Fifth Conference on Machine Translation, Online, 19–20 November 2020; pp. 1037–1041. [Google Scholar]
  6. Rubino, R. Nict kyoto submission for the wmt’20 quality estimation task: Intermediate training for domain and task adaptation. In Proceedings of the Fifth Conference on Machine Translation, Online, 19–20 November 2020; pp. 1042–1048. [Google Scholar]
  7. Pires, T.; Schlinger, E.; Garrette, D. How multilingual is multilingual bert? arXiv 2019, arXiv:1906.01502. [Google Scholar]
  8. Lample, G.; Conneau, A. Cross-lingual language model pretraining. arXiv 2019, arXiv:1901.07291. [Google Scholar]
  9. Conneau, A.; Khandelwal, K.; Goyal, N.; Chaudhary, V.; Wenzek, G.; Guzmán, F.; Grave, E.; Ott, M.; Zettlemoyer, L.; Stoyanov, V. Unsupervised cross-lingual representation learning at scale. arXiv 2019, arXiv:1911.02116. [Google Scholar]
  10. Conneau, A.; Lample, G.; Rinott, R.; Williams, A.; Bowman, S.R.; Schwenk, H.; Stoyanov, V. XNLI: Evaluating cross-lingual sentence representations. arXiv 2018, arXiv:1809.05053. [Google Scholar]
  11. Lewis, P.; Oğuz, B.; Rinott, R.; Riedel, S.; Schwenk, H. Mlqa: Evaluating cross-lingual extractive question answering. arXiv 2019, arXiv:1910.07475. [Google Scholar]
  12. Lee, D. Two-phase cross-lingual language model fine-tuning for machine translation quality estimation. In Proceedings of the Fifth Conference on Machine Translation, Online, 19–20 November 2020; pp. 1024–1028. [Google Scholar]
  13. Baek, Y.; Kim, Z.M.; Moon, J.; Kim, H.; Park, E. Patquest: Papago translation quality estimation. In Proceedings of the Fifth Conference on Machine Translation, Online, 19–20 November 2020; pp. 991–998. [Google Scholar]
  14. Fomicheva, M.; Sun, S.; Yankovskaya, L.; Blain, F.; Chaudhary, V.; Fishel, M.; Guzmán, F.; Specia, L. Bergamot-latte submissions for the wmt20 quality estimation shared task. In Proceedings of the Fifth Conference on Machine Translation, Online, 19–20 November 2020. [Google Scholar]
  15. Specia, L.; Blain, F.; Fomicheva, M.; Fonseca, E.; Chaudhary, V.; Guzmán, F.; Martins, A.F.T. Findings of the WMT 2020 Shared Task on Quality Estimation. In Proceedings of the Fifth Conference on Machine Translation, Online, 19–20 November 2020; pp. 743–764. [Google Scholar]
  16. Zhou, L.; Ding, L.; Takeda, K. Zero-shot translation quality estimation with explicit cross-lingual patterns. arXiv 2020, arXiv:2010.04989. [Google Scholar]
  17. Ranasinghe, T.; Orasan, C.; Mitkov, R. TransQuest: Translation Quality Estimation with Cross-lingual Transformers. In Proceedings of the 28th International Conference on Computational Linguistics, Barcelona, Spain, 12 December 2020; pp. 5070–5081. [Google Scholar] [CrossRef]
  18. Liu, Y.; Gu, J.; Goyal, N.; Li, X.; Edunov, S.; Ghazvininejad, M.; Lewis, M.; Zettlemoyer, L. Multilingual denoising pre-training for neural machine translation. Trans. Assoc. Comput. Linguist. 2020, 8, 726–742. [Google Scholar] [CrossRef]
  19. Papineni, K.; Roukos, S.; Ward, T.; Zhu, W.J. BLEU: A method for automatic evaluation of machine translation. In Proceedings of the 40th Annual Meeting on Association for Computational Linguistics, Philadelphia, PA, USA, 7–12 July 2002; pp. 311–318. [Google Scholar]
  20. Banerjee, S.; Lavie, A. METEOR: An automatic metric for MT evaluation with improved correlation with human judgments. In Proceedings of the Acl Workshop on Intrinsic and Extrinsic Evaluation Measures for Machine Translation and/or Summarization, Ann Arbor, MI, USA, 29 June 2005; pp. 65–72. [Google Scholar]
  21. Shah, K.; Cohn, T.; Specia, L. A bayesian non-linear method for feature selection in machine translation quality estimation. Mach. Transl. 2015, 29, 101–125. [Google Scholar] [CrossRef] [Green Version]
  22. Cohn, T.; Specia, L. Modelling annotator bias with multi-task gaussian processes: An application to machine translation quality estimation. In Proceedings of the 51st Annual Meeting of the Association for Computational Linguistics, Sofia, Bulgaria, 4–9 August 2013; Volume 1, pp. 32–42. [Google Scholar]
  23. Hardmeier, C.; Nivre, J.; Tiedemann, J. Tree kernels for machine translation quality estimation. In Proceedings of the Seventh Workshop on Statistical Machine Translation, Montréal, QC, Canada, 7–8 June 2012; pp. 109–113. [Google Scholar]
  24. Soricut, R.; Bach, N.; Wang, Z. The SDL language weaver systems in the WMT12 quality estimation shared task. In Proceedings of the Seventh Workshop on Statistical Machine Translation, Montreal, QC, Canada, 7–8 June 2012; pp. 145–151. [Google Scholar]
  25. Moreau, E.; Vogel, C. Quality estimation: An experimental study using unsupervised similarity measures. In Proceedings of the Seventh Workshop on Statistical Machine Translation, Montréal, QC, Canada, 7–8 June 2012; pp. 120–126. [Google Scholar]
  26. Felice, M.; Specia, L. Linguistic features for quality estimation. In Proceedings of the Seventh Workshop on Statistical Machine Translation, Montréal, QC, Canada, 7–8 June 2012; pp. 96–103. [Google Scholar]
  27. Scarton, C.; Specia, L. Exploring consensus in machine translation for quality estimation. In Proceedings of the Ninth Workshop on Statistical Machine Translation, Baltimore, MD, USA, 26–27 June 2014; pp. 342–347. [Google Scholar]
  28. Luong, N.Q.; Lecouteux, B.; Besacier, L. LIG system for WMT13 QE task: Investigating the usefulness of features in word confidence estimation for MT. In Proceedings of the 8th Workshop on Statistical Machine Translation, Sofia, Bulgaria, 8–9 August 2013; pp. 386–391. [Google Scholar]
  29. Kim, H.; Lee, J.H. Recurrent neural network based translation quality estimation. In Proceedings of the First Conference on Machine Translation, Berlin, Germany, 11–12 August 2016; Volume 2, pp. 787–792. [Google Scholar]
  30. Patel, R.N. Translation quality estimation using recurrent neural network. arXiv 2016, arXiv:1610.04841. [Google Scholar]
  31. Kim, H.; Lee, J.H.; Na, S.H. Predictor-estimator using multilevel task learning with stack propagation for neural quality estimation. In Proceedings of the Second Conference on Machine Translation, Copenhagen, Denmarkm, 7–8 September 2017; pp. 562–568. [Google Scholar]
  32. Wang, J.; Fan, K.; Li, B.; Zhou, F.; Chen, B.; Shi, Y.; Si, L. Alibaba submission for WMT18 quality estimation task. In Proceedings of the Third Conference on Machine Translation: Shared Task Papers, Brussels, Belgium, 31 October–1 November 2018; pp. 809–815. [Google Scholar]
  33. Kepler, F.; Trénous, J.; Treviso, M.; Vera, M.; Góis, A.; Farajian, M.A.; Lopes, A.V.; Martins, A.F. Unbabel’s Participation in the WMT19 Translation Quality Estimation Shared Task. arXiv 2019, arXiv:1907.10352. [Google Scholar]
  34. Kim, H.; Lim, J.H.; Kim, H.K.; Na, S.H. QE BERT: bilingual BERT using multi-task learning for neural quality estimation. In Proceedings of the Fourth Conference on Machine Translation, Florence, Italy, 1–2 August 2019; Volume 3, pp. 85–89. [Google Scholar]
  35. Ranasinghe, T.; Orasan, C.; Mitkov, R. TransQuest at WMT2020: Sentence-Level Direct Assessment. arXiv 2020, arXiv:2010.05318. [Google Scholar]
  36. Wang, M.; Yang, H.; Shang, H.; Wei, D.; Guo, J.; Lei, L.; Qin, Y.; Tao, S.; Sun, S.; Chen, Y.; et al. Hw-tsc’s participation at wmt 2020 quality estimation shared task. In Proceedings of the Fifth Conference on Machine Translation, Online, 19–20 November 2020; pp. 1056–1061. [Google Scholar]
  37. Devlin, J.; Chang, M.W.; Lee, K.; Toutanova, K. Bert: Pre-training of deep bidirectional transformers for language understanding. arXiv 2018, arXiv:1810.04805. [Google Scholar]
  38. Vaswani, A.; Shazeer, N.; Parmar, N.; Uszkoreit, J.; Jones, L.; Gomez, A.N.; Kaiser, Ł.; Polosukhin, I. Attention is all you need. In Proceedings of the Advances in Neural Information Processing Systems, Long Beach, CA, USA, 4–9 December 2017; pp. 5998–6008. [Google Scholar]
  39. Wenzek, G.; Lachaux, M.A.; Conneau, A.; Chaudhary, V.; Guzman, F.; Joulin, A.; Grave, E. Ccnet: Extracting high quality monolingual datasets from web crawl data. arXiv 2019, arXiv:1911.00359. [Google Scholar]
  40. Lewis, M.; Liu, Y.; Goyal, N.; Ghazvininejad, M.; Mohamed, A.; Levy, O.; Stoyanov, V.; Zettlemoyer, L. Bart: Denoising sequence-to-sequence pre-training for natural language generation, translation, and comprehension. arXiv 2019, arXiv:1910.13461. [Google Scholar]
  41. Snover, M.; Dorr, B.; Schwartz, R.; Micciulla, L.; Makhoul, J. A study of translation edit rate with targeted human annotation. In Proceedings of the Association for Machine Translation in the Americas, Cambridge, MA, USA, 8–12 August 2006; Volume 200. [Google Scholar]
  42. Wolf, T.; Debut, L.; Sanh, V.; Chaumond, J.; Delangue, C.; Moi, A.; Cistac, P.; Rault, T.; Louf, R.; Funtowicz, M.; et al. HuggingFace’s Transformers: State-of-the-art natural language processing. arXiv 2019, arXiv:1910.03771. [Google Scholar]
  43. Park, C.; Yang, Y.; Park, K.; Lim, H. Decoding strategies for improving low-resource machine translation. Electronics 2020, 9, 1562. [Google Scholar] [CrossRef]
  44. Lee, C.; Yang, K.; Whang, T.; Park, C.; Matteson, A.; Lim, H. Exploring the Data Efficiency of Cross-Lingual Post-Training in Pretrained Language Models. Appl. Sci. 2021, 11, 1974. [Google Scholar] [CrossRef]
Figure 1. Comparison of the average Pearson correlation coefficients of original and reverse order inputs in sub-tasks 1 and 2.
Applsci 11 06584 g001
Table 1. Summary of the QE dataset. We denote the number of instances in each dataset as # Instance. # SRC Token and # MT Token refer to the number of tokens in source- and target-side sentences for each dataset, respectively.
Sub-Task 1Sub-Task 2
TrainDevTestTrainDevTest
# Instance700010001000700010001000
# SRC Token98,12714,10214,043114,98016,51916,371
# MT Token97,45314,00314,019112,34216,16016,154
Average Score−0.008−0.0490.0400.3180.3120.312
Median Score0.1620.2110.3190.30.2950.286
Table 2. mPLM finetuning results for the test set of the WMT20 sub-task 1.
PearsonMAERMSE
MaxMinAverageMinMaxAverageMinMaxAverage
XLM-R-base0.3800.2800.3280.4590.4790.4730.6480.6790.665
XLM-R-large0.3380.2420.2980.4800.5200.4950.6850.7130.698
mBERT0.4070.3220.3820.4520.4680.4580.6420.6720.655
mBART0.4020.3060.3510.4650.5340.4900.6420.7290.677
XLM-CLM0.2960.1680.2530.4740.5160.4890.6830.7030.691
XLM-MLM0.2190.1920.2060.4930.5260.5030.6930.7280.708
XLM-MLM-170.3180.1430.2530.4650.5250.4900.6700.7310.696
XLM-MLM-1000.2560.1910.2320.4820.5360.4980.6900.7020.695
XLM-TLM0.4420.3360.3940.4510.6830.5170.6310.8050.681
Table 3. mPLM finetuning results for the test set of the WMT20 sub-task 2.
PearsonMAERMSE
MaxMinAverageMinMaxAverageMinMaxAverage
XLM-R-base0.4560.4380.4480.1460.1560.1500.1890.2040.195
XLM-R-large0.5070.4890.4980.1410.1550.1450.1780.2040.186
mBERT0.4350.3890.4170.1490.1820.1600.1890.2300.204
mBART0.4750.4520.4630.1420.1480.1440.1790.1950.184
XLM-CLM0.3090.2750.2980.1580.1610.1590.1960.2000.198
XLM-MLM0.3580.3030.3340.1560.1600.1580.1940.1990.197
XLM-MLM-170.4330.4080.4150.1490.1570.1540.1880.1920.190
XLM-MLM-1000.4210.3810.4090.1520.1640.1580.1900.2070.198
XLM-TLM0.5220.4980.5100.1520.2220.1770.1990.2730.227
Table 4. Results of mPLM finetuning with inverted inputs for the test set of WMT20 sub-task 1.
PearsonMAERMSE
MaxMinAverageAvg DiffMinMaxAverageMinMaxAverage
XLM-R-base0.3650.2720.326−0.0020.4620.4950.4810.6530.6980.670
XLM-R-large0.3940.2600.330+0.0320.4470.5080.4790.6440.7290.681
mBERT0.4020.1060.278−0.1040.4530.5530.4980.6480.7620.700
mBART0.3880.2770.346−0.0050.4360.5430.4780.6640.6930.674
XLM-CLM0.2680.1470.197−0.0560.4830.5150.5020.6880.7140.698
XLM-MLM0.2500.1280.177−0.0290.5170.5570.5400.6940.7510.727
XLM-MLM-170.2670.1720.230−0.0230.4820.5020.4910.6820.7130.693
XLM-MLM-1000.3140.1890.260+0.0280.5030.5870.5440.6660.7480.709
XLM-TLM0.2340.1410.193−0.2010.5631.1150.8960.7391.2371.061
Table 5. Results of mPLM finetuning with inverted inputs for the test set of WMT20 sub-task 2.
PearsonMAERMSE
MaxMinAverageAvg DiffMinMaxAverageMinMaxAverage
XLM-R-base0.4640.4530.460+0.0120.1440.1530.1480.1840.1990.191
XLM-R-large0.5230.5010.509+0.0110.1400.1440.1420.1780.1880.183
mBERT0.4490.4340.441+0.0240.1470.1790.1620.1850.2290.207
mBART0.4780.4630.469+0.0060.1410.1510.1450.1790.1960.187
XLM-CLM0.2970.2830.287−0.0110.1590.1620.1600.1970.2050.199
XLM-MLM0.3640.3330.351+0.0170.1530.1590.1560.1930.2000.196
XLM-MLM-170.4200.4050.411−0.0040.1540.2180.1720.1900.2730.217
XLM-MLM-1000.4420.4050.417+0.0080.1510.1830.1610.1870.2200.196
XLM-TLM0.5520.5260.538+0.0280.1560.1680.1630.2040.2180.212
Publisher’s Note: MDPI stays neutral with regard to jurisdictional claims in published maps and institutional affiliations.

