1. Introduction
The measurement of rheological properties is one of the most important problems in food engineering. Knowledge of these quantities is necessary for the proper design, modeling and synthesis of optimal control systems. Moreover, knowledge about the rheological properties of food liquids is also important for the proper operation of the installation. Real-time monitoring of rheological properties is very important because of the ability to assess the condition of fluids in a pipeline or mixer [
1,
2]. This gives information on the structural changes that occur in the fluid during the transport or mixing process. Continuous monitoring of structural changes in food fluids is important due to the possibility of irreversible damage to the fluid by excessive shear stress. As a result the obtained product is not fully valuable or even obtaining the final product is not possible. There are several options for real-time monitoring of the rheological properties of non-Newtonian fluids through pipelines during flow. The basic method relies on simultaneous measurement of volumetric flow rate and pressure drop over a given length [
3]. There are extended variants of this method, in where exist supporting system for velocity measurement based on the Doppler effect (laser or ultrasound) [
4,
5]. Also there are available comercially solutions of this form of rheometers mounted directly on the pipeline (Schlumberger Technology Corporation) [
6].
The cheapest and simplest method of rheological measurement is pressure drop and flow rate monitoring [
7]. This method does not require the use of additional equipment on the pipeline, but only the registration of typical process values. This approach can only be used for laminar flow. For the transient and turbulent type of flow, it is possible to monitor only the pressure drop itself in the measuring section. Presented pipeline systems can work in two ways. The first relies on a typical monitoring of process quantities in an actual pipeline system and based on the response of the installation. A decision is made to change the operating parameters, which affect in the number of rotations in the impeller or pump worm or changes in the valve’s position. In this case, knowledge of the rheological characteristics of the fluid is required, which has to be learned from an experiment with a capillary or rotary rheometer. Then, obtain characteristic is implemented in the control system.
The second method based on using a straight section of the pipeline as a capillary tube rheometer and measure the pressure drop as a function of the volumetric flow rate. Based on the data obtained in this way, it is possible to determine the rheological characteristics of the fluid under laminar flow conditions. For the turbulent range of flow, such tests can be used to determine the flow resistance coefficients. For the measurement data obtained in this way, which form the classic flow curve, it is possible to fit the appropriate rheological models and evaluate the rheological parameters of the fluid.
Liquid food systems seldom exhibit Newton’s law properties, most of the food liquids are non-Newtonian liquids. These liquids show very differentiated exceptions from the mentioned law. This is because food largely consists of macromolecular systems and the presence of these molecules in the solutions cause these deviations. That’s why, the analysis of the hydrodynamic behavior of food liquids require extensive research due to the variety of rheological phenomena. Currently, non-starch hydrocolloids are important food ingredients. These systems are used in the food industry to create the structure of the product and thus specyfic sensory impressions, or for stabilization in order to minimize, for example the effects of sedimentation of solid particles, syneresis, creaming. Solutions of these biopolymers are also used as stabilisers for metastable systems such as emulsions or foams [
8]. They can also act as crystallization inhibitors. Due to their molecular structure, these systems show very different rheological properties. They exhibit a behaviour typical for viscous fluids as for thixotropic fluids and very often they show a viscoelastic character. All these properties are used in shaping the final properties of a food product. Therefore, constant control of the rheological parameters of these systems is required in industrial conditions and during product storage. The behaviour of the product during consumption is also important. One of the most commonly used food additives is xanthan gum. It is a high molecular weight extracellular polysaccharide produced by Xanthomonas bacteria. Xanthan gum is an anionic polyelectrolyte, with a backbone chain consisting of (1-4)
-D-glucan cellulose [
9,
10]. Xanthan gum water dispersions are a viscous, stable solution, even at low concentrations [
11,
12,
13]. Due to its rheological properties xanthan gum is commercialy used as a suitable stabiliser, thickener, and suspending agent in many foods [
14].
There is a lack of literature available to research on rheological properties of food ingredients, especially hydrocolloids solutions, in real flow conditions. The use of a capillary-pipe viscometer will allow to obtain rheological characteristics of tested fluids under real flow conditions. Conducting tests on a large-volume sample will be a different attempt to that used in classical rheological measurements. This approach will complement knowledge in this field.
The aim of this study was an attempt to use a capillary-pipe viscometer to measure pressure drop during flow and in combination with data of volumetric flow rate, to determine flow curves. Aqueous solutions of xanthan gum were used as the research material and glycerol was used as a Newtonian standard liquid.
2. Materials and Methods
2.1. Material
The research materials were xanthan gum water solutions with four concentrations: 0.25%, 0.50%, 0.75%, 1.00%. The following molecular characteristic of the xanthan gum was obtained: weight average molecular mass g·mol, number average molecular mass g·mol, and dispersity .
2.2. Classical Rheological Measurements
Initial studies of rheological properties included the determination of classical flow curves, as well as studies of changes in rheological properties over time under the conditions of a fixed shear rate.These measurements were carried out according to the scheme described in the work of Kembłowski and Petera [
15].
This experiment relies on measuring the shear stresses (as a consequence of viscosity) of the test fluid subjected to shear under the conditions of a predetermined shear rate, over a specified period of time. The following shear rates were used in the experiment (, s): 5, 11, 17, 23, 29, 35, 41, 47, 53, 59, 65.
In the first stage of measurements, changes in shear stresses were examined during the increase of the shear rate from (, s) 5 to 65 and in the second stage it was reduced from 59 s to initial value 5 s. The time intervals in which the sample was sheared under the conditions of the steady shear rate were 300 s, 600 s and 1200 s. The purpose of these studies was to identify systems in which the phenomenon of thixotropy occurs during the flow. In addition, it was found that such a course of rheological experiments is so universal that it will be possible to compare these results with the results of tests performed with a capillary-pipe viscometer. All measurements were carried out at 21 °C with the help of rotational rheometer RS6000 ThermoFischer (Germany) equipped with cylinder-cup system ( mm).
The choice of the above shear rate values was dictated by the possibility of carrying out tests on a capillary-pipe viscometer. The values corresponded to the shear rate values possible during the flow of fluids through the capillaries.
2.3. Study of Pressure Drop during Flow of Selected Food Liquids and Determination of Classical Flow Curves Based on Obtained Data
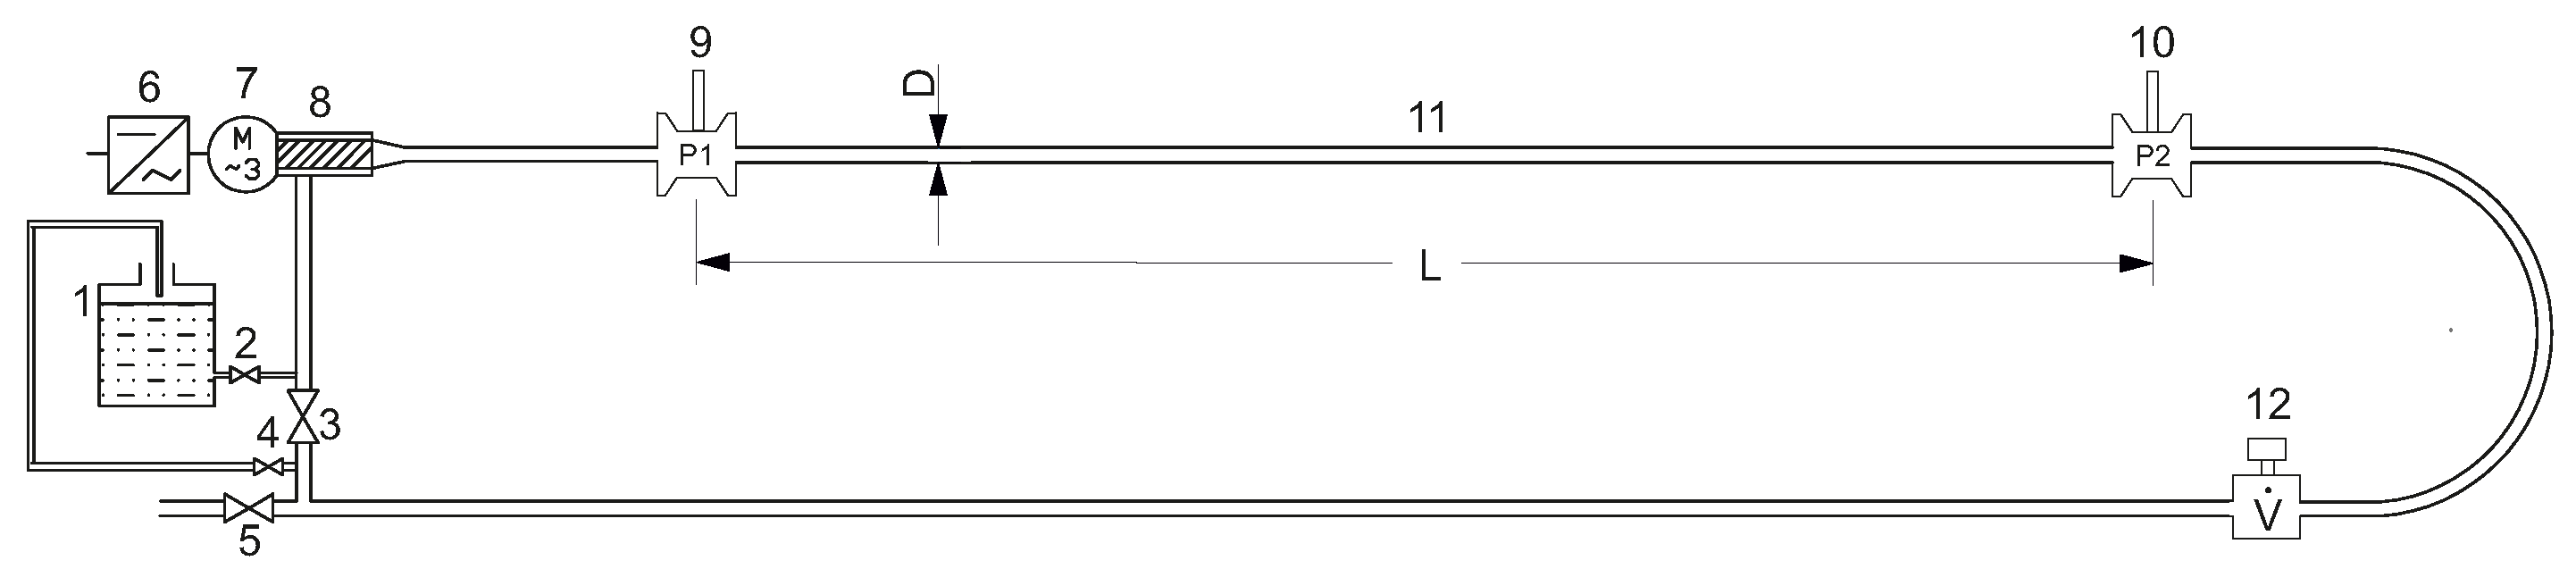
The experiments were performed on the experimental capillary-pipe viscometer, the diagram of which is shown in
Figure 1. The length of the experimental test section
L was 4120 mm and the inner diameter of the tube (capillary) was
D 26 mm. In the experimental system, the fluid was pumped through a horizontal pipe with a hydraulically smooth inner surface (providing no flow disturbance) made of acid-proof stainless steel.
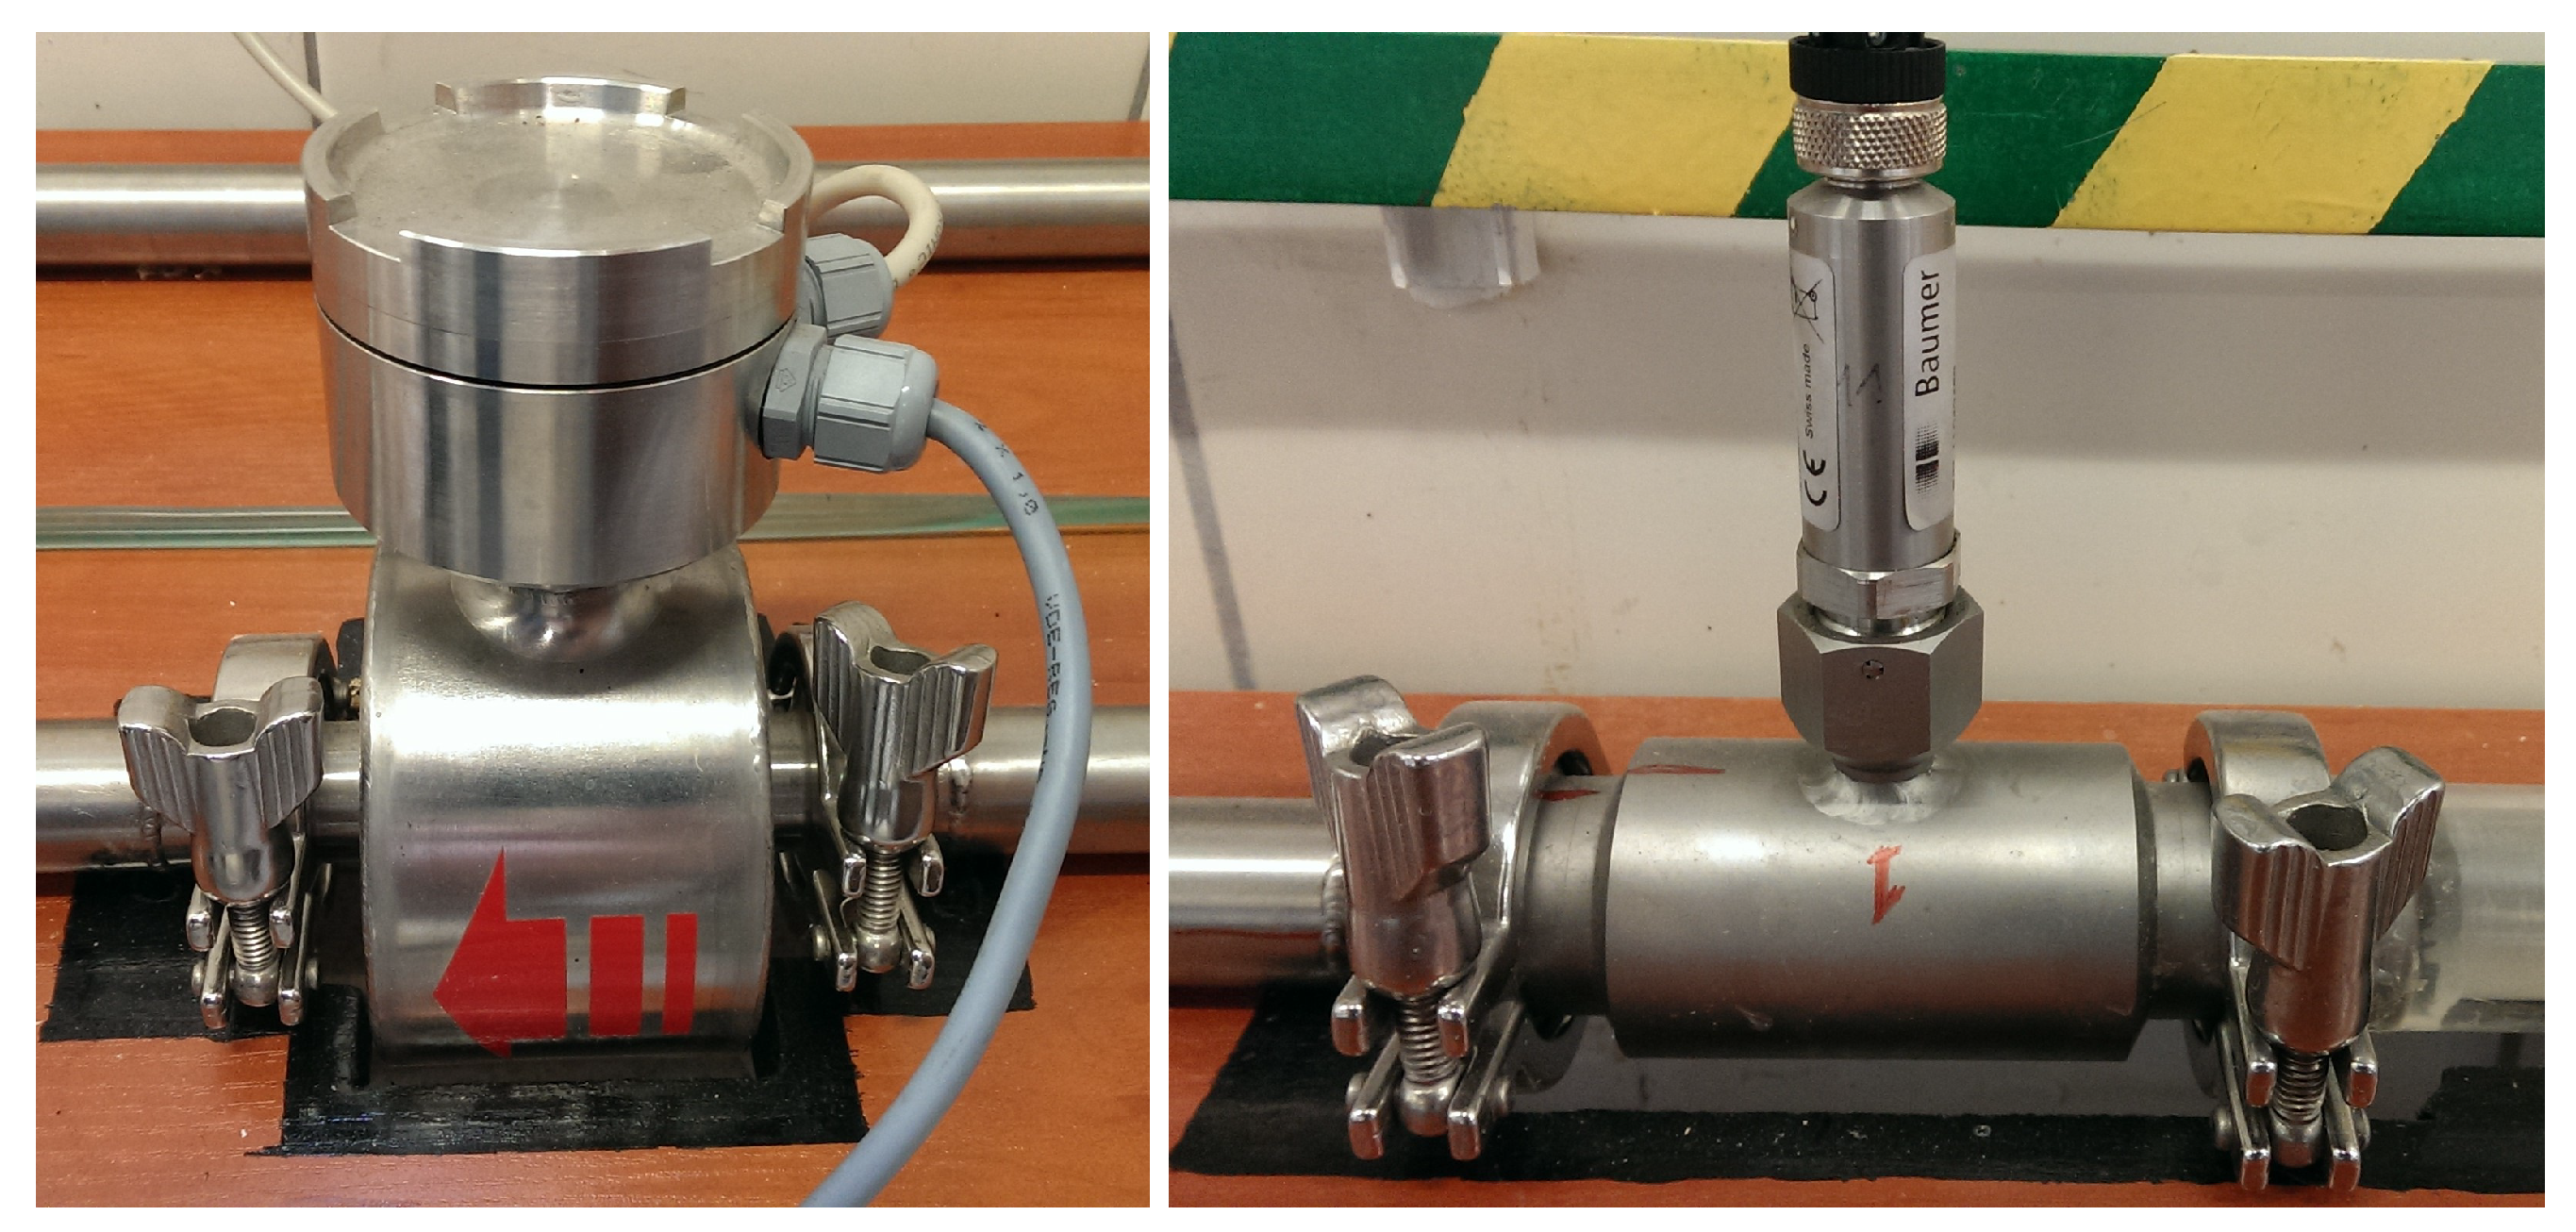
On the measuring section, the following parts were successively installed: two pressure sensors (
Figure 2) and an electromagnetic flowmeter. All connections were secured using Tri-Clamp system, which allow for easy assembly and possible modifications. Additionally, a temperature stabilisation system for the tested liquid was mounted on the entire installation (elimination of temperature increase caused by energy dissipation during flow), hence the measurements were performed under isothermal conditions. A screw pump (Novarotors, Italy) connected with a three-phase electric motor ( Hydro-mec, Italy) and a toothed gear was used for pumping the liquid. The change of the volumetric flow rate in the described closed cycle was carried out by changing the number of revolutions of the pump rotor through a frequency inverter (Lenze, Germany), which allowed for soft start and smooth changing rotational speed. The set operating range of the inverter was from 0 to 100 Hz. This, connected with the tooth gear allowed the setting of a wide range of fluid flow rates and different direction of pump rotation.
The volumetric flow rate was measured by the direct method, using an electromagnetic flow meter FMG-300 TC, (Techmag, Poland). Static pressure values at the beginning and at the end of the measuring section were made using piezoelectric pressure transducers (PBMN, Baumer Germany type). Transducer had analog voltage output (0–10 V). Output values were aquired and converted by a 12-bit analog/digital converter at a rate of 1 Msps (PCI NI-646445 card, National Instruments, England). The sensors were used to measure pressure losses in both chemically inert and aggressive liquids, hence the measuring heads were small and enclosed in an acid-resistant steel housing. All used measuring elements that had been calibrated by the manufacturer before their assembly on the measuring section. All measurements were carried out at 21 °C.
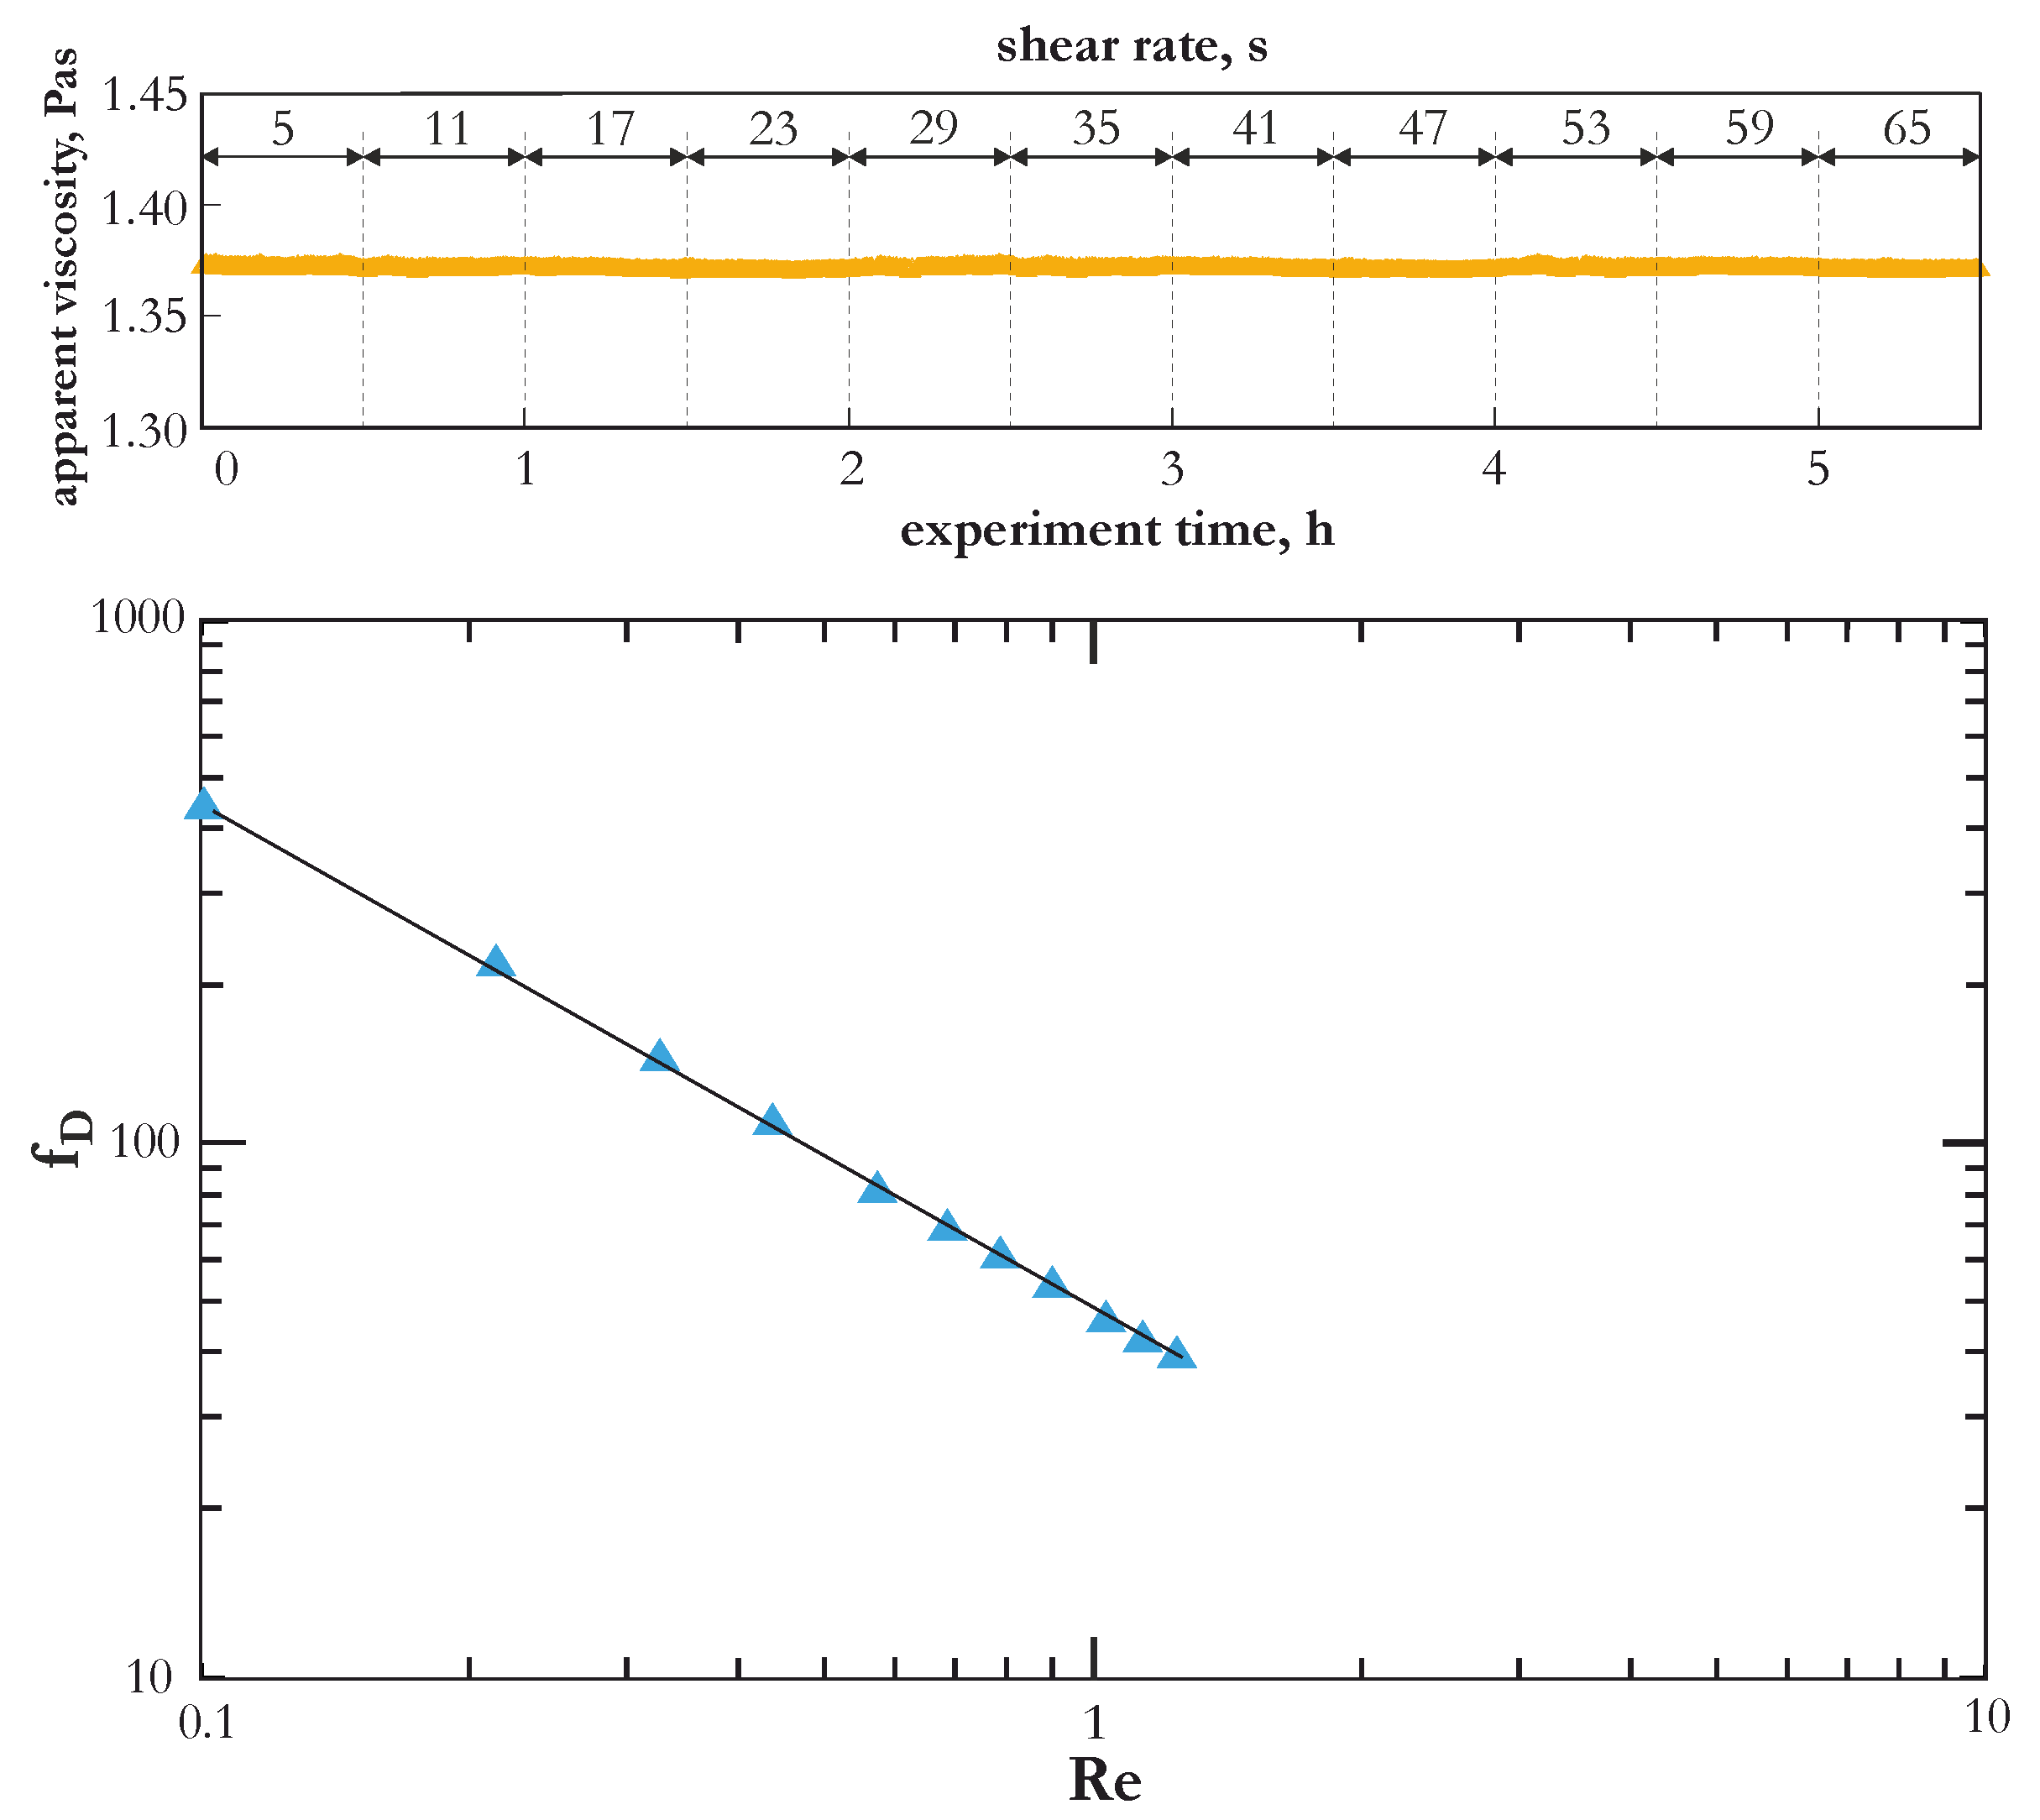
The first measurements in the changes of static pressure drop during flow as, a function of flow rate, were made for glycerol (99.5%). It acts like a Newtonian fluid and the viscosity value against temperature is well known (
Figure 3). This experiment allowed to validate measurement setup and provided useful information about temperature stabilisation during this type of measurements. A temperature 20 °C was kept with ±0.15 °C deviation over the time of experiment.
The measurement of pressure drop
across the measuring section of length
L allows to determine the value of the tangential stress
on the wall of the pipe:
In this equation,
D denotes the diameter of the pipe where flow took place. The above linear dependence of the tangential stress on the distance from the bore axis results from the general balance of forces for the laminar flow through the bore. It is correct for both Newtonian and non-Newtonian fluids. Additionaly the knowledge of the volumetric flow rate is necessary to determine the shear rate
at the capillary wall:
Knowledge of these fluid flow parameters in a capillary-pipe viscometer allows the determination of flow curves-the dependence of the tangential stress on the shear rate. It is worth noting that both the shear rate and the stress change with the distance from the bore axis. For this reason, it is necessary that both the shear rate and the tangential stresses are determined under the same conditions-in the discussed case, at the bore wall. The knowledge of the shear rate and stress values allows determination of apparent viscosity, according to the equation:
The acomplishment of a research program allowing the determination of flow curves requires appropriate planning of the experiment. It is necessary to be able to monitor the pressure drop over/across the measuring section L as a function of the volumetric flow rate . In the described experiment, the flow rates were selected so that the shear rates determined on its basis were in the range from 5 s to 65 s.
The experiment was carried out in analogy to the classical equilibrium experiment described in the work of Kembłowski and Petera [
15]. The following scheme of operation was adopted:
Stage I, conditions for increasing volumetric flow rate:
assignment , which corresponds to a shear rate of 5 s,
measurement in a 10-min time range,
Increase the volumetric flow rate to the next value (corresponds to next selected shear rate value),
measurement in a 10-min time range,
…
measurement in a 10-min time range, for volumetric flow rate corresponding with 65 s shear rate.
Stage II, conditions for decreasing volumetric flow rate:
reduction of volumetric flow rate to , which corresponds to a shear rate 59 s value,
determining the next value of ,
measurement in a 10-min time range for = 53 s,
…
measurement in a 10-min time range for = 5 s.
Calculated values
and
alowed the drawing of the flow curve and create a data set for the estimation of the rheological parameters of the equations of state. The Herschel-Bulkley equation (HBE) was fitted to the obtained flow curves [
16]:
and estimated values
,
k and
n. The calculations were made using the Marquardt-Levenberg minimization algorithm:
Based on the rheological parameters, the HBE-generalized Reynolds number was determined:
In this equation
while
v is the mean linear velocity of the flow
. Based on the measurement results, the Darcy friction coefficient (
) can also be calculated [
17]:
The energy dissipated was calculated according to:
where
represents the area under the upstream data points and
the area under the downstream data points calculated according to trapesoidal numerical method,
time of hysteresis experiment (9000 s) and
V is the volume of sample:
cm
for capillary rheometer and 75 cm
for rotational rheometer. According to [
13] percentage of relative hysteresis area (
) was calculated as follows:
3. Results and Discussion
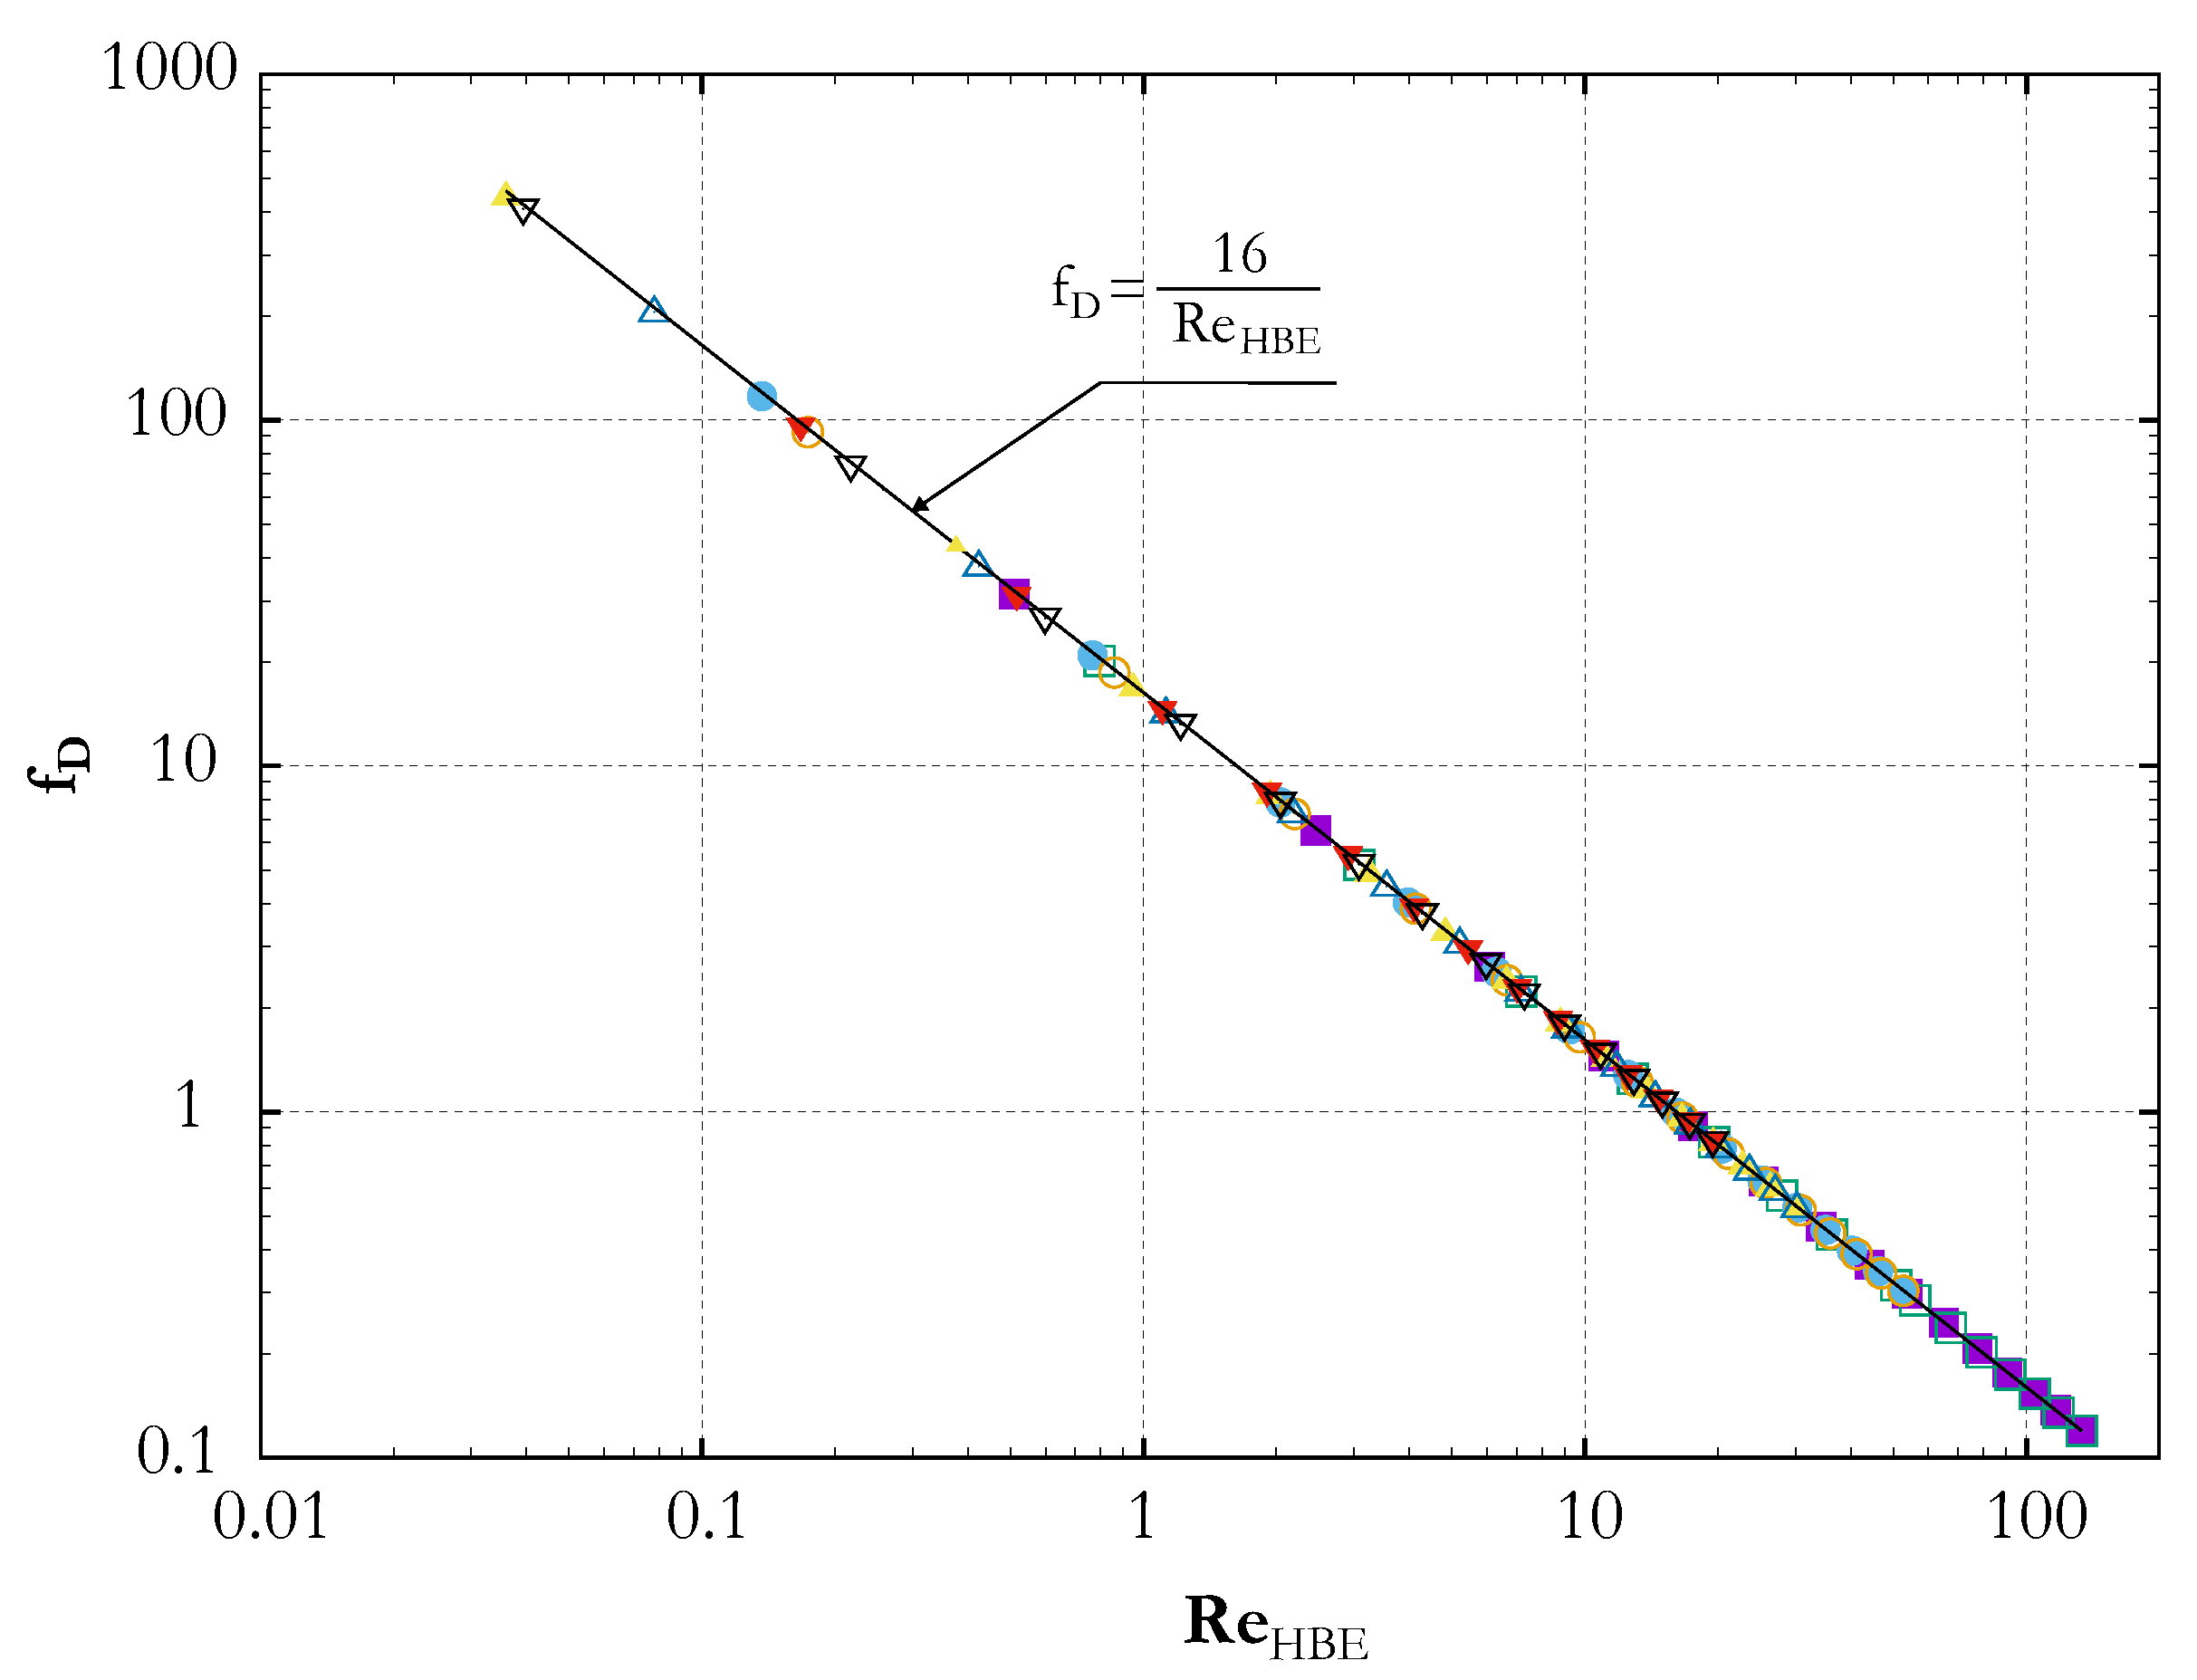
Firstly, the measurement system was validated with survey
as a function of flow rate for a high viscosity Newtonian liquid: glycerol [
18]. The results are presented as dependence of viscosity Equation (3) on the experiment time and shear rate Equation (2) and on the Blasius plot (
Figure 3). The range of shear rate planned in the experiment provided the maintenance of laminar flow conditions and the viscosity determined from the results of measurements for glycerol, was not dependent on flow conditions. Linearly decreasing dependence of the flow resistance coefficient is characteristic for a laminar flow area.
Results comparision of rheological measurements carried out with the use of a capillary tube rheometer with data from a rotational rheometer requires laminar flow conditions in the capillary. The diagram (
Figure 4) shows the Darcy friction coefficient relationship Equation (7) from Reynolds number Equation (6).To analyze the obtained capillary tube rheometer data a recalculation was made. The measurement results of the static pressure drop as a function of the flow rate were transform to values of the tangential stress
Equation (1), shear rate
Equation (2) and apparent viscosity
Equation (3). The first step of the analysis to determine the correctness of the of the received measurement data was to make a Blasius plot (
Figure 4). This graph allowed for checking of the postulate about the laminarity of the flow. For this, in the coordinate system
on the double logarithmic scale shows all obtained measurement points. As can be seen from
Figure 5 points are arranged along a straight line, which proves that the analyzed ranges of shear rate (flow rate) were in the area of laminar flow. For all tested xanthan gum solutions within the analyzed Reynolds numbers
, the obtained data met the assumptions of the correct rheological measurement. Laminarity Flow Assumption confirmation enabled further analysis and modeling of rheological parameters of the tested fluids. It should also be noted that the knowledge of the Blasius diagram allows to determine the value of the flow resistance coefficient
in the laminar flow range for the analyzed fluids. This knowledge is very helpful when designing pipeline installations and the selection of process pumps for non-Newtonian fluids. Additionaly the presented diagram (
Figure 4) has a general nature due to the use of dimensional analysis, what allows to be used for all non-Newtonian fluids in the analyzed Reynolds number range. The results presented above are in full accordance with the theory of laminar flow and with data obtained for non-Newtonian fluids [
19].
For laminar and a fully developed pipe flow the Darcy friction coefficient is given with the relation: . In the double logarithmic coordinate system, the change in drag coefficient from Reynolds number in the laminar range is given by a linear relationship.
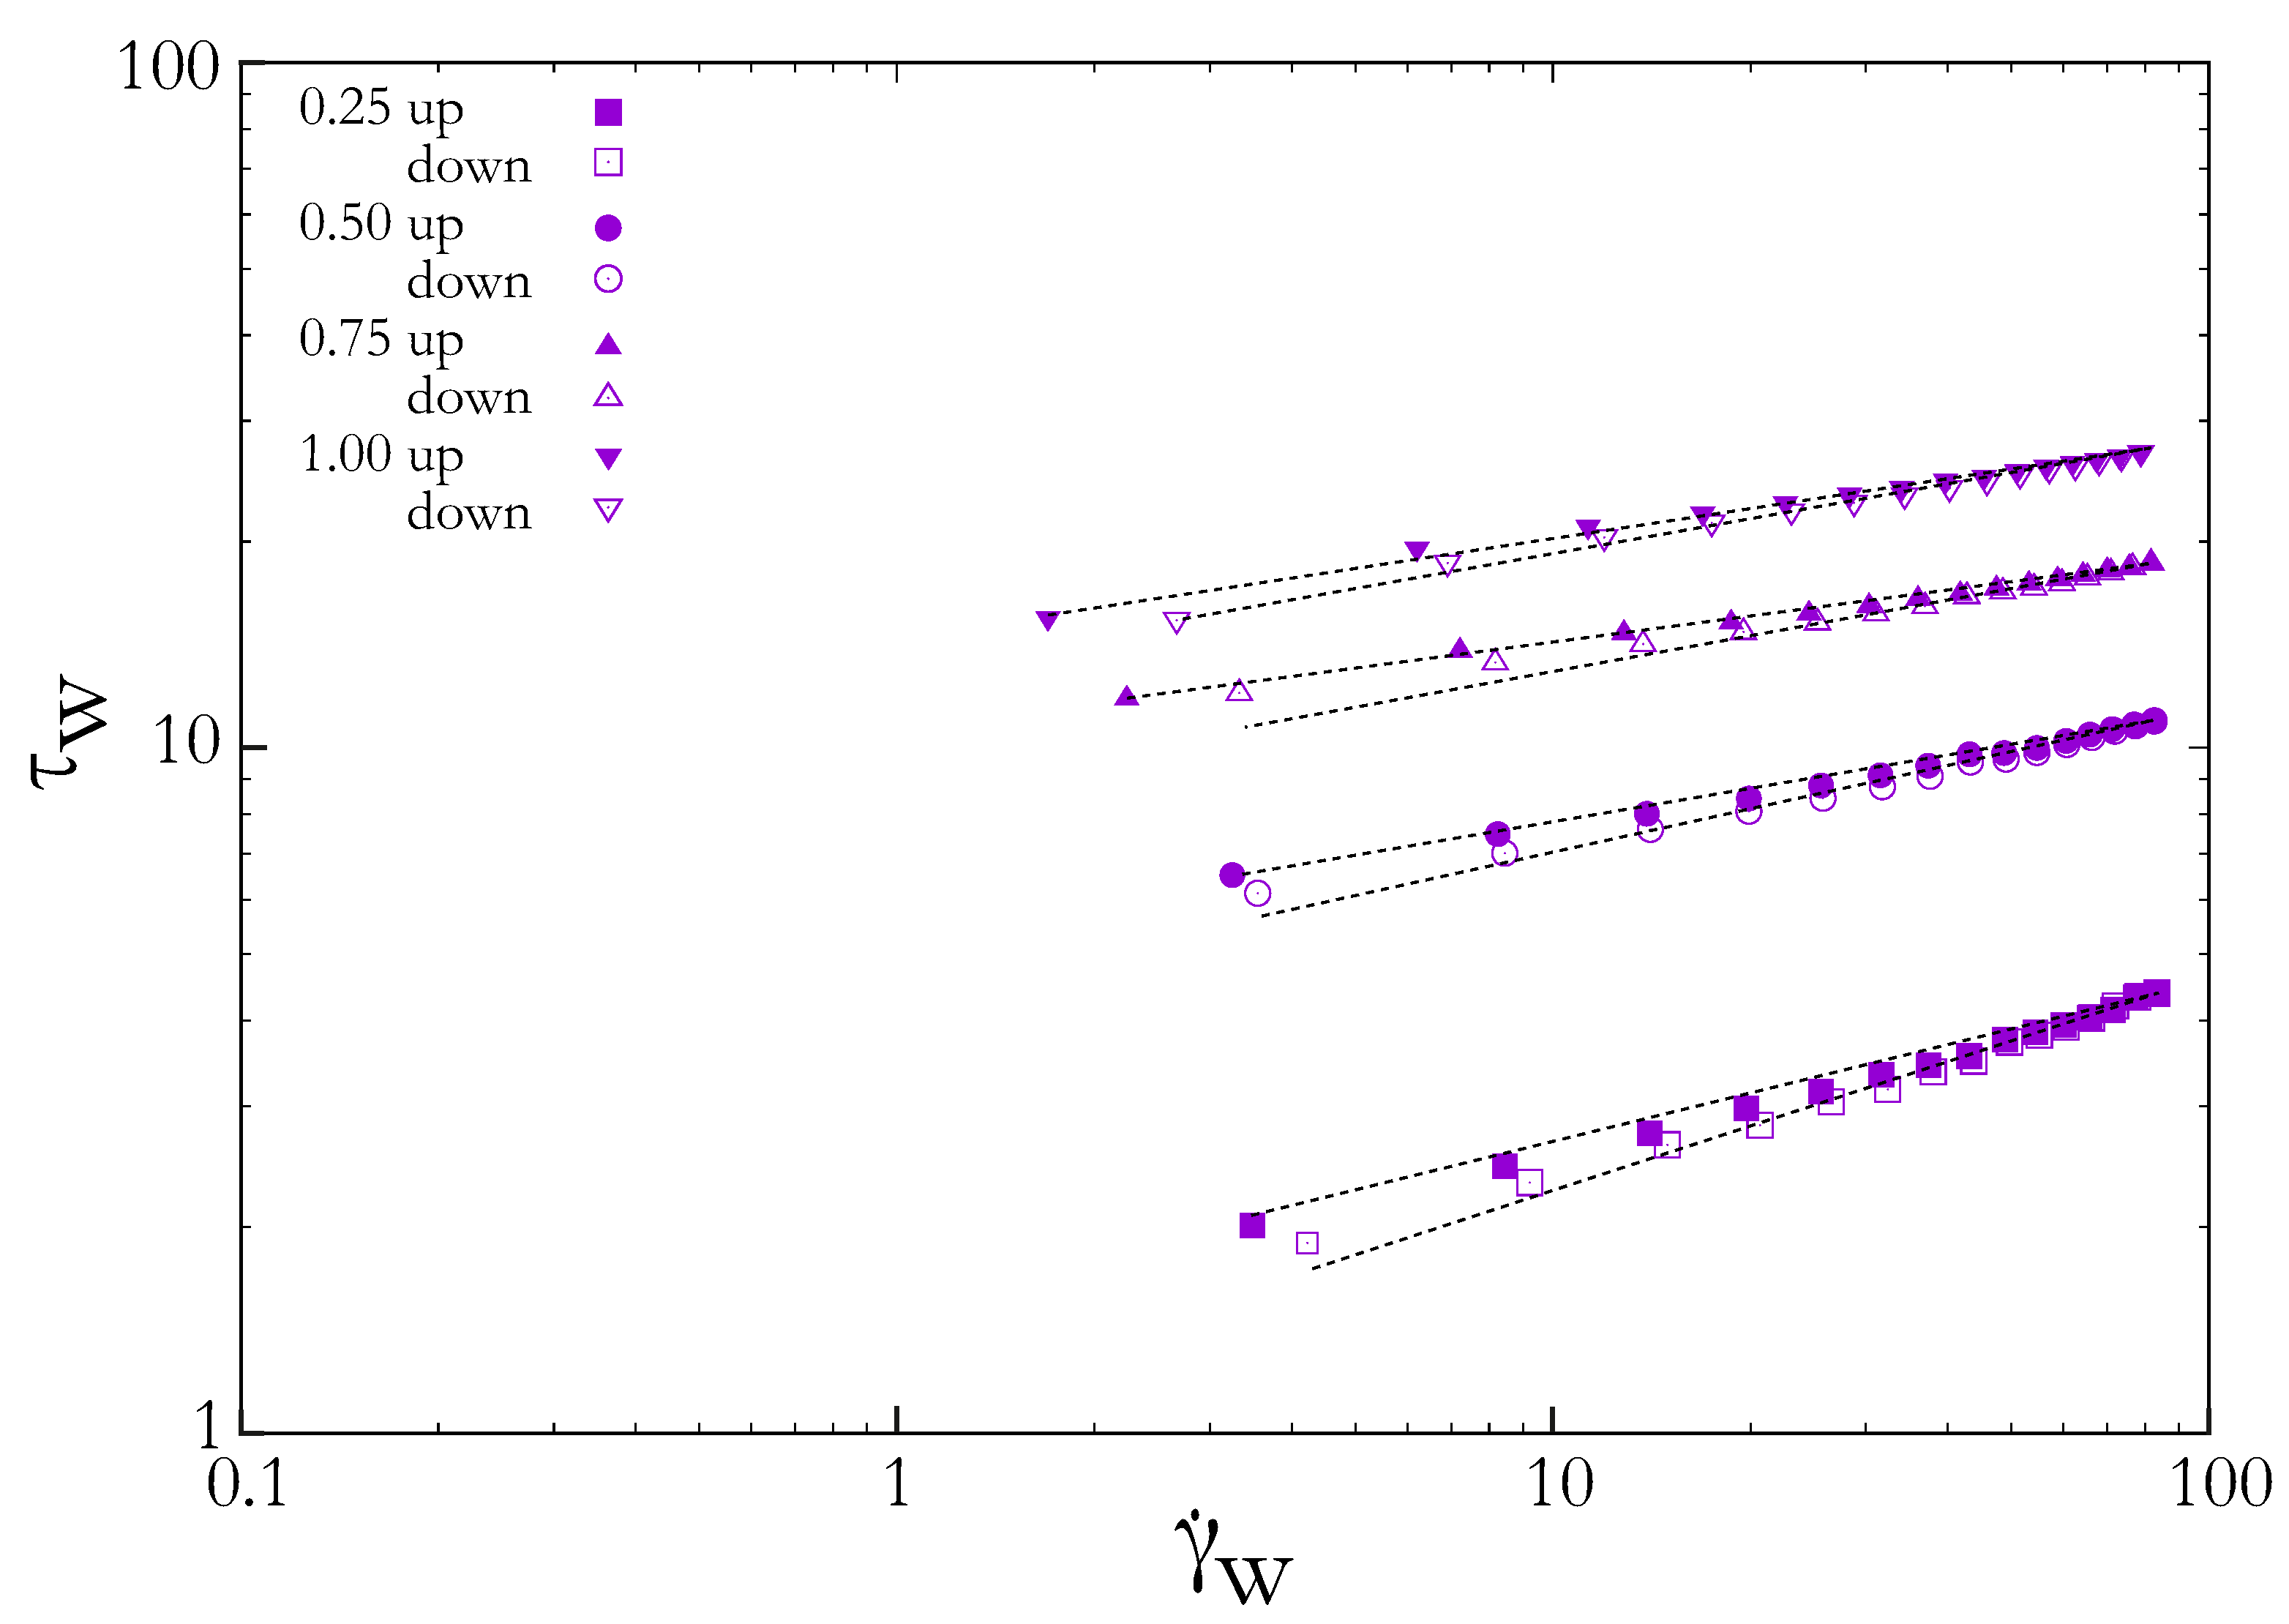
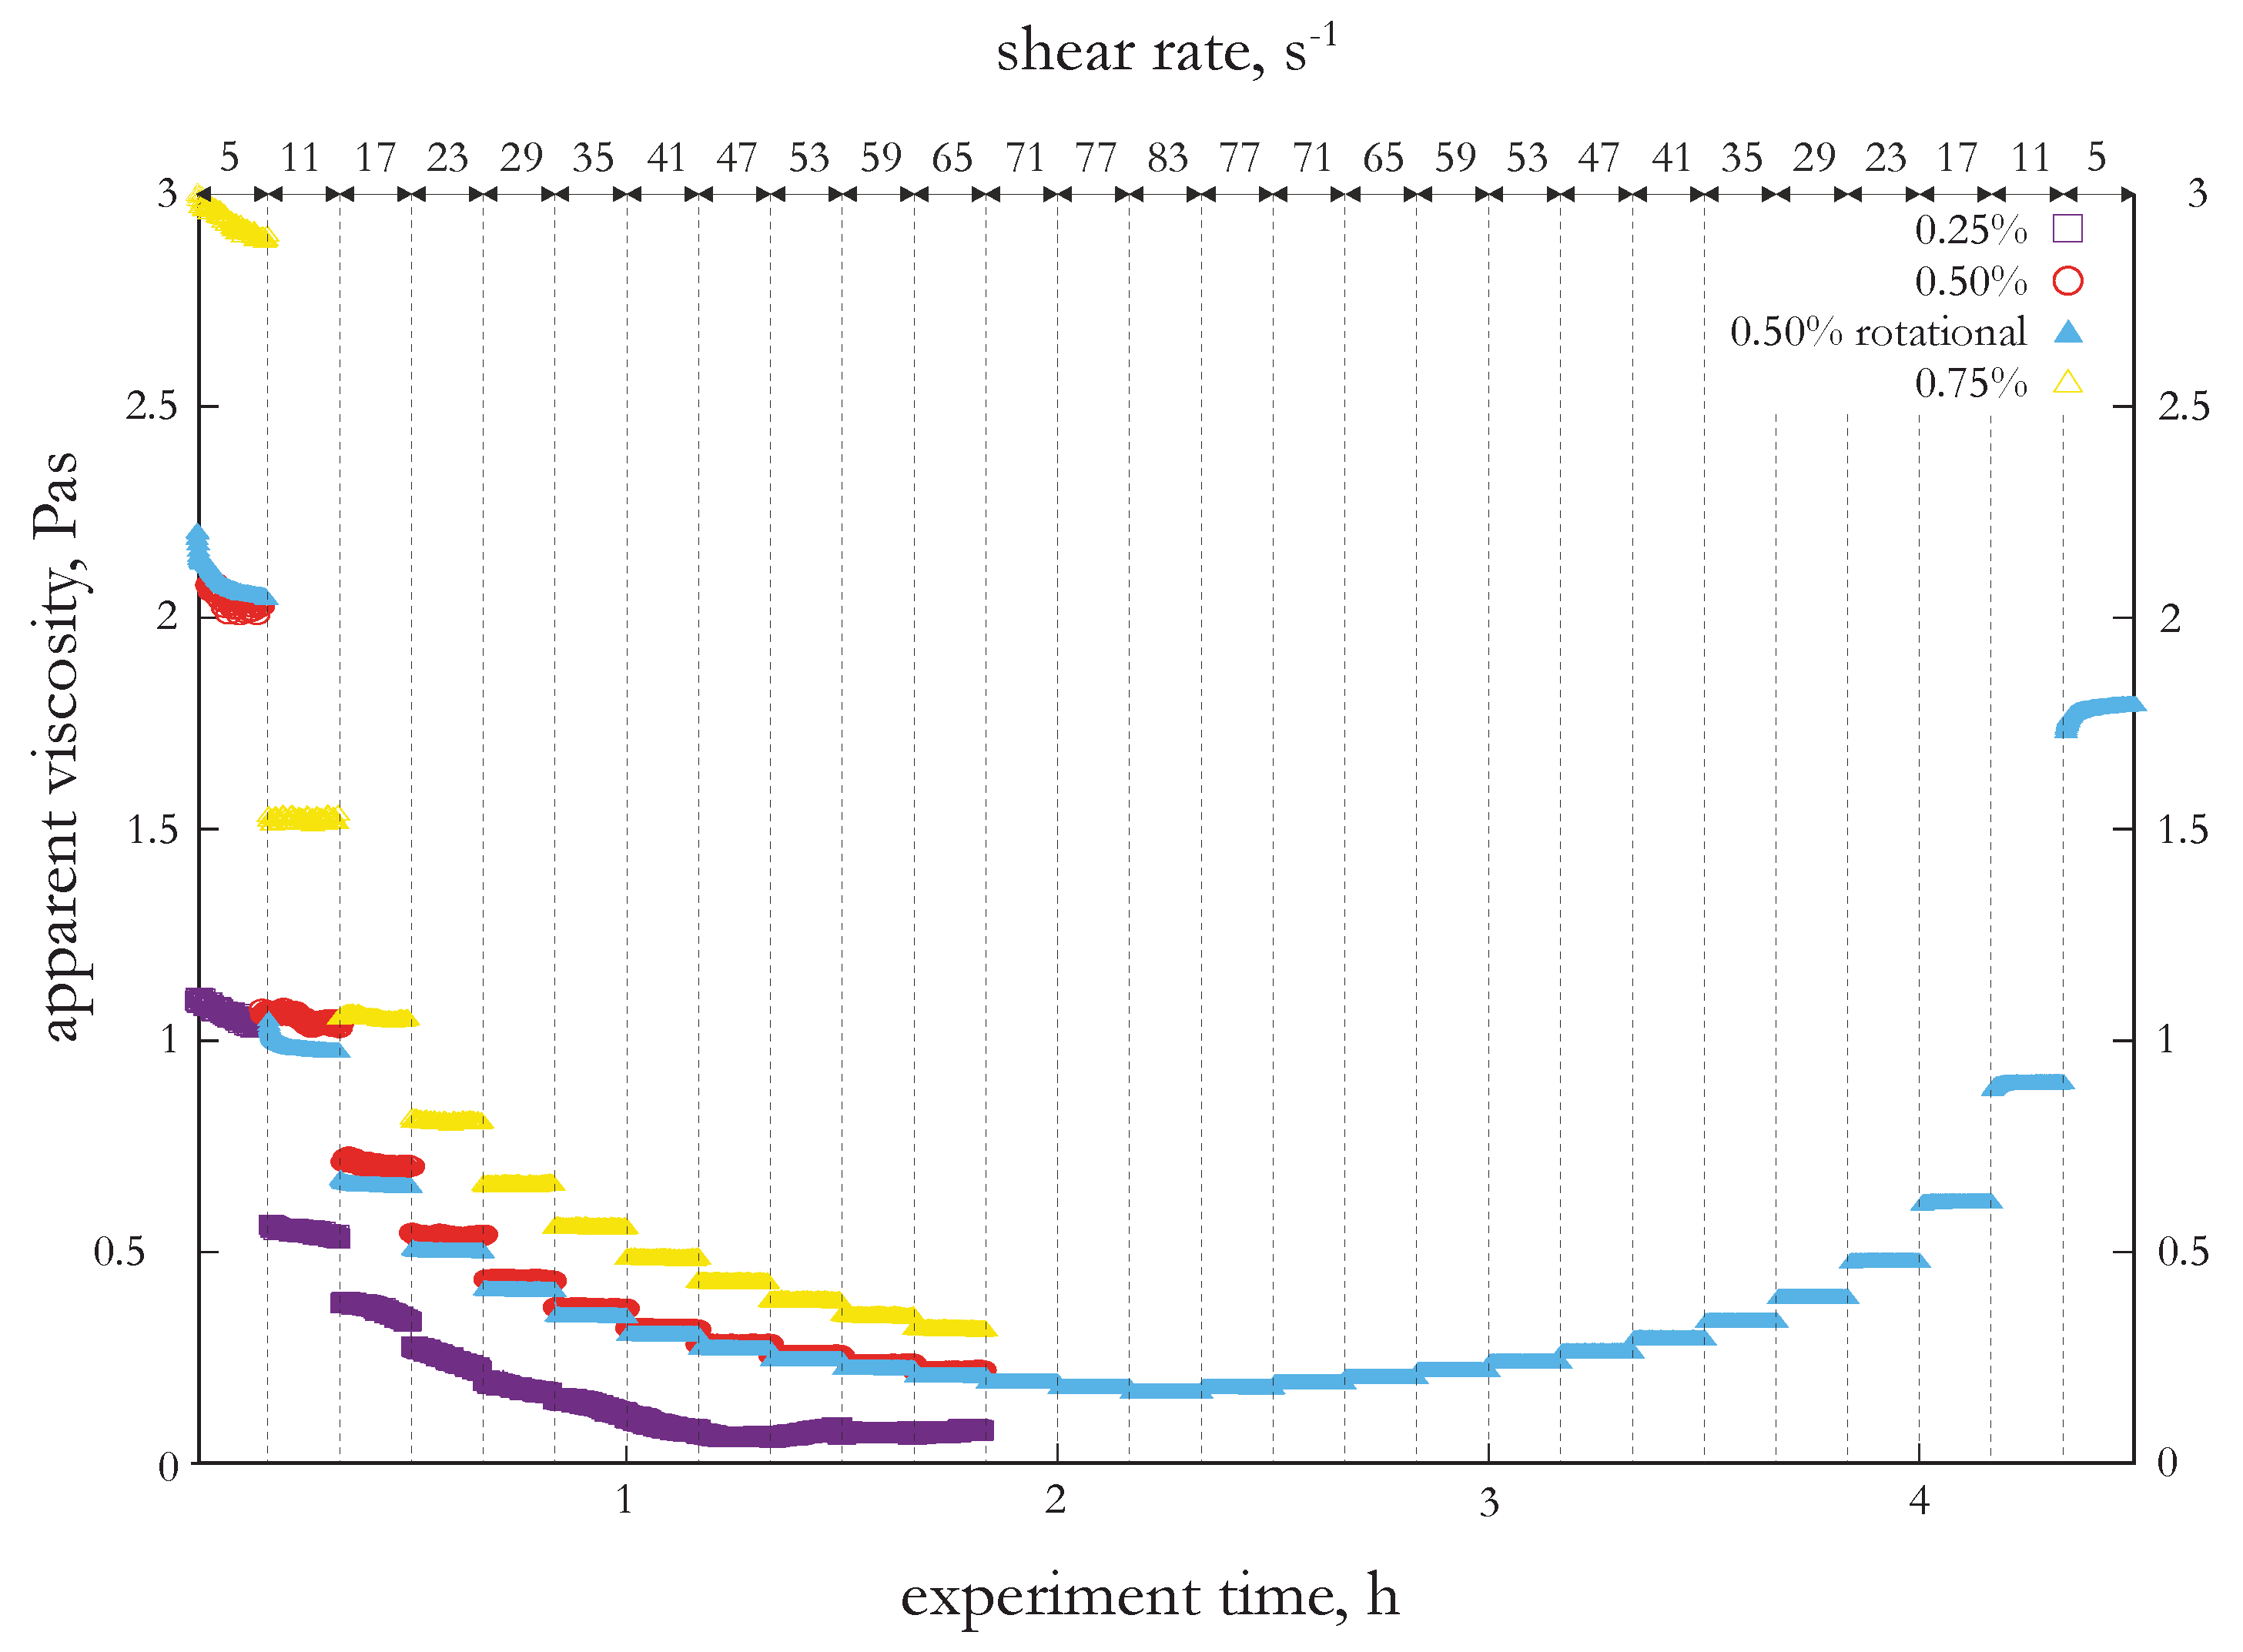
From the rheological point of view, aqueous solutions of xanthan gum are classified as rheounstable shear thinning systems. Their apparent viscosity changes with time and the results of the qualitative hysteresis loop test show energy dissipation during flow. This phenomenon is especially visible during the Kembłowski and Petera experiment. The results of such an experiment carried out on a 0.5% solution using a rotational rheometer are presented in
Figure 5.
As expected, the apparent viscosity measured under constant shear rate conditions decreases with time, and the increase in the shear rate implies a behavior characteristic of shear thinning fluids. The range of apparent viscosity values is consistent with the literature data [
10,
11,
14]. The curves showing the increase in apparent viscosity, corresponding to the second part of the experiment, indicate irreversible changes in the structure of the shear fluid [
11]. Apparent viscosity values—increase with time, but do not reach the values characteristic for the first shear stage, the greatest differences between
are visible in the range of the lowest shear rates [
10]. For comparison, the same graph shows the results obtained using the method of measuring the static pressure drop while flowing through the capillary of solutions with a concentration of 0.25%, 0.5% and 0.75%. Changes in apparent viscosity reflect the rheological character of the system under study. The effect of xanthan gum concentration on the frictional properties of solutions is clearly visible [
10,
14]. A comparison of
changes for a 0.5% solution tested with both methods shows the convergence of the results. The differences in the values of apparent viscosity are visible in the range of the lowest shear rate values. From the analysis of the graph (
Figure 5) it can be seen that the steady state is reached faster for higher shear rates (lower values of apparent viscosity). This phenomenon is due to the fact that the increase in shear forces is associated with the supply of greater amounts of mechanical energy to the system that causes faster disintegration of the fluid structure.
Figure 5 also shows the exemplary time series obtained with the same solution (0.50% xanthan gum) in a rotational rheometer. Initially, it is posible to observe discrepancies between the individual shear rates, but the increase in the value of
causes the differences to disappear. This phenomenon can be explained by the differences in the dissipation of mechanical energy by the tested systems. In the case of a capillary-pipe viscometer, the volume of the tested sample is over
cm
, and in the case of a rotational rheometer, 75 cm
. Such a significant difference in the volume of the tested samples translates into different thermal inertia and different capacities of mechanical energy accumulation in the fluid structure. After the fluid structure is destroyed (high shear rate values), the measured values become practically equal.
A further analysis included a reduction of the obtained data to the
, relationship, so the classical flow curves and the classical hysteresis loop test. These results are presented in
Figure 6.
In all cases, the results of measurements of the static pressure drop as a function of volumetric flow rate are presented after conversion to the values of the tangential stress
Equation (1) and shear rate
Equation (2). The model was fitted to the data thus obtained power Equation (4). The obtained rheological parameters are listed in
Table 1, where additionally results obtained for the same preparations (solutions) of xanthan gum but with rotational rheometer, are presented. Analysis of the values of the H-B model parameters for the obtained for the capillary-pipe viscometer shows that as the concentration of xanthan gum in the test solution increased the value of the consistency coefficient (
K) increases, which is as predicted, while the value of the rheological exponent (
n) decreases. Parameter analysis for the
and
curves exhibit a decrease in the value of the
K parameter for the
curve in relation to the
curve. This phenomenon can be explained by irreversible changes in structure caused by shear flow. The exponent the rheological
n exhibit a similar tendency. The phenomenon of destroying the structure of xanthan gum solutions are best visible in the region of the lowest shear rates. In this flow area parameter, it takes a long time to establish a balance between the reconstruction and destruction of the fluid structure and therefore such large changes in apparent viscosity as a function of shear rate can be observed [
12,
13]. Results obtained from measurements on the rotational rheometer are in agreement with the results of the capillary-pipe viscometer. This is evidenced by the convergent values of the
K and
n coefficients obtained for the data from both experiments and the effect of xanthan gum concentration on the values of these parameters. Examined solutions did not exhibit yeld stress.
Rheological properties determined with the use of the capillary-pipe viscometer are in full concordance with the data obtained by other authors. Flow index values estimated for 1% xanthan gum solution (
Table 1) are consistent with the data obtained in work [
13], as well as the values of the
parameter. Investigated by authors of works [
12,
14] concentration effect xanthan gum on the consistency and flow index values has been demonstrated and confirmed by the results obtained from the capillary-pipe viscometer.


