Article

Test-Retest Reliability of a 6DoF Marker Set for Gait Analysis in Cerebral Palsy Children

1
CIPER, Faculdade de Motricidade Humana, Universidade de Lisboa, Estrada da Costa, Cruz-Quebrada-Dafundo, 1499-002 Oeiras, Portugal
2
Escola Superior de Tecnologia da Saúde de Lisboa (ESTeSL), Instituto Politécnico de Lisboa, Av. D. João II, 1990-096 Lisboa, Portugal
*
Author to whom correspondence should be addressed.
Appl. Sci. 2021, 11(14), 6515; https://doi.org/10.3390/app11146515
Submission received: 17 June 2021 / Revised: 10 July 2021 / Accepted: 13 July 2021 / Published: 15 July 2021
(This article belongs to the Special Issue Biomechanical Spectrum of Human Sport Performance Ⅱ)

Abstract

:
Background: Cerebral palsy (CP) is a complex pathology that describes a group of motor disorders with different presentations and functional levels. Three-dimensional gait analysis is widely used in the assessment of CP children to assist in clinical decision making. Thus, it is crucial to assess the repeatability of gait measurements to evaluate the progress of the rehabilitation process. The purpose of the study is to evaluate test-retest reliability of a six-degree-of-freedom (6DoF) marker set in key points of gait kinematics, kinetics, and time-distance parameters in children with CP. Methods: trials were performed on two different days within a period of 7.5 ± 1.4 day. Motion capture data was collected with 14 infrared, high-speed cameras at a frequency rate of 100 Hz, synchronized in time and space with two force plates. Intraclass correlation coefficients considering the two-way mixed model, and absolute agreement (ICC[A,k]) were calculated for anthropometric, time–distance, kinematic and kinetic parameters of both lower limbs. Results: the majority of gait parameters demonstrated a good ICC, and the lowest values were in the kinematic variables. Conclusions: this study indicates wide-ranging reliability values for lower limb joint angles and joint moments of force during gait, especially for frontal and transverse planes. Although the use of a 6DoF-CAST in CP children was shown to be a feasible method, the gait variation that can be observed between sessions in CP children seems to be related not only to the extrinsic factors but also to their different gait patterns and affected sides.

1. Introduction

Cerebral palsy (CP) is the most common cause of motor disability in children [1,2,3]. The average incidence of cerebral palsy is estimated to range between 1.5 to 3.3 per 1000 live births in European countries [4], whereas this number is around 1 per 500 live births worldwide [2,3,5]. CP is a complex pathology that describes a group of impairments and motor disorders [6] with different presentations and functional levels [7]. The gait deviations that occur in CP children are mainly originated by an inadequate muscle action [8]. Three-dimensional gait analysis is the widely accepted technique used in the assessment of ambulant patients with CP to assist in clinical decision making and assessing outcomes in the rehabilitation process [9], supporting a complete biomechanical analysis of the time-distance, kinematic and kinetic parameters of gait [10].
The purpose of each clinical gait measurement technology is to provide data free from measurement errors that may create uncertainty about the possible clinical interpretations. Thus, reliability addresses to which extent gait measurements are consistent or free from variation across time [11]. However, most of these clinical variables are not reliable [12], either due to their own intrinsic variations, namely in the intra-individual oscillations that occur in trial-to-trial sessions, or due to extrinsic variations, such as, marker placement [13]. CP children are intensively studied in gait analysis, but unlike other populations with gait abnormalities [14] there are no specific biomechanical models to their gait characteristics. It is known that there are significant differences among the techniques, but the gait laboratories still opt to use their typical protocols, regardless of the population.
It is essential to understand the possible errors associated with the different techniques of marker sets and underlying anatomical models [15] to reproduce the clinical gait measurements with confidence [16]. Significant differences exist in biomechanical models used in different laboratories. These include measured variables, degrees of freedom assigned to the joints, anatomical reference frames, and joint rotation conventions [17]. The conventional gait model (CGM) is a very widely used biomechanical model to calculate kinematic and kinetic variables in gait analysis [16]. It has been extensively validated but there are still some issues regarding its reliability, mainly due to its unconstrained segment dimensions which makes it more exposed to sources of errors [18]. The six-degree-of-freedom (6DoF) models are the most common alternative to the CGM that, despite needing more extensive validation [18], assumes that the segments are rigid and do not constrain the joints motions [19]. Several 6DoF modeling techniques were used in the assessment of repeatability in participants with motor and physical characteristics limiting the normal gait [14,20,21].
These 6DoF models address the known limitations of the CGM, but unlike the latter it still needs to be better researched. However, some results have indicated some of those claims (e.g., the segments have a fixed length and soft tissue artifact is reduced). Soft tissue artifact between markers is certainly eliminated by using rigid clusters, but a different form of soft tissue artifact will affect the orientation and position of the whole cluster in relation to the bones [22]. In children in particular, the amount of soft tissue surrounding the limb segments is not the major reason for some oscillations, but the smaller distance between clusters and anatomical markers which do not minimize the magnitude of this type of error. According to a systematic review of McGinley et al. [11] about the repeatability studies of kinematic models, the majority of the included studies used the CGM or some variant of it. In previous test-retest reliability studies performed in CP children, the biomechanical models were based in CGM [23] and similar models such as the Helen-Hayes [24] and the Vicon Clinical Manager [25]. One study that used a 6DoF variant (the Cleveland clinic marker set) [26] did not compare kinetic data and the authors assessed repeatability using a coefficient of multiple correlation (CMC) which has recently been determined not to be suitable as a tool for assessing reliability in gait measurements [27].
The lack of evidence regarding the reliability of 6DoF models in subjects with abnormal gait patterns, particularly in kinetic variables, was the motivation to develop this research. Moreover, knowing that errors associated with kinematic variables have tremendous consequences in the estimation of the kinetic parameters, it is essential to assess the magnitude of these errors. Considering these issues, the aim of this study is to evaluate the test-retest reliability of a 6DoF model in key kinematic and kinetic gait cycle parameters in CP children.

2. Materials and Methods
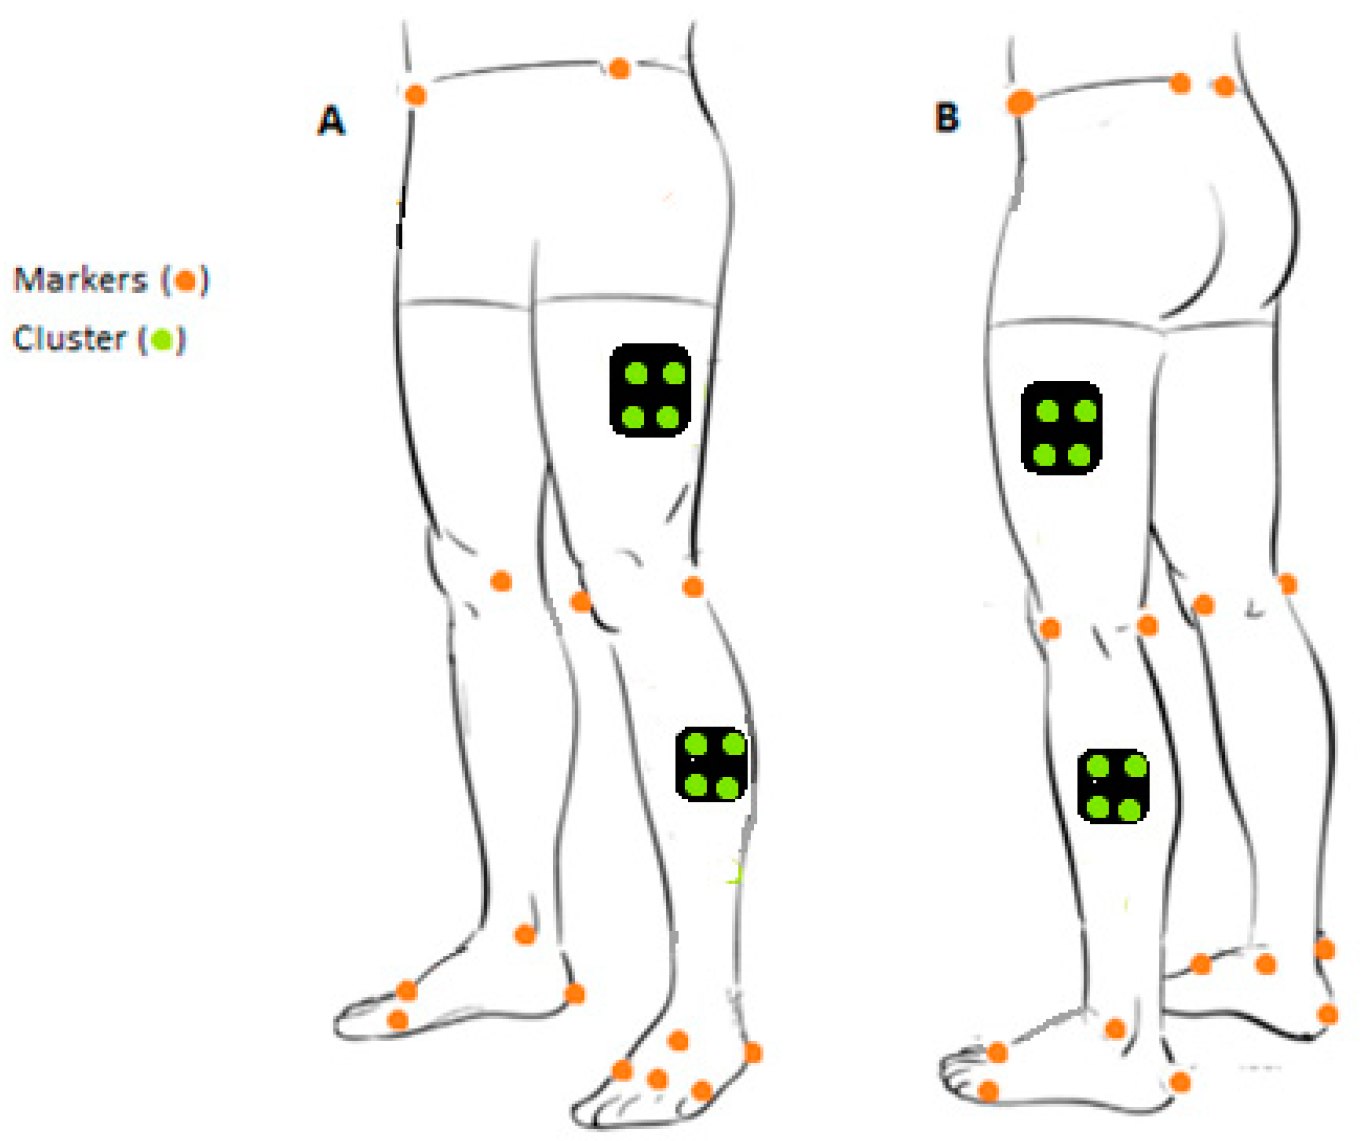
2.1. Design

Prospective controlled study.

2.2. Participants Selection

A convenience sampling of eight children (two females and six males) with cerebral palsy was recruited from two Portuguese cerebral palsy centres to participate in the study. Firstly, the participants’ clinical history was reviewed, and a clinical exam was performed with the subject laid on the table, seated on a chair, or standing. The eligibility criteria were as follows: male and female children, between 4 and 16 years of age; with a clinical diagnosis of Unilateral Spastic Cerebral Palsy or Bilateral Spastic Cerebral Palsy of crural predominance, grades I and II in the Gross Motor Function Classification System (GMFCS) [28]; able to walk independently with or without walking aids; cooperative and able to comply with simple orders; feet size between 20 and 33; who had a clinical recommendation to use an ankle foot orthosis, but have never used it before, or during the trials; who have not undergone orthopaedic surgery of the lower limb in the last 12 months, and who are not expecting to have a surgical intervention in the next 6 months; and who were not given botulinum toxin in the last 6 months [29]. The protocol was approved by and executed in accordance with the Faculty of Human Kinetics Ethics Committee (CEFMH-2/2019). An informed consent was previously signed by the parent or the legal guardian of the participant.

2.3. Gait Protocol

The trials were performed on two different days within a period of 7.5 ± 1.4 days to minimize the assessor memory bias and short enough to prevent a change in the children’s gait pattern or clinical condition [21]. Upon the participants’ arrival, instruction was given about the protocol, the risks and benefits, as well as the informed consent.
The initial clinical exam consisted of a sequence of measures to assess bone and joint deformities, muscle length, muscle force, selective motor control and spasticity [2]. Two experienced researchers performed the clinical assessment while the same assessor was responsible for the placement of the markers in all the sessions. Palpation was used to locate the subcutaneous anatomical landmarks on the participants [30] and subsequently to place the marker set. These were 1.25 cm spherical reflective markers with a 1.8 cm semi-flexible width base. Four marker clusters were attached to the lateral part of the thigh and shank to independently track anatomical landmarks of each segment allowing rotational and translational motion at the joints [19]. These types of markers were adequate for the general height of these children given the smaller body parts. Motion capture data were collected with 14 infrared, high-speed cameras (Qualisys Oqus 300, Qualisys AB, Gothenburg, Sweden) at a frequency rate of 100 Hz. This system was synchronized in time and space with two force plates (FP4060-07, FP4060-10, Bertec, Columbus, OH, USA) embedded into the laboratory walkway [31]. Before each dynamic trial, a barefoot static trial in the standing position was recorded in order to determine the participant’s joint centres and segmental reference systems, as well as segments’ length [19]. Afterwards, the participant was instructed to walk along a 10 m corridor, unassisted at a self-selected pace. The dynamic trials ended when the child successfully achieved a minimum of five complete kinematic and kinetic walking cycles for each side [14,32,33], considering the natural variation in kinematic and kinetic gait parameters [34].

2.4. Data Processing

Gait cycles were extracted using Qualysis Track Manager (QTM) (v2020.3 build 6020, Qualisys AB, Gothenburg, Sweden). The subsequent analysis and processing were done using Visual 3D software (Professional Version v4.80.00, C-Motion, Inc., Rockville, MD, USA). The marker set (Figure 1) that was used followed the calibrated anatomical system protocol (CAST) [30,35] and CODA pelvis [36]. It was used to reconstruct the pelvis and both lower limbs [34]. The 22 individual markers and four marker clusters of four embedded markers each, allowed the reconstruction of seven body segments: feet, shanks, thighs, and pelvis. Each segment is considered to be independent and to have six degrees of freedom [37]. Lower limb segment masses were determined according to Dempster [38] while the remaining inertial parameters were computed based on Hanavan [39].
The pelvic anatomical coordinate system was defined by surface markers placed on the right and left anterior superior iliac spines (ASIS) and on the right and left posterior superior iliac spines (PSIS) and can be described as the origin at the midpoint between the right ASIS and the left ASIS; the Z-axis points from the origin to the right ASIS; the X-axis lies in the plane defined by the right ASIS, left ASIS, and the midpoint of the right PSIS and left PSIS markers and points ventrally orthogonal to the Z-axis; and the Y-axis is orthogonal to the previous two [41]. The hip joint centers were computed using the pelvis markers, according to Bell’s regression equations [36]. Anatomical reference frames of the lower limb segments were defined in accordance with the International Society of Biomechanics (ISB) recommendations to the standard description of joint kinematics [41].
The thigh anatomical coordinate system was defined by the hip joint centers previously computed using the pelvis markers and the lateral and medial femur condyles; the origin was the hip joint center; the Z-axis points from the midpoint between the lateral and medial femur condyles and the origin; the Y-axis is perpendicular to the Z-axis and the frontal plane of the thigh (defined by an axis between the lateral and medial femur condyles and the hip joint center); the X-axis is orthogonal to the previous two.
The shank anatomical coordinate system was defined by the femur condyles and malleolli markers; the origin was the knee joint center defined as the midpoint of the medial and lateral femur condyles; the Z-axis points from the midpoint between the lateral and medial malleoli and the origin; the Y-axis is perpendicular to the frontal plane of the shank and Z-axis; X-axis is orthogonal to the previous two.
The foot anatomical coordinate system was defined by the malleolli markers and the metatarsal markers; the origin was the ankle joint center defined by the midpoint between the lateral and medial malleoli markers; the Z-axis points from the midpoint between the 1st and 5th metatarsal heads and the origin; the Y-axis is perpendicular to the frontal plane of the foot and the Z-axis; X-axis is orthogonal to the previous two [42].
Lower limb and pelvis joint angles (calculated using a XYZ Cardan sequence) and moments (determined through inverse dynamics and normalized to subjects’ body mass) were computed and expressed relative to the proximal segment. The XYZ Cardan sequence was used due to the ISB recommendations regarding its clinical and anatomical meaning [43], since the description of X, Y and Z are equal to flexion-extension, abduction-adduction and longitudinal internal-external rotation, respectively.
A cubic spline smoothing routine was used to filter both kinematic and kinetic data. The segment length was defined as the distance between the proximal and distal ends of the segment. Kinematic and kinetic data were normalized to 100% of the gait cycle. Peak values for lower limb angles and moments, as well as time–distance parameters, were computed for each cycle and averaged for each subject [21]. All data were considered assuming the lower limbs as independent to evaluate the variation of each one, even if they participated jointly during the gait cycle.

2.5. Statistical Methods

Statistical analysis to assess test-retest reliability of the gait kinematic and kinetic data was carried out using the method described by Quigley et al. [44] and Fernandes et al. [21]. Intraclass correlation coefficients considering the two-way mixed model, and absolute agreement (ICC[A,k]) [45,46] were calculated for anthropometric, time-distance, kinematic and kinetic parameters of both lower limbs. The level of agreement was considered poor, fair, good, and excellent when ICC < 0.40, 0.40 ≤ ICC < 0.60, 0.60 ≤ ICC < 0.75, 0.75 ≤ ICC ≤ 1.00, respectively [47]. The absolute measure of reliability standard error of measurement (SEM) was calculated using the following equation: SEM = S D d i f f / 2 . The indicated levels of error for kinematic data were considered acceptable if SEM ≤ 2°, reasonable between 2° and 5°, and concerning if SEM ≥ 5° [20]. From each trial, 97 individual values of clinical interest were extracted. The calculated key points included the mean difference between measurements and the 95% confidence interval (CI) for mean difference, the standard deviation of the differences ( S D d i f f ) and the 95% Bland and Altman limits of agreement (95% LOA). All the statistical tests were conducted using SPSS (version 26.0; IBM, Chicago, IL, USA) and p < 0.05 was considered statistically significant.

3. Results

The participants of the study were a convenience sampling of eight CP children (Table 1) able to walk independently (three hemiplegic, five diplegic; two females, six males; age 87.88 ± 25.56 months; height 1.17 ± 0.14 m; mass 24.25 ± 8.26 kg). Two trials were performed on two different days within period of 7.5 ± 1.4 days.

3.1. Reliability of Anthropometric Parameters

The ICCs were ≥0.96 for anthropometric measurements (Table 2). The lowest were the right (0.97, 95% CI 0.86 to 0.99) and left foot segment length (0.96, 95% CI 0.83 to 0.99) and SEM values were ≤0.64 cm.

3.2. Reliability of Time-Distance Parameters

For time-distance parameters, ICCs were ≥0.75 (Table 3) except for right step length (0.64, 95% CI 0.00 to 0.92) and right stride length (0.64, 95% CI 0.00 to 0.92). The SEM values were 0.06 m and 0.11 m, respectively.

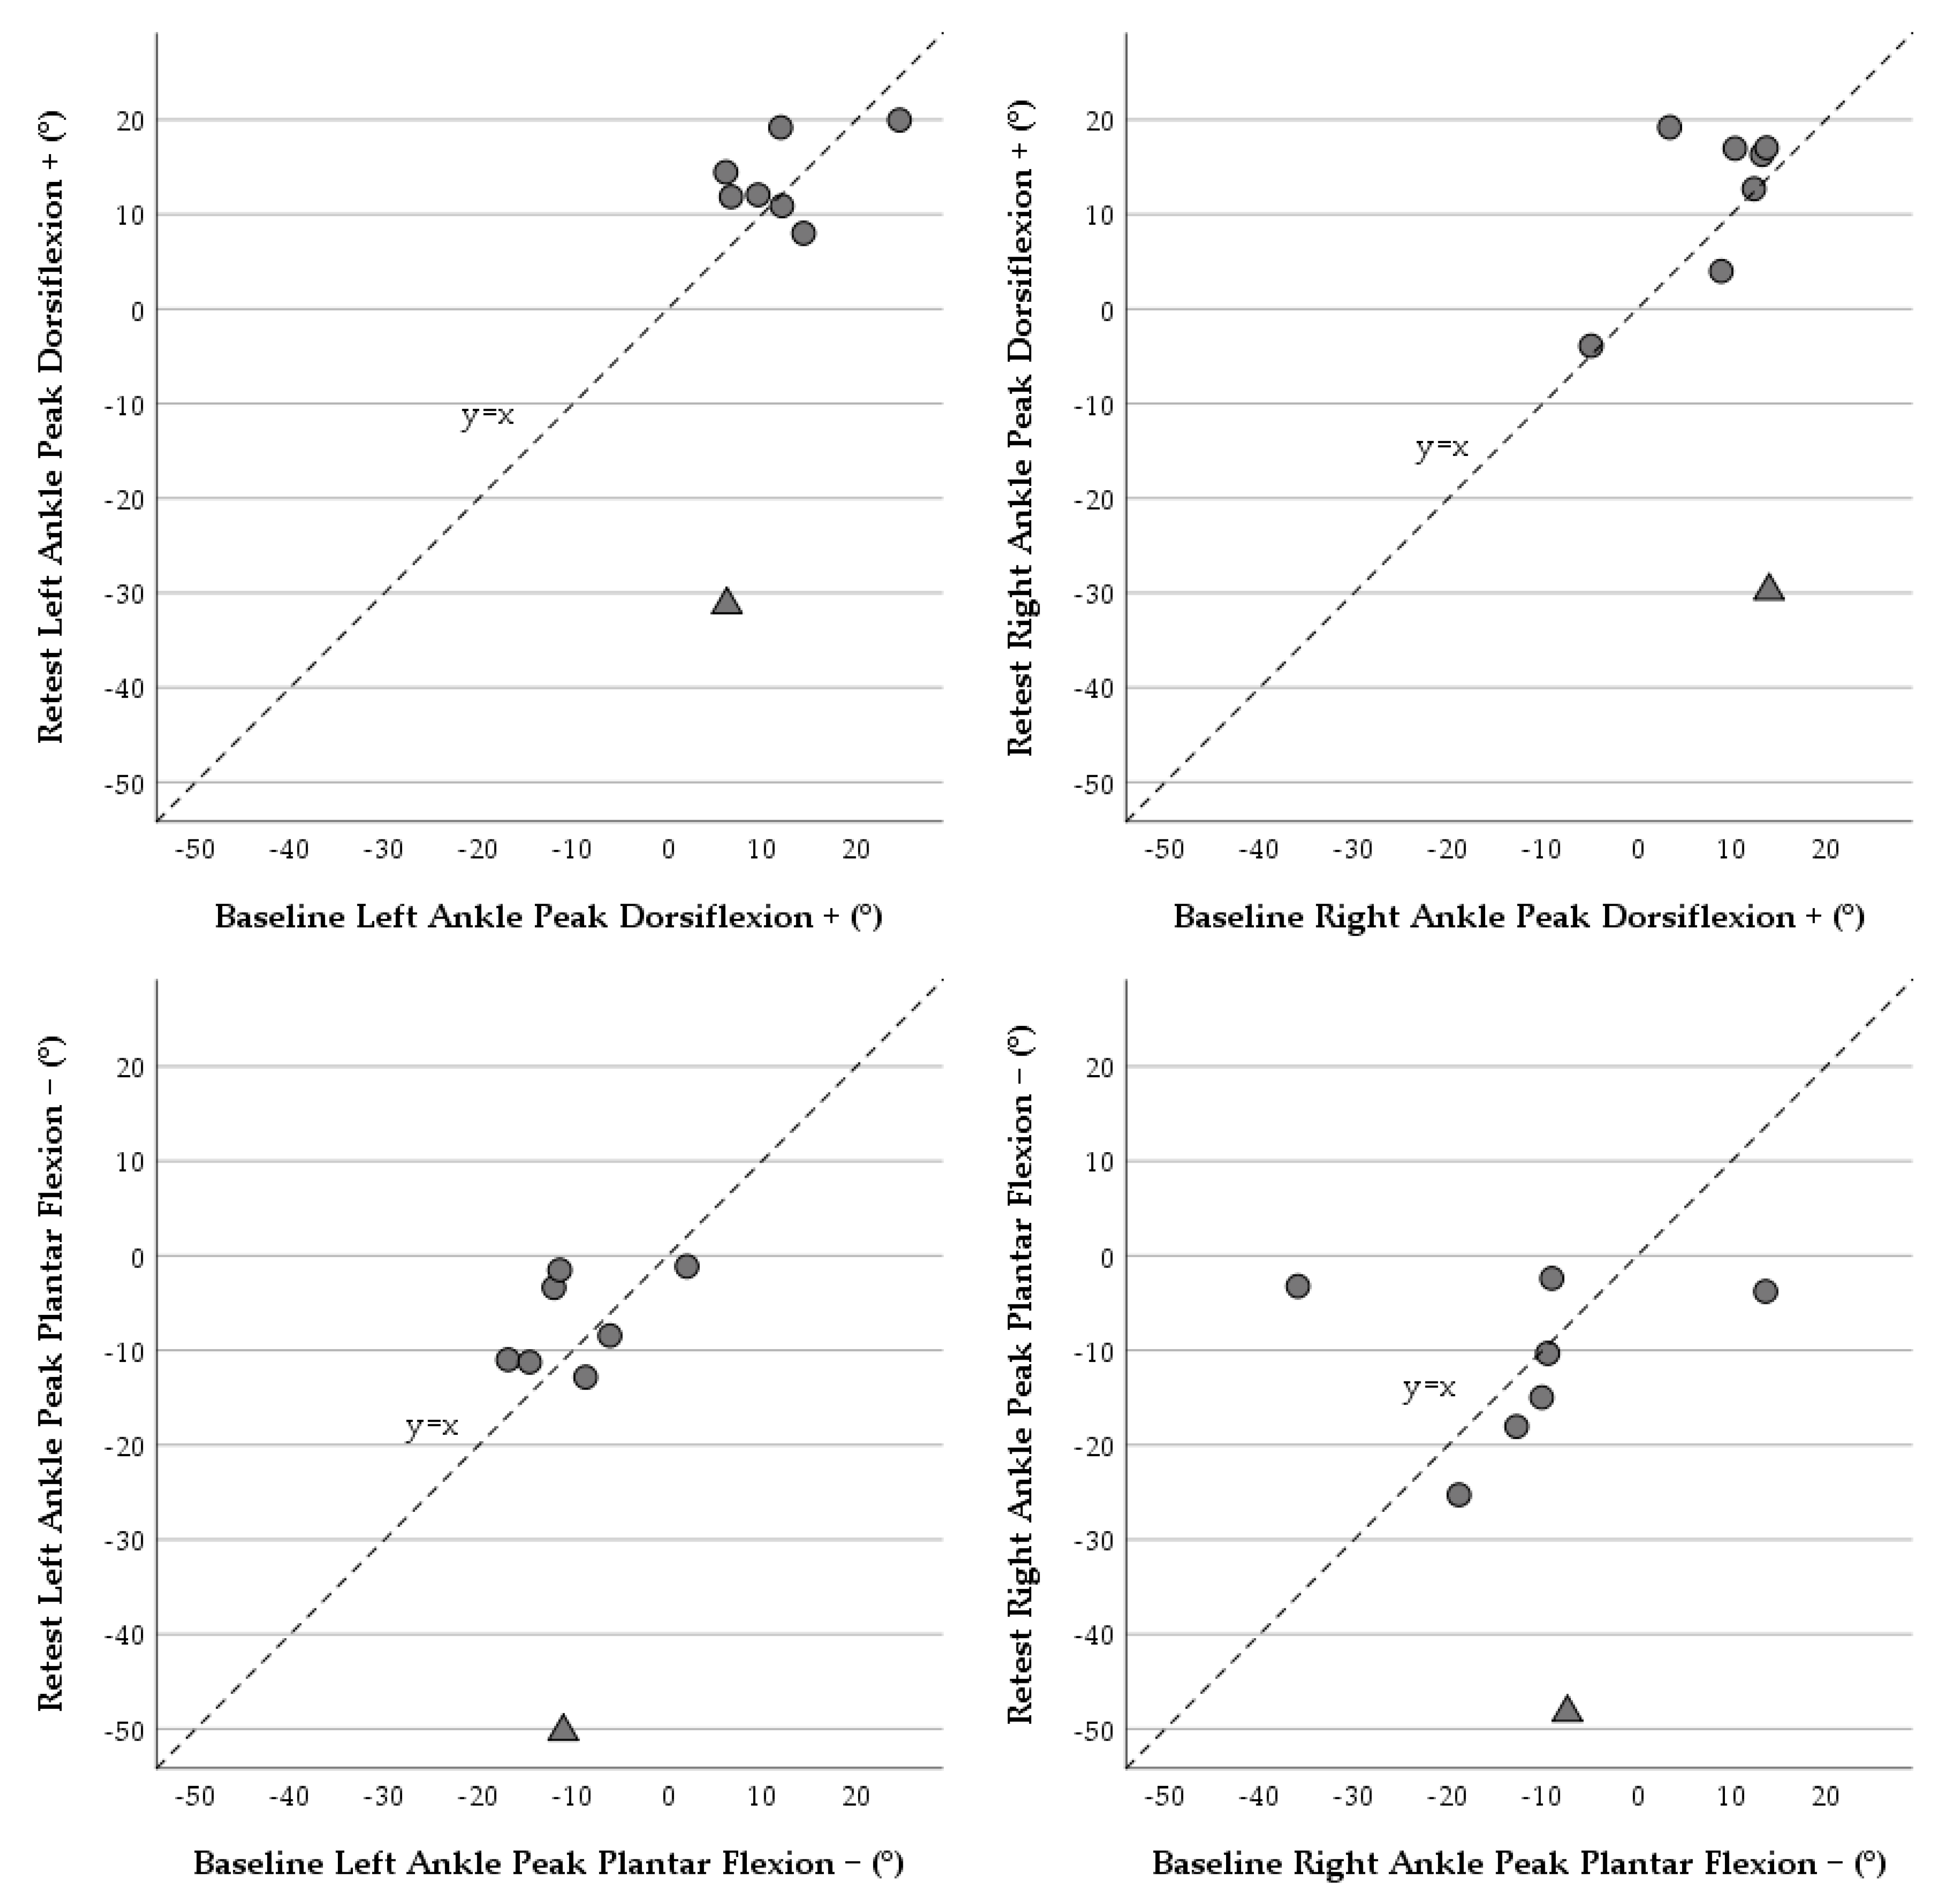
3.3. Reliability of Kinematic Parameters

Most joint angle peaks demonstrated excellent ICCs ≥0.75 (Table 4). Good ICCs were also shown in both sides of the lower limbs. On the right lower limb, the pelvic obliquity up was (0.67, 95% CI 0.00 to 0.94) and the hip internal and external rotation (0.73, 95% CI 0.00 to 0.95) and (0.67, 95% CI 0.00 to 0.93), respectively. Similarly on the left side, hip abduction was (0.60, 95% CI 0.00 to 0.92) and internal rotation (0.67, 95% CI 0.00 to 0.93). At the knee joint, its internal rotation was (0.64, 95% CI 0.00 to 0.92) and ankle eversion (0.60, 95% CI 0.00 to 0.91). However, a few of the ICCs variables were poor, the majority on the right side, with hip flexion (0.14, 95% CI 0.00 to 0.84), knee abduction (0.37, 95% CI 0.00 to 0.88), adduction (0.33, 95% CI 0.00 to 0.87), internal rotation (0.00, 95% CI 0.00 to 0.69) and ankle plantar flexion (0.00, 95% CI 0.00 to 0.81) and inversion (0.00, 95% CI 0.00 to 0.80). In the left side, only the ankle plantar flexion (0.27, 95% CI 0.00 to 0.92) presented similar values in this range. The SEM values ranged between 1.8° to 14.7° and average between 3.2° e 7.9°.

3.4. Reliability of Kinetic Parameters

For the ICCs of kinetic parameters, the results were higher than those for the kinematic data, where the majority were ≥0.75 (Table 5). The lowest ICCs between sessions were found in right knee joint valgus moment (0.00, 95% CI 0.00 to 0.78), right ankle dorsiflexion (0.00, 95% CI 0.00 to 0.77) and left hip joint adduction moment (0.00, 95% CI 0.00 to 0.75). The SEM values ranged between 0.1 Nm/Kg to 14.7 Nm/Kg and averaged between 0.1 Nm/Kg and 0.1 Nm/Kg.

4. Discussion

The purpose of this study was to evaluate the inter-session reliability and measurement error of a 3D gait analysis protocol in a group of CP children, in order to better understand the causes of intrinsic and extrinsic variation. Knowing this variability is crucial to improve clinical analysis that supports decision-making in the rehabilitation process.
Ferrari et al. [17] have found that when comparing five protocols on the same gait cycles, the main cause for the variability of outcomes between variables was the biomechanical model used and its definitions, regardless of the number of raters or even different laboratories. These different biomechanical models make it more difficult to compare results between reliability studies, as they present different sources of variability [17]. Repeated testing of a single subject allows for a clinical usefulness of the data, since it provides some understanding into the extent of variation of the measured outcomes that can be expected due to the pathology and those that are truly a consequence of a therapeutic intervention [15].
Despite extreme caution and compliance with the protocol instructions regarding the marker placement procedure, some inconsistency is still unavoidable [16], while possible sources of error can occur due to subjects’ natural oscillations or skin motion [13] or movement between the skin markers and the underlying bones [50,51]. This source of error is totally disruptive for the joints with a limited range of motion, such as knee abduction–adduction, internal–external rotation, and linear displacements [52,53].
CP children can demonstrate different gait patterns in each leg. This occurs not only in unilateral spastic CP, where each legs presents different kinematic values [23], but also in some bilateral spastic CP children with an asymmetrical gait pattern, combining at least two different types of gait pattern [48]. A previous study by Mackey et al. [26] used the 6DoF Cleveland marker set with unilateral CP children and presented similar results at both normal and hemiplegic limbs, where the highest repeatability was at the sagittal plane (CMC values of 0.96–0.99) and lower in the transverse and frontal planes (CMC ≥ 0.7), In this study, the CP children presented different gait patterns (Table 1): five had bilateral spasticity, two had unilateral spasticity with their right limb affected and one was affected in the left limb, which contributed to some degree of variation of the data. The overall ICC results of kinematic and kinetic variables were lower on the right side, which can indicate that—to some degree—the instability of the affected lower limbs could influence the propagation of the STA. Reinschmidt and co-investigators reported that the soft tissue motion can originate additional movement, resulting in an overestimation in kinematic peak values of the segments by as much as 100% [54]. This is in accordance with our research, where a larger variation was noted in the transverse and frontal planes of the knee (Table 4). In the 6DoF models it is assumed that the limbs’ segments are independent and do not share a fixed joint centre, which often originates non-physiological translations between the proximal and distal bones at some joints [22]. However, in pathological gait, care should be taken because non physiological movements may occur.
Typically true equinus gait patterns constrain CP children to stand with the ankle in a neutral position [48]. However, according to Schlough et al. [55] when passive dorsiflexion is detected in the clinical examination, it is possible for some subjects to walk with their feet flat on the ground upon request. This variability in walking pattern during development is considered typical. Nevertheless, when unable to perform heel contact, some biomechanical compensation is detected, mainly in the coordination of movement at the hip, knee and ankle joints. In this study, one subject presented mild spastic diplegia and a considerable gastrocnemius tone (as seen in Table 1), which often shows similar characteristics to idiopathic toe walking. In the first session, the subject was able to perform a normal heel strike at initial contact and during the stance phase of walking. However, during the dynamic trials in the second session, the gastrocnemius stiffness was significantly higher which caused some motion restriction at the ankle. As, in the static calibration trial, the subject was able to stand with both feet flat on the floor, the range of motion differences were wider from the start. The magnitude of this variation is visible in the scatter plots of the dorsi/plantar flexion (Figure 2). When we compare the kinematic data between sessions, there was an increase of 8° in hip flexion, a decrease of 13° in knee flexion and a total absence of ankle dorsiflexion in both lower limbs. These results are in accordance with the study of Hicks et al. [56] where CP children with toe walking often exhibited increased hip flexion and a decrease in knee flexion throughout the walking cycle. Furthermore, excessive plantar flexion may be responsible for changes in flexion, internal rotation and adduction of the hip as well as in the pelvic anterior tilt [33] which explains the reduced ICC on left and right anterior tilt (0.40 and 0.51, respectively) compared with the other kinematic variables of this segment, as seen in Table 4.
Yet, due to co-spasticity of the muscles causing reciprocal movements across the joints and originating a wider variation in kinematic data, CP children are not able to change joint moments which results in a more reliable measure between the two assessment days [57]. This is evident in our results where the kinetic variables presented less variation (Table 5), in accordance with similar studies [16,23]. Although there is no reliability analysis published with a 6DoF model and kinetics variables, these results may be partially attributed to the small variations of the anthropometric measurements. Even though the two recorded sessions occurred several days apart, there was a small variation in marker placement between sessions (Table 2). Anthropometric measurements were considered excellent regarding ICC (ICC average ≈ 0.98) and an absolute error of approximately 4 mm.

Limitations

The number of CP children included in similar studies varies from 5 to 20 [23,24,25,26,44] and even though this gait protocol was performed with 8 CP children, the analysis of the right and left legs imply distinguished experiments, involving independent landmark identification, marker attachment, anthropometric measurements, and data processing [17]. Consequently, the current research should be considered as an independent analysis of sixteen legs.
Given that every gait research laboratory uses its own marker set and gait model, in order to compare gait analysis data, all the specific methodology used in each process must be considered. Regardless of the set of techniques chosen, there will always be different measurement errors that can influence the outcomes and consequently, a clinical interpretation. These differences have a greater impact in the kinematic and kinetic outcome measures (e.g., joint angles and moments). Thus, gait protocols should be described in detail to allow a contextualized interpretation of the results and comparison between similar investigations. This should be done in a critical manner on all the variables during the gait cycle, rather than only interpret the absolute values presented, regardless of the measures of repeatability or correlation used [15]. It is of great relevance when it comes to gait assessment of CP children who have an intrinsic gait variability due to their neuromuscular impairments. In these cases, it is crucial to differentiate the methodological errors (raters error) from the participants’ natural variability and from the effect of a rehabilitation process.
Due to the different gait analysis protocols used, the influence of the number of gait cycles in test–retest reliability measurements [11] remains to be determined. Although in general, repeatability increases with a higher number of gait cycles, this is true mainly for the kinematic data. All the time-distance and kinetic parameters do not reveal significant differences from the fifth gait cycle onwards. In addition, the assessment of more than five gait cycles in a clinical setting may be difficult to accomplish due to the preparation of the subject [34]. Regarding CP children, this can be a very complex and difficult task, therefore the five gait cycles used in this protocol were shown to be quite good in achieving reliable results.

5. Conclusions

This study indicates wide-ranging reliability values for lower limb joint angles and joint moments of force during gait, especially for frontal and transverse planes. Although the use of a 6DoF-CAST in CP children was shown to be a feasible method, the gait variation that can be observed between sessions in CP children seems to be related not only to the extrinsic factors but also to their different gait patterns and affected sides. In future research, it could be interesting to assess the reliability of these models using different groups of subjects, according to their gait pattern, for instance. These models and their technical characteristics still require some improvements in order to support clinical decision-making.

Author Contributions

Conceptualization, D.R., A.P.V. and F.J.; methodology, D.R. and F.J.; software, D.R., J.T. and F.J.; validation, A.P.V. and F.J.; formal analysis, J.T., A.P.V. and F.J.; investigation, D.R., M.R.R. and F.J.; resources, A.P.V. and F.J.; data curation, D.R., M.R.R., J.T. and F.J.; writing—original draft preparation, D.R., J.T. and F.J.; writing—review and editing, D.R. and F.J.; visualization, J.T., M.R.R. and A.P.V.; supervision, F.J.; project administration, F.J.; funding acquisition, A.P.V. All authors have read and agreed to the published version of the manuscript.

Funding

This work was supported by the Fundação para a Ciência e Tecnologia (FCT), through CIPER (unit 369 447) with the reference project UIDB/00447/2020.

Institutional Review Board Statement

The study was conducted according to the guidelines of the Declaration of Helsinki and approved by and executed in accordance with the Faculty of Human Kinetics Ethics Committee (CEFMH-2/2019).

Informed Consent Statement

An informed consent was signed by the parent or the legal guardian of the participant.

Data Availability Statement

All data generated or analysed during this study are included in this published article.

Conflicts of Interest

The authors declare no conflict of interest.

References

  1. Rosenbaum, P. Definition and Clinical Classification. In Cerebral Palsy: Science and Clinical Practice, 1st ed.; Dan, B., Mayston, M., Paneth, N., Rosenbloom, L., Eds.; Mac Keith Press: London, UK, 2014; pp. 17–26. [Google Scholar]
  2. Graham, K.K.H.; Rosenbaum, P.; Paneth, N.; Dan, B.; Lin, J.-P.; Damiano, D.L.; Becher, J.G.J.; Gaebler-Spira, D.; Colver, A.A.; Reddihough, D.S.D.; et al. Cerebral palsy. Nat. Rev. Dis. Prim. 2016, 2, 15082. [Google Scholar] [CrossRef]
  3. Eunson, P. Aetiology and epidemiology of cerebral palsy. Paediatr. Child Health 2016, 26, 367–372. [Google Scholar] [CrossRef]
  4. Surveillance of cerebral palsy in Europe: A collaboration of cerebral palsy surveys and registers. Dev. Med. Child Neurol. 2000, 42, 816–824. [CrossRef]
  5. Cerebral Palsy. In Cerebral Palsy; Springer: Berlin/Heidelberg, Germany, 2018; pp. 19–28.
  6. Colver, A.; Fairhurst, C.; Pharoah, P. Cerebral palsy. Lancet 2014, 383, 1240–1249. [Google Scholar] [CrossRef]
  7. Maenner, M.J.; Blumberg, S.J.; Kogan, M.D.; Christensen, D.; Yeargin-Allsopp, M.; Schieve, L.A. Prevalence of cerebral palsy and intellectual disability among children identified in two U.S. National Surveys, 2011–2013. Ann. Epidemiol. 2016, 26, 222–226. [Google Scholar] [CrossRef] [Green Version]
  8. Hoffer, M.M.; Perry, J. Pathodynamics of Gait Alterations in Cerebral Palsy and the Significance of Kinetic Electromyography in Evaluating Foot and Ankle Problems. Foot Ankle 1983, 4, 128–134. [Google Scholar] [CrossRef] [PubMed]
  9. Rosenbaum, P.; Paneth, N.; Leviton, A.; Goldstein, M.; Bax, M. The Definition and Classification of Cerebral Palsy. Dev. Med. Child Neurol. 2007, 49, 1–44. [Google Scholar]
  10. Wright, E.; Dibello, S.A. Principles of Ankle-Foot Orthosis Prescription in Ambulatory Bilateral Cerebral Palsy. Phys. Med. Rehabil. Clin. N. Am. 2020, 31, 69–89. [Google Scholar] [CrossRef] [PubMed]
  11. McGinley, J.L.; Baker, R.; Wolfe, R.; Morris, M.E. The reliability of three-dimensional kinematic gait measurements: A systematic review. Gait Posture 2009, 29, 360–369. [Google Scholar] [CrossRef]
  12. Altman, D. Practical Statistics for Medical Research, 2nd ed.; Chapman & Hall/CRC: London, UK, 2020. [Google Scholar]
  13. Molina-Rueda, F.; Fernández-González, P.; Cuesta-Gómez, A.; Koutsou, A.; Carratalá-Tejada, M.; Miangolarra-Page, J. Test-Retest Reliability of a Conventional Gait Model for Registering Joint Angles during Initial Contact and Toe-Off in Healthy Subjects. Int. J. Environ. Res. Public Health 2021, 18, 1343. [Google Scholar] [CrossRef]
  14. Horsak, B.; Pobatschnig, B.; Baca, A.; Greber-Platzer, S.; Kreissl, A.; Nehrer, S.; Wondrasch, B.; Crevenna, R.; Keilani, M.; Kranzl, A. Within-assessor reliability and minimal detectable change of gait kinematics in a young obese demographic. Gait Posture 2017, 54, 112–118. [Google Scholar] [CrossRef]
  15. Stief, F. Variations of marker sets and models for standard gait analysis. In Handbook of Human Motion, 1st ed.; Müller, B., Wolf, S., Eds.; Springer AG: Cham, Switzerland, 2018; pp. 509–523. [Google Scholar]
  16. Kadaba, M.P.; Ramakrishnan, H.K.; Wootten, M.E.; Gainey, J.; Gorton, G.; Cochran, G.V.B. Repeatability of kinematic, kinetic, and electromyographic data in normal adult gait. J. Orthop. Res. 1989, 7, 849–860. [Google Scholar] [CrossRef]
  17. Ferrari, A.; Benedetti, M.G.; Pavan, E.E.; Frigo, C.; Bettinelli, D.; Rabuffetti, M.; Crenna, P.; Leardini, A. Quantitative comparison of five current protocols in gait analysis. Gait Posture 2008, 28, 207–216. [Google Scholar] [CrossRef] [PubMed]
  18. Baker, R.; Leboeuf, F.; Reay, J.; Sageux, M. The Conventional Gait Model—Success and Limitations. In Handbook of Human Motion, 1st ed.; Müller, B., Wolf, S., Eds.; Springer AG: Cham, Switzerland, 2018; pp. 490–505. [Google Scholar]
  19. Collins, T.D.; Ghoussayni, S.N.; Ewins, D.J.; Kent, J.A. A six degrees-of-freedom marker set for gait analysis: Repeatability and comparison with a modified Helen Hayes set. Gait Posture 2009, 30, 173–180. [Google Scholar] [CrossRef] [PubMed]
  20. Kiernan, D.; Simms, C. Reliability and measurement error of multi-segment trunk kinematics and kinetics during cerebral palsy gait. Med. Eng. Phys. 2020, 75, 53–58. [Google Scholar] [CrossRef] [PubMed]
  21. Fernandes, R.; Armadadasilva, P.A.S.; Pool-Goudzwaard, A.L.; Moniz-Pereira, V.; Veloso, A.P. Test–retest reliability and minimal detectable change of three-dimensional gait analysis in chronic low back pain patients. Gait Posture 2015, 42, 491–497. [Google Scholar] [CrossRef] [PubMed]
  22. Barré, A.; Thiran, J.-P.; Jolles, B.M.; Theumann, N.; Aminian, K. Soft Tissue Artifact Assessment during Treadmill Walking in Subjects with Total Knee Arthroplasty. IEEE Trans. Biomed. Eng. 2013, 60, 3131–3140. [Google Scholar] [CrossRef]
  23. Steinwender, G.; Saraph, V.; Scheiber, S.; Zwick, E.B.; Uitz, C.; Hackl, K. Intrasubject repeatability of gait analysis data in normal and spastic children. Clin. Biomech. 2000, 15, 134–139. [Google Scholar] [CrossRef]
  24. Miller, F.; Castagno, P.; Richards, J.; Lennon, N.; Quigley, E.; Niiler, T. Reliablity of kinematics during clinical gait analysis: A comparison between normal and children with cerebal palsy. Gait Posture 1996, 4, 169–170. [Google Scholar] [CrossRef]
  25. Noonan, K.J.; Halliday, S.; Browne, R.; O’Brien, S.; Kayes, K.; Feinberg, J. Interobserver Variability of Gait Analysis in Patients with Cerebral Palsy. J. Pediatr. Orthop. 2003, 23, 279–287. [Google Scholar] [CrossRef]
  26. Mackey, A.; Walt, S.E.; Lobb, G.A.; Stott, N.S. Reliability of upper and lower limb three-dimensional kinematics in children with hemiplegia. Gait Posture 2005, 22, 1–9. [Google Scholar] [CrossRef]
  27. Røislien, J.; Skare, Ø.; Opheim, A.; Rennie, L. Evaluating the properties of the coefficient of multiple correlation (CMC) for kinematic gait data. J. Biomech. 2012, 45, 2014–2018. [Google Scholar] [CrossRef]
  28. Palisano, R.; Rosenbaum, P.; Walter, S.; Russell, D.; Wood, E.; Galuppi, B. Development and reliability of a system to classify gross motor function in children with cerebral palsy. Dev. Med. Child Neurol. 1997, 39, 214–223. [Google Scholar] [CrossRef]
  29. Gibson, J. Gibson Theory of Affordances, 1st ed.; Lawrence Erlbaum Associates, Inc.: Mahwah, NJ, USA, 1986. [Google Scholar]
  30. Chiari, L.; Della Croce, U.; Leardini, A.; Cappozzo, A. Human movement analysis using stereophotogrammetry: Part 2: Instrumental errors. Gait Posture 2005, 21, 197–211. [Google Scholar] [CrossRef] [PubMed]
  31. Moniz-Pereira, V.; Cabral, S.; Carnide, F.; Veloso, A.P. Sensitivity of Joint Kinematics and Kinetics to Different Pose Estimation Algorithms and Joint Constraints in the Elderly. J. Appl. Biomech. 2013, 30, 446–460. [Google Scholar] [CrossRef] [PubMed]
  32. Diss, C. The reliability of kinetic and kinematic variables used to analyse normal running gait. Gait Posture 2001, 14, 98–103. [Google Scholar] [CrossRef]
  33. Schmid, S.; Romkes, J.; Taylor, W.R.; Lorenzetti, S.; Brunner, R. Orthotic correction of lower limb function during gait does not immediately influence spinal kinematics in spastic hemiplegic cerebral palsy. Gait Posture 2016, 49, 457–462. [Google Scholar] [CrossRef] [PubMed]
  34. Monaghan, K.; Delahunt, E.; Caulfield, B. Increasing the number of gait trial recordings maximises intra-rater reliability of the CODA motion analysis system. Gait Posture 2007, 25, 303–315. [Google Scholar] [CrossRef] [PubMed]
  35. Kaufman, K.; Miller, E.; Kingsbury, T.; Esposito, E.R.; Wolf, E.; Wilken, J.; Wyatt, M. Reliability of 3D gait data across multiple laboratories. Gait Posture 2016, 49, 375–381. [Google Scholar] [CrossRef] [Green Version]
  36. Cappozzo, A.; Catani, F.; Croce, U.D.; Leardini, A. Position and orientation in space of bones during movement: Anatomical frame definition and determination. Clin. Biomech. 1995, 10, 171–178. [Google Scholar] [CrossRef]
  37. Bell, L.; Pedersen, R.; Brand, A. A comparison of the accuracy of several hip center location prediction methods. J. Biomech. 1990, 23, 617–621. [Google Scholar] [CrossRef]
  38. Cappello, A.; Francesco, P.; Palombara, L.; Leardini, A. Optimization and smoothing techniques in movement analysis. Int. J. Biomed. Comput. 1996, 41, 137–151. [Google Scholar] [CrossRef]
  39. Dempster, W.T. Space Requirements of the Seated Operator, Geometrical, Kinematic, and Mechanical Aspects of the Body with Special Reference to the Limbs; Wright-Patterson Air Force Base: Dayton, OH, USA, 1955. [Google Scholar]
  40. Hanavan, E.P. A Mathematical Model of the Human Body; Office of Technical Services: Dayton, OH, USA, 1964.
  41. Wu, G.; Siegler, S.; Allard, P.; Kirtley, C.; Leardini, A.; Rosenbaum, D.; Whittle, M.; D’Lima, D.D.; Cristofolini, L.; Witte, H.; et al. ISB recommendation on definitions of joint coordinate system of various joints for the reporting of human joint motion—Part I: Ankle, hip, and spine. J. Biomech. 2002, 35, 543–548. [Google Scholar] [CrossRef]
  42. Robertson, D.G.E.; Caldwell, G.E.; Hamill, J.; Kamen, G.; Whittlesey, S.N. Research Methods in Biomechanics, 2nd ed.; Human Kinetics Publisher: Champaign, IL, USA, 2014. [Google Scholar]
  43. Grood, E.S.; Suntay, W.J. A Joint Coordinate System for the Clinical Description of Three-Dimensional Motions: Application to the Knee. J. Biomech. Eng. 1983, 105, 136–144. [Google Scholar] [CrossRef]
  44. Quigley, E.; Miller, F.; Castagno, P.; Richards, J.; Lennon, N. Variability of gait measurements for typically developing children and children with cerebral palsy. Gait Posture 1999, 10, 58. [Google Scholar] [CrossRef]
  45. Mcgraw, K.; Wong, S. Forming Inferences about Some Intraclass Correlation Coefficients. Psychol. Methods 1996, 1, 30–46. [Google Scholar] [CrossRef]
  46. Koo, T.K.; Li, M.Y. A Guideline of Selecting and Reporting Intraclass Correlation Coefficients for Reliability Research. J. Chiropr. Med. 2016, 15, 155–163. [Google Scholar] [CrossRef] [Green Version]
  47. Li, L.; Zeng, L.; Lin, Z.-J.; Cazzell, M.; Liu, H. Tutorial on use of intraclass correlation coefficients for assessing intertest reliability and its application in functional near-infrared spectroscopy–based brain imaging. J. Biomed. Opt. 2015, 20, 050801. [Google Scholar] [CrossRef]
  48. Rodda, J.M.; Graham, H.K.; Carson, L.; Galea, M.P.; Wolfe, R. Sagittal gait patterns in spastic diplegia. J. Bone Jt. Surg. 2004, 86, 251–258. [Google Scholar] [CrossRef]
  49. Winters, T.F., Jr.; Gage, J.R.; Hicks, R. Gait patterns in spastic hemiplegia in children and young adults. J. Bone Jt. Surg. 1987, 69, 437–441. [Google Scholar]
  50. Leardini, A.; Chiari, L.; Croce, U.D.; Cappozzo, A. Human movement analysis using stereophotogrammetry: Part 3. Soft tissue artifact assessment and compensation. Gait Posture 2005, 21, 212–225. [Google Scholar] [CrossRef]
  51. Akbarshahi, M.; Schache, A.G.; Fernandez, J.W.; Baker, R.; Banks, S.; Pandy, M.G. Non-invasive assessment of soft-tissue artifact and its effect on knee joint kinematics during functional activity. J. Biomech. 2010, 43, 1292–1301. [Google Scholar] [CrossRef] [PubMed]
  52. Benoit, D.; Damsgaard, M.; Andersen, M. Surface marker cluster translation, rotation, scaling and deformation: Their contribution to soft tissue artefact and impact on knee joint kinematics. J. Biomech. 2015, 48, 2124–2129. [Google Scholar] [CrossRef]
  53. Camomilla, V.; Bonci, T.; Dumas, R.; Cheze, L.; Cappozzo, A. A model of the soft tissue artefact rigid component. J. Biomech. 2015, 48, 1752–1759. [Google Scholar] [CrossRef] [PubMed]
  54. Reinschmidt, C.; Bogert, A.; Lundberg, A.; Nigg, B.M.; Murphy, N.; Alta, T. Tibiofemoral and tibiocalcaneal motion during walking: External vs. skeletal markers. Gait Posture 1997, 6, 98–109. [Google Scholar] [CrossRef]
  55. Schlough, K.; Andre, K.; Owen, M.; Adelstein, L.; Hartford, M.C.; Javier, B.; Kern, R. Differentiating between Idiopathic Toe Walking and Cerebral Palsy: A Systematic Review. Pediatr. Phys. Ther. 2020, 32, 2–10. [Google Scholar] [CrossRef]
  56. Hicks, R.; Durinick, N.; Gage, J. Differentiation of idiopathic toe-walking and cerebral palsy. J. Pediatr. Orthop. 1988, 8, 160–163. [Google Scholar] [CrossRef]
  57. Winter, D.A. Kinematic and kinetic patterns in human gait: Variability and compensating effects. Hum. Mov. Sci. 1984, 3, 51–76. [Google Scholar] [CrossRef]
Figure 1. Positioning of the retroreflective markers attached to the subjects. Adapted from [40]: (A) anterior view; (B) posterior view.
Applsci 11 06515 g001
Figure 2. Scatter plots for ankle peak joint angles for dorsiflexion and plantar flexion. Subject with increased gastrocnemius stiffness values is represented with a different symbol from the rest.
Applsci 11 06515 g002
Table 1. Subject characteristics.
Left Lower LimbRight Lower Limb
SubjectAffected SideHeight (m)Mass (Kg)True Leg Length (cm)Sagittal Gait
Pattern
Gastrocnemius Spasticity
(Modified
Ashworth Scale)
True Leg Length (cm)Sagittal Gait
Pattern
Gastrocnemius
Spasticity
(Modified
Ashworth Scale)
001Bilateral1.0919.552.5True equinus [48]1+54.5True equinus [48]2
002Unilateral1.142654.6Normal054.3True equinus [49]2
003Bilateral1.322666Apparent equinus [48]1+66Apparent equinus [48]1+
004Unilateral0.9813.546True equinus [48]1+45Normal0
005Bilateral1.373471Apparent equinus [48]270.5Apparent equinus [48]2
006Unilateral1.323770.2Normal070.1True equinus with recurvatum knee [49]1+
007Bilateral1.0615.552True equinus [48]352.7True equinus [48]3
008Bilateral1.101854Jump gait [48]254.5Jump gait [48]2
Table 2. Reliability values for anthropometric measurements.
Anthropometric ParametersICCICC 95% CIMeanMean DiffMean Diff 95% CI S D d i f f 95% LOASEM
Pelvis Segment Depth (cm)0.98(0.93, 0.99)13.20.2(−0.2, 0.7)0.6(−0.97, 1.40)0.4
Inter ASIS Distance (cm)0.98(0.94, 0.99)17.3−0.1(−0.7, 0.3)0.6(−1.50, 1.13)0.4
Right Tight Segment Length (cm)0.99(0.97, 0.99)26.6−0.1(−0.7, 0.4)0.7(−1.55, 1.20)0.5
Left Tight Segment Length (cm)0.99(0.89, 0.99)26.7−0.5(−0.9, 0.1)0.4(−1.50, 0.42)0.3
Right Leg Segment Length (cm)0.99(0.95, 0.99)25.80.1(−0.7, 0.8)0.9(−1.68, 1.85)0.6
Left Leg Segment Length (cm)0.99(0.97, 0.99)25.90.3(−0.0, 0.7)0.4(−0.53, 1.23)0.3
Right Foot Segment Length (cm)0.97(0.86, 0.99)8.80.1(−0.2, 0.4)0.4(−0.76, 0.96)0.3
Left Foot Segment Length (cm)0.96(0.83, 0.99)9.00.1(−0.3, 0.5)0.5(−1.01, 1.21)0.4
Average0.98 0.4
Intraclass correlation coefficient, ICC; 95% CI, 95% confidence interval for the ICC; mean, mean of measurements at baseline trial and retest trial; mean diff, mean of the differences between measurements at times 1 and 2 and the 95%. CI for mean diff, the standard deviation of the differences ( S D d i f f ); 95% LOA, Bland and Altman 95% limits of agreement; SEM, standard error of measurement.
Table 3. Reliability values for time-distance parameters.
Time-Distance ParametersICCICC 95% CIMeanMean DiffMean Diff 95% CI S D d i f f 95% LOASEM
Speed (m/s)0.78(0.08, 0.99)0.82−0.08(−0.21, 0.06)0.16(−0.40, 0.24)0.12
Cycle Time (s)0.86(0.34, 0.97)0.920.04(−0.06, 0.13)0.11(−0.19, 0.26)0.08
Double Limb Support Time (s)0.84(0.01, 0.97)0.20.05(0.01, 0.09)0.05(−0.05, 0.15)0.03
Stride Length (m)0.94(0.65, 0.99)0.74−0.04(−0.08, 0.01)0.05(−0.14, 0.07)0.04
Stride Width (m)0.94(0.73, 0.99)0.120.01(0.00, 0.02)0.02(−0.02, 0.04)0.01
Average0.87 0.06
Left lower Limb
Cycle Time (s)0.84(0.31, 0.97)0.920.06(−0.05, 0.16)0.12(−0.19, 0.30)0.09
Stance Time (s)0.85(0.33, 0.97)0.580.05(−0.03, 0.13)0.10(−0.15, 0.25)0.07
Swing Time(s)0.76(0.00, 0.95)0.350.01(−0.03, 0.04)0.04(−0.07, 0.08)0.03
Step Time (s)0.79(0.00, 0.96)0.450.01(−0.04, 0.06)0.06(−0.11, 0.13)0.04
Step Length (m)0.93(0.63, 0.99)0.380.00(−0.03, 0.03)0.04(−0.08, 0.08)0.03
Stride Length (m)0.93(0.63, 0.99)0.750.00(−0.07, 0.07)0.08(−0.16, 0.16)0.06
Average0.85 0.05
Right lower Limb
Cycle Time (s)0.86(0.30, 0.97)0.930.02(−0.08, 0.12)0.12(−0.21, 0.25)0.08
Stance Time (s)0.87(0.44, 0.97)0.570.04(−0.03, 0.10)0.08(−0.12, 0.19)0.05
Swing Time(s)0.84(0.24, 0.97)0.36−0.02(−0.06, 0.02)0.05(−0.11, 0.08)0.03
Step Time (s)0.79(0.00, 0.96)0.460.00(−0.07, 0.07)0.09(−0.16, 0.17)0.06
Step Length (m)0.64(0.00, 0.93)0.36−0.05(−0.12, 0.02)0.08(−0.21, 0.11)0.06
Stride Length (m)0.64(0.00, 0.93)0.72−0.11(−0.24, 0.03)0.16(−0.42, 0.21)0.11
Average0.73 0.07
Intraclass correlation coefficient, ICC; 95% CI, 95% confidence interval for the ICC; mean, mean of measurements at baseline trial and retest trial; mean diff, mean of the differences between measurements at time 1 and 2 and the 95% CI for mean diff, the standard deviation of the differences ( S D d i f f ); 95% LOA, Bland and Altman 95% limits of agreement; SEM, standard error of measurement.
Table 4. Reliability values for kinematic parameters.
Kinematic ParametersICCICC 95% CIMeanMean DiffMean Diff 95% CI S D d i f f 95% LOASEM
Pelvic joint angle (°)
Left lower Limb
Anterior Tilt +0.40(0.00, 0.88)16.0−0.1(−5.2, 5.0)6.1(−12.24, 12.02)4.3
Posterior Tilt −0.83(0.20, 0.97)10.4−1.2(−5.2, 2.8)4.7(−10.58, 8.19)3.3
Obliquity Up +0.84(0.20, 0.97)2.70.5(−1.7, 2.7)2.6(−4.69, 5.69)1.8
Obliquity Down −0.75(0.00, 0.95)−4.50.2(−1.9, 2.3)2.5(−4.87, 5.28)1.8
External Rotation −0.44(0.00, 0.89)−6.60.2(−6.4, 7.0)8.0(−15.55, 16.10)5.3
Internal Rotation +0.76(0.00, 0.95)13.71.1(−5.0, 7.2)7.3(−13.32, 15.55)5.2
Average0.67 3.6
Right lower Limb
Anterior Tilt +0.51(0.00, 0.91)16.1−0.8(−6.1, 4.3)6.2(−13.15, 11.37)4.4
Posterior Tilt −0.84(0.31, 0.97)10.3−2.2(−6.1, 1.6)4.6(−11.30, 6.82)3.2
Obliquity Up +0.67(0.00, 0.94)3.80.1(−2.2, 2.5)2.8(−5.44, 5.81)2.0
Obliquity Down −0.85(0.31, 0.97)−2.7−0.7(−2.9, 1.3)2.5(−5.78, 4.20)1.8
External Rotation −0.88(0.44, 0.98)−12.0−1.8(−6.2, 2.4)5.2(−12.06, 8.32)3.6
Internal Rotation +0.85(0.21, 0.97)7.5−4.2(−8.7, 0.2)5.4(−14.86, 6.30)3.8
Average0.77 3.1
Hip Joint angle (°)
Left lower Limb
Flexion +0.79(0.00, 0.96)45.0−1.4(−6.2, 3.5)5.8(−12.78, 9.98)4.1
Extension −0.78(0.00, 0.96)1.3−0.7(5.8, 4.3)6.1(−12.72, 11.24)4.3
Abduction −0.60(0.00, 0.92)−10.40.3(−4.2, 4.9)5.5(−10.41, 11.15)3.9
Adduction +0.76(0.00, 0.95)4.80.8(−2.7, 4.4)4.3(−7.62, 9.27)3.0
External Rotation −0.58(0.00, 0.90)−8.94.3(−7.3, 18.0)15.1(−24.37, 35.08)9.7
Internal Rotation +0.67(0.00, 0.92)3.94.9(−4.1, 16.0)12.0(−17.69, 29.66)8.5
Average0.70 5.6
Right lower Limb
Flexion +0.14(0.00, 0.85)45.5−0.9(−9.1, 7.1)9.7(−20.10, 18.11)6.9
Extension −0.82(0.12, 0.96)1.5−1.8(−7.6, 3.9)6.9(−15.46, 11.80)4.9
Abduction −0.75(0.00, 0.95)−9.90.2(−3.5, 4.1)4.6(−8.78, 9.37)3.2
Adduction +0.79(0.00, 0.96)6.9−0.4(−3.9, 3.0)4.1(−8.62, 7.71)2.9
External Rotation −0.67(0.00, 0.93)−10.7−6.1(−16.8, 4.4)12.7(−31.10, 18.77)9.0
Internal Rotation +0.73(0.00, 0.95)1.0−4.0(−14.5, 6.3)12.4(−28.54, 20.40)8.8
Average0.65 5.9
Knee Joint angle (°)
Left lower Limb
Flexion +0.75(0.00, 0.95)70.60.2(−6.5, 7.0)8.1(−15.71, 16.17)5.7
Extension −0.85(0.17, 0.97)8.60.4(−3.6, 4.5)4.9(−9.15, 10.04)3.4
Abduction −0.48(0.00, 0.90)−7.40.5(−5.1, 6.1)6.7(−12.68, 13.74)4.7
Adduction +0.46(0.00, 0.90)5.81.5(−7.7, 10.9)11.2(−20.27, 23.42)6.8
External Rotation −0.75(0.00, 0.95)−8.4−0.6(−7.9, 6.6)8.7(−17.73, 16.45)6.1
Internal Rotation +0.62(0.00, 0.92)4.73.0(−5.0, 11.0)9.7(−15.91, 21.94)6.8
Average0.65 5.6
Right lower Limb
Flexion +0.86(0.25, 0.97)68.5−0.1(−8.3, 8.0)9.8(−19.38, 19.13)5.9
Extension −0.98(0.88, 0.99)6.41.5(−0.6, 3.6)2.5(−3.50, 6.50)1.8
Abduction −0.37(0.00, 0.88)−6.9−2.0(−10.2, 6.1)9.8(−21.31, 17.13)6.9
Adduction +0.33(0.00, 0.87)4.7−3.8(−14.2, 6.6)12.4(−28.21, 20.54)8.7
External Rotation −0.76(0.00, 0.95)−7.53.5(−4.9, 12.1)10.2(−16.43, 23.61)7.2
Internal Rotation +0.00(0.00, 0.69)5.40.8(−11.4, 13.0)14.6(−27.87, 29.49)9.3
Average0.55 6.6
Ankle Joint angle (°)
Left lower Limb
Dorsiflexion +0.46(0.00, 0.90)9.83.3(−9.0, 15.7)14.8(−25.69, 32.37)10.4
Plantar Flexion −0.27(0.00, 0.86)−11.12.6(−10.5, 15.7)15.7(−28.22, 33.48)11.1
Eversion −0.60(0.00, 0.91)1.22.4(−2.0, 7.0)5.4(−8.13, 13.11)3.8
Inversion +0.75(0.00, 0.94)13.01.6(−3.1, 6.3)5.6(−9.44, 12.68)3.9
Foot Internal Progression +0.95(0.75, 0.99)3.8−0.4(−4.1, 3.1)4.4(−9.13, 8.14)3.1
Foot External Progression −0.87(0.34, 0.97)−14.31.4(−7.5, 10.3)10.6(−19.40, 22.29)6.5
Average0.65 6.5
Right lower Limb
Dorsiflexion +0.40(0.00, 0.82)7.72.3(−12.5, 17.1)17.7(−32.48, 37.14)12.6
Plantar Flexion −0.00(0.00, 0.81)−13.54.5(12.8, 21.9)20.7(−36.15, 45.23)14.6
Eversion −0.43(0.00, 0.76)1.10.0(−5.7, 5.7)6.9(−13.48, 13.52)4.8
Inversion +0.00(0.00, 0.80)14.10.0(−3.9, 3.8)4.6(−9.11, 8.99)3.2
Foot Internal Progression +0.95(0.78, 0.99)−11.7−3.1(−9.0, 2.7)7.0(−16.97, 10.67)4.9
Foot External Progression −0.94(0.72, 0.99)29.3−4.6(−13.9, 4.6)11.0(−26.37, 17.05)6.8
Average0.45 7.8
Intraclass correlation coefficient, ICC; 95% CI, 95% confidence interval for the ICC; mean, mean of measurements at baseline trial and retest trial; Mean Diff, mean of the differences between measurements at time 1 and 2 and the 95% CI for mean diff, the standard deviation of the differences ( S D d i f f ); 95% LOA, Bland and Altman 95% limits of agreement; SEM, standard error of measurement.
Table 5. Reliability values for kinetic parameters.
Kinetic ParametersICCICC 95% CIMeanMean DiffMean Diff 95% CI S D d i f f 95% LOASEM
Hip Joint Moment (N m/Kg)
Left lower Limb
Flexion −0.95(0.76, 0.99)−0.46−0.02(−0.11, 0.06)0.10(−0.22, 0.17)0.07
Extension +0.67(0.00, 0.94)0.500.02(−0.12, 0.16)0.17(−0.31, 0.34)0.12
Abduction +0.79(0.00, 0.96)0.430.01(−0.08, 0.10)0.11(−0.20, 0.22)0.08
Adduction −0.00(0.00, 0.75)−0.21−0.05(−0.28, 0.18)0.28(−0.60, 0.50)0.20
Average0.61 0.12
Right lower Limb
Flexion −0.84(0.11, 0.97)−0.370.01(−0.12, 0.13)0.15(−0.29, 0.30)0.11
Extension +0.40(0.00, 0.86)0.470.08(−0.13, 0.30)0.26(−0.43, 0.59)0.18
Abduction +0.73(0.00, 0.95)0.480.00(−0.13, 0.12)0.15(−0.29, 0.29)0.11
Adduction −0.79(0.16, 0.96)−0.12−0.04(−0.11, 0.02)0.08(−0.20, 0.11)0.06
Average0.69 0.12
Knee Joint Moment (N m/Kg)
Left lower Limb
Flexion −0.69(0.00, 0.94)−0.270.03(−0.04, 0.11)0.09(−0.15, 0.21)0.07
Extension +0.79(0.00, 0.96)0.41−0.02(−0.19, 0.15)0.21(−0.42, 0.38)0.15
Valgus +0.72(0.00, 0.95)0.170.01(−0.09, 0.11)0.12(−0.23, 0.25)0.09
Varus −0.76(0.00, 0.95)−0.160.06(0.00, 0.12)0.07(−0.07, 0.20)0.05
Average0.74 0.09
Right lower Limb
Flexion −0.49(0.00, 0.90)−0.260.13(−0.06, 0.32)0.23(−0.32, 0.58)0.16
Extension +0.92(0.63, 0.98)0.31−0.06(−0.19, 0.07)0.16(−0.36, 0.24)0.11
Valgus +0.00(0.00, 0.78)0.27−0.13(−0.39, 0.13)0.31(−0.74, 0.48)0.22
Varus −0.61(0.00, 0.92)−0.14−0.04(−0.12, 0.03)0.09(−0.23, 0.14)0.07
Average0.51 0.14
Ankle Joint Moment (N m/Kg)
Left lower Limb
Dorsiflexion −0.72(0.00, 0.95)−0.020.01(−0.01, 0.04)0.03(−0.05, 0.08)0.02
Plantar Flexion +0.93(0.61, 0.99)0.850.00(−0.12, 0.11)0.14(−0.27, 0.26)0.10
Eversion +0.57(0.00, 0.92)0.070.02(−0.05, 0.08)0.08(−0.14, 0.17)0.06
Inversion −0.75(0.00, 0.95)−0.130.02(−0.06, 0.09)0.09(−0.16, 0.19)0.06
Average0.74 0.06
Right lower Limb
Dorsiflexion −0.00(0.00, 0.77)−0.02−0.02(−0.05, 0.02)0.04(−0.10, 0.06)0.03
Plantar Flexion +0.78(0.00, 0.96)0.75−0.01(−0.15, 0.13)0.17(−0.34, 0.32)0.12
Eversion +0.85(0.21, 0.97)0.040.00(−0.03, 0.03)0.04(−0.07, 0.07)0.03
Inversion −0.55(0.00, 0.91)−0.16−0.03(−0.18, 0.13)0.18(−0.39, 0.33)0.13
Average0.55 0.08
Intraclass correlation coefficient, ICC; 95% CI, 95% confidence interval for the ICC; mean, mean of measurements at baseline trial and retest trial; mean diff, mean of the differences between measurements at time 1 and 2 and the 95% CI for mean diff, the standard deviation of the differences ( S D d i f f ); 95% LOA, Bland and Altman 95% limits of agreement; SEM, standard error of measurement.
Publisher’s Note: MDPI stays neutral with regard to jurisdictional claims in published maps and institutional affiliations.

