1. Introduction
Hydrocarbons are the main energy source used to satisfy our energy needs, but during their life cycle, they can produce many environmental impacts. Hydrocarbon leaks/spills, which can occur from its exploitation to use, cause environmental pollution, where, commonly, the first receptor is the soil.
Soil contamination by hydrocarbons can be originated by accidental spills during its transportation and disposal, leakage of storage tanks and pipes, and/or by clandestine fuel intakes. The unsaturated (aerated) zone of the soil, that is, the area in which the infrastructure’s foundations are frequently laid, is the first one to be contaminated by hydrocarbon leaks and/or spills.
It is also possible that hydrocarbons permeate through the soil up to the groundwater level zone, contaminating the saturated zone of soil. Therefore, hydrocarbon leaks and spills can affect the deep foundations located on it as well as it can contaminate groundwater. In this case, the hydrocarbons can be transported by the groundwater to the surrounding areas contaminating the soil and may affect the foundations located in such areas.
The permanence of hydrocarbons in the unsaturated zone depends on different factors, such as the solubility, volatility, toxicity, biodegradation rate, and sorption of the hydrocarbons; the nature and permeability of the soil or soils forming the unsaturated zone; and the natural or man-made liquid flow (water and/or contaminants).
Unfortunately, soil contamination by different hydrocarbons has rapidly expanded worldwide, surpassing, in many cases, the self-purification capacity of soils. As a result, the number of hydrocarbon-contaminated sites has increased in both developed and developing countries, latter being the more affected ones.
Soil is the most frequent source of risk to construction projects [
1] due to not only the geotechnical or geological aspects but also the contaminants present in it. Nevertheless, there is still limited available information about the impact of hydrocarbons contamination on the geotechnical properties of the soils. Some of the risks associated with soil contamination are loss of foundation and structural integrity, damage to construction materials, and loss of facility [
1]. Independent from the time the soil gets polluted—before or after the infrastructure construction—the changes caused in its engineering properties can place both the integrity of the structures and its users at risk.
It is known that soil contamination by hydrocarbons affects its engineering properties. However, such an effect depends on many variables, such as the type of soil and the physical and chemical properties of the spilled/leaked hydrocarbon [
2,
3,
4].
Published papers have been focused on the effect of diesel contamination on the geotechnical properties of soil by varying the contaminant concentration from 0% to 20% (weight basis) [
5,
6,
7,
8,
9]. However, none of them has been focused on the quantity of diesel that soil is capable to retain. This can have important repercussions since the exceeding hydrocarbons can be subjected to evaporation or transportation depending on the type of hydrocarbon and the local environmental conditions. Nevertheless, the retained hydrocarbons can have a major influence on the geotechnical behavior of the contaminated soil.
Izdebska-Mucha and Trzcinski [
10] reported that after contaminating a clay sample with diesel, clay particles showed a change in their microstructure, resulting in a denser structure due to change in the pore size distribution. Ijimdiya [
4] studied the effects of used motor oil on the properties of lateritic soil and found a reduction in the amount of fine-grained size particles of the soil as the concentration of the contaminant was increased from 0% to 8%.
Son et al. [
11] estimated the effect of diesel contamination on the electrical properties of unsaturated soils. These authors reported that contaminated soils with a water content of 5% had higher electrical resistivities and decreased permittivity compared to uncontaminated soils. In contrast, contaminated soils having a water content of 15% showed smaller resistivities and higher permittivity compared to non-contaminated soils.
It has been reported that soil contamination affects its consistency limits. Salimnezhad et al. [
12] reported that the plastic limit of a crude-oil-contaminated soil increased as the contaminant concentration increased, but the plastic index decreased as the contaminant concentration increased. Yazdi and Teshnizi [
7] found that the liquid limit of a gasoline-contaminated soil increased, reaching maximum value at a contaminant concentration of 6%. Although a further increase of gasoline concentration reduced the liquid limit of the soil, it was higher than the one obtained for the natural soil.
Salimnezhad et al. [
12] reported that swelling pressure of natural soil was higher than that of contaminated soil. However, for 12% oil content, the contaminated soil had a higher free swell percentage than the natural soil.
Other researchers have studied the effects of diesel [
5], oil [
13], gasoline [
6], and crude oil [
12] on the shear resistance of different clay soils, finding that soils’ cohesions tended to decrease as the contaminant concentration increased. However, while in some cases, the internal friction angle was reported to increase as the contaminant concentration increased [
5,
6], in other cases, a reduction of its value was reported as the contaminant concentration increased [
7,
12,
13]. These results may mean that clay minerals exhibit different behaviors according to the hydrocarbon used to contaminate the soil.
Yazdi and Teshnizi [
7] showed that the settlement and ductility of a gasoline-contaminated soil increased as the contaminant concentration increased. They also found that the soil failure mechanisms changed depending on the contaminant concentration in the soil.
Taheri et al. [
9] studied the effects of soil contamination in a soil that was simultaneously contaminated with lead and diesel. These authors found that the increase in diesel concentration reduced the hydraulic conductivity of the contaminated soil. Such decrease was because diesel occupied the pore spaces and limited the water flow through the soil samples.
Salimnezhad et al. [
12] found that the settlement of the contaminated soil increased as the crude oil concentration increased because the contaminant reduced the specific surface area of the soil, decreasing the water absorption of the particles of the soil facilitating the water drainage.
Although many efforts had been carried out to study the effects of diesel contamination on the geotechnical properties of soils, most of the studies had focused on saturated soil conditions. As a result, the available information about the effect of diesel contamination on unsaturated soils is scarce. Moreover, to the widest knowledge of the authors, there is no available information about the maximum diesel retention that natural soil can have and its effect on the geotechnical behavior of the soil.
Thus, the objective of this study was to determine the maximum diesel retention by an unsaturated clayey soil, and to evaluate the impact of diesel contamination on its geotechnical properties. The test performed in both natural and contaminated soil conditions showed that although the soil could not retain more diesel, its saturation rate did not exceed 80%. Furthermore, the changes in the geotechnical properties of the contaminated soil promoted an increase in its shear strength resistance. Such difference was due to an increase in the osmotic suction in the contaminated soil.
2. Materials and Methods
2.1. Experimental Procedure
The experiment was performed in two phases: natural soil characterization and soil contamination and characterization. In the first phase, the extraction of disturbed natural (uncontaminated) soil samples from a place in the north of Querétaro City, Mexico, was done. An undisturbed cubic soil sample was extracted to evaluate the natural soil’s water content and volumetric unit weight. All soil samples were stored in a controlled temperature chamber (20 ± 1 °C) until its use for geotechnical characterization.
All the disturbed soil samples were mixed into the controlled temperature chamber to obtain a uniform mass of soil to perform the remaining geotechnical tests. This soil mass was divided into subsamples, poured into hermetically sealed containers, and stored in the same chamber. The soil sample quantity that is required for each test could now be taken with ease, avoiding opening and manipulating the whole soil sample every time a quantity of soil was needed for analysis.
The tests were performed according to the methods described in the Test Methods section. The unit weight of the natural soil was 15.10 kN/m3 ± 0.10 kN/m3, and its water content was 36.94% ± 0.19%; this corresponded to an average saturation rate of 70.82% ± 0.18%. After finished the natural soil characterization, the soil contamination process was started.
In the second phase of this work, the remaining soil sample was contaminated with diesel for its geotechnical characterization.
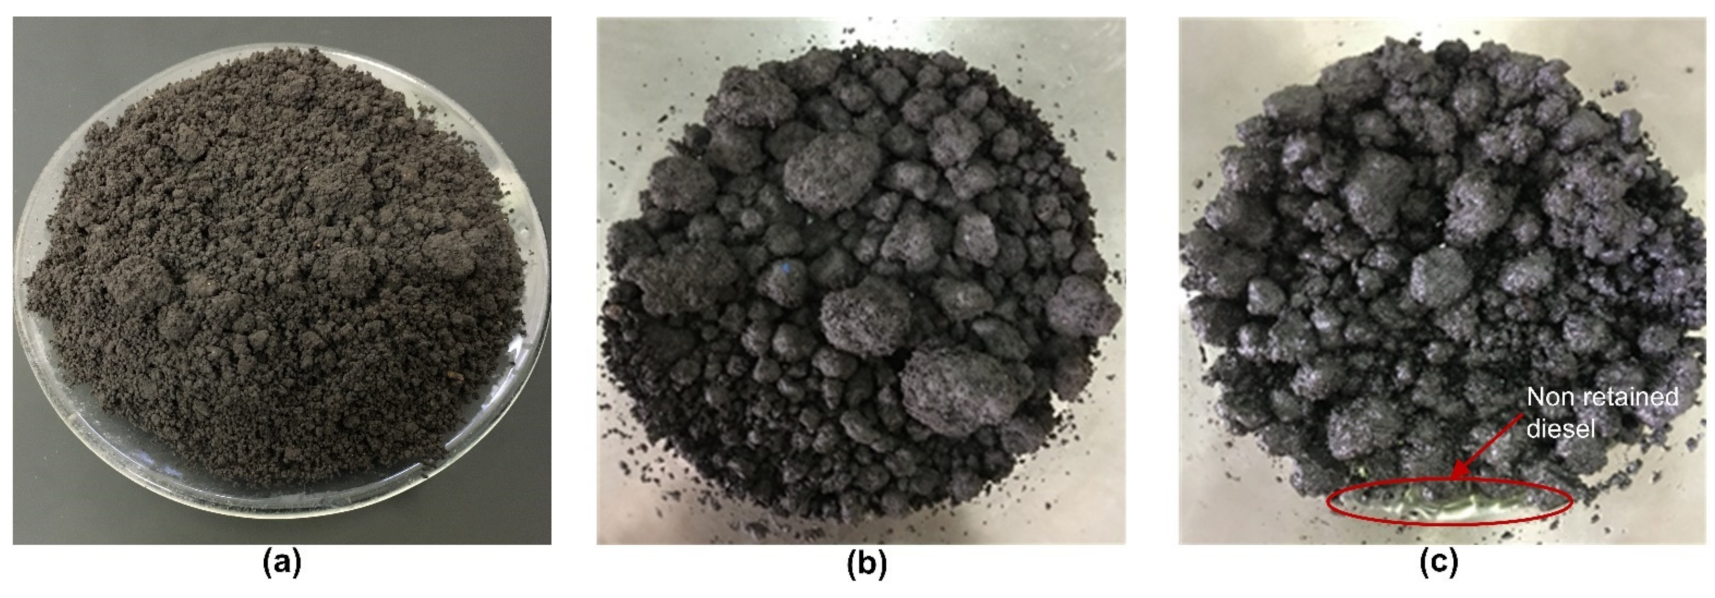
Table 1 shows the characteristics of the commercially available diesel used to contaminate the soil. To define the quantity of diesel needed for soil contamination, a 50-g natural soil sample was placed in a sealed glass container. Then, this soil subsample was contaminated with diesel, at an initial concentration of 4% by weight, and stored for seven days in the temperature-controlled room.
During this curing period, the contaminant could distribute throughout the soil and react with the pore fluid to achieve ionic stability [
2]. After the curing period, the sample was visually inspected to verify if the soil could retain the added diesel. This process was repeated by increasing the diesel concentration (i.e., 4%, 8%, 12%, and 14%) until the soil could not retain more diesel.
When the soil could not retain more diesel, it was transferred to a smaller glass container to allow the soil to drain the exceeding contaminant. Then, a contaminated soil subsample was taken from the top of the container to determine the retained diesel concentration by a gravimetric method [
15]. The retained diesel concentration was 12.62% ± 0.27%. Therefore, such a concentration of diesel was used to contaminate the natural soil to be used during this second phase.
Once the diesel concentration to contaminate the soil was defined, the following procedure was applied. First, the remaining natural soil was air-dried to reduce its water content. This was done because in the previous experiment, a considerable increase in the liquids content of the contaminated soil was noticed (see
Section 3.1). Then, the soil was placed in a container to mix it manually with diesel to simulate the long-term contamination effect [
16].
Next, the contaminated soil was poured into hermetically sealed containers and stored in the temperature-controlled room for six weeks. After this curing period, the contaminated soil was tested as indicated in the Test Methods section.
The selected contamination procedure is an alternative way to reduce the sample preparation time [
16]. It also allows the contaminant to bring about a long-term change in the initial soil structure [
16]. Although a curing time of seven days is enough to allow the soil to react with the contaminant [
2], the curing period was extended to six weeks to enhance the long-term contamination effect.
2.2. Test Methods
The evaluated properties of the soil are summarized in
Table 2 and were executed as indicated in the corresponding standards. The “water content” of the contaminated soil was obtained by applying the same standard used for the natural soil. However, the term “water content” was transformed to “liquids content” to consider the difference in specific gravity between diesel and water [
17].
To determine the modified free swell index (MFSI) for both soil conditions, 10 g of oven-dried (105 ± 1 °C) soil passing a No. 40 (425 µm) sieve were poured into a 100-mL graduated cylinder filled with distilled water. The soil was manually mixed with the distilled water and left undisturbed for the soil to swell/settle and achieve an equilibrium state of volume. The MFSI was calculated as the ratio of the equilibrium sediment volume to the dry weight of the oven-dried soil.
The liquid limit was evaluated by the fall cone method as indicated in the standard procedure adopted. Distilled water was gradually added to the soil—both natural and contaminated—to obtain a semiliquid consistency. The soil and the added water were thoroughly mixed until a homogeneous mass was obtained. This mass was poured into a sealed container. It was stored in the controlled-temperature chamber for 24 h to allow the added water to permeate through the soil before the cone penetrometer tested the sample. For both soil conditions, the liquid limit was evaluated by considering the equivalent water content of the samples.
The direct shear test was executed in a 100 mm × 100 mm shear box at a shear velocity of 1 mm/min. Normal stresses applied were 50, 100, and 200 kPa. Matric and total suction of the soils were evaluated by the filter paper method, using the calibration curves for wetting the filter paper, Whatman No. 42.
The pH and the electrical conductivity (EC) of the soils were measured with a pH/EC/DO/ISE multiparameter (Orion Versa Star Pro, Thermo Scientific, Waltham, MA, USA) with automatic temperature compensator, equipped with a glass electrode for pH measurements and an EC sensor. Before each natural and contaminated soil sample set’s pH measurement, the equipment was calibrated with the traceable to the National Institute for Standards and Technology (NIST) buffer solutions of pH 4, pH 7, and pH 10 obtained from Thermo Fisher. The equipment calibration was repeated until a correlation coefficient of the calibration curve of the multiparameter was at least of 0.98. For the EC measurements the equipment was calibrated with the traceable to NIST standard solutions of 100 µS/cm and 1413 µS/cm obtained from Thermo Fisher (Austin, TX, USA).
2.2.1. Chemical Elements Analysis of the Soil
The elemental chemical characterization of soils was performed with a total reflection X-ray fluorescence spectroscope (S2 PICOFOX TXRF, Bruker Nano), equipped with a molybdenum tube and silicon drift detector. The S2 PICOFOX is a portable benchtop spectrometer for multi-element analysis of liquids, suspensions, and solids.
Before analysis of the samples, a gain correction was performed with a mono-element standard sample (1 µg As). Further, the spectroscopic resolution (1 µg Mn) and sensibility analysis (1 ng Ni) of the spectroscope were performed according to the manufacturer instructions.
The standard solutions of H3AsO4 (1000 mg/L); SiO2 (10,000 mg/L), Ni(NO3)2 (1000 mg/L); Fe(NO3)3 (1000 mg/L); Al(NO3)3 (10,000 mg/L); Ca(NO3)2 (10,000 mg/L), NaNO3 (10,000 mg/L), KNO3 (10,000 mg/L), (NH4)2TiF6 (1000 mg/L), Mg(NO3)2 (10,000 mg/L), Mn(NO3)2 (10,000 mg/L), and Zn(NO3)2 (10,000 mg/L) were obtained from Merck, with a quality for Inductively Coupled Plasma (ICP) test, traceable to the Standard Reference Material (SRM) from NIST. The necessary dilutions have been made from the stock solutions in order to achieve the linearity of the standard curve.
The soil samples for elemental analysis were prepared as follows: 20 mg of soil was ground in an agate mortar and then passed through a No. 230 (63 μm) sieve. Then, the powder was suspended in 1 mL of dispersant solution (1% Triton X-100 in distilled water). The soil suspension was spiked with 10 μL of gallium (1000 mg/L, ICP standard traceable to SRM from NIST, Sigma Aldrich, St. Louis, MO, USA) as internal standard.
The suspension was then sonicated for 15 min, after which it was homogenized in a vortex agitator. Then, 10 μL of a sample solution was transferred into a siliconized quartz glass sample carrier and dried at 50 °C on a hot plate. The prepared soil samples were analyzed with a live collection time of 1000 s. Spectra acquisition and data evaluation were done by using the software Spectra 7.8 (Bruker Nano GmbH, Berlin, Germany).
2.2.2. Cation Exchange Capacity of the Soil
The cation exchange capacity (CEC) of the soil was evaluated according to the Mexican standard NOM-021-RECNAT-2000 [
21], using ammonium acetate (1N, pH 7, American Chemical Society grade, Meyer) as a saturating solution to replace the absorbed cations (Ca
2+, Mg
2+, Na
+, and K
+). Firstly, the soil was air-dried and sieved through the No. 10 (2 mm) sieve. Then, the exchange complex was saturated with the ammonium cation. After that, the ammonium cation was removed with a sodium chloride (NaCl, American Chemical Society grade, Merck) solution and the total capacity change was determined (Kjendahl method). The detection limit for the total CEC was 3.86 cmol
+/kg.
2.2.3. Soil Mineralogy
Soil samples were powdered in an agate mortar and sieved through a No. 200 sieve. The powders were characterized by X-ray diffraction (XRD Rigaku, MiniFlex) with Cu-Kα radiation (
= 1.5406 Å). Diffraction intensity, in function of
, was analyzed at the interval from 2° to 80°, with a
step size of 0.02°, and a counting time of 0.06 s per point. Interplanar spaces (
) were evaluated by the Bragg’s law equation:
where
is the class of diffraction peak (
1 for the first-order basal reflection),
is the Cu-Kα wavelength of the incident X-ray wave, and
is the diffraction angle.
3. Results and Discussion
3.1. Diesel Retention in the Contaminated Soil
At 4% diesel concentration, the natural soil readily absorbed the contaminant (
Figure 1b). In contrast, at 14% diesel concentration, the soil could not retain the contaminant at all (
Figure 1c). After analyzing the contaminated soil, it was found that the soil retained only 12.62% ± 0.27% of diesel.
Clay fractions of soil can adsorb non-polar molecules—such as diesel—due to the van der Waals attraction forces [
30]. Such attraction forces between particles rapidly decay with the surface-to-surface distance (varying inversely as the seventh power of distance between the plates). However, attractive forces are additive. So, van der Waals attraction forces can be calculated by adding the attractions among all the particles. This may result in a higher total force and a lower decay (varying inversely as the third power of distance between the plates) with the surface-to-surface distance [
30].
Nonetheless, Anandarajah and Chen [
31] found that van der Waals attraction forces get reduced when fluid other than water fills the medium between the attracted particles. Further, Chiou and Shoup [
32] showed that organic compounds that are not potent wetting agents have lower sorption capacity on polar mineral surfaces [
32]. Hence, this makes water a stronger opponent to displace non-ionic organic solutes from minerals in aqueous systems.
In the absence of water, clay particles can behave as conventional organic compound absorbers, its large surface area being the main contributor to its high absorptive capacity [
33]. However, in the presence of water, the absorption of non-polar hydrocarbons can be suppressed since non-polar organic molecules are not solid competitors for adsorption sites on the clay surface compared to highly polar water [
30].
Thus, in the present study, since the soil was contaminated at its natural water content, diesel adsorption by the soil minerals was limited to those places where soil absorption sites were available. This means that soil could only retain the required diesel to satisfy its hydration needs.
Diesel is a non-polar mixture of aromatic (including naphthalenes) and saturated (including isoparaffins and cycloparaffins) hydrocarbons obtained from petroleum. Diesel hydrocarbons have carbon numbers in the range of C9–C28 with high boiling points between 170 and 430 °C. As previously stated, the term “water content” was transformed to “liquids content” to consider the difference in specific gravity between diesel and water [
17]. Thus, Equation (2) was used to consider the contribution of the liquid’s specific gravity on the liquids content of the soil [
17].
where
is the equivalent water content,
corresponds to the liquid content,
is the water to diesel volume ratio in the pore’s liquid, and
is the specific gravity of diesel. It must be mentioned that in Equation (2), for water that has not been mixed with any contaminant,
0.
Table 3 presents the impact on the
and the saturation rate (
) of the soil due to its contamination. Diesel contamination increased the
and the
of the contaminated soil by 18% and 12%, respectively, compared to the natural soil. Such an increase in both parameters influences the engineering behavior of the contaminated soil. It can even make it complicated to directly compare the results obtained by both soil conditions.
Hence, we decided to air-dry the natural soil before its contamination and then add the diesel to achieve a concentration of 12.62%. Hence, the contaminated soil used for its characterization had a liquids content ( 34.39 ± 0.22%), equivalent water content ( 35.13 ± 0.22%), and saturation rate ( 71.28 ± 0.21%) closer to the same factors observed in the natural soil.
3.2. Influence of Diesel Contamination on the Soil’s pH
Soil contamination with diesel had a significant impact on its pH. After soil contamination, the pH of the soil changed from moderately alkaline (pH
natural = 7.95 ± 0.14) to neutral (pH
contaminated = 6.98 ± 0.03). Nevertheless, this pH drop does not represent a limitation for biodegradation processes, since the pH for the biotransformation of the contaminant has been found to be in the range of 6 to 8 [
34]. This tendency to decrease the pH as the soil gets contaminated agrees with the results obtained by Taheri et al. [
9].
The pH reduction of soil after its contamination was due to the acidifying effect of the sulfur contained in diesel. It is known that the addition of elemental sulfur (
) to soil affects the oxidation rate and produces two hydrogen ions due to the microbial activity of soil (Equation (3)). Since pH is a measure of the hydrogen ion concentration (
) in soil solution, the increase in concentration resulted in a lower pH.
Momeni et al. [
35] studied the effect of acid and alkaline waters on the geotechnical properties of clay soil and found that the decrease of the pH value of the soil increased the liquid limit and the plastic index of the soil. Moreover, they indicated that the coefficient of permeability of the soil increased as the pH values of the soil shifted from the neutral condition to the acidic or alkaline conditions [
35].
3.3. Influence of Diesel Contamination on the Soil’s Texture
Diesel contamination of natural soil caused a change in its texture classification from silty clay to silty loam. This change, from a fine texture to a ridged one after soil contamination, was due to the agglomeration of soil particles as a response to soil acidification and the reduction of the dielectric constant of the pore fluid.
A decrease in pH promoted the exchange of calcium ions by hydrogen ions, which resulted in clay particle agglomeration/flocculation due to its surface charge alteration [
36]. Furthermore, partial replacement of water contained in the pores of soil by the contaminant changed the dielectric constant value of the pore fluid. Hence, the attractive forces prevailed over repulsive ones, resulting in soil agglomeration/flocculation [
37].
The van der Waals attraction force developed between two parallel plates can be calculated as shown in Equations (4) and (5), while the repulsion force can be obtained as indicated in Equations (6) and (7) [
37].
where
is the distance between plates and
is the Hamaker constant obtained as follows [
37]:
where
is the Boltzmann constant,
is the absolute temperature,
denotes the dielectric constant of the medium,
is the constant of Planck,
corresponds to the main electronic adsorption frequency in ultraviolet light, and
is the reflective index of the medium in visible light.
where
is a constant that depends on the valence of the ions and the ionic concentration and
can be obtained as follows [
37]:
with
and
being constants that depend on the ionic concentration.
It can be appreciated from Equations (4) and (6) that both attractive and repulsive forces depend on the dielectric constant value of the pore fluid. However, the variation of the dielectric constant value of the pore fluid has a higher effect over the repulsive forces [
37]. Thus, a decrease on the value of the dielectric constant of the pore fluid reduced both attractive and repulsive forces, but the decrease in repulsive forces was bigger than the decrease in the attractive forces. Hence, attractive forces prevail over repulsive ones (the net effect was attractive) and gave as result the agglomeration of the soil particles.
3.4. Effect of Diesel Contamination on the Specific Gravity of Soil
The specific gravity of natural soil was reduced from 2.72 ± 0.02 to 2.60 ± 0.02 after soil contamination with diesel. The partial substitution of water (in the contaminated soil) explains this significant change (p < 0.01) since diesel has a density and specific gravity lower than water.
3.5. Impact of Diesel Contamination on the Soil’s Particle Size Distribution
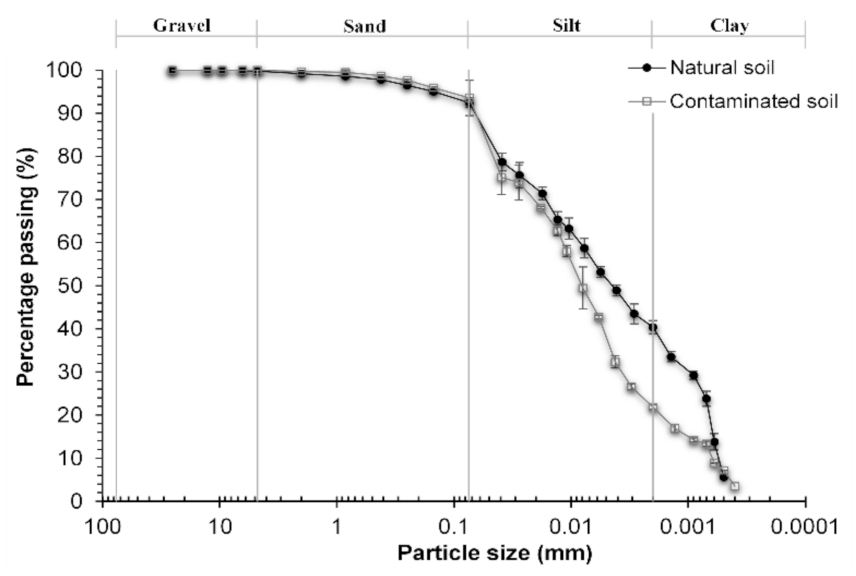
Grains’ size content of both soils is presented in
Table 4, and their granulometric curves are shown in
Figure 2. Both natural and diesel contaminated soils corresponded to a fine-grained soil. After diesel soil contamination, a significative (
p < 0.01) change in fine-grained particles sizes’ content was observed. The silt-like sized granules increased by 37% while the clay-like sized granules decreased by 46%. This change was due to both the reduction of the dielectric constant and the acidification of the pore fluid of the soil, which caused that the clay-like sized particles agglomerated and increased their size reaching a silt-like size.
Lambe and Withman [
38] indicated that the reduction of the dielectric constant and/or pH drop, as well as ion valence reduction and/or electrolyte concentration decrease, promotes soil flocculation. In low pH environments, the thickness of the double layer around clay particles can decrease [
39]. The diffuse double layer theory indicates that the thickness of the double layer (
) can be calculated as indicated in Equation (8):
where
corresponds to the dielectric constant of the pore fluid,
is the Boltzman constant,
is the absolute temperature,
is the valence of the cations,
is the electric charge, and
is the concentration in number of ions per milliliter.
When the soil was contaminated with diesel (), it interacted with the water () contained in the pores of the soil and reduced the dielectric constant of the pore fluid. As a result, the thickness of the double layer was reduced and the soil particles began to join together due to the influence of the van der Waals forces. As the soil particles got closer to each other, the effect of the van der Waals attractive forces increased. This promoted the agglomeration of clay particles by forming flocs, which was appreciated as an increment in the silt-like size fraction content, with a correspondent decrement in the clay-like size fraction.
3.6. Influence of Diesel Contamination on the Consistency Limits
Table 5 provides the plastic characteristics of the soils. According to their Atterberg limits, both the natural and the contaminated soils are considered as very high and expansive ones. Despite the variations of the values of the Atterberg limits, both the natural and the contaminated soils were classified as silts of high compressibility. The natural soil was considered as a normal active clay, while contaminated soil was considered as a very active one. This increase in the activity of contaminated soil, in comparison with its activity at uncontaminated condition, was attributed to the physical and chemical effect of diesel on clay particles.
After soil contamination, its liquid and plastic limits increased by 9% and 4%, respectively. It is known that the liquid behavior of soils is influenced by free water, which is not absorbed by the particles of soil and can freely move through soil pores. When diesel was added to the natural soil, it covered the surfaces of the clay particles, making the contact between the free water and the clay particles more difficult.
Since diesel is a non-polar liquid, it could not allow that the water added during the test, which created a link with clay surface, to provide the required condition for clay to flow. When water was added to the contaminated soil to evaluate its Atterberg limits, it gradually displaced the diesel adhered to clay surface, allowing the interaction between clay and water. Thus, more water was needed in the contaminated soil to achieve its plastic state and, thus, higher plasticity was obtained.
3.7. Effect of Diesel Contamination on the Modified Free Swell Index of the Soil
The MFSI test classified the natural soil as a high-swelling potential clay (2.33 ± 0.47 cm
3/g). However, this index classified contaminated soil as a very high-swelling potential soil (3.79 ± 0.77 cm
3/g). This finding agrees with those reported by Salimnezhad et al. [
12], who observed an increase in the free swelling of oil-contaminated clayey soil as the contaminant concentration increased from 4% to 12%.
At low pH levels, acids attack the original minerals contained in soil and produce a modification in both the silica and alumina content, reducing the Si/Al ratio as well as the calcium content (see
Table 6). Hence, the chemical composition of the soil changed when the pH of the pore fluid diminished, and due to the reduction of the calcium content there was an increase in its swell capacity.
3.8. Consequence of Diesel Contamination on the Shear Strength of the Soil
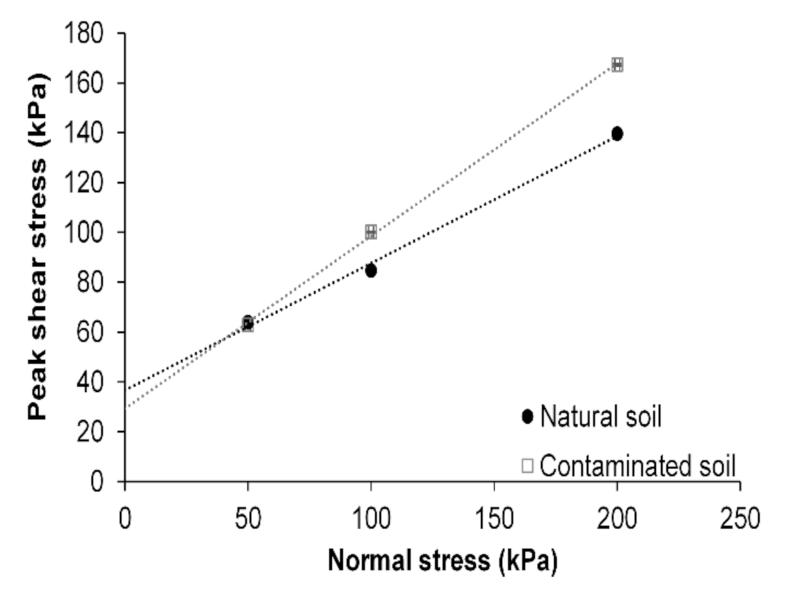
Figure 3 shows the changes in shear stress resistance of both natural and contaminated soils. Cohesion and internal friction angle were obtained from the failure envelop plotted for each soil condition. The cohesion of the contaminated soil decreased by 20% (from 36.7 ± 0.2 kPa to 29.2 ± 0.1 kPa), and its internal friction angle increased by 30% (from 26.9° ± 0.2° to 34.8° ± 0.1°) after soil contamination.
The cohesion of soil depends on the material type as well as the intermolecular bonds between clay particles and the absorbed water. As the natural soil particles got coated by diesel, clay particles agglomerated, formed silt-like size grains, and reduced the clay-like size grains content in the contaminated soil. Although both soils had nearly the same equivalent water content ( 36.94% ± 0.19% vs. 35.13% ± 0.22%) and saturation degree ( 70.82 ± 0.18 vs. 71.28% ± 0.21%), the chemical characteristics of the diesel and soil water content reduction contributed to the decrease in the contaminated soil’s cohesion.
The reduction of the soil’s cohesion has been reported by other authors [
5,
12,
13]. They attributed this decrease to reducing the specific surface area (SSA) of soil particles due to hydrocarbon deposition over the soil grains. The reduction of the SSA decreased the CEC of the soil and reduced the contact between the soil particles and water molecules [
5,
12,
13]. Therefore, the cohesion of the soils was reduced since soil particles absorbed a lower quantity of water.
The agglomeration effect of diesel over the soil particles increased the friction angle of the contaminated soil. Thus, it can be inferred that under normal stresses between 100 and 200 kPa, contaminated soil will exhibit a higher shear resistance than natural soil. The quality of the soil is not only defined by its shear strength but also by its consolidation behavior.
So, before considering that the contaminated soil quality was enhanced due to its higher shear strength, it is necessary to consider its permeability and compressibility changes. As has already been reported, diesel deposition over soil particles reduced the soil’s hydraulic conductivity [
9] and SSA [
12,
13]. Hence, higher settlements may be observed compared to the ones obtained for the natural soil [
7,
12]. Furthermore, the slope stability of the trenches located over contaminated soils must be verified because of the decrease in its cohesion.
Peak shear stresses were plotted for each soil condition (
Figure 3). For a normal stress of 50 kPa, natural and contaminated soils showed almost the same shear strength. However, for the 100 and 200 kPa normal stresses, the shear strength of contaminated soil was increased by 18% and 20%, respectively. According to Fredlund et al. [
40], the shear strength of unsaturated soils (
) can be evaluated in terms of two stress state variables, as shown in Equation (9):
The first two terms of Equation (9) correspond to the Mohr–Coulomb criterion, is the effective cohesion, denotes the net normal stress, is the pore air pressure, and is the angle of frictional resistance related with normal stress. The third term of Equation (9) introduces an additional friction angle () relative to matric suction () contribution to shear strength resistance, where corresponds to the pore water pressure.
Total soil suction (
) considers the effect of the matric suction (
) and osmotic or solute suction (
), as expressed in Equation (10). Matric suction was defined as the difference between
and
, and is related to capillary effects. Osmotic suction arises from the presence of dissolved salts or solutes in the soil pore fluid.
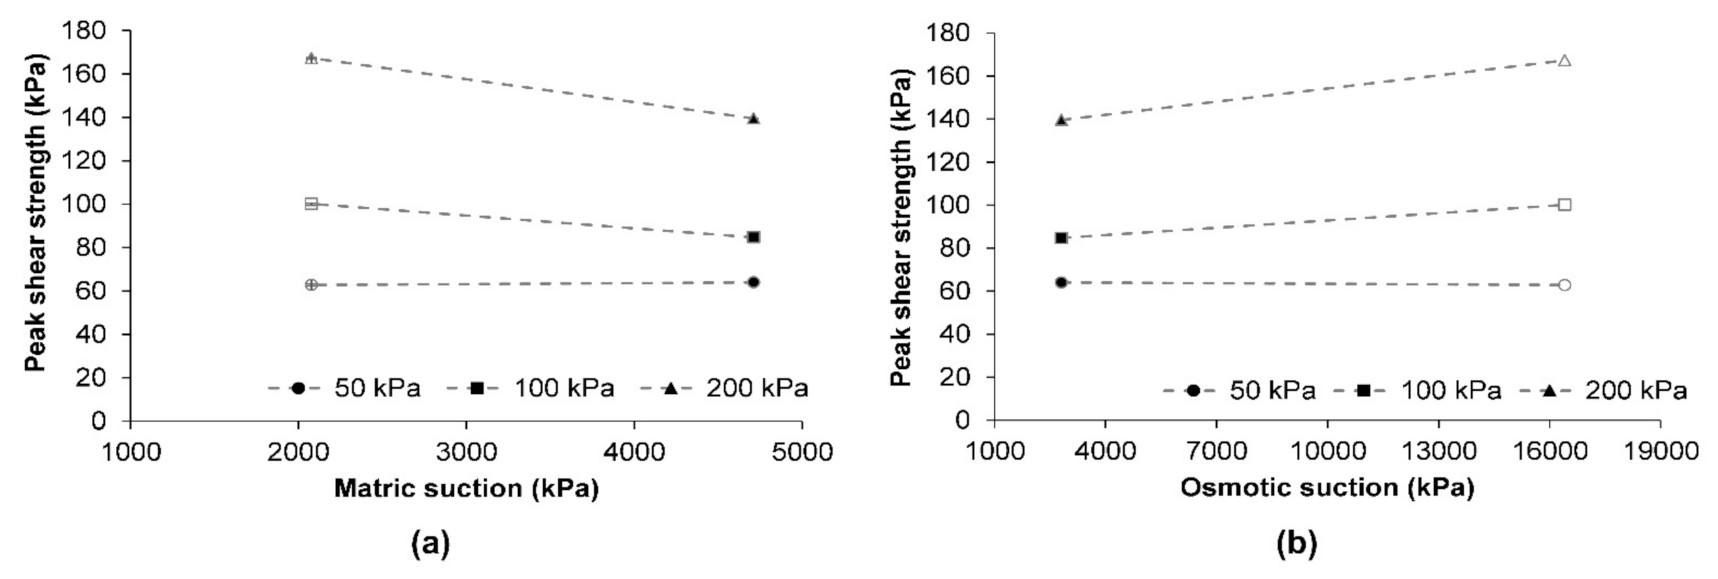
The natural soil had a
of 4709 ± 1 kPa, while the contaminated soil had a
of 2077 ± 12 kPa. As the contaminated soil had a considerably lower matric suction than the natural soil, a decrease in its shear strength could be expected. This is because the tension force developed by the air–water interface or contractile skin on soil particles decreases as the matric suction decreases [
41]. In contrast, an increase in shear strength of soil was observed after its contamination.
The
of natural and contaminated soils were 7521 ± 1 kPa and 18,484 ± 13 kPa, respectively. From Equation (5), the
can be obtained as the difference between
and
. As shown in
Figure 4a, the
had a higher effect on the shear strength of natural soil, while the
had a major role in the shear strength of the contaminated soil (
Figure 4b).
It is known that
influences the shear stress behavior of the unsaturated soils. However, in geotechnical engineering applications, the
component is more frequently considered than the contribution of
[
41]. Nevertheless, in the case of contaminated soils, the impact of
on the shear strength of soil must be considered [
42].
Therefore, as proposed by [
42], and considering
as an independent stress-state variable, Equation (11) could be modified as:
where
corresponds to the fiction angle relative to osmotic suction contribution to shear strength resistance.
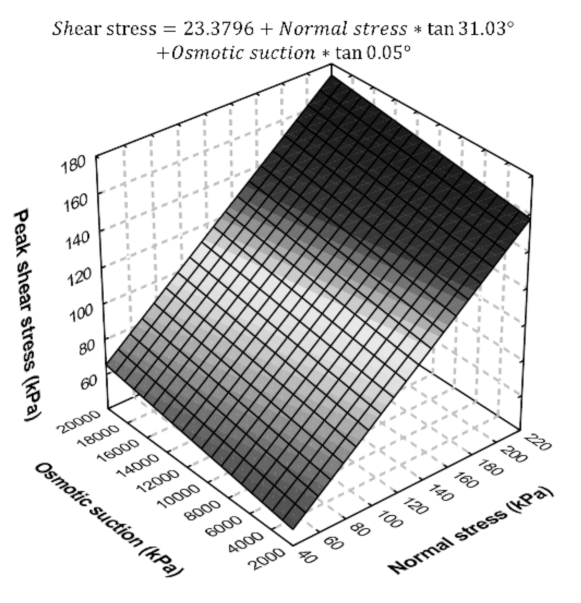
Figure 5 shows the strength envelop, considering
as an independent stress-state variable, as well as the equation for shear strength behavior of the contaminated soil, according to the results obtained in this research, as a function of both normal stress and osmotic suction.
3.9. Effect of Diesel Contamination on the Soil’s Mineralogy
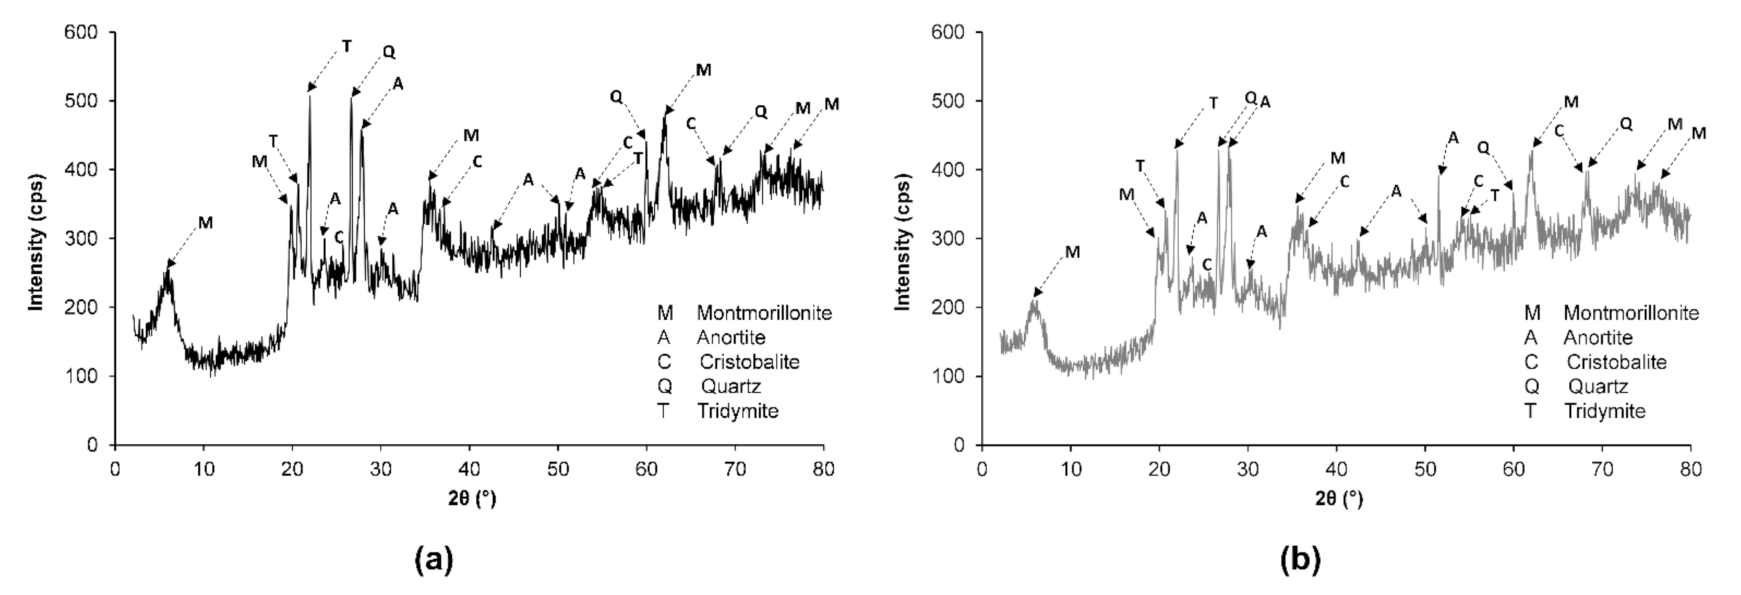
Figure 6 shows the X-ray diffractograms of both the natural and the contaminated soil. Both soil samples showed the presence of montmorillonite clay mineral [PDF 00-013-0135: montmorillonite-15A: Ca
0.2(Al,Mg)
2Si
4O
10(OH)
2·4H
2O] and anorthite [PDF 00-018-1202: anorthite, sodian, intermediate: (Ca,Na)(Si,Al)
4O
8]. Montmorillonite belongs to the smectite group and is formed by two Si-based tetrahedral sheets. Anorthite is a plagioclase feldspar mineral that occurs in some igneous and metamorphic rocks.
The presence of quartz, cristobalite, and tridymite was also observed. Silica or silicon dioxide (SiO2) can exhibit both crystalline (quartz, tridymite, and cristobalite) and amorphous forms. Cristobalite and tridymite are silica mineral quartz polymorphs that exhibit the same chemical formula but have different crystal structures.
In most cases, cristobalite is the first crystallization product of the amorphous SiO
2 at high temperatures. In tridymite, the silica tetrahedra are packed in a two-layer structure, while in cristobalite, the silica tetrahedra are packed in a three-layer structure [
43]. Cristobalite and tridymite have a more open structure than quartz, which allows the inclusion of other elements into its crystal structure [
43].
A change was observed in the reflective angle of the montmorillonite in diesel-contaminated soil (
5.70°) in comparison with natural soil (
5.88°). This shift to the left of montmorillonite peak caused an increase in the lattice spacing of the montmorillonite mineral [
44]. It implies that montmorillonite may undergo a swelling effect of the internal layer, from d
001 = 15.018 Å (for natural soil) to d
001 = 15.492 Å (for diesel-contaminated soil), due to its diesel contamination.
Soil contamination also decreased the peak area of the montmorillonite minerals, which was due to a reduction in the column length of the reflective minerals. This indicated a decrease in the montmorillonite minerals’ concentration [
44].
Although the peaks of quartz, cristobalite, and tridymite minerals did not show a shift in their reflective angle, their intensities were reduced after soil contamination. This was due to a coating effect on the mineral surface, caused by the peripheral adsorption of diesel on these minerals [
44]. Such an effect resulted in an apparent decrease in the concentration of mineral crystals, since they were not able to reflect the incident X-rays as the natural soil could.
3.10. Impact of Diesel Contamination on the Chemical Elements of the Soil
The results of the analysis of the chemical elements of both natural and contaminated soils are presented in
Table 6. For both soil conditions, the major elements detected were Si, Fe, Al, Ca, Na, and K, while minor elements were Mg, Mn, and Zn. In nature, inorganic exchange ions (e.g., Ca
2+ and Na
+) frequently balance the clays’ net negative charge [
33]. Further, in clays, the hydrophilic nature of the mineral surfaces is due to the occurrence of Si–O groups and the hydration of those inorganic exchangeable ions [
33].
Although the concentration of the elements detected varied from natural to contaminated condition, no significant changes were observed (
p > 0.09), except for calcium (
p < 0.01). The statistical analysis of this data set is presented in
Appendix A. The reduction of calcium content after soil contamination was attributed to a chemical reaction with any of the diesel constituents; for example, the sulfur contained in the applied diesel. Due to the calcium concentration decrease in the contaminated soil matrix, both a pH and a cation exchange reduction can be expected [
45].
3.11. Effect of Diesel Contamination on Some Properties Related with Its Possible Remediation
3.11.1. Electrical Conductivity of the Soil
The EC of soil has been used as a parameter related to the level of macronutrients and micronutrients available in the soil [
46]. The EC of the natural soil decreased from 536 ± 86 µS/cm to 420 ± 38 µS/cm after its contamination. Due to this significant decrease (
p < 0.03), it is possible that the available nutrients for both microorganisms and plants may be unbalanced, and an addition of external nutrients may be needed for soil bioremediation. The observed EC reduction has been previously reported [
9], and it was attributed to the low dielectric constant of the diesel which reduced the dielectric constant of the soil’s pore fluid [
9].
3.11.2. Organic Matter Content in the Soil
The organic matter content of natural soil increased from 5.7% ± 0.5% to 11.6% ± 0.2% after its contamination. This increment was related to the presence of diesel in soil—no other sources of organic matter were added. Due to the organic nature of diesel, it is possible to infer that organic carbon concentration in contaminated soil also increased. Thus, the C:N:P ratio of contaminated soil has to be verified because if it is not in a suitable range, the efficiency of the available bioremediation and phytoremediation techniques may be reduced.
3.11.3. Soil’s Cation Exchange Capacity
Soil’s CEC is one of the factors that influence its pH buffer capacity. After soil contamination, its CEC was reduced by 50% in comparison with its CEC at its natural condition (from 75.94 to 38.41 cmol
+/kg). This indicates a drop in the pH buffering capacity of the contaminated soil that is reflected in its acidification because the higher the CEC capacity, the higher the pH buffering capacity [
46].
Kaya and Fang [
37] suggested that the decrease of the CEC was associated to the reduction of the dielectric constant of the pores’ fluid, because the number of the exchangeable cations diminished when the dielectric constant of the pore fluid got reduced.
The CEC reduction indicates that contaminated soil decreased its capacity to retain and release cations, such as Ca
2+, Mg
2+, K
+, and Na
+, by electrostatic forces, in comparison with natural soil. So, a reduction in soil fertility can be expected since Ca
2+, Mg
2+, K
+, Mn
2+, and Fe
2+ are considered as bioavailable metal cation species essential for green plant nutrition and soil microorganisms [
47].
It is known that organic matter has a high CEC. Thus, an increase in the CEC of contaminated soil, due to the increment of its organic matter content, can be expected. However, a decreased CEC in contaminated soil was observed. When diesel was added to the natural soil, cation exchange between diesel and calcium cations (Ca2+), contained in both clay minerals and organic matter, was promoted.
This process released Ca2+ in the soil’s pores’ solution that were used by clay particles to flocculate and, at the same time, to counteract the acidification effect caused by the added H+. Thus, although the organic matter content increased in contaminated soil, it could not increase its CEC.


