1. Introduction
Twitter (
https://Twitter.com/, accessed on 23 June 2021) is also one of the most popular Social Networking Services (SNS). It specializes in information dissemination in the form of short messages. Compared to other forms of SNS, such as Facebook or Pinterest, the information disseminated on Twitter is also characterized by higher anonymity. For example, by utilizing unique features such as “retweets,“ (
Re
Tweet, or RT is a function on Twitter that allows users to highlight that a tweet contains a citation of a tweet posted by another user). By the use of “hash tags”, or local options, such as Japanese
kakusan kibo (“spread the news”), Twitter allows for easier transmission of information to an unspecified number of users, compared to other forms of SNS. The usefulness of such functions has made Twitter an important source of information in daily life, influencing the decision-making processes of many people.
The popularity of Twitter has also made it an effective instrument for tracking social tendencies. Therefore, much research has currently been actively conducted using data obtained from Twitter [
1,
2,
3,
4,
5,
6,
7]. For example, Kuwano et al. [
8] extracted tourist information from Twitter, or Umejima et al. [
7] made an attempt to prevent the spread of false rumors by analyzing the phenomenon of Twitter hoaxes. Moreover, Aramaki et al. used Twitter to predict the spread of influenza [
9]. In addition, Twitter has been considered an effective tool in information transmission during emergencies, such as the Great East Japan Earthquake which occurred on 11 March 2011 [
10]. In a more recent study, Karami et al. [
11] proposed an analytical framework for Twitter Situational Awareness, in which they used text-mining methods, such as sentiment analysis and topic modeling, for disaster preparedness and response.
Furthermore, Twitter has become useful in political activities. For example, lawmakers are using Twitter in public relations activities (
http://www.soumu.go.jp/senkyo/senkyo_s/naruhodo/naruhodo10.html, accessed on 23 June 2021). Moreover, in July 2013, members of the House of Councilors of Japan for the first time in history lifted the ban on the use of Internet in political campaigns [
12]. Thus, Twitter, being a useful tool for gathering information, has become an influential element of social infrastructure. Additionally, Casero–Ripollés et al. [
13] analyzed how geolocation corresponds to political preferences on over 120 million tweets, and showed that the geographical location of users is strongly correlated with the polarity of their political conversations on Twitter, thus confirming the usefulness of Twitter for political information analysis.
With regard to the above, an appropriate selection of information is important, especially when it comes to the gathering of information in times of emergency and making decisions based on such information. Much of the information appearing on Twitter contains private opinions about a variety of topics. This also includes the appearance of various hoax tweets and false rumors unrelated to the general topic and mixed into the main thread. Therefore, a method for extracting only valid and useful tweets from a jumble of information on Twitter becomes essential. It is important to ensure the accuracy and the uniformity of the extracted information.
One of the means to determine the accuracy of information is using the concept of primary and secondary information. Primary information refers to the kind of information that a person directly saw, heard or personally did. Secondary information refers to indirect information, such as re-posting or re-telling what was described by someone else (third party), such as describing friend’s opinions about books, or what someone saw on TV.
Moreover, it has been pointed out by Kobayashi et al. that when making decisions or when evaluating something (books, movies, products), people are always subject to psychological effects caused by external information [
14]. Kahneman and Tversky call this the “cognitive bias”, which hinders the perception of pure facts [
15]. In situations of decision-making on the basis of ambiguous information, the existence of the cognitive bias factor causes the “initial value” (person’s background, or what they experienced previously) to affect their final judgment through the “anchor effect” (taking our background for granted). This causes the person to collect or remember only the information that is convenient for them, or to reinforce prejudicial information, which is also called the “confirmation bias”. The existence of the cognitive bias and related effects influencing the decision-making process of a person becomes a problem in situations of emergency or events of great importance when obtaining accurate and unbiased information is crucial for making appropriate judgments.
In this study, in order to obtain accurate information of high uniformity to perform information triaging [
16,
17,
18], we firstly perform a preliminary study using a sample of tweet logs from the time of the Great East Japan Earthquake. The basic tweet classification rules defined in the preliminary study are further used to classify other tweets by dividing them into representing either primary or secondary information. We also use these rules to analyze tweets from the time of general elections. In the latter, we found out that a third kind of information needs to be recognized. We call it “sesquiary” information, and place it between primary and secondary information. We analyze the tweet logs related to elections in accordance with the new rules, and investigate the effectiveness of the classification rules.
After validating the approach, we propose a system for automatic classification of tweets into primary, sequiary and secondary. To optimize the system, we compare its performance on multiple feature sets and a number of classifiers. Finally, we test the system on completely new data, containing tweets obtained after an eruption of a Japanese volcano Ontake on 27 September 2014.
The outline of this paper is as follows. In
Section 2 we describe the general idea of information triage and how it can be realized on Twitter.
Section 3 presents an initial study into types of information found on Twitter, which becomes the basis for further analysis. We also describe the classification criteria for information triaging on Twitter, developed on the basis of the initial study, and describe the hypothesis regarding the change of information over time. In
Section 6, we present the description of the proposed system for automatic information triaging on Twitter.
Section 4 describes various experiments we performed to validate and test the proposed system. In
Section 5 we present the analysis and classification results for the analyzed tweet logs, confirm the proposed hypothesis, and describe further improvement of classification criteria. Finally, we conclude the paper in
Section 8.
2. Information Triage on Twitter
When using tools such as Twitter in the support of decision-making or determination of the present situation, appropriate selection of information becomes a crucial issue. This is especially difficult on Twitter, where topics of the tweets users search and the tweets unrelated to the searched topic often get intermixed. Thus, quick extraction of valid data according to its importance and urgency from the large amount of miscellaneous data becomes an important task.
The task of classification of information according to its importance and urgency is called information triage [
17,
18]. In cases when a mission or a task cannot be fully completed due to the limitations in time and resources, information triage becomes an important task, helping determine the priority of information according to certain criteria.
In information triaging, it is important to ensure the accuracy and the uniformity of information. In determination of the accuracy of the information, it is useful to apply the concepts of the primary information and secondary information. The primary information refers to the kind of information a user has directly seen or heard. The secondary information refers to a second-hand report of what someone said, or what was written in a book or a newspaper or appeared on television or on the Internet. In general, it is indirect information obtained through other sources.
When determining the uniformity of information, it is useful to consider the impact of cognitive bias. The existence of cognitive bias has been pointed out by Kahneman and Tversky [
15] as a factor impairing the cognition of information based on facts. Cognitive bias consists of the “anchor effect” (when making decisions based on ambiguous information the initial value affects the decision-making process) and “confirmation bias” (when an observation is based on preconceptions of an individual, and they collect only the information convenient to themselves, thereby reinforcing self-preconceptions).
Automatic classification and dynamic switching through the above two types of information (primary and secondary) could help effectively provide information needed by users at the moment, which could be helpful in emergency situations such as disasters.
In previous research [
19], we performed the analysis of primary and secondary information on Twitter and provided additional definition and classification criteria for sesquiary information (“sesquiary" meaning “1.5", or “neither primary nor secondary"). In this research, based on the concept of information triage, we constructed an automatic classification method for tweets containing information of high uniformity and accuracy, by providing a set of classification criteria for different types of information. Furthermore, in previous research we developed a hypothesis that in the occurrence of emergency situations such as earthquakes, a different kind of information is required right after the emergency and after some time has passed from the occurrence of the emergency situation.
3. Preliminary Study: Types of Information Found on Twitter
3.1. Analysis of Tweets from the Great Earthquake
In this section, we perform the study of tweets from the time of the Great East Japan Earthquake and describe the results of classification of those tweets.
We used the data provided by Twitter Japan in the Big Data Project (
https://sites.google.com/site/prj311/, accessed on 23 June 2021). The tweets represent a time period of one week from 11 March to 17 March 2011, from the time of the Great East Japan Earthquake.
After omitting 151 tweets from before the earthquake, we randomly extracted 6000 tweets and analyzed them manually by six project members (expert annotators, each annotator analyzed 100 tweets). The manual analysis revealed that many of the tweets were actually retweets or contained other second-hand information. This led us to divide the information into primary information and secondary information.
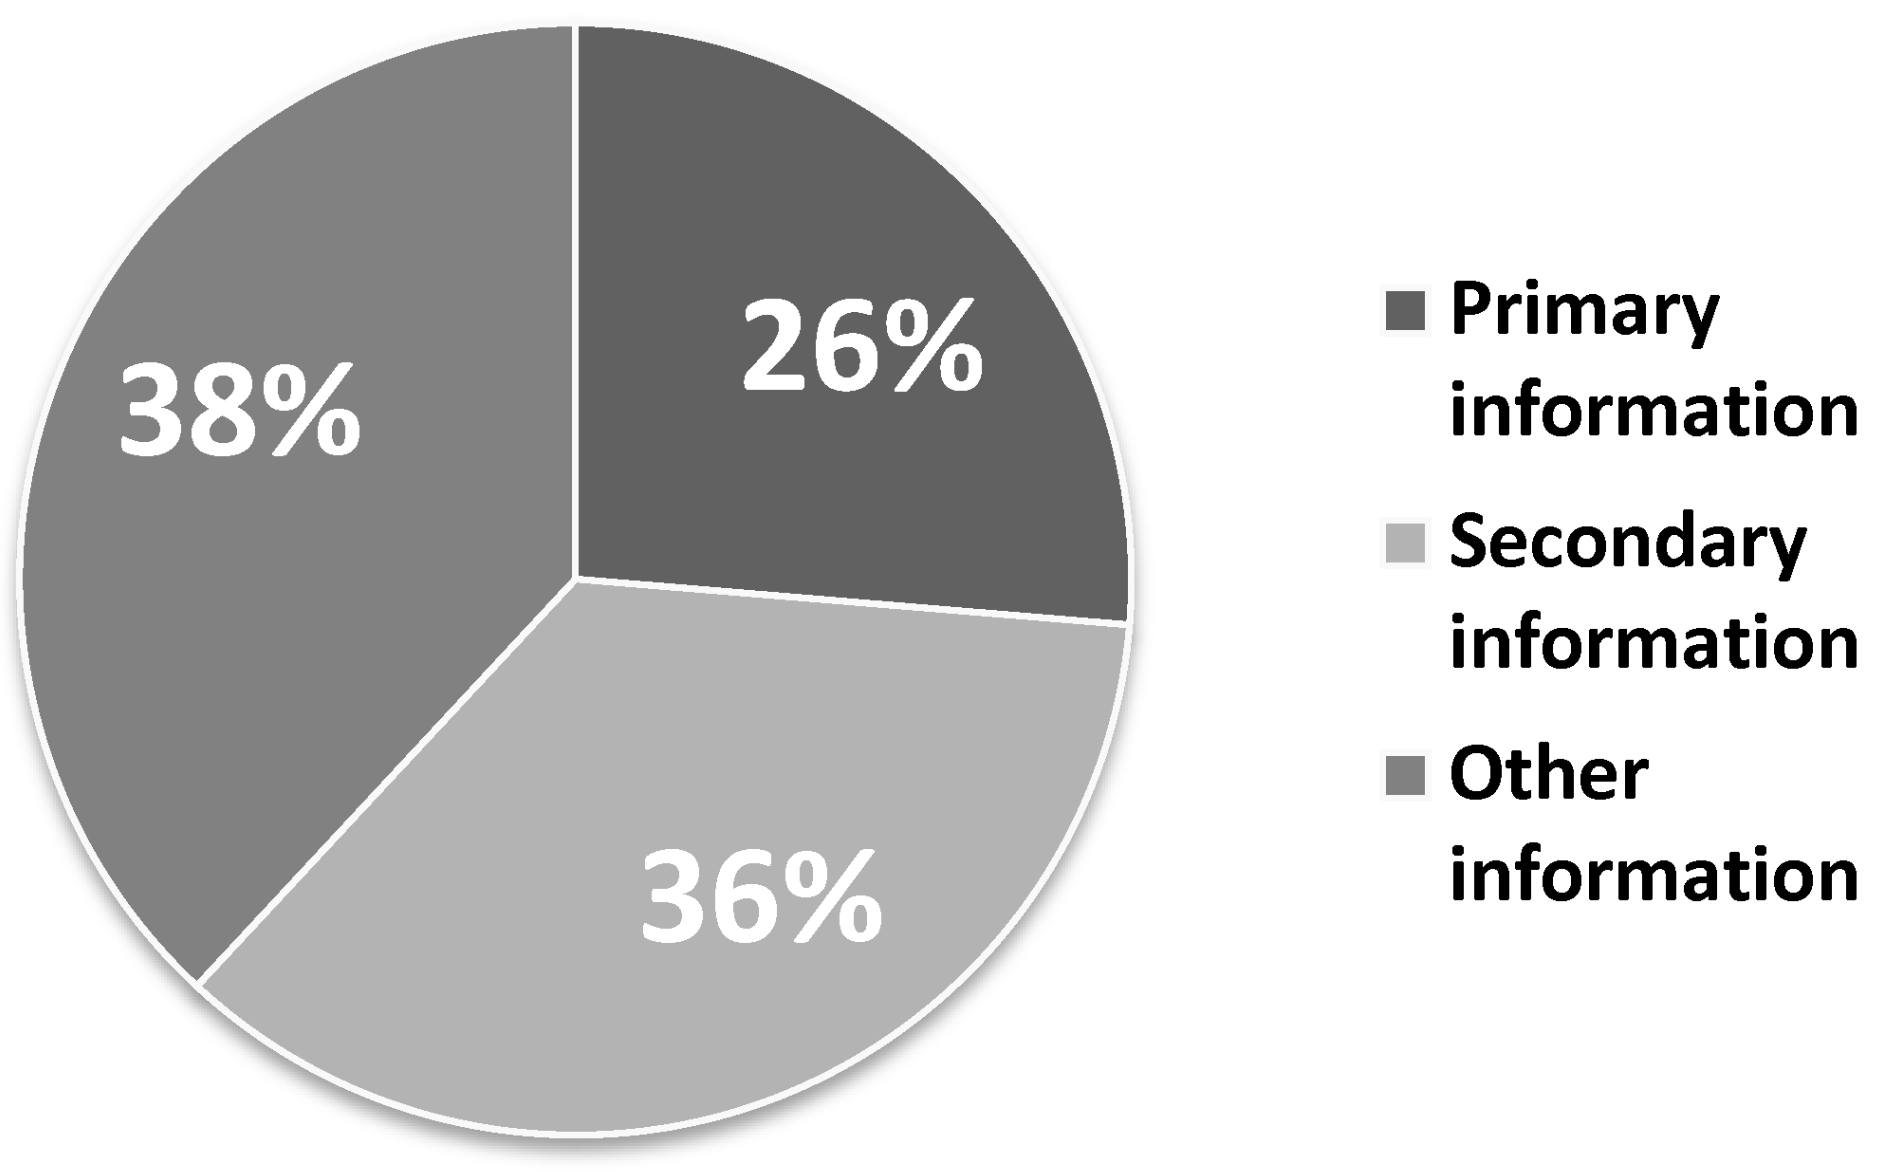
Primary information refers to the kind of information that a person directly saw, heard or personally did. Secondary information refers to indirect information, such as re-posting or re-telling what was described by someone else, or describing a friend’s opinion about books, or what someone saw on TV. It is indirect information described on the Internet by the third party.
The primary information was represented by 1539 tweets (26%), secondary information was represented by 2083 tweets (36%), and other kinds of information not coming under the definition of either primary or secondary information was represented by 2227 tweets (38%) (
Figure 1). Examples of each type of information were represented in
Table 1.
Primary information was represented by tweets in which users directly describe their own state, such as samui (“I’m cold”) or tsurai (“It’s so hard...”). There were many tweets of this kind. In such tweets, the speaker refers to themselves using first-person expressions, such aswatashi (“I” [general]), or boku (“I”, or “me” [masculine]). Apart from this, a frequent expression appearing in primary information tweets was nau (“now”). Additionally, an expression indicating that the user is describing their own present state was the use of a rhetorical figure called taigen-dome (ending a sentence with a noun or noun phrase often used in Japanese poems, such as “shining stars” instead of “stars are shining”).
Compared to primary information, there was a larger amount of secondary information. However, much of this information was directed outside of the affected areas. Apart from that, there were numerous retweets containing information about the lifeline between the outside areas and the areas affected by the disaster, or in-tweet citations such as ...to no koto (“it is said that/they say that...”), or ...rashii (“apparently...”).
Definition of Rules for Detection of Primary and Secondary Information
Based on the classification results of the tweet logs of the Great East Japan Earthquake, we defined the rules (a set of criteria) for the classification of this kind of content.
In tweets like these, posted during the times requiring urgent decision-making, what is important is the accuracy of the information. If one wants to focus on the accuracy information, it is useful to classify the content into primary and secondary information.
Primary information refers to the kind of information that a person directly saw, heard or personally did. Secondary information refers to indirect information, such as re-posting or re-telling what was described by someone else (third party), or describing friend’s opinions about books, or what someone saw on TV.
The detailed criteria for classification of primary information are represented in
Table 2. The detailed criteria for classification of secondary information are represented in
Table 3.
3.2. Analysis of Election Tweets
Next, we analyzed two types of elections taking place in different periods of time. Firstly, we analyzed tweets about Lower House elections (elections to the House of Representatives). Based on the analysis of those tweets, we redefined the classification criteria. Next, we performed additional analysis of tweets about Upper House elections (elections to the House of Councilors).
Lower House Election Tweets
In order to classify the tweets about the general elections, we used a service site called Hashtag Cloud (
http://hashtagcloud.net/ (accessed on 23 June 2014, domain closed) at present, the site’s functionalities are incorporated in Twitter). This site provides all tweets saved from a week back, grouped by hashtags. Therefore, we started the search by looking for a hashtag “#GeneralElections” and downloading all tweets containing this hashtag. We began the downloading process on 3 December 2012 (the day of public announcement of the elections) and started collecting the tweets day by day.
In the analysis, we used only the tweets which appeared between 3 to 4 December 2012. There were 1503 tweets. The tweets obtained by using the “#GeneralElections” hashtag were longer in number of characters than the length of usual tweets (
http://teapipin.blog10.fc2.com/blog-entry-294.html, accessed on 23 June 2021) (approximately 30 characters longer). They also contained more decisive and conclusive expressions. Moreover, compared to 23% of the average ratio of replies (
http://b.hatena.ne.jp/entry/www.tommyjp.com/2010/10/7123rt6.html, accessed on 23 June 2021), the number of replies to election-related tweets was very low, only 5%.
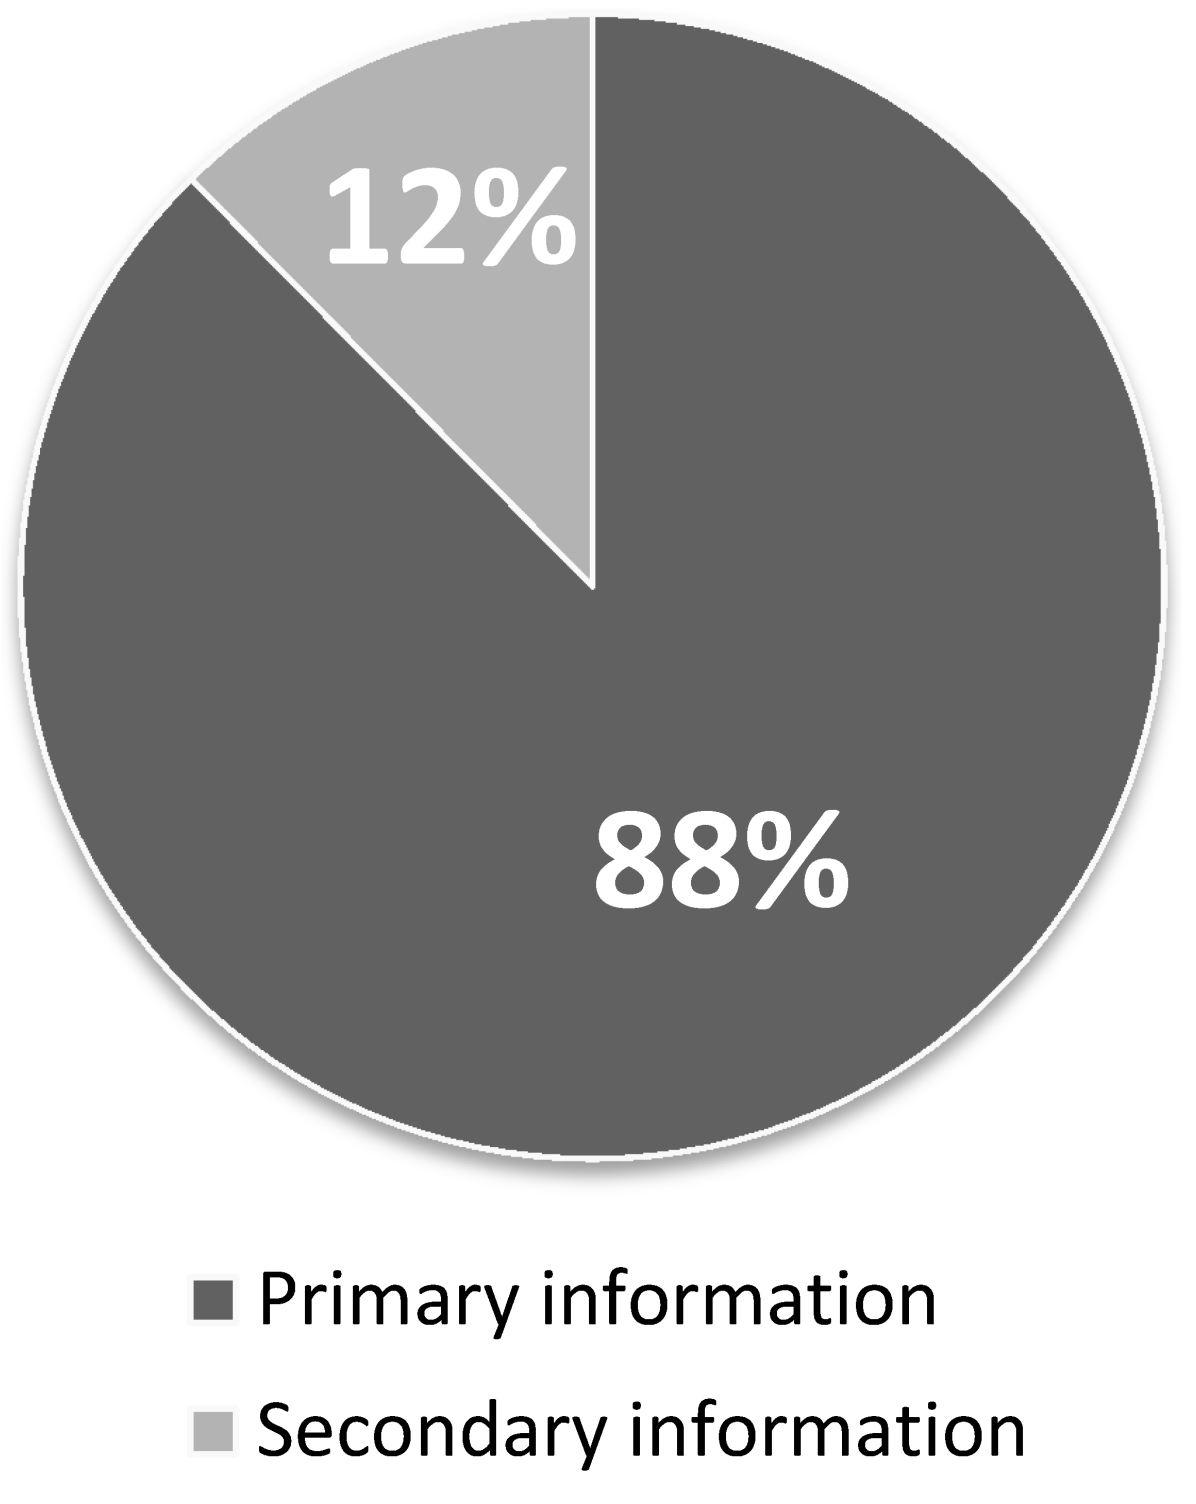
Among all 1503 tweets, the primary information was represented by 88% (1317) of the tweets, and the secondary information by merely 12% (186) of the tweets (see
Figure 2)
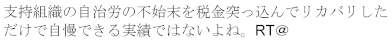
In addition, out of 82 unofficial retweets, 57 were classified as primary information, and out of 64 tweets containing the annotation “#RT”, 52 was classified as primary information. In unofficial RT, there were many comments supporting the tweets introducing political parties, and personal opinions about tweets regarding amendments to the constitution. In “#RT” there were also people who put a link to the site supporting the election.
In secondary information, there were official RT which copied the poster of the elections, and tweets containing phrases like “They say that there is an election campaign speech at...”. Moreover, out of a total number of 1503 tweets, 997 contained some kind of URL information, and information about candidates which could be influential on the choice of a candidate. For example, there were 197 tweets containing links to a list of election candidates divided by each district. This kind of information is often included in primary information tweets and often contains positive or negative opinions about political parties.
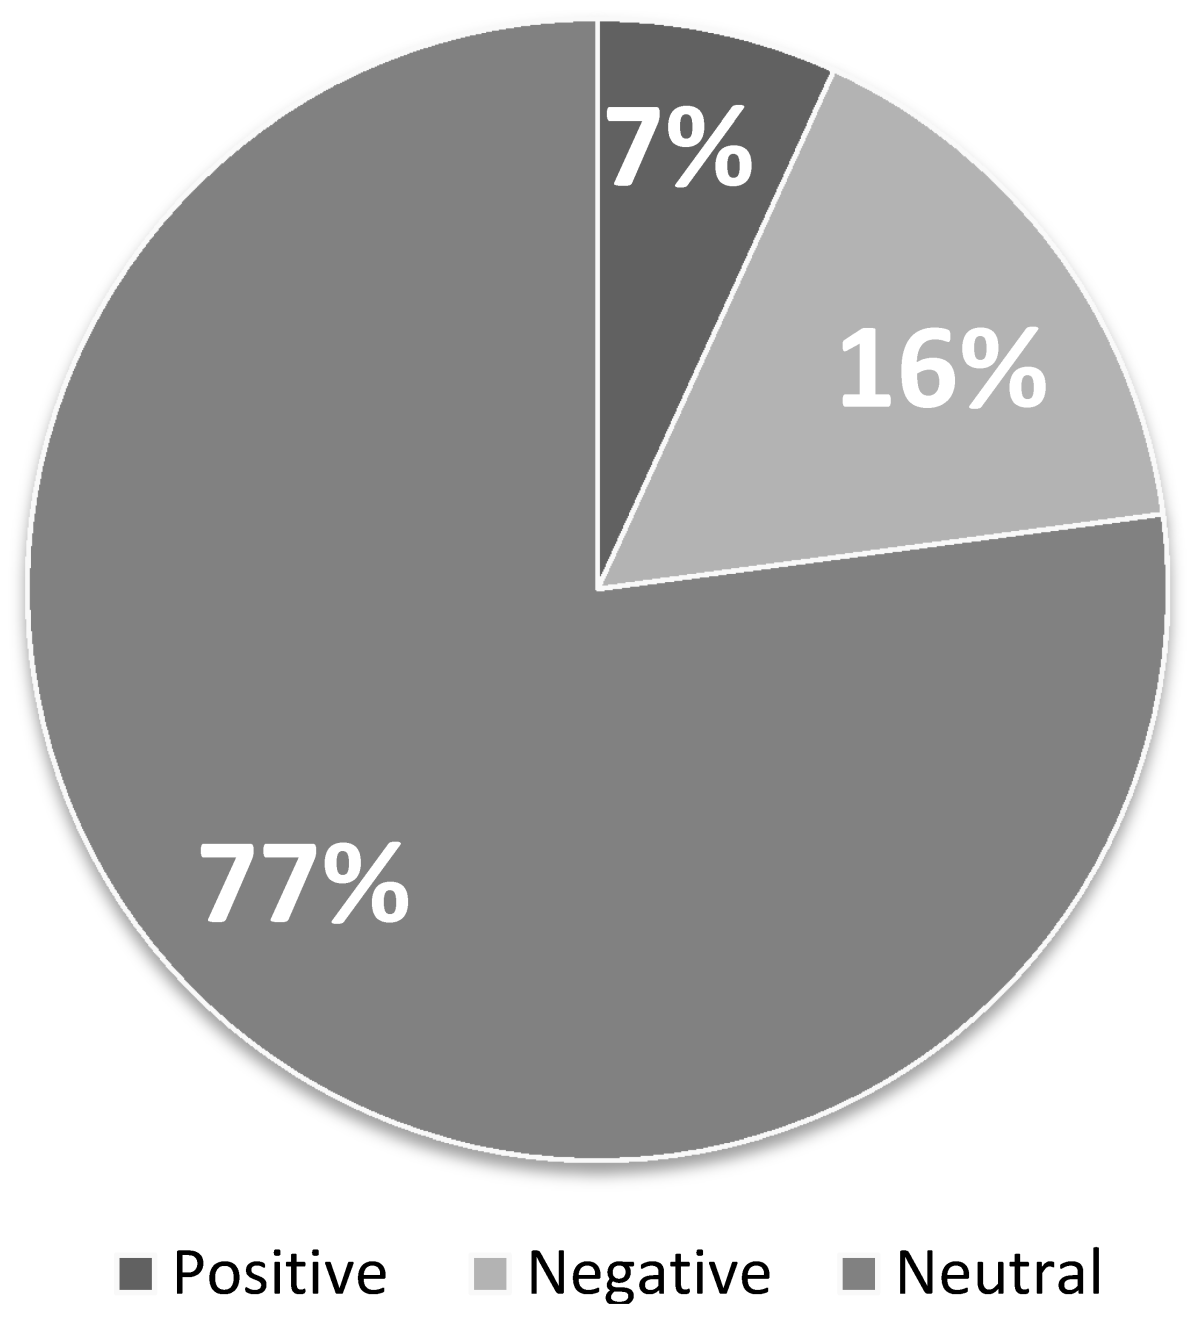
Next, from the total of 1317 primary information tweets, we randomly extracted 1000 and classified them into three categories: positive, negative, or neutral. Objective opinions were considered as neutral. For the results of the classification, out of 1000 tweets, there were 68 (7%) positive tweets, 771 (77%) neutral tweets, and 161 (16%) negative tweets (see
Figure 3).
In positive tweets, there were many direct positive expressions about particular political parties, such as, “I support the party of...!”. In negative tweets, there were many expressions, such as, “I will never vote for the party of...”. There was also a great deal of neutral tweets which contained lists of candidates for each city district.
Primary, Secondary and “Sesquiary” Information.
Based on the analysis results of tweet logs from both the Great East Japan Earthquake and the general election tweet logs, we redefined our classification criteria.
It was not possible to apply to the general election tweets the classification criteria from the Great East Japan Earthquake alone, due to the fact that in tweets about the general elections, different information is often considered as important. In the disaster tweets, the factual information was the most important. In the election tweets, users often wrote about their political preferences; thus, it was also important to take into consideration information from the borderline of pure fact and rumor, such as opinions, or emotional attitudes. This kind of information in the Earthquake tweets is mostly considered as noise. However, in election tweets, private opinions and emotional comments could become useful as a reference. Therefore, it is important to distinguish this kind of information from the rest and annotate it separately.
To do this, we have defined a third kind of information which is neither primary nor secondary, though keeping a structure of its own, namely, “sesquiary” (“sesqui-” = 1.5) information (see
Table 4).
Many tweets represent mixed information. In order to solve this conflict, we applied the following heuristic rules.
- (1)
If a tweet contains different kinds of information, priority is given to the kind of lower density;
- (2)
In cases of only sesquiary and secondary information appearing in a tweet, priority is given to secondary information.
3.3. Additional Analysis
Having redefined the original rules, we performed additional analysis of the Great Earthquake tweets and the Lower House Election tweets. Moreover, we performed additional analysis on completely new data containing tweets from the time of Upper House Elections.
3.3.1. Great Earthquake Tweets
Except the tweets we used as the data for classification, we randomly selected another 600 tweets. These data, unlike the data that were collected by limiting the topic to specific keywords, such as ”#GeneralElections” and so forth, were gathered from all tweets that appeared after the earthquake. Therefore, the average string length of a tweet and the number of replies was close to the general average.
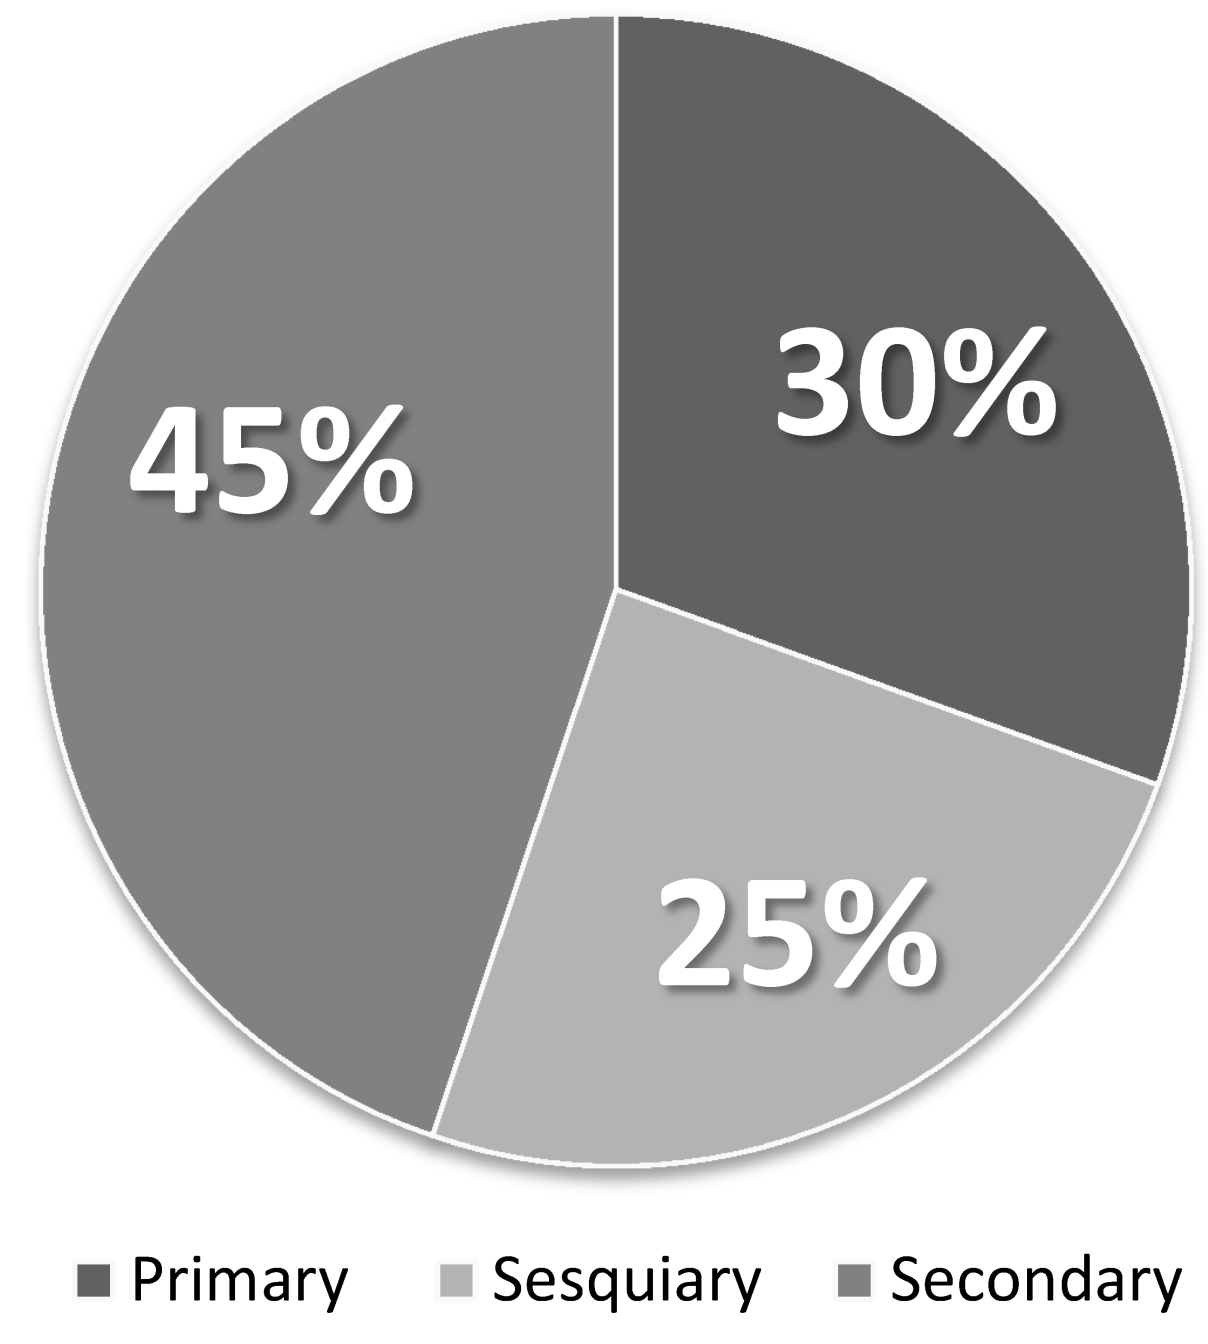
When categorized according to the original definitions, the data contained 30% of primary information (183 tweets), 25% of secondary information (148 tweets), and 45% of other (269 tweets). See
Figure 4 for details. The tweets that stood out consisted of incomprehensible entries, such as “@—
njgo”, or contained single words, such as
Yahoo-bokin (“Yahoo donations”).
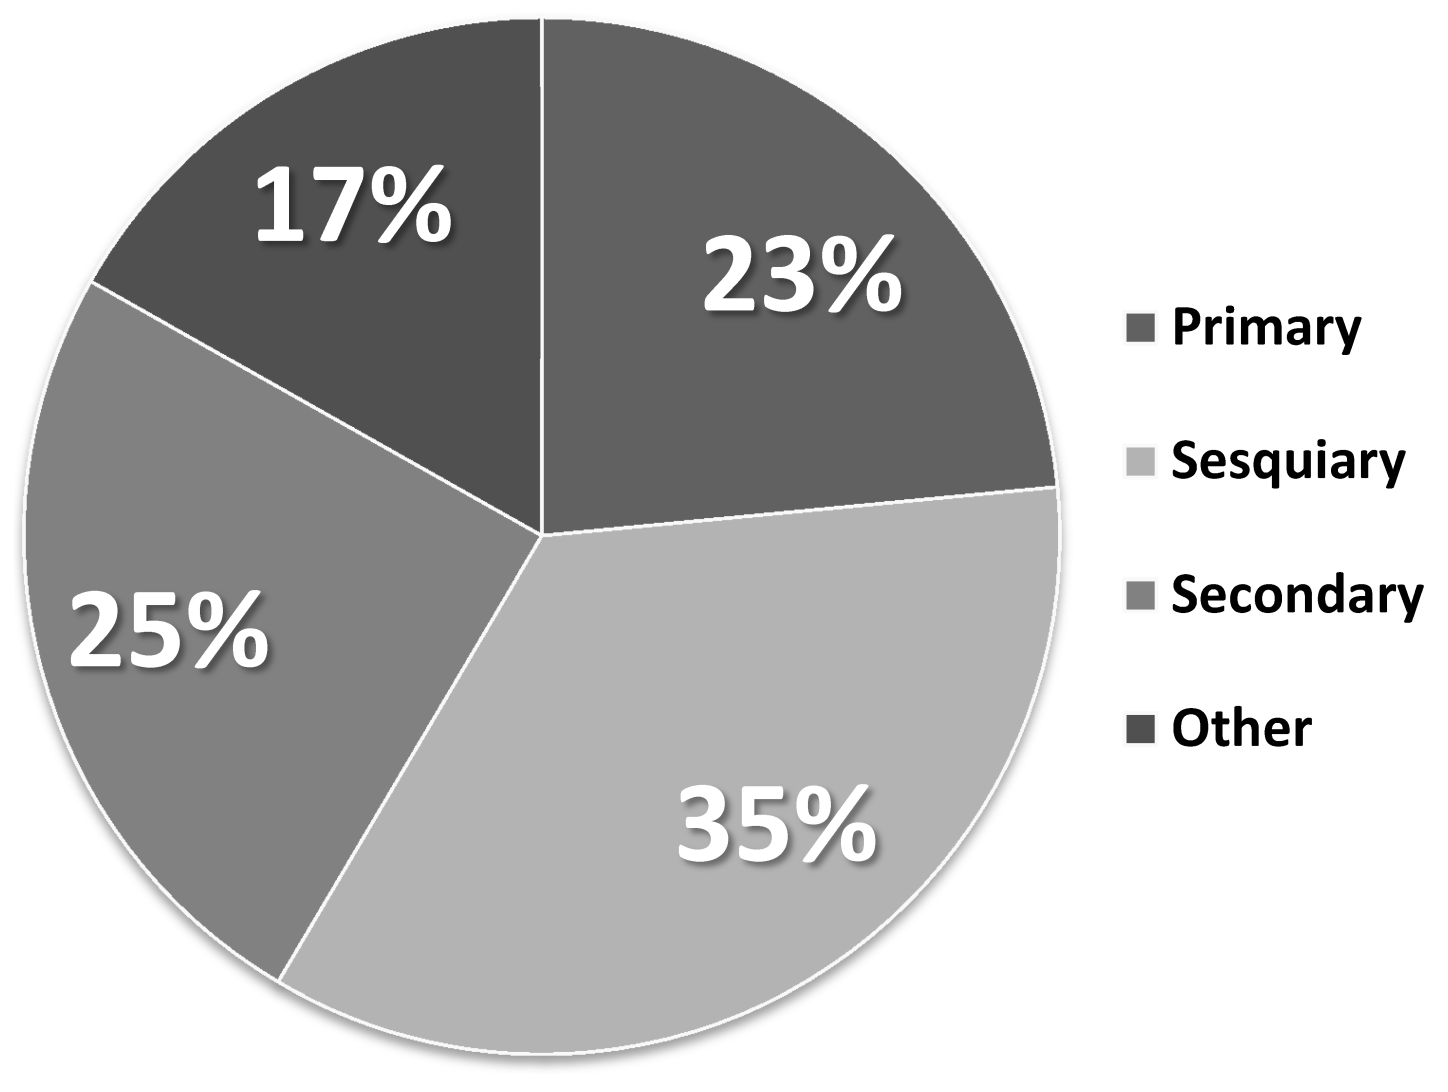
When categorized according to the redefined rules, the data contained 23% of primary information (141 tweets), 35% of sesquiary information (210 tweets), 25% of secondary information (148 tweets), and 17% of other (101 tweets). See
Figure 5 for details. The tweets that stood out contained entries resembling talking to oneself, such as “
Souieba sotsugyoushiki dounaru no darou” (“BTW, What will happen with the graduation ceremony?”), or greetings sent to other users, such as “@—
Itterasshaaai!” (“Bon voyage!/See you later!”).
3.3.2. Lower House Election Tweets
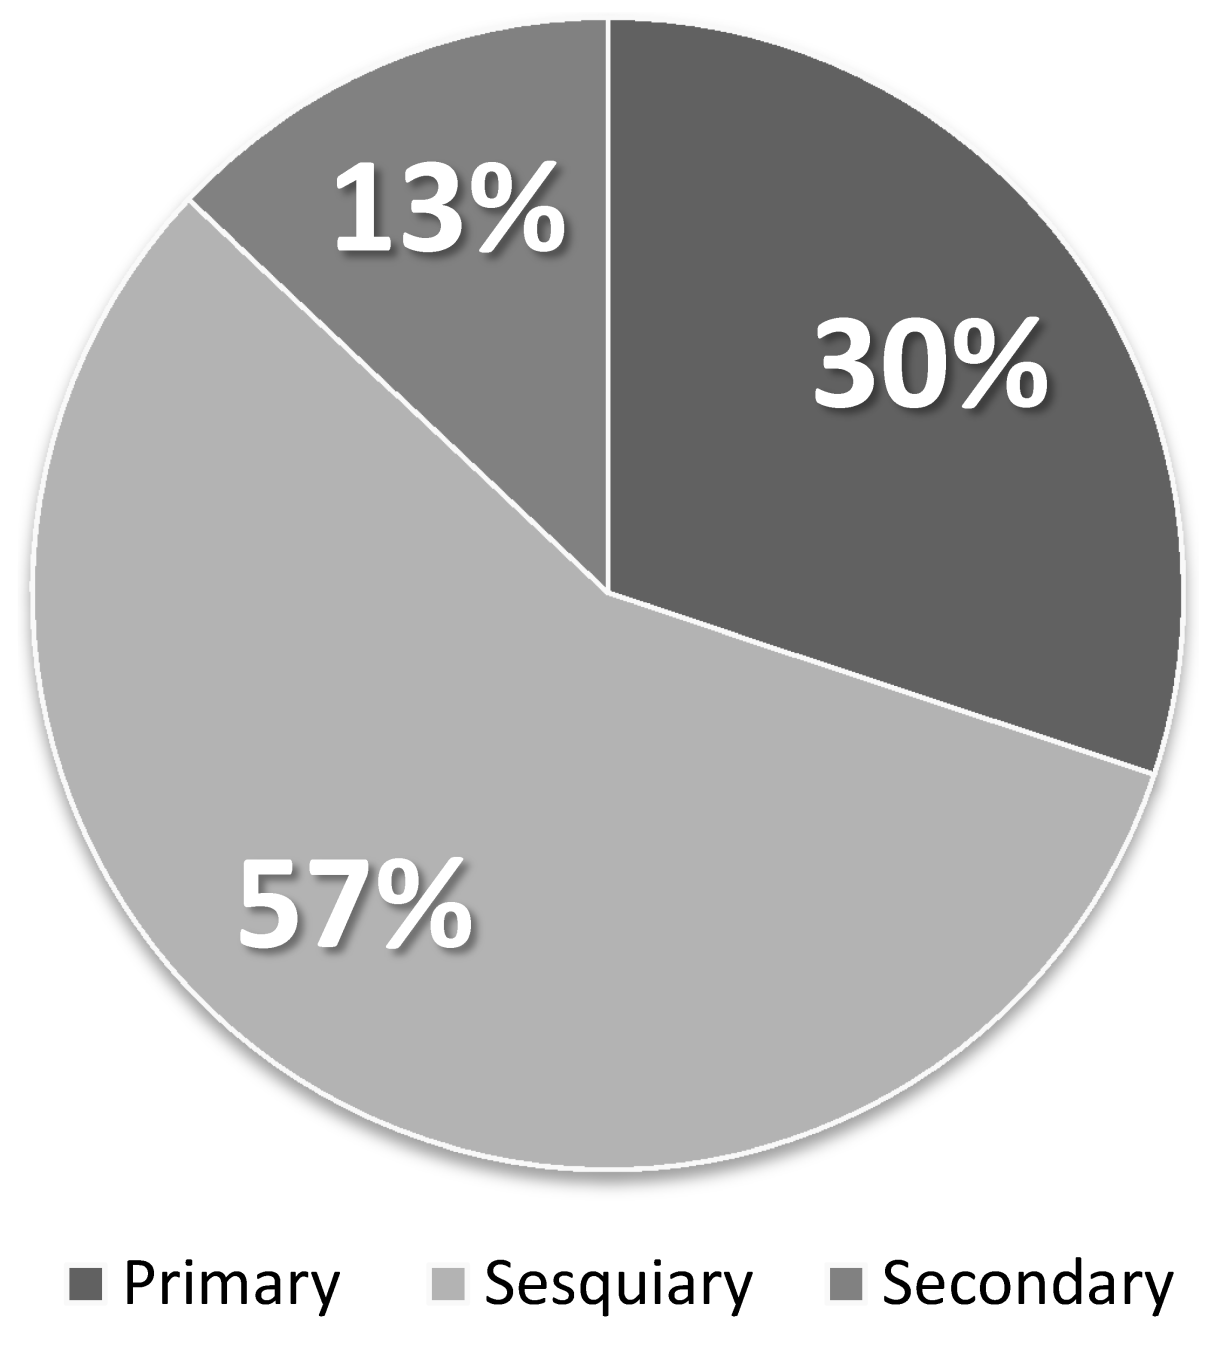
Next, we categorized the previously used election tweets according to the redefined rules. The data contained 30% of primary information (449 tweets), 57% of sesquiary information (849 tweets), and 13% of secondary information (194 tweets). See
Figure 6 for details.
There was still a small number of tweets (11 cases, 0.7%) which did not fit into any of the information categories. There were incomprehensible tweets or greetings like in the Earthquake tweets. However, there were tweets which used hashtags and unofficial retweets, such as “#Sousenkyo RT @show-you-all : ishin/jimin no ushiro ni wa, Hashimoto Tōru ya...” (“#GeneralElections RT @show-you-all : Behind the Restoration and the Liberal Democratic Party, Oh, its Tōru Hashimoto...”).
3.3.3. Upper House Election Tweets
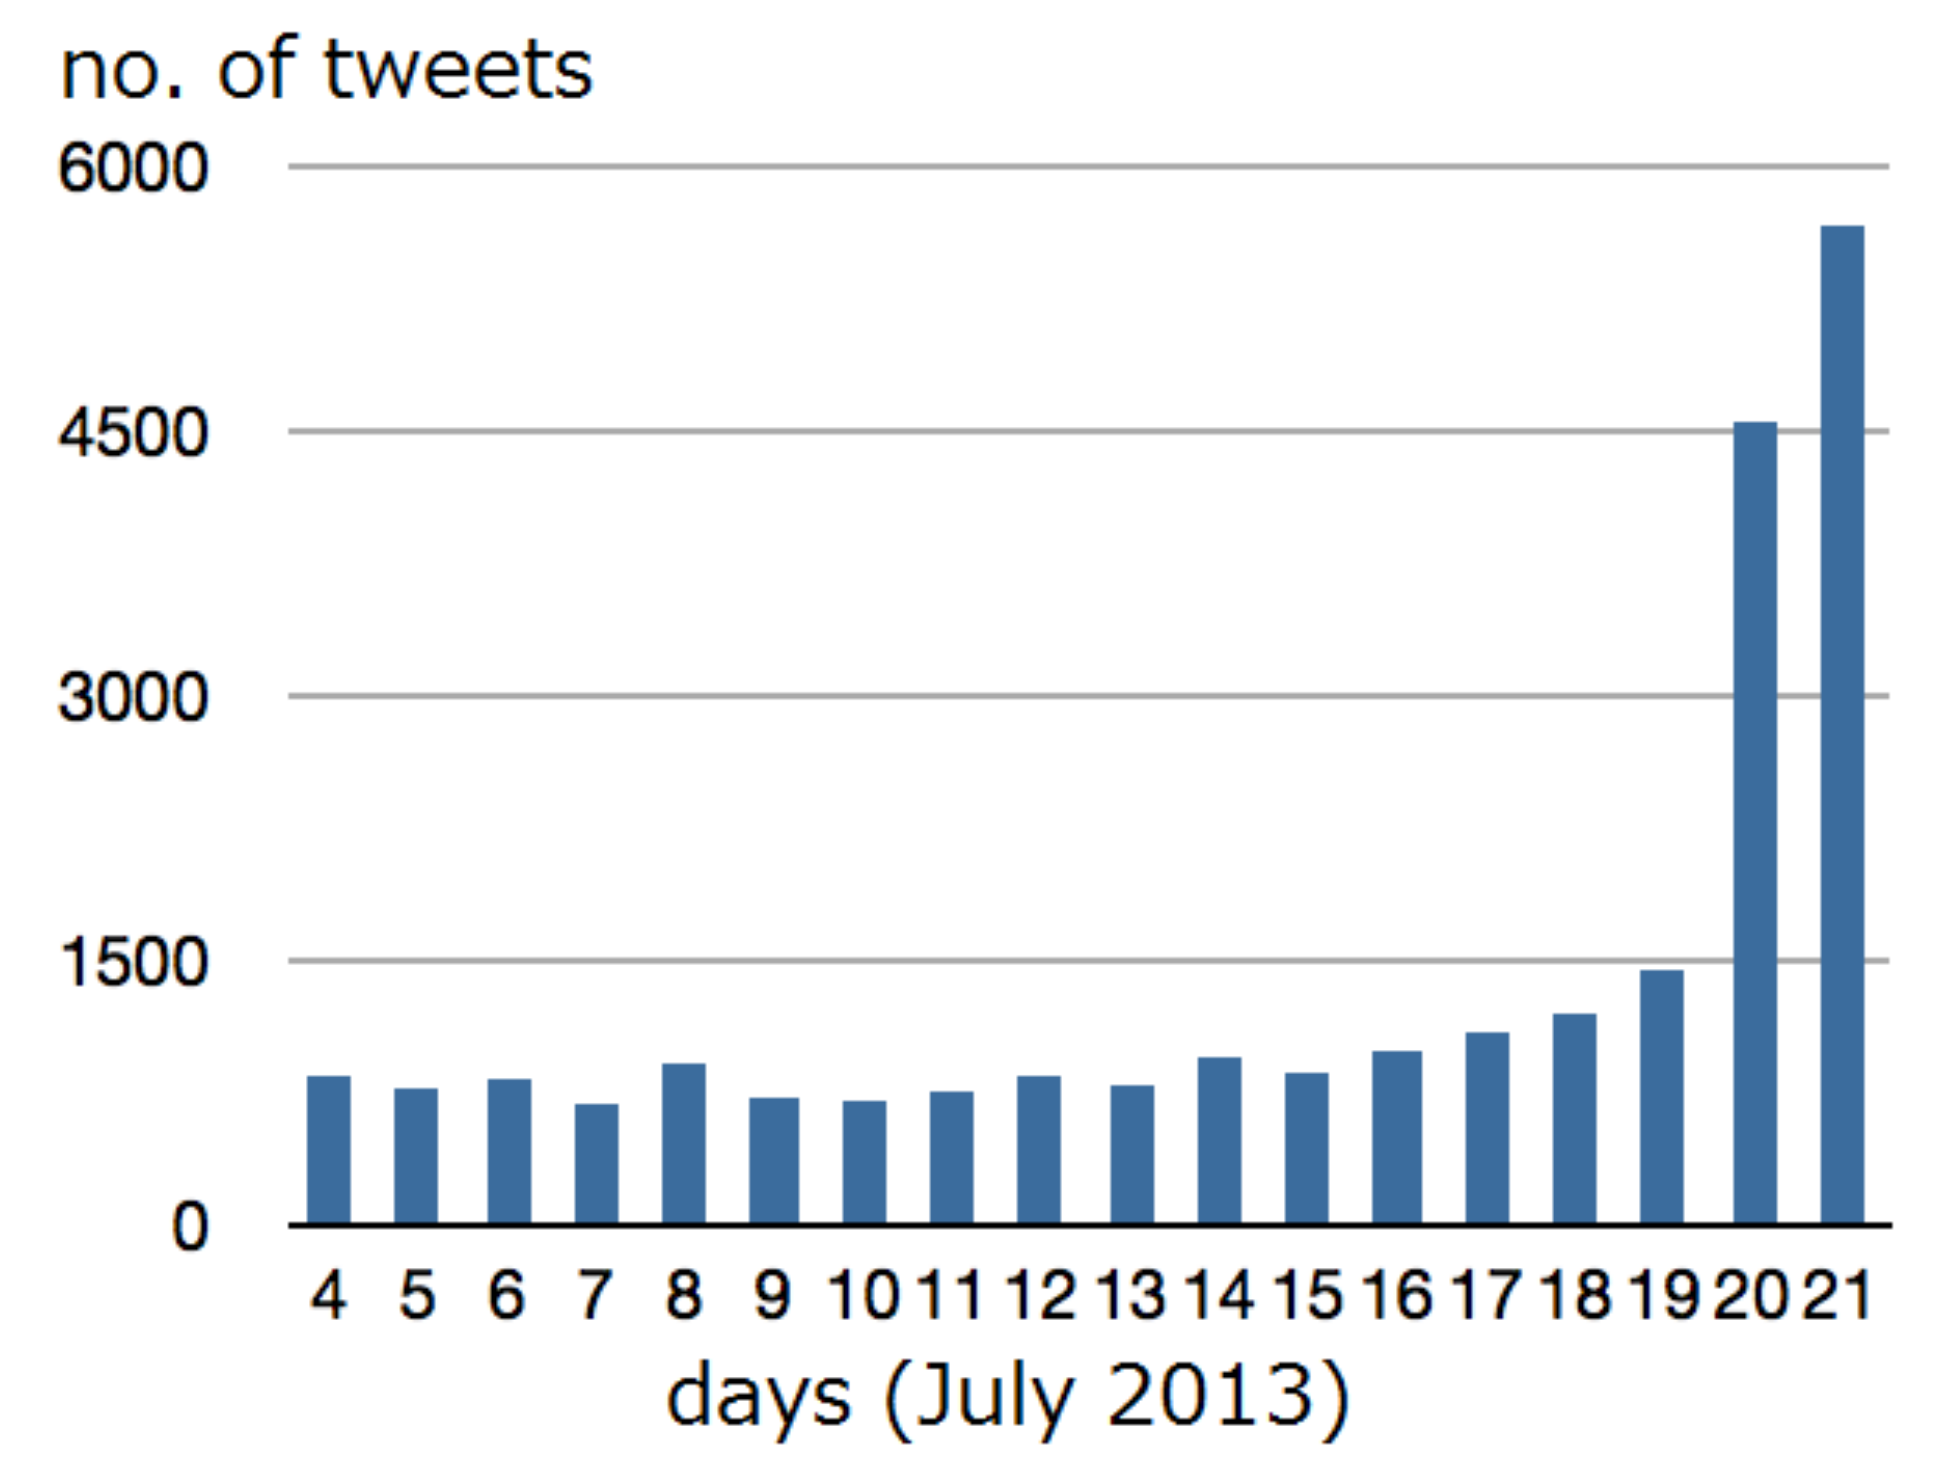
Using Hashtag Cloud, we collected an additional set of tweets for classification. The set consisted of tweets from the 23rd regular election of members of the Japanese House of Councilors (Upper House election). We collected 22,176 tweets from the time period of 4 July 2013 (official announcement of the election) to 21 July 2013.
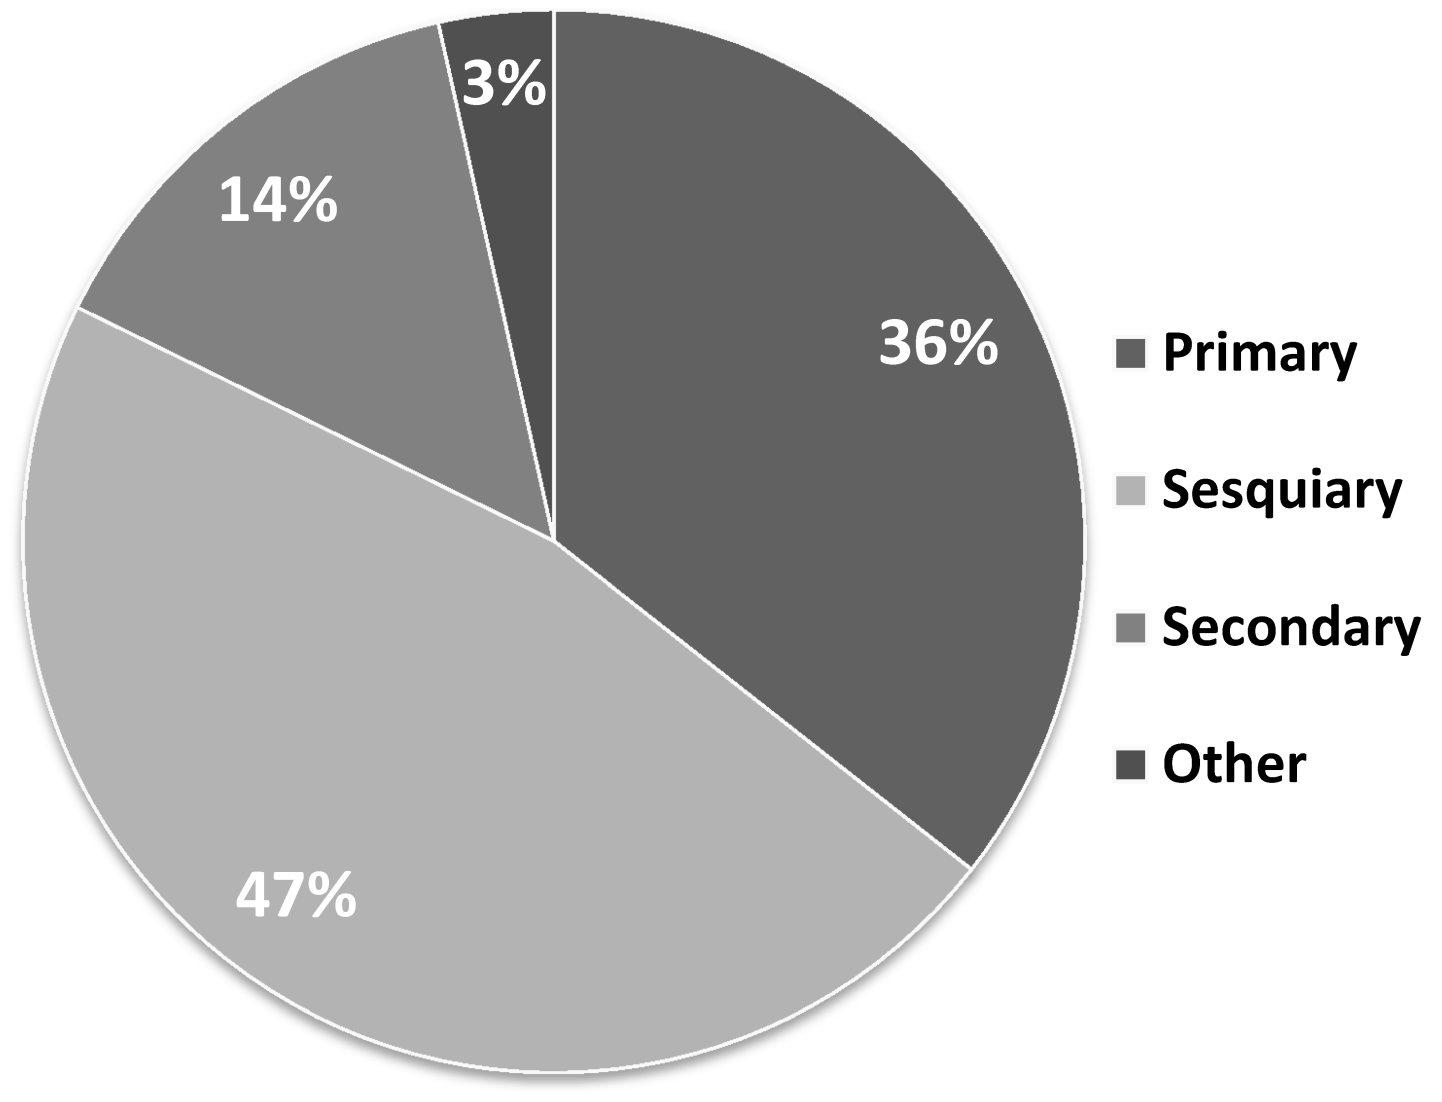
From the obtained data, we extracted 93 official retweets as secondary information, and from the remaining 22,083 we randomly extracted 2000 tweets for classification. The average length of election tweets this time was 45 characters, which is approximately 15 characters longer than in usual tweets. This means that election tweets contain more information in general. Primary information was represented by 711 tweets (36%), sesquiary information by 933 tweets (47%), and secondary information by 286 tweets (14%) (see
Figure 7).
There were also 70 tweets (3%) which did not fit in any of the three categories. These tweets consisted of only hastags, place names, or greetings. Unofficial retweets were, in most cases, classified as sesquiary information (135 tweets), and sometimes as primary information (29 tweets). As an interesting remark, 90% of all data classified as primary information also contained some amount of secondary information. Moreover, none of the primary information tweets contained either positive or negative content (all primary information tweets were neutral).
3.4. Discussion
In general, the Great East Japan Earthquake tweets contained much highly accurate and reliable information (primary information), but they also contained much noise, especially with regard to the areas affected by the earthquake.
Within all unofficial retweets from the general election for the Lower House (82 tweets), there were 57 tweets (69.5%) which contained primary information. Before the classification, we assumed that all or almost all of unofficial retweets would contain primary information. The fact that more than 30% of unofficial retweets contained secondary information was an unexpected result. This means that there were many tweets for which the authors did not want to send an official retweet but still wanted the cited tweet to spread.
Additionally, in tweets containing URL information, there were many which contained information helpful for voters. This finding could be useful in specifying helpful information in the future.
When focused on the opinionated information within the primary information, 77% of tweets contained neutral expressions. Neutral tweets contained objective opinions written from a neutral perspective, which could become useful for other voters to make their choice in the election. This means that automatically extracting neutral tweets from primary information could help in the extraction of useful information in the future. Tweets that contained either positive or negative information usually imposed a user’s personal, biased ideas and cannot be considered as useful in gathering information for elections. However, since the ratio of positive and negative information for each political party could become useful information (such as in predicting election results), a deeper analysis and more strict discrimination standards are required.
On the 3rd of December (official announcement day of the beginning of election period) there were 623 tweets, whereas on 16th December (voting day) there were as many as 13,093 tweets. The number of tweets per day increased as voting day approached, reached its peak on the two days of 16th and 17th of December, and slowly decreased thereafter. From the fact that there was a large number of tweets during the voting days, we infer that many users focused on the results of the election. Therefore, there is a possibility that the tweets that appeared around the official announcement day and the voting day are likely to contain different kinds of information.
In the election tweets that were classified by redefined rules based on the analysis results of the two first experiments, we were able to extract primary information more precisely. However, there were still tweets which remained unclassified, such as the ones containing greetings. In the future, it is necessary to consider how to handle these cases as well.
The classification results show that there was as much as 47% of the sesquiary information, and the average length of one tweet was longer than usual. This means that people were more interested in expressing their own opinions than retweeting other people’s opinions, which indicates an interest in politics in general. However, the third lowest voting rate in the history of postwar Japan (
https://www.jiji.com/jc/graphics?p=ve_pol_election-sangiin20130717j-04-w380 accessed on 23 June 2021) does not confirm this interest in the actual behavior of voters.
Figure 8 shows that the closer it is to the election day, the number of tweets increases, which suggests that people are generally interested in the election as such. Additionally, the age of Twitter users corresponds to the increase in the younger age groups taking part in the elections (
http://web-tan.forum.impressrd.jp/e/2012/05/11/12694, accessed on 23 June 2021), which means that SNS platforms such as Twitter could positively influence social and political awareness. Because of this visible influence of SNS on social and political life, on 19 April 2013 Japan allowed using the Internet as a venue for political campaigns. However, this does not necessarily result in people going to the elections and the number of election tweets cannot be considered as related in any way to the voting rate.
All primary information tweets were neutral. This indicates that by applying the idea of sesquiary information, we were able to reduce the noise in primary information. Although there were tweets containing both primary and secondary information (for example, “Historically first elections after raising the ban for Internet elections. Let’s go voting everyone!”), we did not go into the details of those this time. The presence of such cases means that sometimes tweets classified as primary information could contain some amount of positive or negative opinions. This could influence the user’s cognitive bias, and therefore, all tweets classified as primary information on the document level should also be re-classified on sentence level in the future.
Moreover, in reality, different kinds of information are often mixed in one tweet, which causes the ambiguities in the comprehension of information. Therefore, in addition to the presented classification criteria, we propose the following heuristic rules to deal with such conflicts.
If different kinds (primary, sesquiary, secondary) of information are mixed in one tweet, priority is given to information of the lower kind (e.g., “primary” over “sesquiary” and “secondary”).
If only secondary and sesquiary information is contained in the tweet, priority is given to secondary information (e.g.,: “I think that...”, or “News about...”).
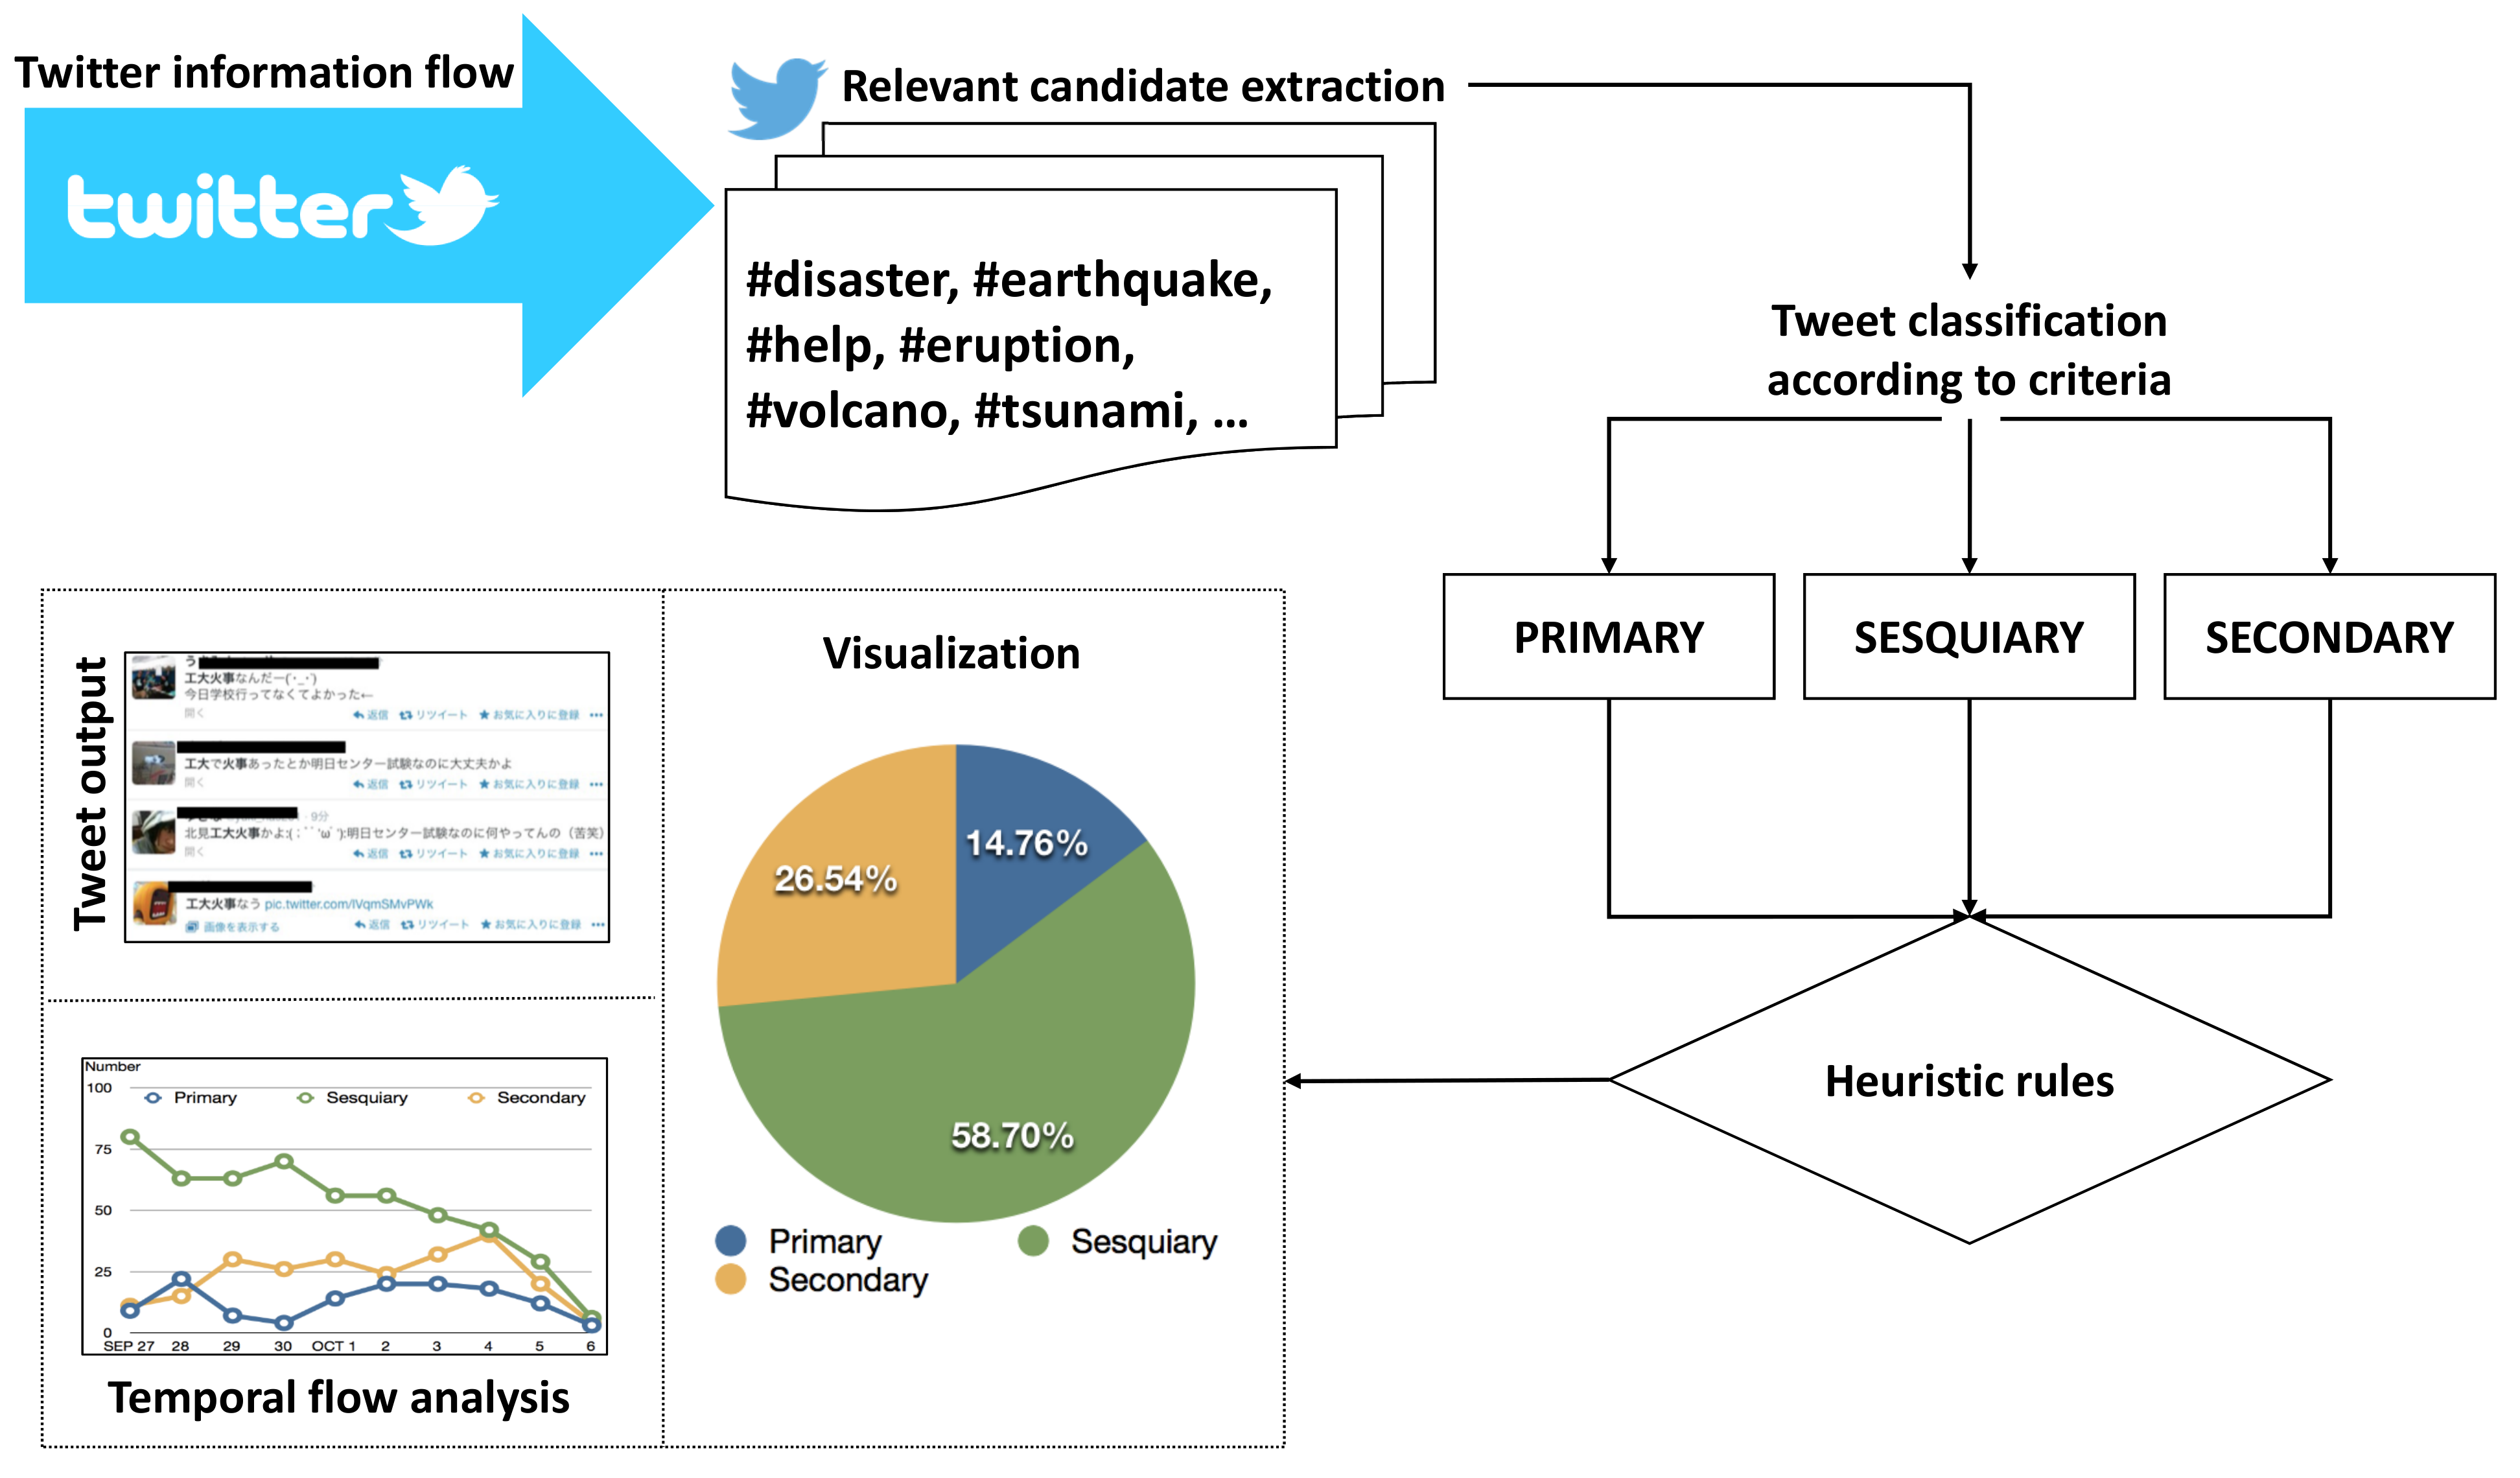
The outline of the system is represented in
Figure 9.
3.5. Data Preprocessing
Since with our information triage method, we aimed at providing help primarily in Japan (although making other language versions is possible later), we focused on developing the method firstly on data in the Japanese language.
The datasets used in this research (see
Section 3) were in Japanese, which posed several challenges. Firstly, in transcription of the Japanese language, spaces (“ ”) are not used. Therefore, we needed to preprocess the dataset and make the sentences separable into elements for feature extraction. We used MeCab (
http://taku910.github.io/mecab/, accessed on 23 June 2021), a Japanese morphological analyzer, and CaboCha (
http://taku910.github.io/cabocha/, accessed on 23 June 2021), a Japanese dependency structure analyzer to preprocess the dataset in the following ways (performance of MeCab is reported around 95–97% [
20], and Cabocha around 90% [
21] for normal language. Although we acknowledge that in some cases the language used on Twitter could cause errors in POS tagging and word segmentation, we did not want to retrain the basic tools to fit our data because we wanted the method to work using widely available resources, so it was easily reproducible. Additionally, we assumed that even if such errors occur, as long as they are systematic, they will not cause trouble):
Tokenization: All words, punctuation marks, and so forth are separated by spaces (later: TOK).
Lemmatization: Like the above, but the words are represented in their generic (dictionary) forms, or “lemmas” (later: LEM).
Parts of speech: Words are replaced with their representative parts of speech (later: POS).
Tokens with POS: Both words and POS information is included in one element (later: TOK + POS).
Lemmas with POS: Like the above, but with lemmas instead of words (later: LEM + POS).
Tokens with Named Entity Recognition: Words encoded together with with information on what named entities (private name of a person, organization, numericals, etc.) appear in the sentence. The NER information is annotated by CaboCha (later: TOK + NER).
Lemmas with NER: Like the above but with lemmas (later: LEM + NER).
Chunking: Larger sub-parts of sentences separated syntactically, such as noun phrase, verb phrase, predicates, etc., but without dependency relations (later: CHNK).
Dependency structure: Same as above, but with information regarding syntactical relations between chunks (later: DEP).
Chunking with NER: Information on named entities is encoded in chunks (later: CHNK + NER).
Dependency structure with Named Entities: Both dependency relations and named entities are included in each element (later: DEP+NER).
Five examples of preprocessing are represented in
Table 5. Theoretically, the more generalized a sentence is, the less unique and frequent patterns it will contain, but the produced patterns will be more frequent (e.g., there are more
ADJ N patterns than “pleasant day”).
We compared the results for different preprocessing methods to find out whether it is better for information triage to represent sentences, such as more generalized or more specific.
3.6. Feature Extraction
From each of the 11 dataset versions, a Bag-of-Words language model was generated, producing 11 different models (Bag-of-Words/Tokens, Bag-of-Lemmas, Bag-of-POS, Bag-of-Chunks, etc.). Sentences from the dataset processed with those models were used later in the input layer of classification. We also applied the traditional feature weight calculation scheme, namely term frequency with inverse document frequency (tf*idf). Term frequency
refers here to the traditional
raw frequency, meaning the number of times a term
t (word, token) occurs in a document
d. Inverse document frequency
is the logarithm of the total number of documents
in the corpus divided by the number of documents containing the term
, as in Equation (
1). Finally,
refers to term frequency multiplied by inverse document frequency.
3.7. Classification Methods
In classification, we compared seven classifiers, beginning from simple kNN and Naïve Bayes, through SVMs and Tree-based classifiers, up to Neural Networks. After all thorough experiments, we also propose a Convolutional Neural Network-based approach with a best-matching data-preprocessing method.
The Naïve Bayes classifier is a supervised learning algorithm applying Bayes’ theorem with the assumption of a strong (naive) independence between pairs of features, traditionally used as a baseline in text classification tasks.
kNN, or the k-Nearest Neighbors classifier takes, as input, k-closest training samples with assigned classes and classifies input samples to a class by a majority vote. It is often applied as a baseline, next to Naïve Bayes. Here, we used the k = 1 setting, in which the input sample is assigned to the class of the first nearest neighbor, up to k = 5.
JRip, also known as Repeated Incremental Pruning to Produce Error Reduction (RIPPER) [
22], learns rules incrementally to further optimize them. It has been especially efficient in the classification of noisy text [
23].
J48 is an implementation of the C4.5 decision tree algorithm [
24], which firstly builds decision trees from a labeled dataset, and each tree node selects the optimal splitting criterion further chosen to make the decision.
Random Forest in the training phase creates multiple decision trees to output the optimal class (mode of classes) in the classification phase [
25]. An improvement of RF to standard decision trees is their ability to correct over-fitting to the training set common in decision trees [
26].
SVM or support-vector machines [
27] are a set of classifiers well-established in AI and NLP. SVM represent data belonging to specified categories, as points in space, and find an optimal hyperplane to separate the examples from each category. We used four types of SVM functions, namely: linear, the original function which finds the maximum-margin hyperplane dividing the samples; plynomial kernel, in which training samples are represented in a feature space over polynomials of the original variables; radial basis function (RBF) kernel, which approximates multivariate functions with a single univariate function, further radialised to be used in higher dimensions; and sigmoid, that is, hyperbolic tangent function [
28].
CNN or Convolutional Neural Networks are an improved type of a feed-forward artificial neural network model (i.e., multilayer perceptron). Although originally CNN were designed for image recognition, their performance has been confirmed in many tasks, including NLP [
29] and sentence classification [
30].
We applied a Convolutional Neural Network implementation with Rectified Linear Units (ReLU) as a neuron activation function [
31], and max pooling [
32], which applies a max filter to non-overlying sub-parts of the input to reduce dimensionality and in effect, corrects over-fitting by down-sampling input representation. We also applied dropout regularization on the penultimate layer, which prevents co-adaptation of hidden units by randomly omitting (dropping out) some of the hidden units during training [
33].
We applied two versions of CNN. First, one hidden convolutional layer containing 100 units was applied as a proposed baseline. Second, the final proposed method consisted of two hidden convolutional layers, containing 20 and 100 feature maps, respectively, both layers with a 5 × 5 patch size and 2 × 2 max-pooling, and Stochastic Gradient Descent [
34].
4. Evaluation Experiments
4.1. Datasets
In preparation of the datasets for the experiment, we reused the data collected for previous manual analysis, described in
Section 3. We analyzed two types of situations, namely, the time of occurrence of a disaster and the period of elections, and on this basis, specified the criteria for classifying tweets as containing each type of information (primary, sesquiary, and secondary). Therefore, in the automatic classification experiment, we included samples representing each of the three types of information. Moreover, each type of situation (disasters and elections) could have, in reality, a different ratio of tweets representing the specified criteria. Therefore, to make the experiment reveal how an automatic classifier deals with the data in an objective and unbiased way, we randomly extracted 100 samples of each kind of information for each analyzed situation. We decided to normalize the number of samples to eliminate any bias in the data. When there was an insufficient number of samples for any kind of information, those were additionally collected to reach 100. This provided 600 samples. Moreover, we prepared additional samples from another disaster situation that took place more recently, namely, the eruption of a volcano on Mt. Ontake, on 27 September 2014.
This additional dataset is later presented and analyzed in detail in
Section 5. For the automatic classification experiment, we prepared two versions of the Ontake volcano eruption dataset: first, containing 300 samples, similarly to previous datasets, and second, containing all 874 we collected during one week from the eruption, with the actual ratio of each type of information.
All the above datasets, including those applied in manual analysis, were summarized in
Table 6.
Unfortunately, since most of the tweets included in the above-mentioned datasets were more than six, up to even 10 years old, we additionally collected and annotated tweets about heavy rains and typhoons that occurred in 2020. The overview of periods from when the datasets were collected has been included for reference in
Table 7. The number of tweets in each of the three categories in these additional datasets was curated to contain 350 samples per information type (see
Table 8).
4.2. Experiment Setup
To develop the optimal model for automatic tweet analysis according to the information it represents, we divided the experiment into several phases.
Firstly, we aimed at selecting the best-performing classifier (see
Section 3.7) with its optimal parameters, and the most adequate data preprocessing method (see
Section 3.5). In this phase, we applied a 10-fold cross-validation on all of the balanced datasets used together, and divided it into three types of represented information. We chose the top three performing classifiers, since there could always be differences when a classifier is applied to completely new data. We also checked whether the differences between the top three classifiers were statistically significant.
Next, we used the classifier that performed best, to train on both Earthquake and Election tweets, and then tested the whole system on the whole Ontake Eruption dataset, to see how the optimally trained classifier would perform on the data with a real-world ratio of information types.
Subsequently, we analyzed the performance of the best classifier on the Ontake Eruption dataset on a day-by-day basis. This final experiment was done to check if the optimally trained classifier would sustain the quality of classification thorough a longer period of time, which would be required in a practical application, such as searching for survivors of a disaster.
Finally, we verified the best-performing model on two datasets containing tweets from events that occurred more recently, in 2020, to verify if the model is well-generalized and can grasp the important information despite change in time.
As for the environment of all experiments, the preprocessed original dataset provides 11 separate datasets for the experiment (see
Section 3.5 for details). Thus, the first experiment was performed 11 times, one time for each kind of preprocessing. Each of the classifiers (
Section 3.7) was tested on each version of the dataset in a 10-fold cross-validation procedure (which gives an overall number of 1210 experiment runs). The results in all experiment phases were calculated using standard Precision (P), Recall (R), balanced F-score (F1), and Accuracy (A). As for the winning condition, we looked at which classifier achieved the highest balanced F-score, with a confirming condition of higher Accuracy in the case of two equally performing classifiers.
4.3. Results and Discussion
4.3.1. Best Classifier Selection
As for the general results, the classifiers can be divided into three groups. The first, represented by simple classifiers, such as kNN or Naive Bayes, obtained the lowest results. Additionally, SVMs using polynomial, radial and sigmoid functions fit in this group, with polynomial SVMs scoring the lowest of all used classifiers.
The second group of classifiers contains linear SVM, JRip and Random Forest, as well as simple CNN with one hidden layer. Interestingly, from this mediocre scoring group, the simple CNNs usually scored highest, with Random Forest scoring second best in this group.
Random Forest also scored highest of all for the dataset, which was the most problematic for all classifiers, namely, the one using only part-of-speech preprocessed features. Unfortunately, although Random Forest scored for this dataset as highest, the score was still very low and did not exceed 50%.
Finally, the highest scoring classifier of all was the one based on Deep Convolutional Neural Networks with two hidden layers, which scored as the highest for all dataset preprocessing methods (except POS). For most datasets, the two-hidden-layer CNN scored over 90%, outperforming all other classifiers.
When it comes to the best -erforming dataset preprocessing method, the simple tokenized dataset, tokenization with parts-of-speech, and tokenized with named entities achieved the highest scores for most classifiers. The lemmatized dataset also scored highest twice for kNN and J48, with an F-score equal to .617 and .744, respectively.
The highest combination of appropriate dataset preprocessing with classifier parameters belonged to the proposed two-layer CNN with a dataset preprocessed with a shallow parsing method, using chunks as features. This version of the classifier obtained a remarkable 99% for all used metrics, including a balanced F-score and accuracy.
The second and third best were, respectively, also the two-layer CNN, but with feature sets based on dependency relations with named entities (F1 = 0.987), and lemmas with parts-of-speech (F1 = 0.939).
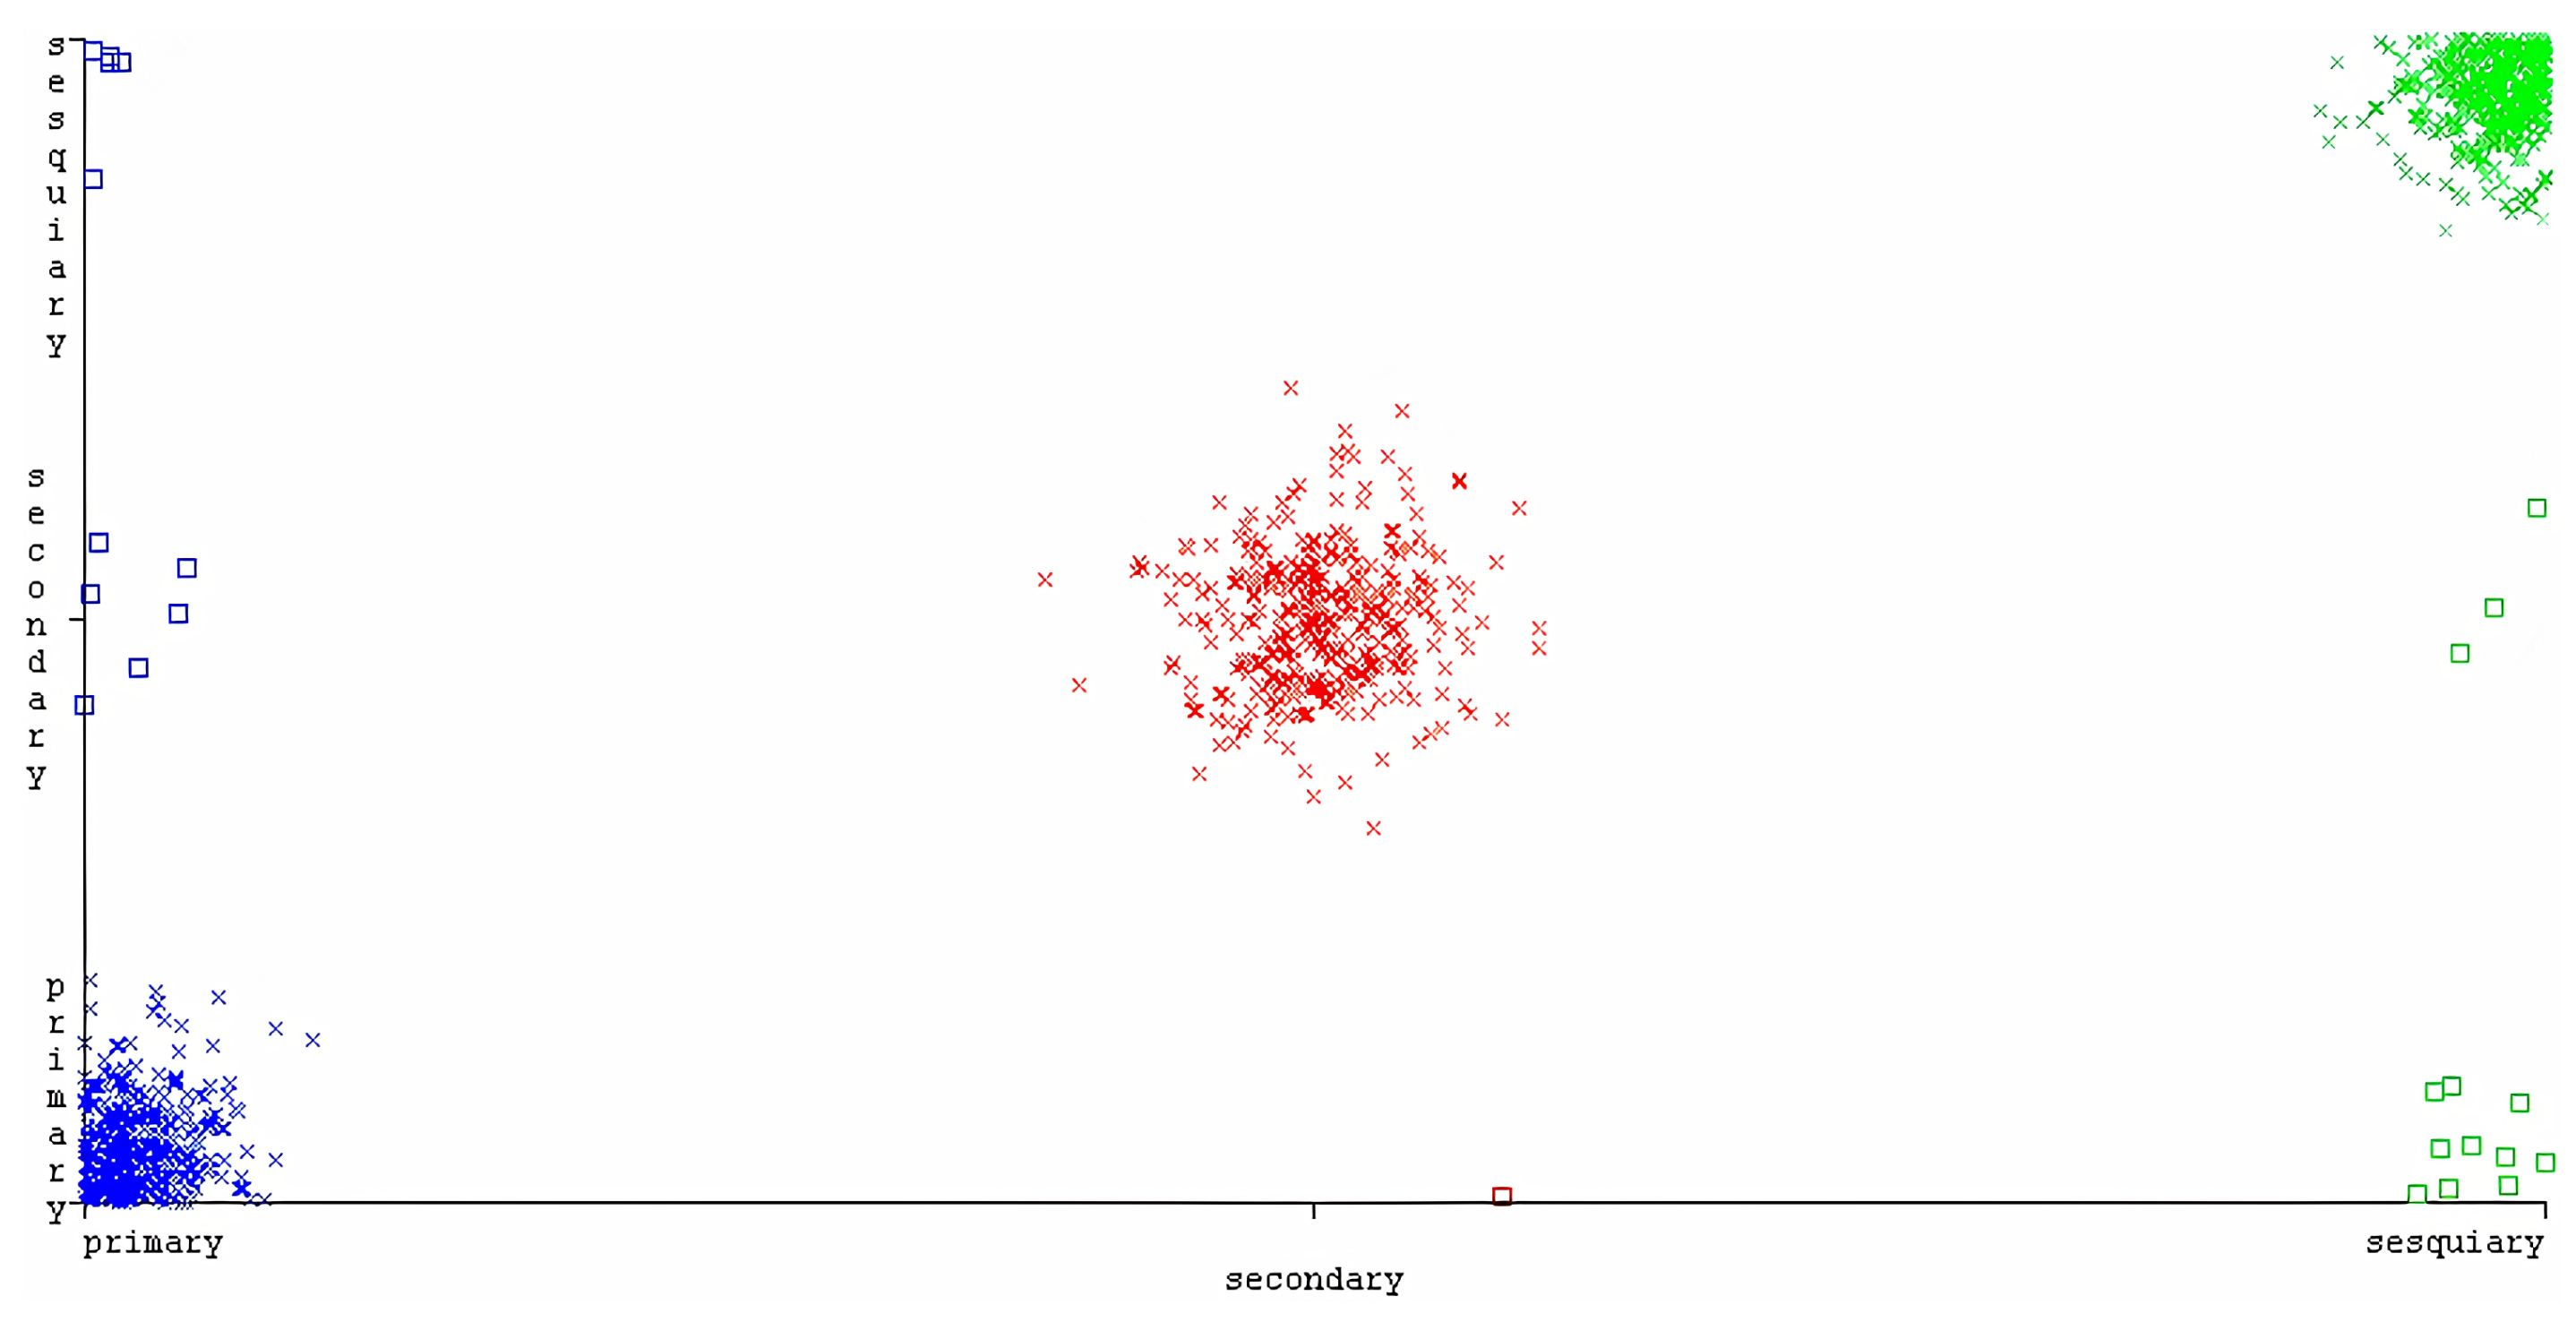
As for statistical properties of the three best classifiers, at first we calculated Cohen’s kappa statistic values for all three classifiers, based on their agreement with expected values, represented in contingency tables (see
Table 9).
Beginning from the worst, the kappa values were = 0.9083, = 0.98, and = 0.985. For all classifiers, the strength of agreement was considered to be `very good’.
As the final step of the analysis, we performed an analysis of the most common types of errors which the proposed classifier made. From
Table 9 one can see that, when the classifier made a mistake, it most often annotated a tweet as “primary”. This could suggest that the “primary” class has a tendency to be stronger in general, and even when a tweet expresses an opinion, it is mistakenly considered as primary information. Although six mistakes of this kind for 300 cases is not much (2%), we will focus on optimizing the criteria for primary information in the future.
Interestingly, the system did not make a mistake when distinguishing between secondary and sesquiary information, despite the fact that both of those types of information tend to contain some sort of opinionated expression.
All results have been summarized in
Table 10.
4.3.2. Validation on New Data
Firstly, we tested the model performance on data collected after the eruption of the Ontake volcano in 2014. The data were collected for a week after the eruption and not normalized for the number of classes, therefore representing a close to real-life ratio of all types of information. The results reached 0.855 of the averaged F1-score. This is a lower result than the best, near-perfect score reached in the initial experiment. This decrease of performance can be interpreted by the non-normalized number of classes, with the system mostly confusing secondary information as sesquiary and vice-versa. However, primary information was classified on a high level of 0.913 of the F1-score, which is a promising and reassuring result, since when the system is used after a natural disaster, the main focus will be put on finding tweets expressing primary information.
However, the most satisfying result was obtained when classifying the newest data, collected during heavy rains and typhoons in 2020. We suspected that after over six years, and for part of the data, even 10 years since data collection, the performance of the model would greatly decrease due to multiple conditions, such as changes in topics, changes in the appearing frequent features, or the general evolution of language used on Twitter. To our surprise, the model almost did not lose any performance, and was able to classify the new data correctly with an F1-score of 0.976 for the Heavy rains dataset and 0.979 for the Typhoons dataset. This strongly suggests the following. The data collected for this research were prepared and curated with high quality, and correctly represents the concepts of the three types of information. Moreover, the model itself is well-generalized on the provided data and can also be applied in practice in the future on other types of data.
5. Analysis of Information Change Over Time
The preliminary study (see
Section 3) classified the tweet data related to the Great East Japan Earthquake and proposed the following hypothesis regarding the changes in information appearing in tweets over time.
- 1.
Sesquiary information grows right after the event occurs: not directly related to the event, or related to some extent, but not posted by users who directly experienced the event.
- 2.
Secondary information grows over time: some time after the event occurs, various kinds of information get mixed and the secondary information is used in the general spread of information.
In the present research, we verified this hypothesis by analyzing a new set of tweets from the emergency situation of an eruption of a volcano in Japan in October 2014.
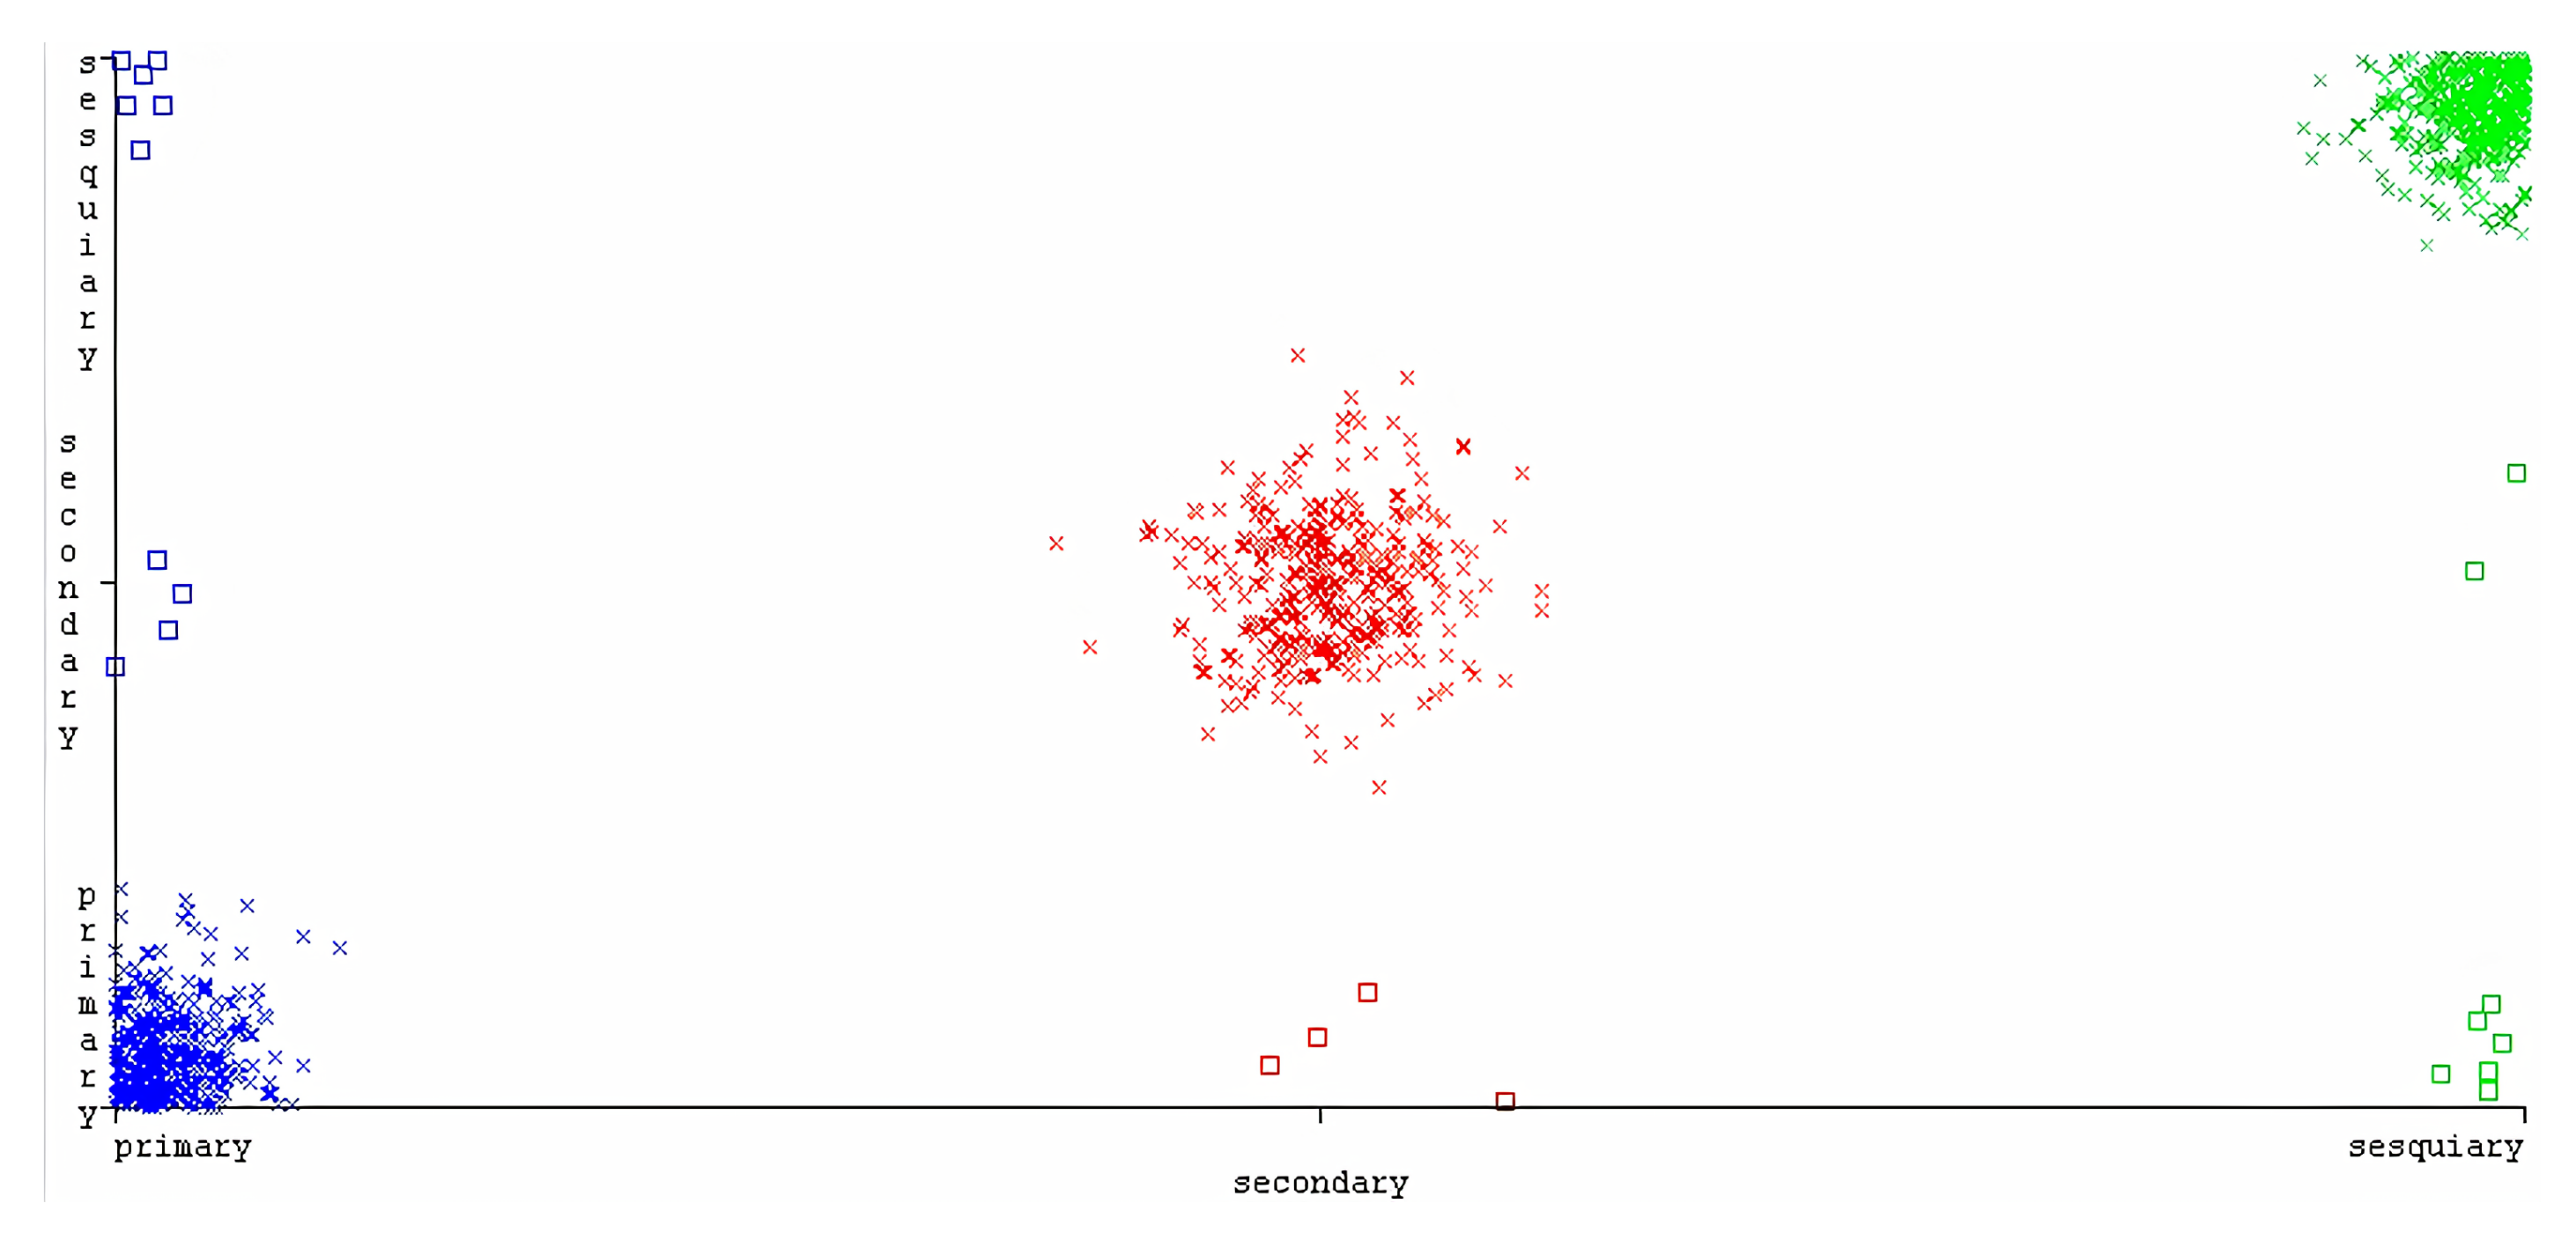
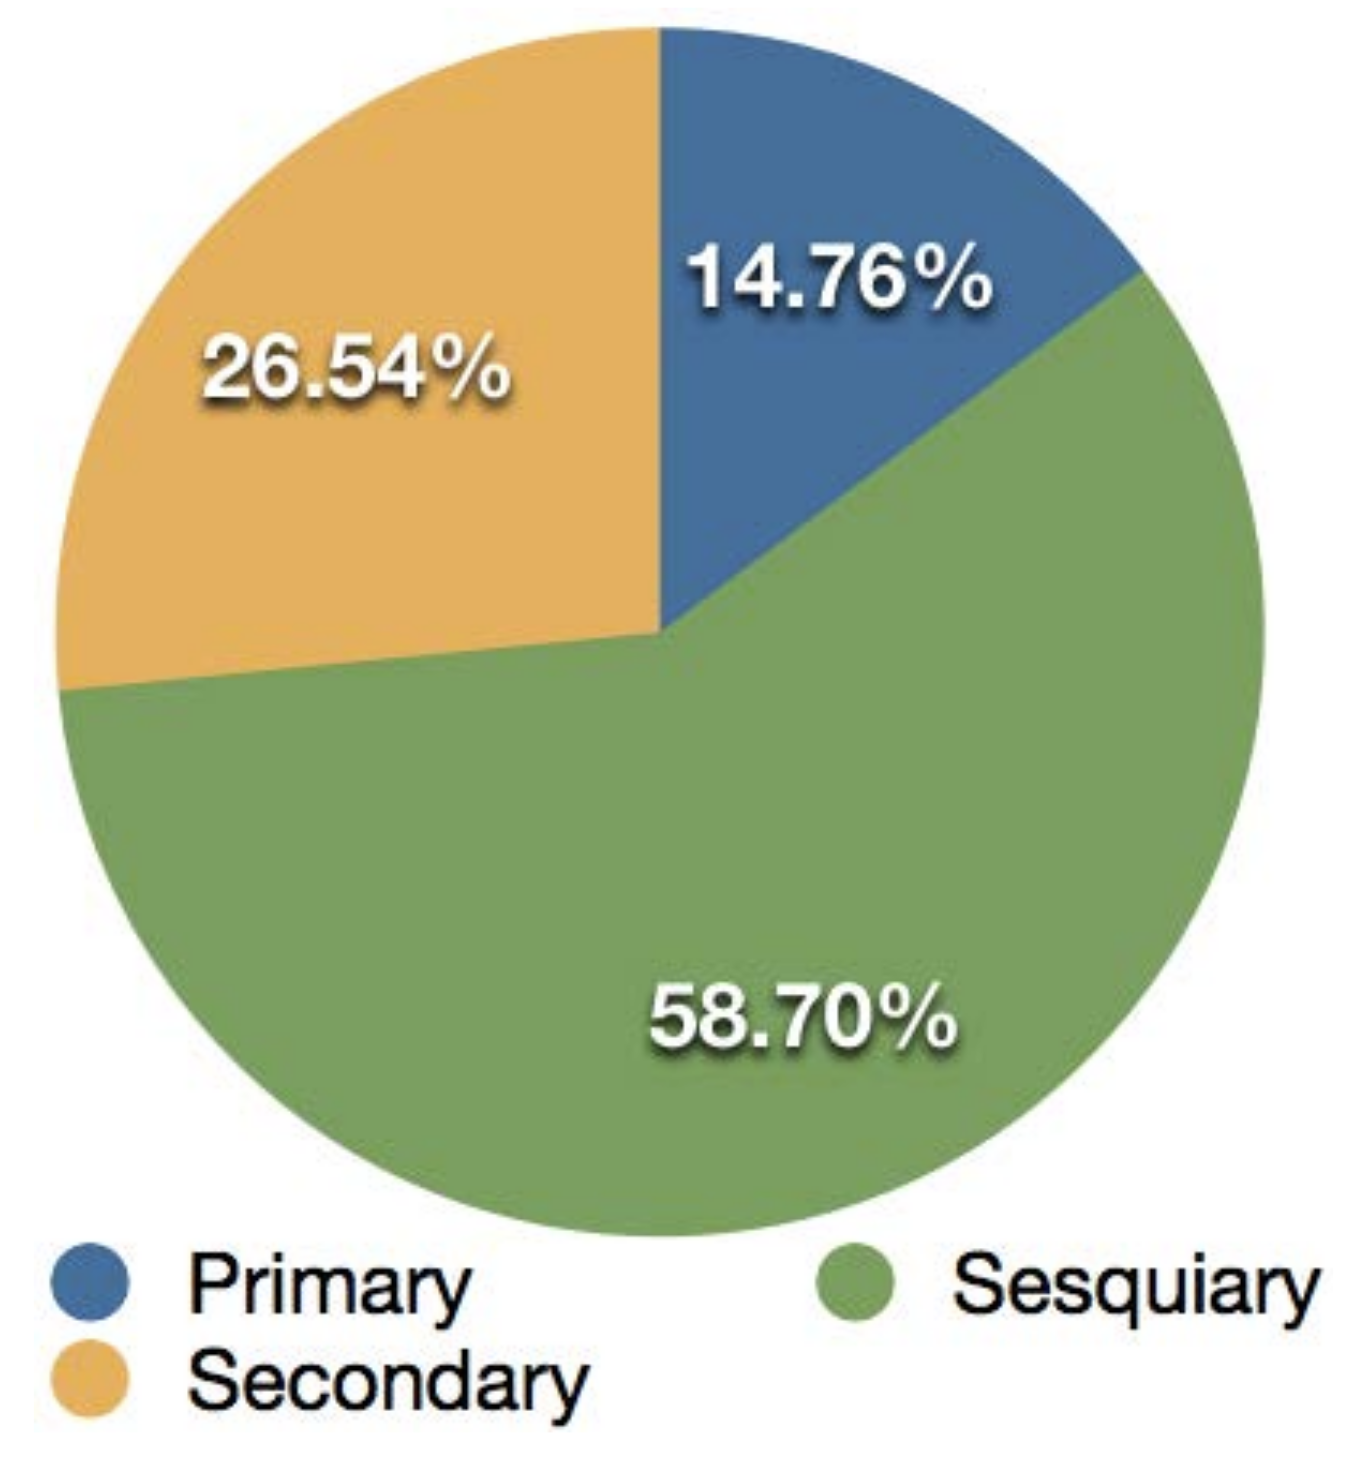
In this section, we describe the results of analysis of tweet logs with the proposed system. The overall dataset contained 3706 tweets collected from 27 September 2014 (the day of eruption of Mt. Ontake) to 6 October 2014. From this dataset, we randomly extracted up to 100 tweets from each day (a total of 874 tweets). On October 5 and 6, the overall number of tweets did not exceed 100.
As for the result of the classification, primary information was represented by 129 tweets (14.76%), sesquiary information was represented by 513 tweets (58.70%), and secondary information was represented by 232 tweets (26.54%) (
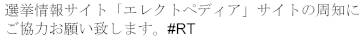
Figure 13). Among the primary information tweets, many contained content such as:
“Volcano fumes are approaching the Kuzo Pass. Volcanic ash has fallen here as well. My throat is itching. I am evacuating further.”
The sesquiary information contained tweets such as:
“I hope the climbers descent safely. I hope the injured will be rescued quickly.”
Among secondary information, there were tweets such as:
“I heard there were some injured people.”
In the result, similarly to the preliminary study, sesquiary information covered the largest amount of data, reaching 58.7% of all analyzed tweets. Moreover, similarly to the analysis of the tweets from the time of the Great East Japan Earthquake, sesquiary information contained numerous tweets by people located at a further distance from the event, but interested in what was happening, such as “I wonder what happened?”, or “I hope everyone is alright”. From this, we can infer that people sending sesquiary information tweets during an occurrence of an emergency are usually people who are away from the center of the event.
6. System for Information Triage on Twiter
In this section, we describe the structure of the proposed system for information triaging on Twitter.
To create the system, we firstly developed classification criteria for the types of information appearing on Twitter, explained in previous sections. The classification criteria were based on the definitions of primary and secondary information and, as well as the additional type, namely, sesquiary information (
Table 4), which includes the user’s opinions, sentiments, feelings, and so forth.
These criteria were then used to collect the initial datasets (see
Section 3), containing tweets representing each type of information. The datasets were used to train and test a classifier for the optimal performance in distinguishing between the three types of information.
In the experimental phase, we used seven different classifiers for comparison with additional parameter modifications to chose the best-performing classifier. Moreover, we tested 11 methods of data preprocessing to further optimize the classifier performance. The final best-performing model was implemented in the proposed method.
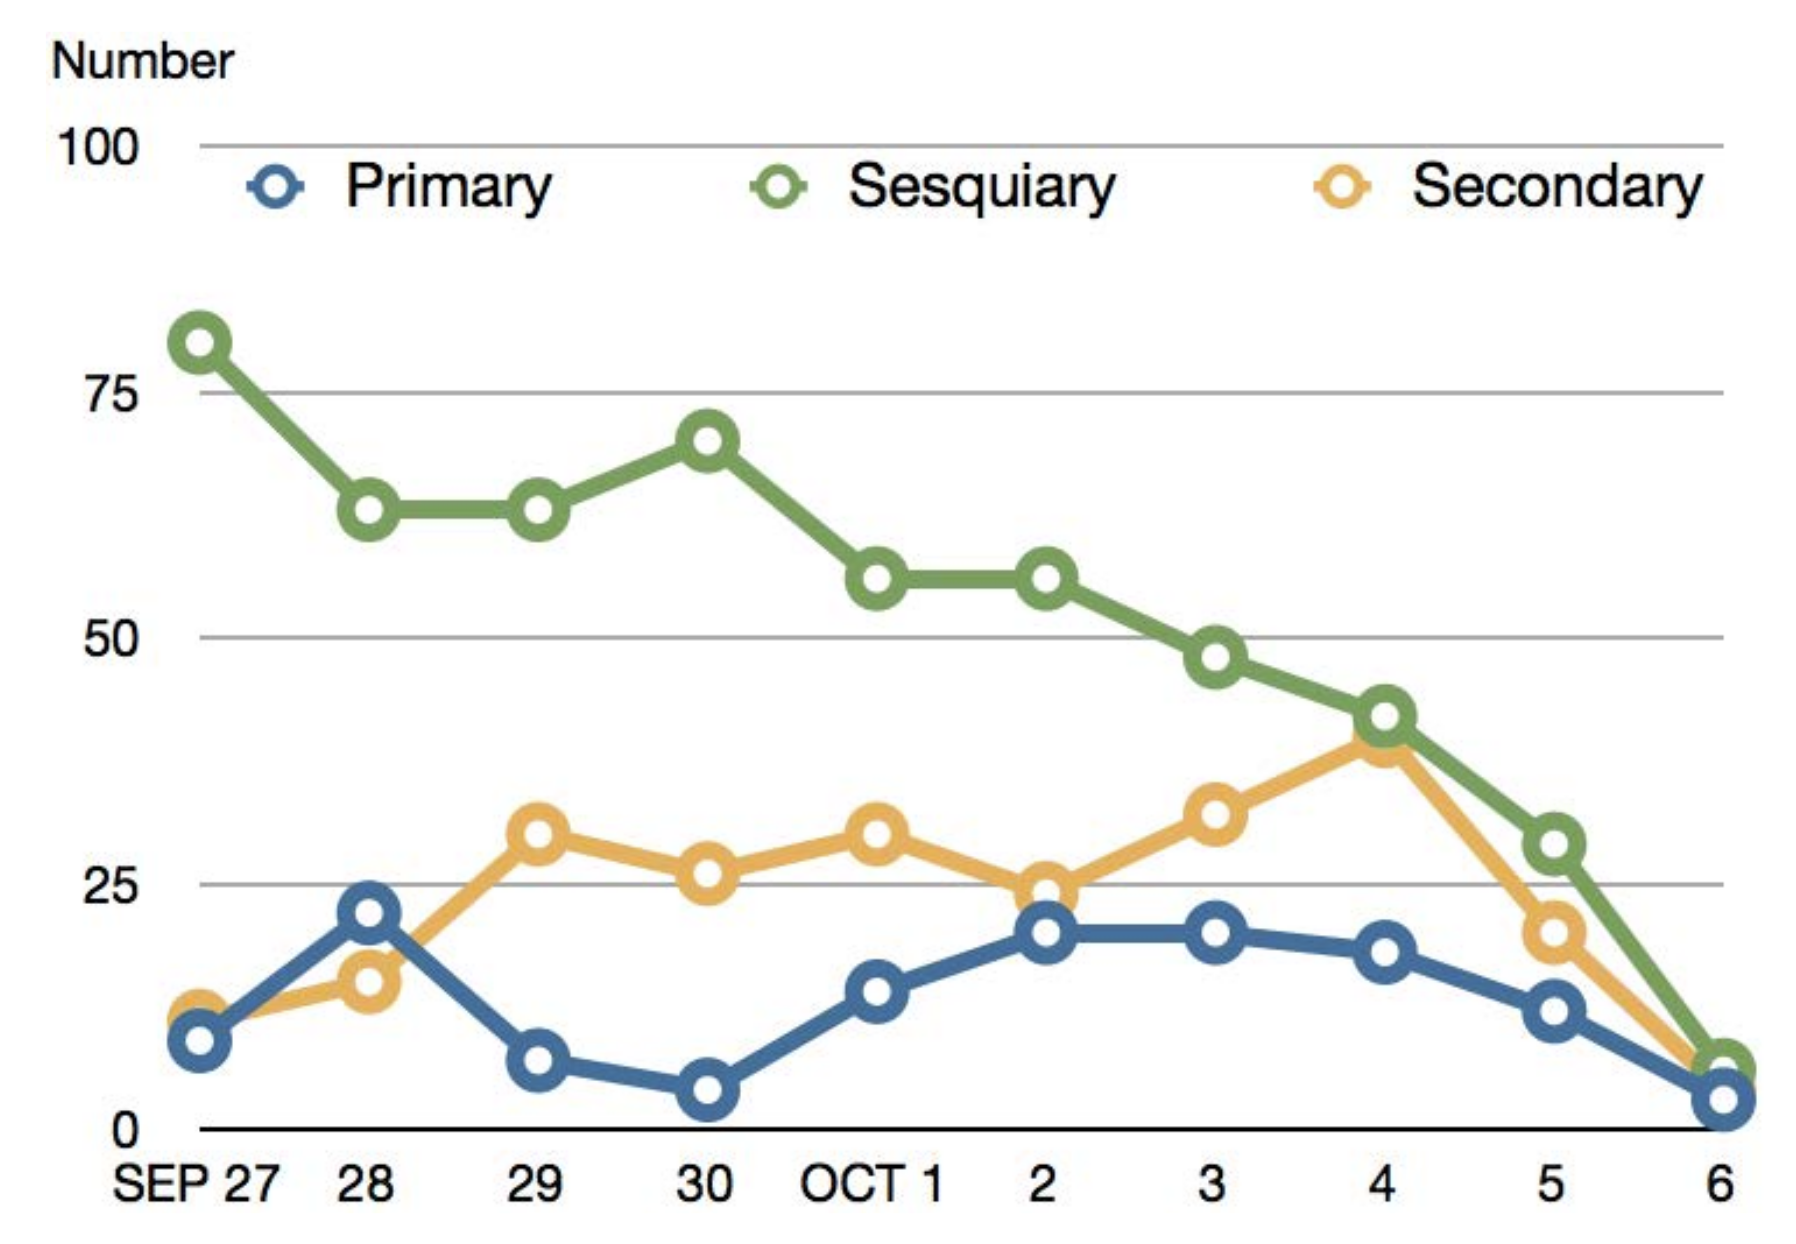
Next, we investigated the transition of information each day (
Figure 14).
Previous research [
19] has hypothesized about the possible transition of information with time. We verified that in practice on the available data.
Immediately after an event occurs (here: September 27), the primary information tweets start appearing and the number grows each time there is a movement or change in the event. On the 28th, after most people have safely evacuated, the primary information decreases and the secondary information tweets gain in number.
Later, around September 30th, again, primary information gains in number. This is due to the fact that the official search for survivors has started, during which difficulties occurred in getting through the ruins and volcano fumes have fallen on the ground. In addition, there occurred a social and political fuss regarding the possible prediction of volcanic eruption reported in the news, which caused a growth in sesquiary information, mostly consisting of opinions.
The sesquiary information grows largely immediately after the event occurs. This was most probably due to the fact that except the people who actually saw the event, many people could not understand what had happened and got confused.
When it comes to secondary information, it is different by the event; however, it usually occurs in large quantities after some time has passed from the beginning of the event. Immediately after the event, there is not enough information sources for the secondary information to occur. Moreover, the general interest in the event itself is fading with time; thus, the number of tweets mentioning the event gradually decreases, and converges to zero after October 6th. Thus, despite the differences in the number of cases for each type of information mentioning the event, we confirmed the characteristic patterns of occurrence of each type of information.
From the perspective of information triage, at the beginning of an emergency, the first priority is on rescue. Therefore, it is the most important to find messages containing primary information, such as the two following.
The first rescue team which was dispatched on the day of the eruption was the Mobile Police Squad containing 12 people, who left on 13:55 from the Nagano Prefectural Police Department base. A message such as the above would have been invaluable for this team, as it could support the prediction of users’ behavior and in practice, save lives. This shows how important it is to quickly provide the appropriate information.
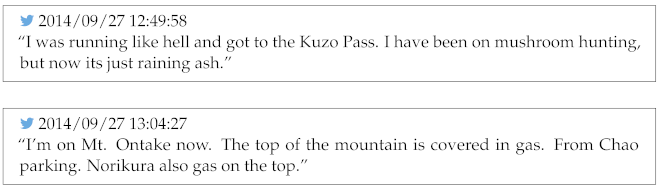
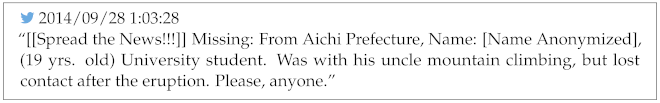
After some time, during the search for the missing, it is necessary to support the efficiency of decision-making of the rescue team. The 12th Brigade of the Self-Defense Forces established a post in the Otaki Village Office at around 17:30 on September 17th. However, there is a tweet containing sesquiary information, such as the following.
Therefore, the information on missing people was available for the rescue team even before and during the action. By efficiently utilizing such information, it could be possible to rescue more people.
We considered the following improvement of classification criteria. In the extracted data, we found 39 tweets (16.81% of secondary information) that contained a hashtag with names of Japanese television programs, such as “#Sukkiri” and “#Tokudane!” In previous research, only the names of news programs were taken into consideration, such as “NHK news” or “Asahi Shinbun Digital”. Thus, in carrying out the automation of tweet extraction, previous research only assumed pattern-matching of keywords such as “news” or “newspaper”. The present study proves there is also a need to apply a wider span of keywords to grasp the variety of the content provided by the media. This could be achieved by providing a method for an automatically updated named entity extraction system, such as NeXT [
35], which we consider in our future work.
Moreover, in order to apply such methods in practice, in the event of a disaster or emergency, it would be necessary to perform the collection of data not only by the hashtags, but also by real-time keyword spotting, and by burst detection.
7. Study Limitations
There are several possible limitations of this study.
Firstly, datasets collected for this study were of moderate size and were collected in a specific time-frame. Therefore, it is possible that the models created on those datasets will have limited applicability on data collected and analyzed in the future. There are several ways to mitigate this problem. We plan to reevaluate the method periodically and analyze classification errors. For this, we plan to apply the methodology of [
36], who also reevaluated their system to reveal a major performance drop after two years. Fortunately, we have shown that the method works well on data from different periods of time; thus, this limitation is not expected to be extensive or sudden.
Another limitation is related to the Twitter API used to collect the data, as well as for actual system application. Our reliance on official Twitter API enforces all limitations the the API possesses, such as a limited number of tweets allowed to collect per hour/day. The more strict the limitations are in the future, the more limited the developed system will become. Such limitations can be an inconvenience in general, but can also potentially mean that a rescue team can face a situation where no more tweets are allowed for extraction at a current day, and thus it is not possible to reach people in distress. Therefore, if the official Twitter API limitations become too severe to make the system reasonably applicable, we plan to either apply a third-party Twitter API, or in the worst case, change the SNS platform to a different venue.
8. Conclusions
In this paper, we firstly presented our study of user linguistic behaviors in tweets of two kinds: disaster tweets and election tweets. In particular, we focused on the time of the Great East Japan Earthquake and the Lower and the Upper House elections.
As a basic idea, we assumed that people use SNS in decision-making or present status determination. Since it is important in such situations to automatically extract valid primary information, we firstly analyzed the earthquake tweets and defined rules for our classification criteria. Next, we classified election tweets based on these criteria and found out that even in primary information tweets there could be other information which causes cognitive bias in readers, and thus it is necessary to further divide factual information from opinionated information. We named this kind of information, neither being primary nor secondary information, though still preserving the structure of its own, “sesquiary information”. This becomes especially important during the time of elections when people look for opinions about the candidates. However, it is also useful in the time of a disaster. Right after the disaster occurs, it is most important to quickly obtain only primary information. However, after the first emergency phase passes and people begin to look for appropriate information to support their further planning and decision-making, sesquiary information gains significant importance as well.
Therefore, we redefined the classification rules based on the analysis of the Great East Japan Earthquake tweets and the tweets for the General Elections to the House of Representatives. We used the new classification rules to reanalyze both types of data. Moreover, we gathered new data from the time of later election to the House of Councilors. We collected all tweets from 4 to 21 July appearing under the hashtag “# Elections” and accordingly analyzed a randomly selected sample of 2000 tweets. We were able to confirm the effectiveness of the re-defined classification rules. In a further investigation into the opinionated contents of primary information tweets, we found out that all those tweets were neutral. However, since some of them contained sesquiary information, which could cause cognitive bias in readers, further post-processing of such cases is necessary.
After estimating the potential of using Twitter as a source of information for decision-making and status determination, we developed a system using Twitter for information triage during major events, such as disasters. To build the system, we compared a number of classifiers, including the proposed one based on Deep Convolutional Neural Networks. We also validated the system by performing an in-depth analysis of information obtained after a number of additional events, including an eruption of a Japanese volcano Ontake on 27 September 2014, as well as heavy rains and typhoons that occurred in 2020. We confirmed that the methods worked sufficiently well even when trained on data from nearly 10 years ago, which strongly suggests that the proposed model is well-generalized and sufficiently grasps important aspects of each type of classified information.
On the basis of the proposed method for automatic extraction of information of high accuracy and uniformity, we used Twitter hashtags to collect messages related to the eruption of the Mt. Ontake volcano.
We found that sesquiary information appeared in large amounts. Moreover, after examining the change of occurrence of information in time, we confirmed that the ratio of information types does change with time. Thus, the classification criteria proposed in the hypothesis were valid.
In the future, we plan to undertake further study of changes in time and changes according to situation (when users are in need of different kinds of information). We also plan to analyze expressions and patterns which indicate changes in user behavior. Finally, we plan to implement those improvements and test the method in practice.


 ,
, 


