Method of Multilevel Adaptive Synthesis of Monitoring Object Knowledge Graphs
Abstract
:1. Introduction
2. Review of Related Works
3. Conceptual Diagram of Multilevel Adaptive Synthesis
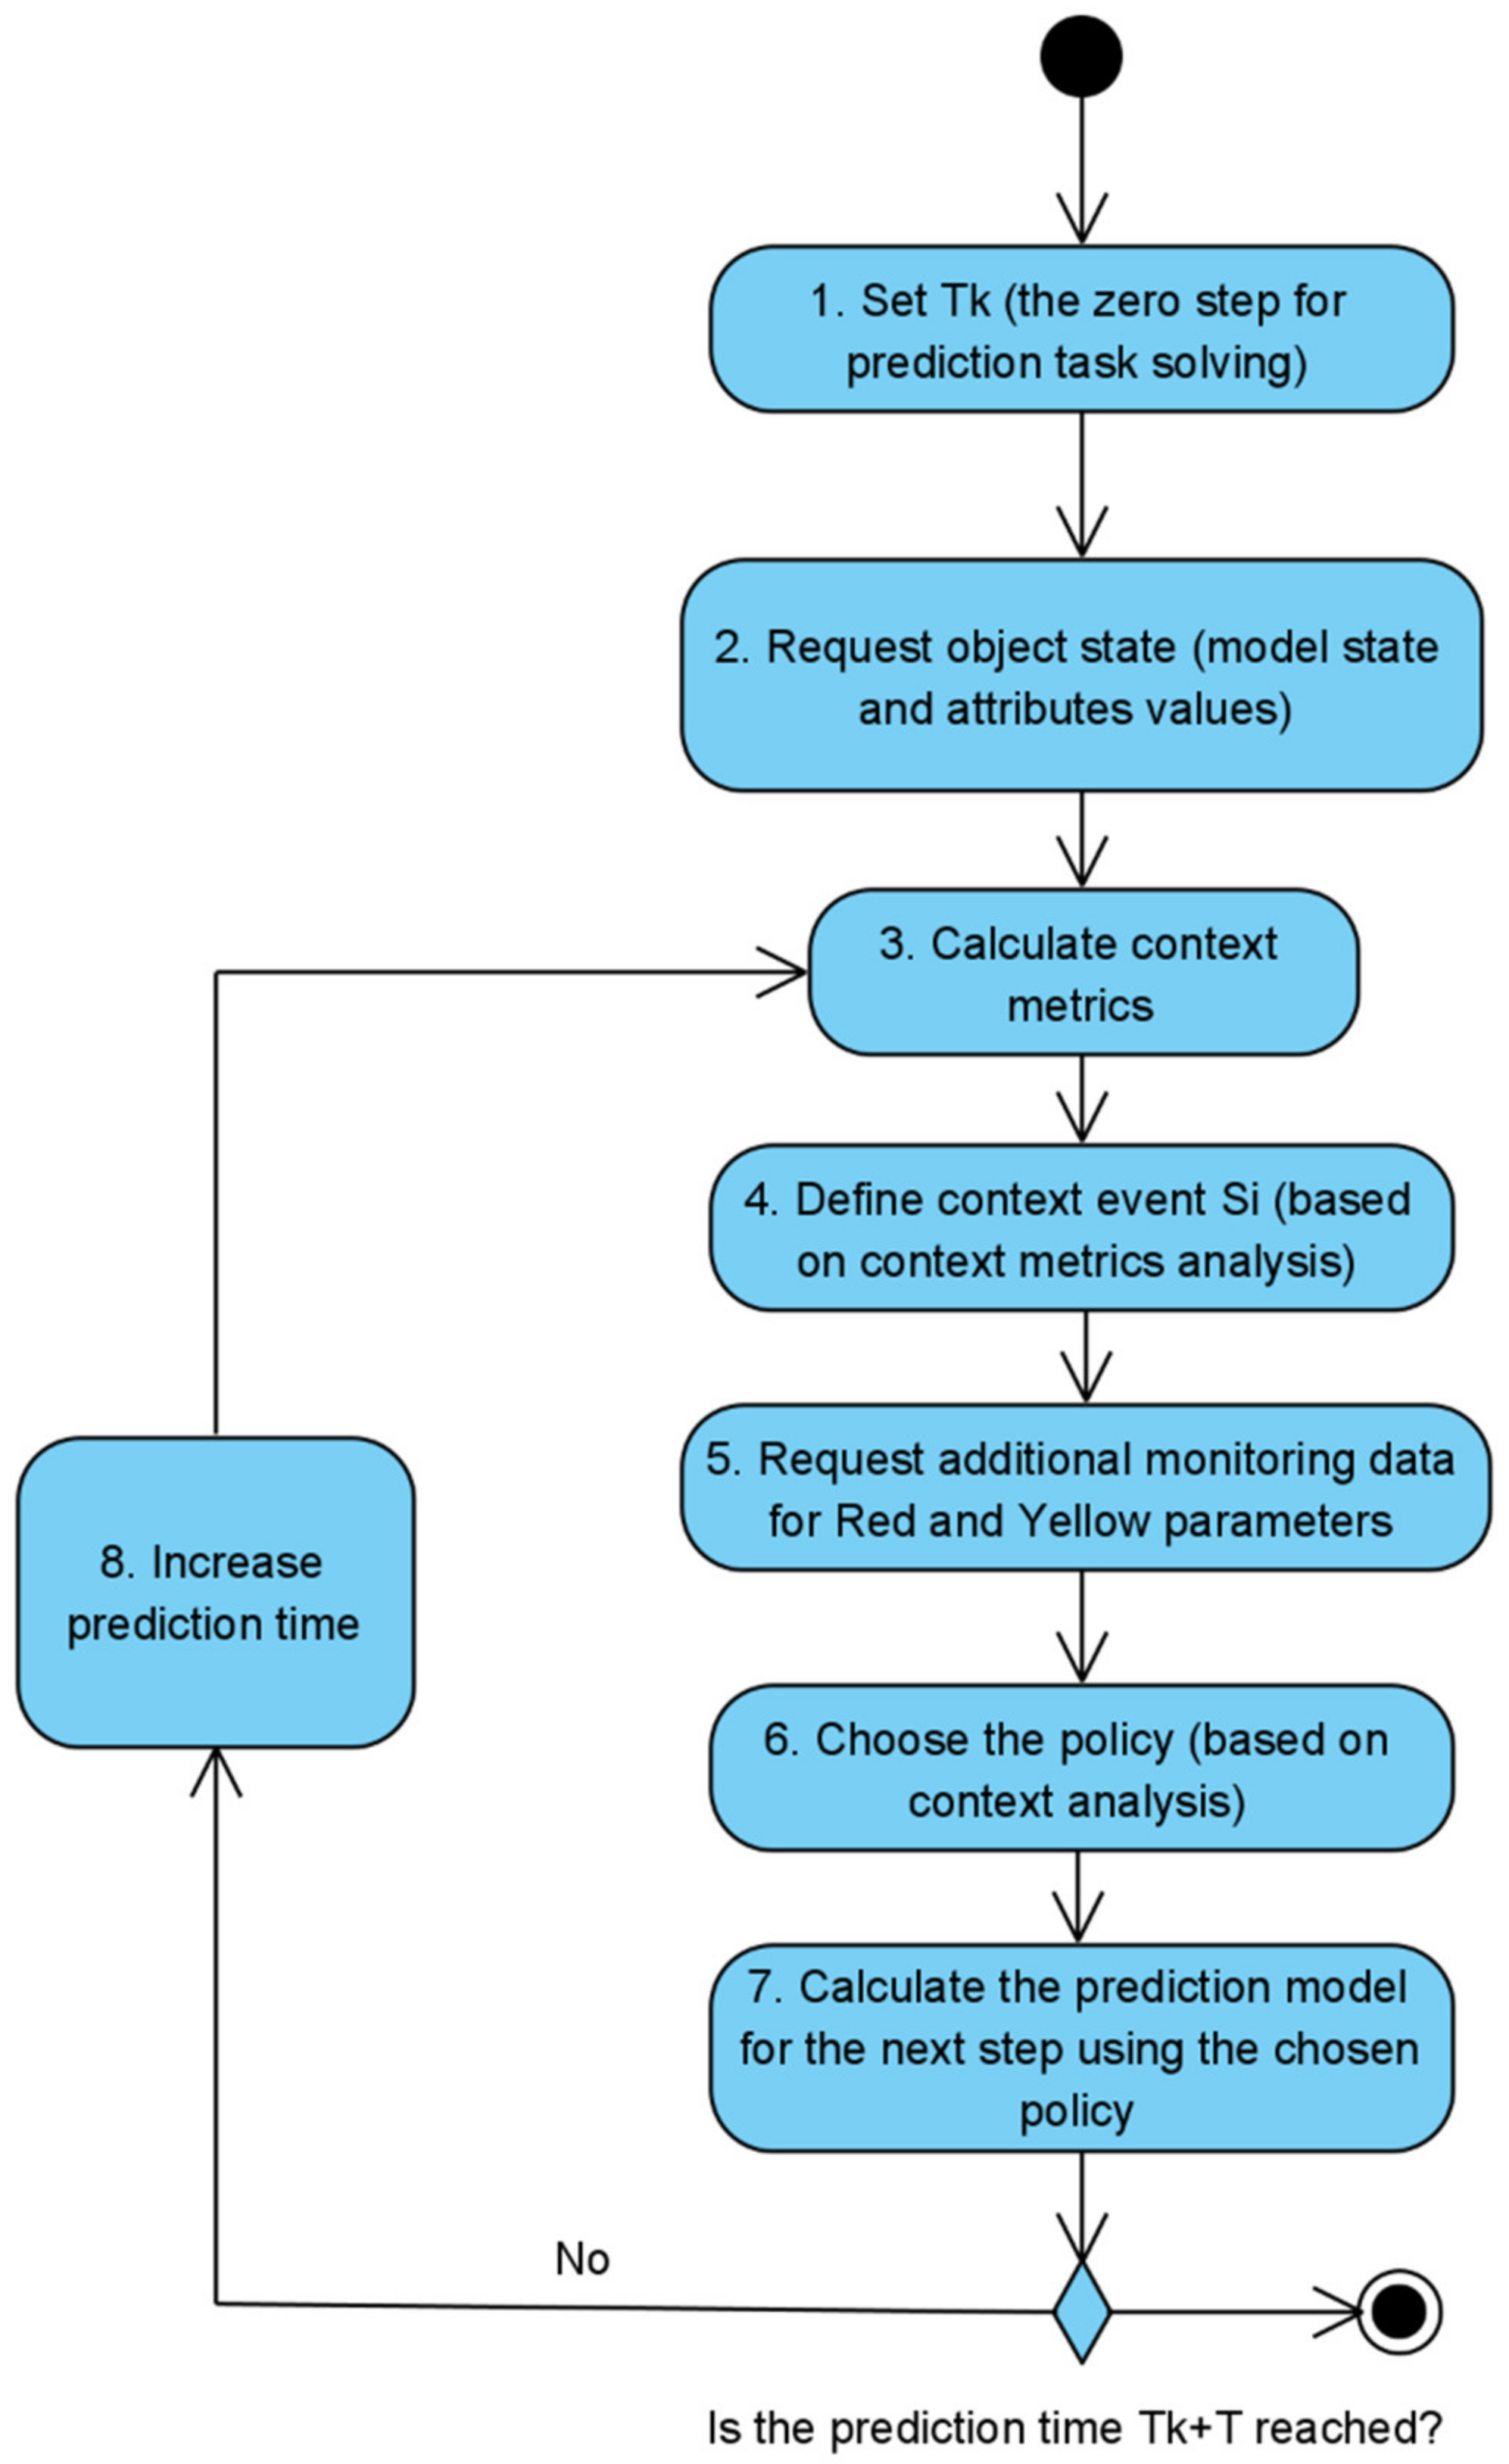
- Determining the policies and rules for changing the attributes of the model nodes and edges over time depending on the context.
- Definition of the object model at the current time point : based on monitoring system data.
- Initiation of the model synthesis in one or more steps.
- Definition of the context (based on the current state of the monitoring object)—.
- Based on the context, choosing a policy for rebuilding the object model synthesis process on the current step.
- Transformation execution . The transformation involves defining the values of the attributes of the nodes and edges of the model.
- If the target point on the timeline has been reached—, the task of searching for the predictive model is considered completed and the results of the prediction are recorded to the knowledge graph in the format of time series (the number of elements of the series corresponds to the number of prediction steps).
- If the target point on the timeline has not been reached—, the current time is increased according to the prediction period and the procedure proceeds with step four—definition of the current context.
- Green range (corresponds to the normal state of the object. All the object elements are functioning properly);
- Yellow range (corresponds to the boundary state of the object. It is required to pay attention to the functioning of one or more elements);
- Red range (faulty state of the object, when it is necessary to urgently take certain actions to return its element or elements to a good state).
4. Adaptive Synthesis Method Description
- The time interval at which the synthesis of the model of the monitoring object is performed [;].
- Synthesis step—.
- Model of the monitored object, in which the values of the attributes at the moment —.
- Policies used for model transformation :.
- Get the policies used for synthesis: , where —the policy related to the context event , —the number of context events.
- Obtain actual rules for synthesis of attribute values of model nodes and edges over time: , where —the number of attributes.
- Determine the current state of the object based on the data provided by the monitoring system at the time moment . Defining the node and edge attribute values of the monitoring object taking into account the three-level gradation of their values: , where —the node identifier, —the number of nodes, , where —the edge identifier, M—the number of edges.
- According to the data received from the monitoring system (step 3), or according to the synthesis results in the previous step (step 8), the definition of the context event .
- Choose the policy based on the defined context event —, where —the rules, connected to the policy, —the number of rules defined for the policy , —a subset of the attributes of nodes and edges, the state of which can change when a context event occurs.
- Using the selected rules, determine the set of acceptable values for nodes and edges at step :as well as define values for parameters of nodes and edges:
- The model of the monitoring object building at the step :
- If , then —the required model is built, otherwise, set the value and go back to Step 4.
5. Algorithm Description
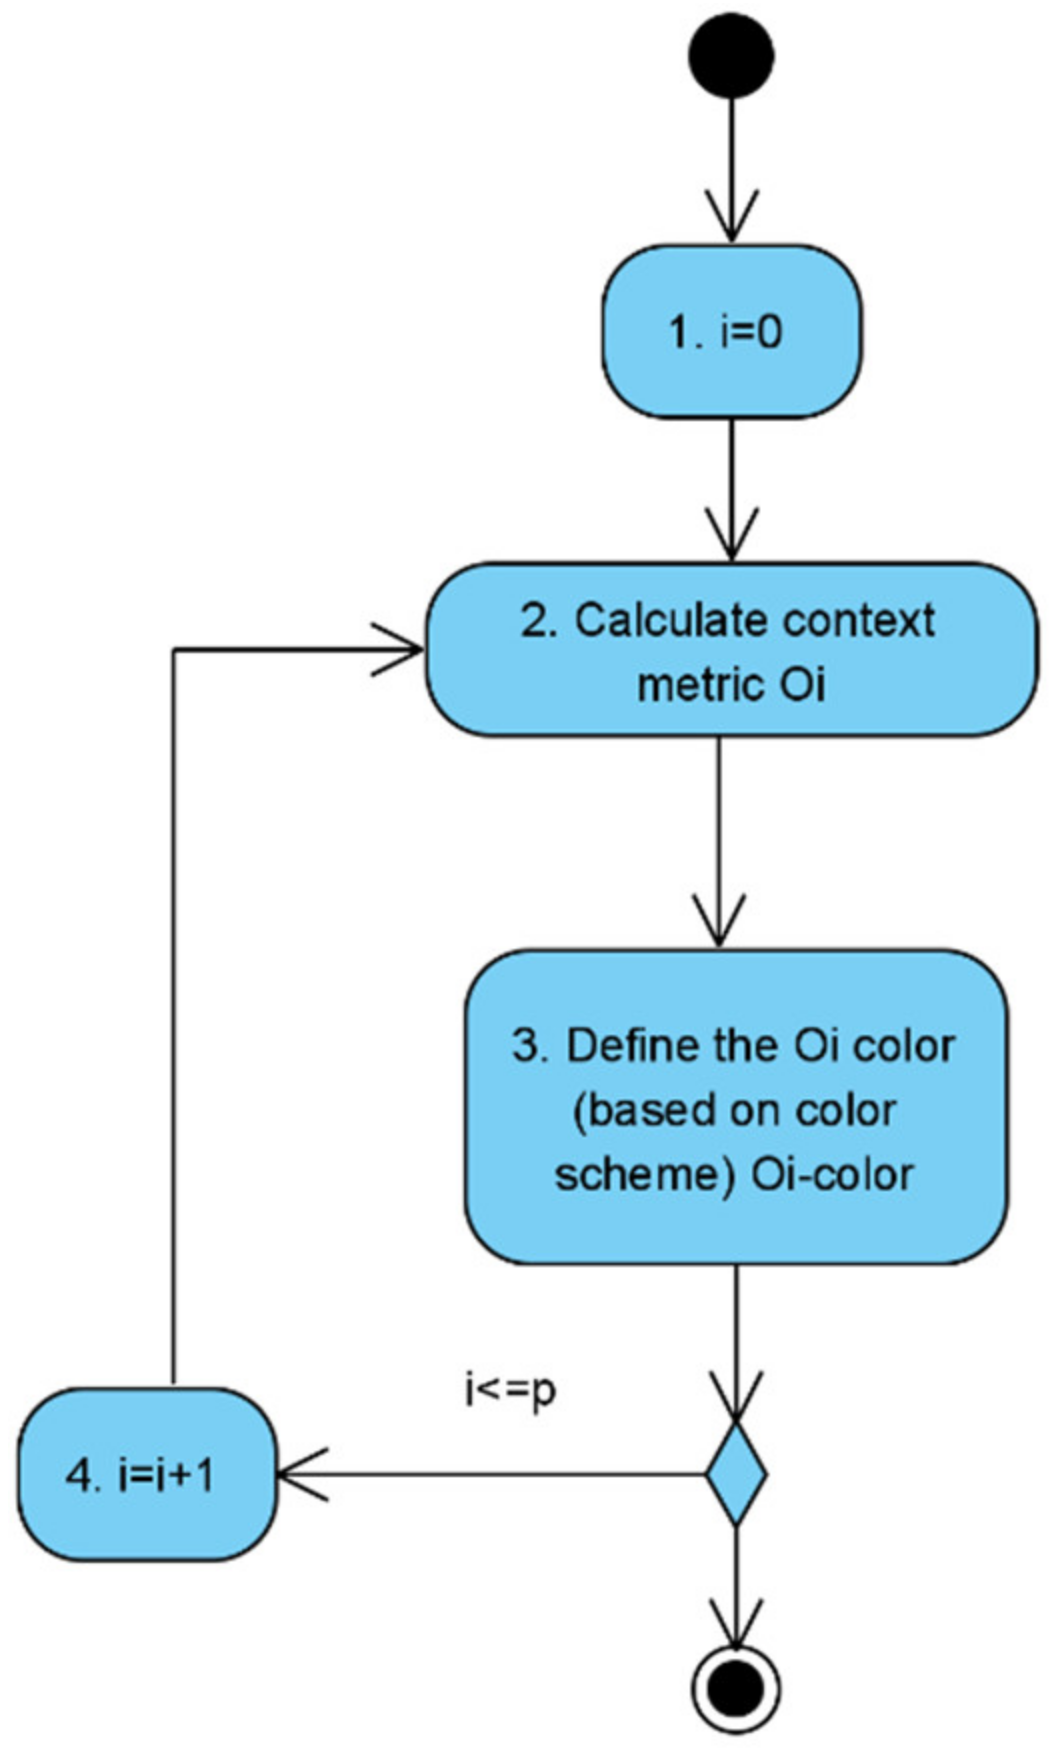
- The context metrics counter is set to zero: .
- The metric of the context is calculated; the metrics of the context are determined through the elements of the model of the monitoring object, the influence is on which context is significant, and by the values, of which it is possible to determine the context of the monitoring object functioning.
- According to the assigned range of values, the color for the context metric is determined:
- Normal operation (green range);
- Borderline Operations (yellow range);
- Abnormal or abnormal operation (red range).
- If there are unconsidered metrics of the context (), the counter of the metrics of the context increases, and a jump to step 2 is performed. Otherwise, it is the end of the algorithm.
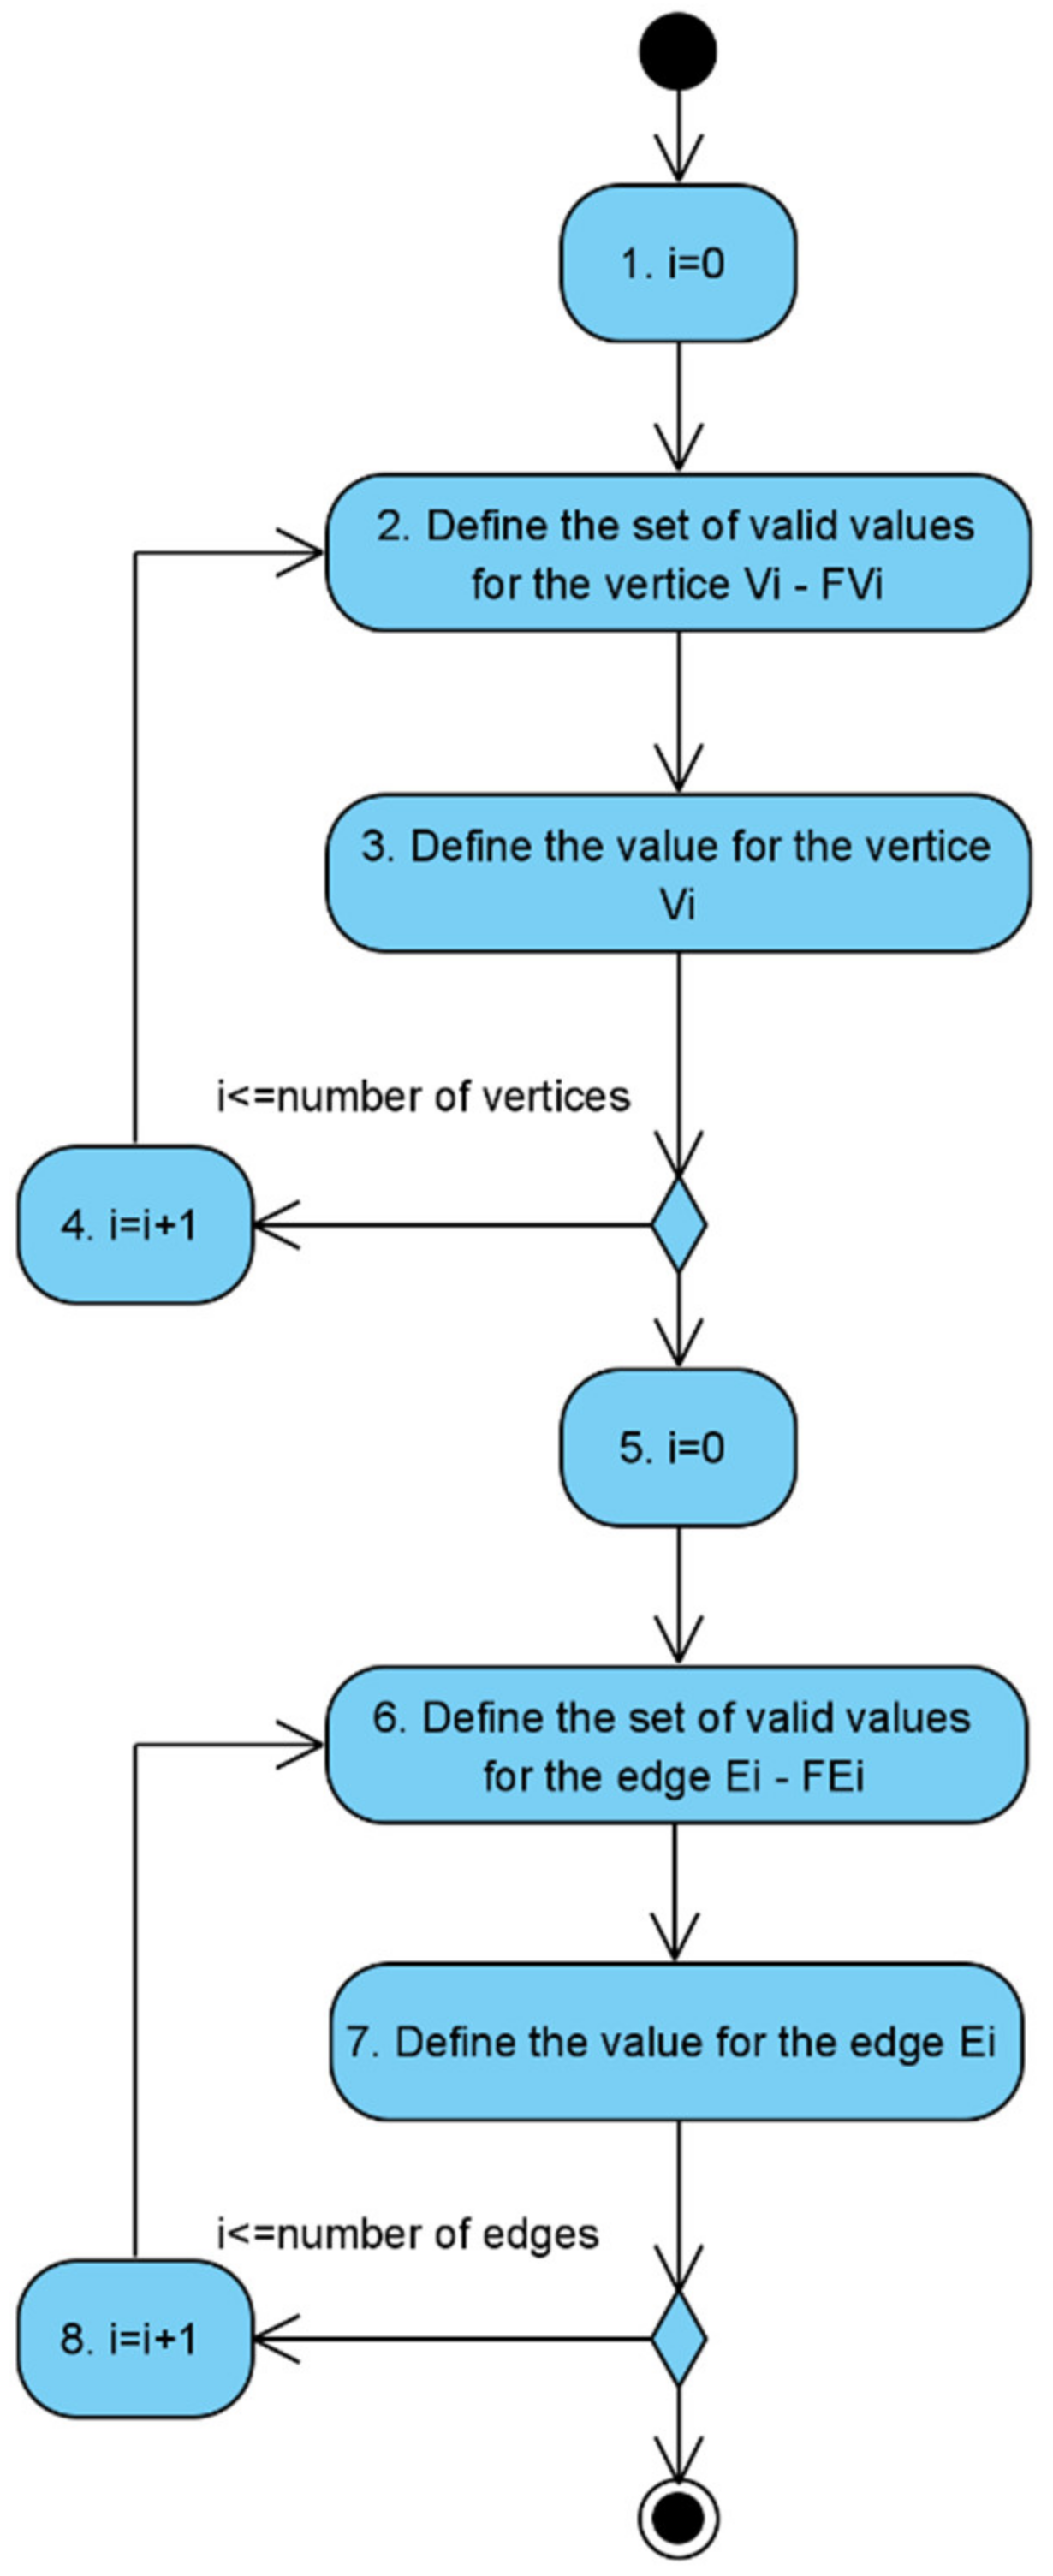
- The counter of the model nodes is set to zero: .
- The range of valid values for the node is calculated. For this, a rule from the policy - is used.
- The value for the node is calculated using the function .
- If there are no considered nodes (), the counter of nodes increases, and a jump to step 2 is performed. Otherwise, to step 5.
- The counter of the edges of the model is set to zero: .
- The range of valid values for the edge is calculated. For this, a rule from the policy - is used.
- Calculate the value for the edge using the function or depending on the type of edge (vertical or horizontal).
- If there are unconsidered edges (), the counter of edges is incremented; go to step 6. Otherwise, it is the end of the algorithm.
| Algorithm 1 Adaptive Prediction of Complex Object State Method |
| //Init Set //Set —initial current timestamp for prediction algorithm Set //Get initial object state. Description of the function is out of article scope. Set //Get initial attributes values. Description of the function is out of article scope. //The main prediction cycle while () { Set //Function for calculating context metrics. Set //Function for defining the current context event based on choosing the nearest event in context metrics perspective. DefineRedYellowParameters( //Define subsets of the object parameters from Red and Yellow bands—. Set //Get additional attributes values. Description of the function is out of article scope. Set = getPolicy(S) //Get policy for the next step processing Set //Calculate the object state for the next step Set //Calculate the attributes values for the next step Set //Go to the next step } End |
6. Computational Complexity of the Adaptive Multilevel Deductive Synthesis Algorithm
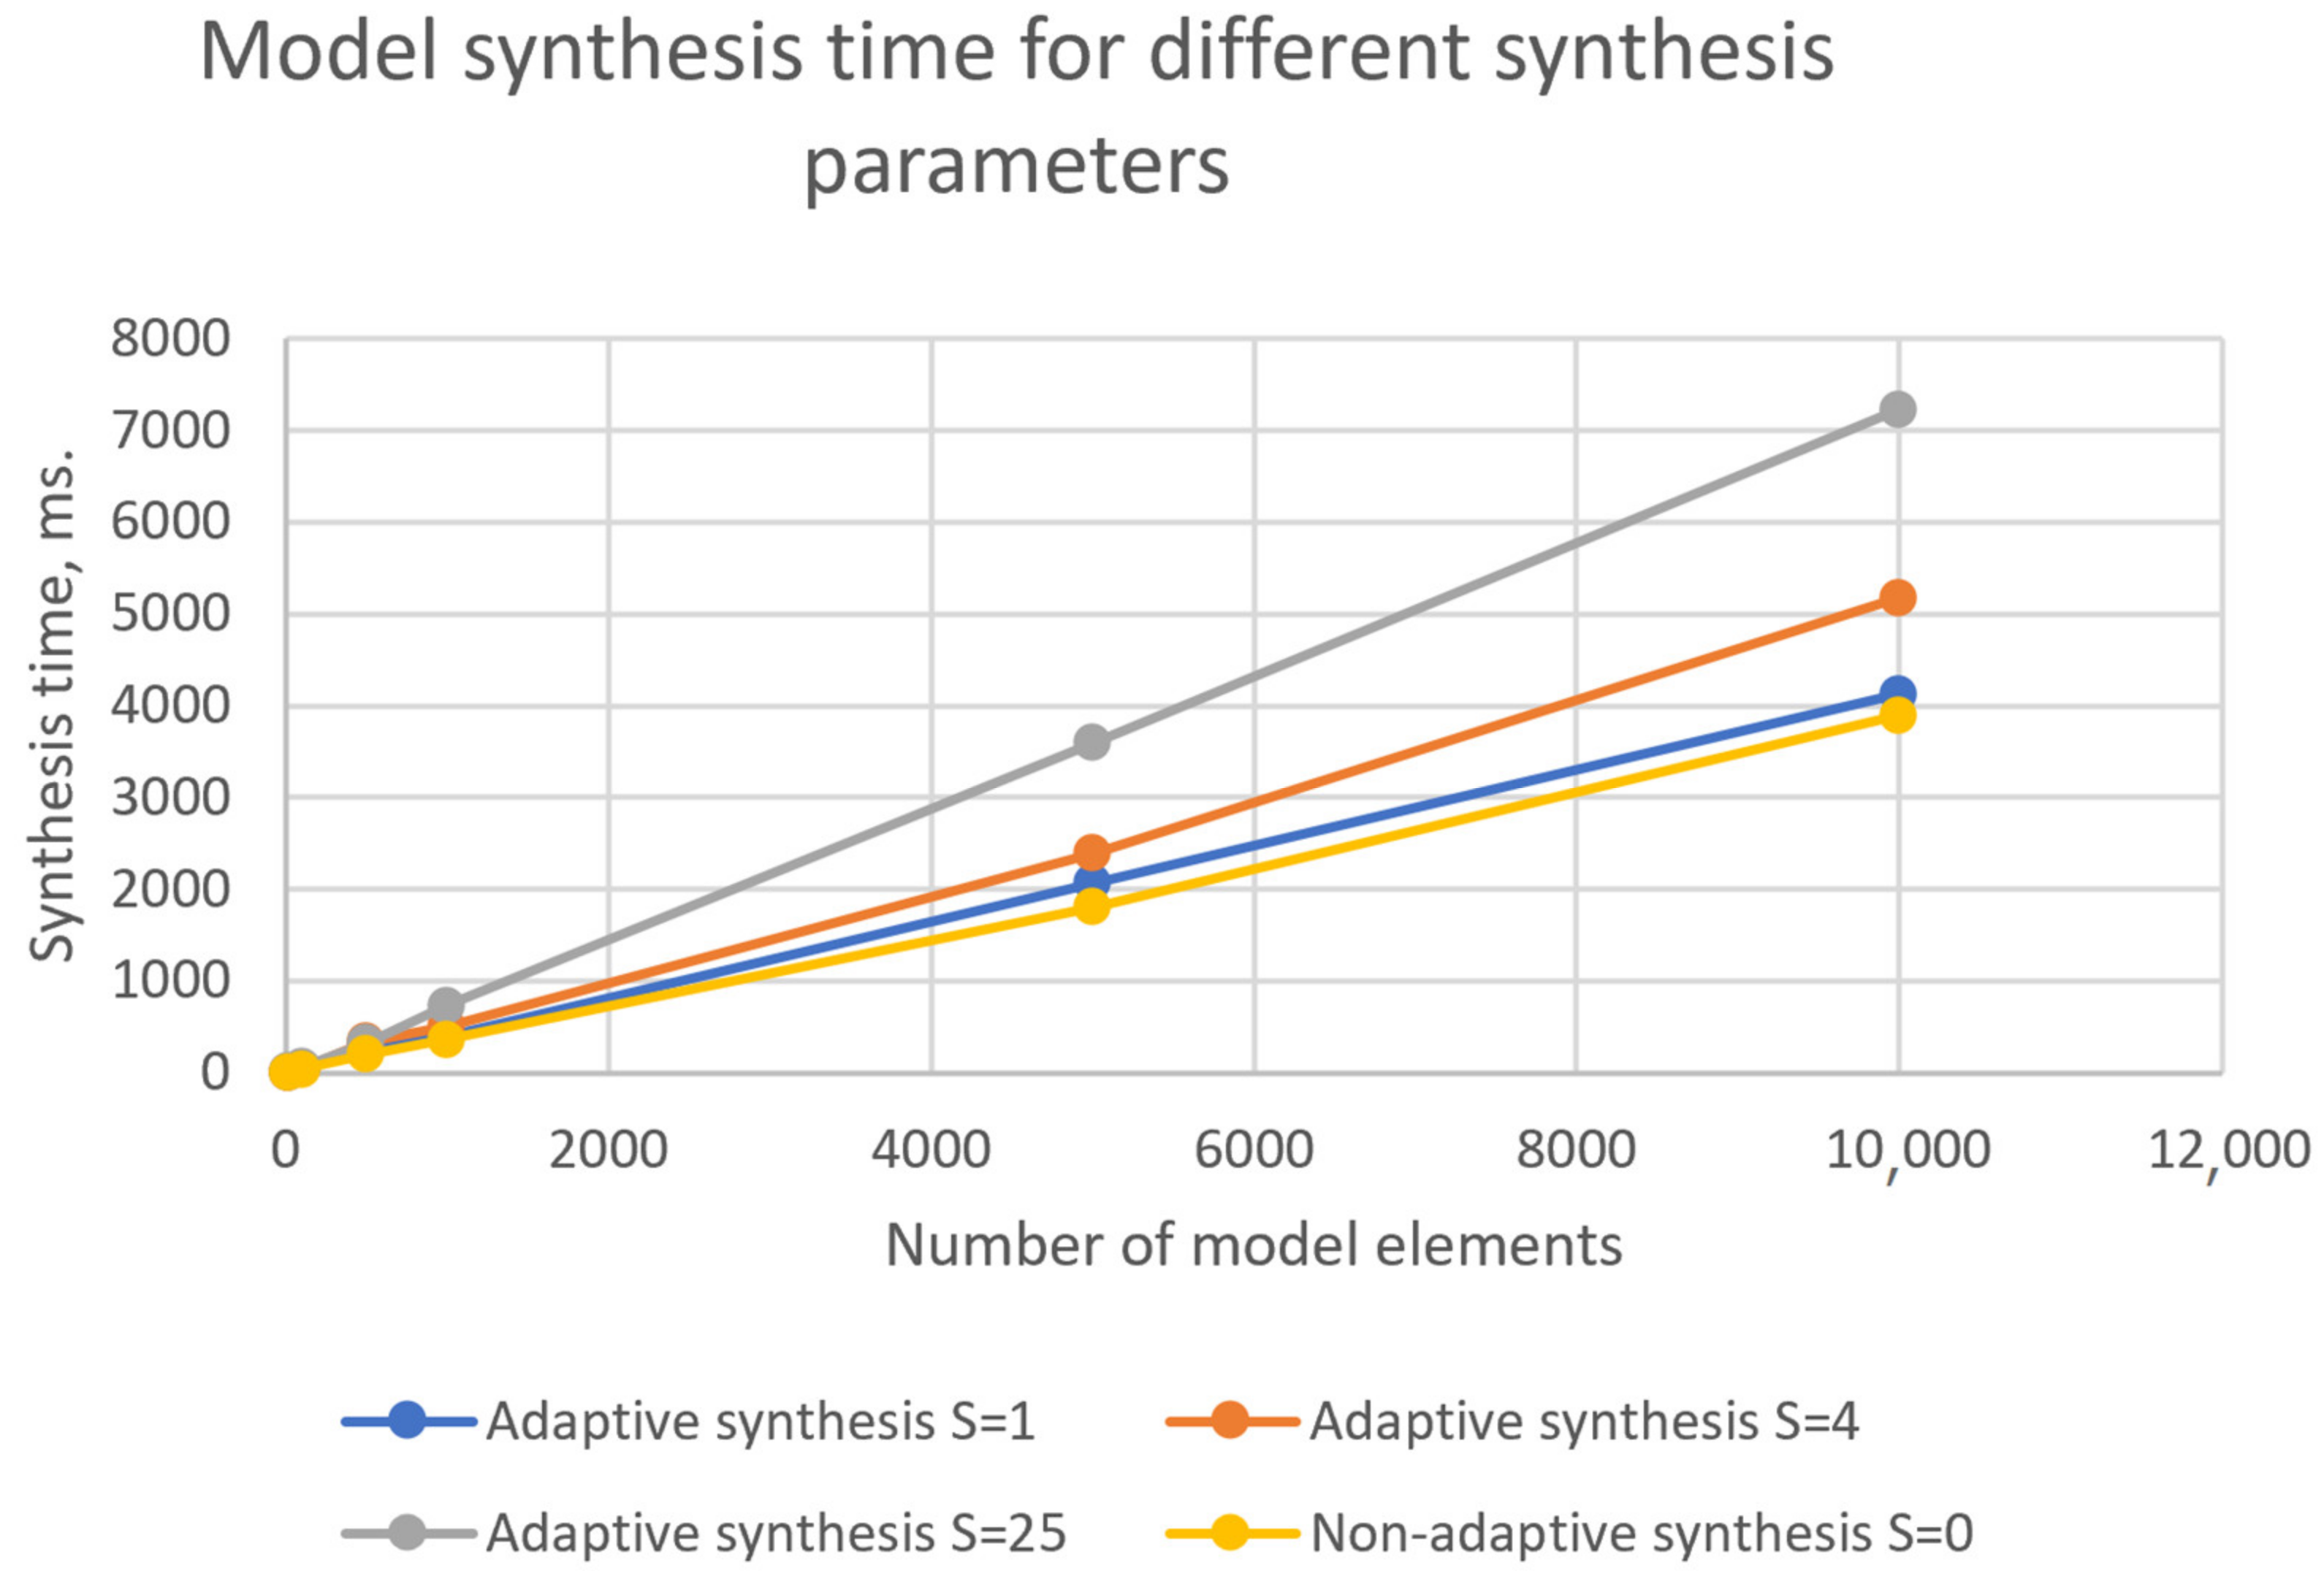
- Non-adaptive synthesis (S = 0);
- Adaptive synthesis, the number of context events S = 1;
- Adaptive synthesis, the number of context events S = 4;
- Adaptive synthesis, the number of context events S = 25.
7. The Structure of a Software System for Multilevel Adaptive Synthesis of Object Models
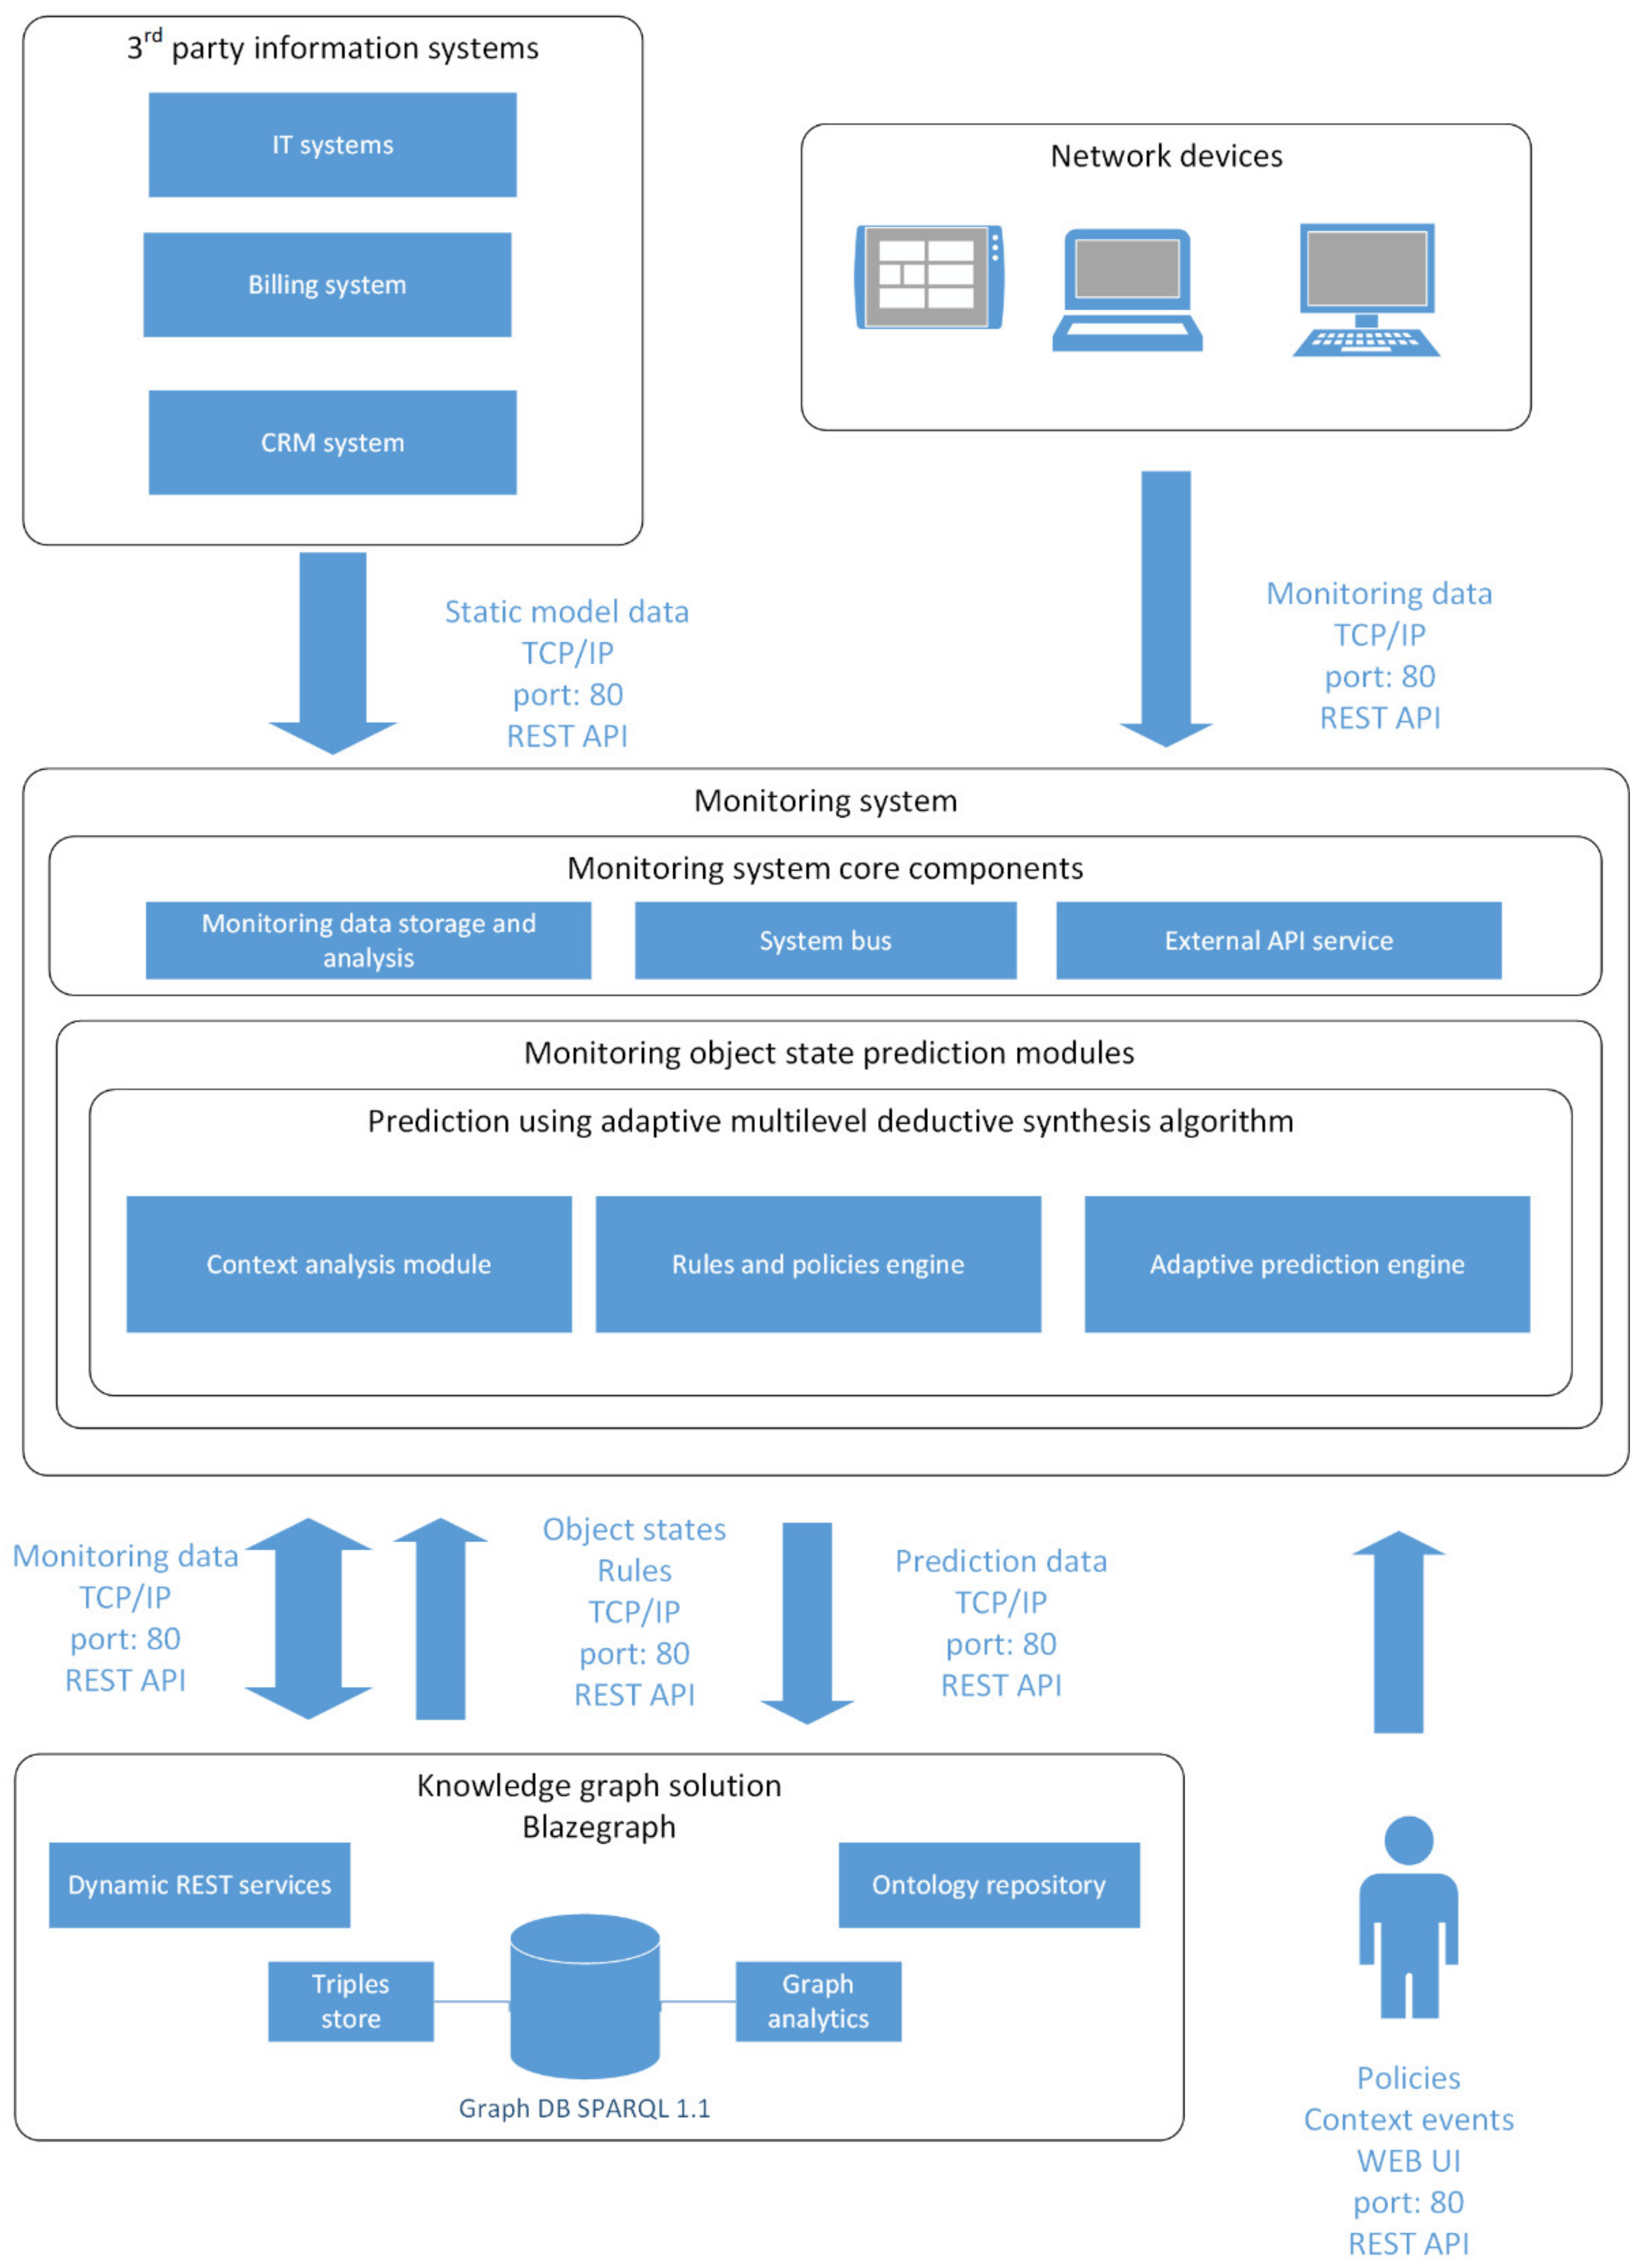
- The monitoring system core components, which include:
- Module of monitoring data storage and analysis.
- System bus.
- External API services.
- Knowledge graph, which includes:
- SPARQL 1.1 compliant RDF data storage. This component is the key element of the solution holding knowledge graph triples (static and dynamic components), and supporting the functions of adding/removing triples and searching in the RDF storage. The storage also includes a data analytics module. It stores both static and dynamic graph data.
- A dynamic REST service that supports API for interaction with external systems, in particular, with the monitoring system core.
- Operator IT systems, which provide static data for the model. The following operator IT systems are considered:
- IT system for network infrastructure management that provides data on the network topology, network devices, network services, network applications, accessible data, and access rights.
- A billing system that provides data on users, their devices, personal accounts, tariffs and payments.
- CRM systems that provide data on the history of operator-user interaction.
- The module of prediction using an adaptive multilevel adaptive synthesis algorithm, including:
- Context analysis module, which allows define the current context event.
- Rules and policies engine, which is used to define policies and rules for each prediction step.
- Adaptive prediction engine, which creates prediction nodes in the RDF/XML format and deploys them to the knowledge graph.
8. Case Study
8.1. Task
8.2. Initial Models of the Monitoring Object
- Model of subscriber devices, describing their state and behavior in terms of hours per day and working/non-working days.
- Statistical model of the movement of mobile devices between the coverage areas of routers, in terms of hours per day and working/non-working days.
- Static crash model for routers when the aggregate traffic exceeds the limit.
- Three ranges for the values of the total traffic on the router at a point in time—normal traffic (green zone), increased traffic (yellow zone, when all requests are processed, but there is not enough performance margin), and critical traffic (some or all requests cannot be processed).
- Three ranges for the number of mobile devices registered on the router at a time—normal number (green zone), increased number (yellow zone, when all requests from devices are processed, but the performance margin is not enough) and critical number (part of requests from devices or all, cannot be processed).
8.3. Proposed Solution
8.4. Task Solution
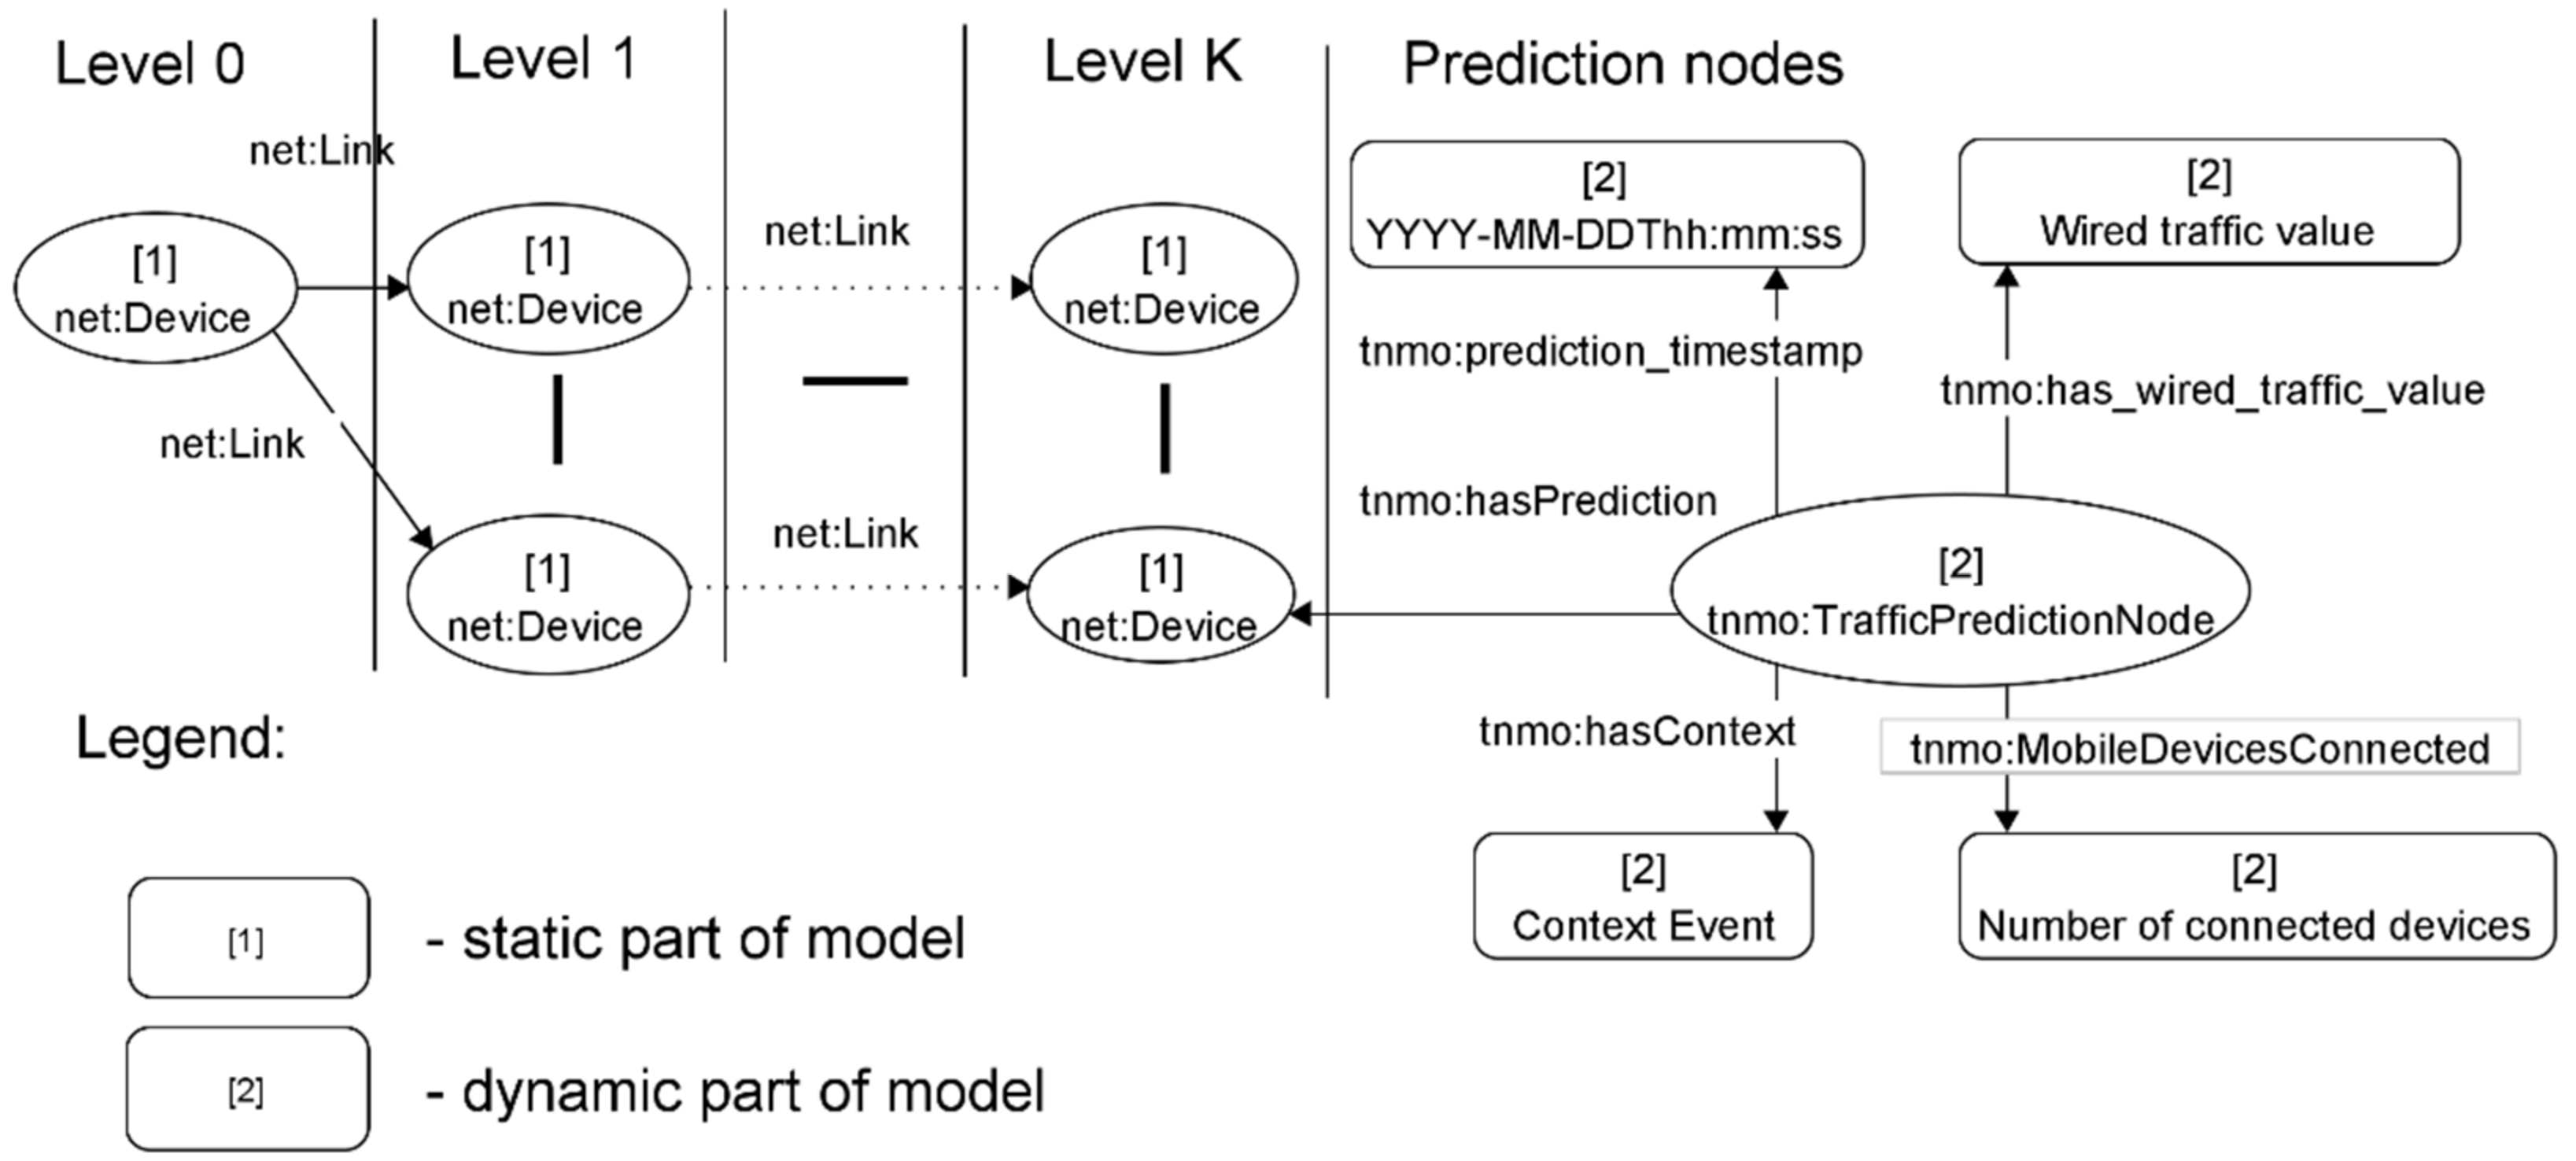
- tnmo: prediction_timestamp—prediction timestamp;
- tnmo: has Context—context event that determines which policy is selected for the prediction;
- tnmo: has_wired_traffic_value—incoming traffic from stationary user devices at the moment of the prediction timestamp;
- tnmo: MobileDevicesConnected—number of open connections to user mobile network devices.
- In order to solve the present task, when calculating the traffic from mobile devices—the average daily traffic value of an active mobile device is used. This approach simplifies the implementation of the algorithm and, at the same time, it does not interfere with the achievement of the goals of the experiment being carried out.
- Only daily rules are used to determine traffic fluctuations and the number of connected devices, as fluctuations within a week will differ only within a day value, depending on the working/non-working day. This limitation does not affect the representativeness of the experiment performed.
- For the rules, it is assumed that the traffic and the number of connected mobile devices are subject to normal distribution and are set for each time interval by their average values and standard deviations.
| POLICY_ID | RULE_ID | ACTION |
| S1 | 1 | aggregation |
| S2 | 1 | aggregation |
| S2 | 2 | collection |
| S3 | 1 | aggregation |
| S3 | 2 | overload |
| S3 | 3 | collection |
| S4 | 1 | aggregation |
| S4 | 2 | failure |
| S4 | 3 | collection |
| INTERVAL_ID | PARAMETER | MEAN | DEVIATION |
| 00 | traffic | 1000 | 25 |
| 00 | devices | 500 | 12 |
| 01 | traffic | 700 | 11 |
| 01 | devices | 400 | 50 |
| Request #1 (normal functioning of router) PREFIX rdf: <http://www.w3.org/1999/02/22-rdf-syntax-ns#> PREFIX rdfs: <http://www.w3.org/2000/01/rdf-schema#> PREFIX net: <http://purl.org/toco/> Prefix tnmo: <http://127.0.0.1/tnmo#> SELECT * WHERE { ?Predictions tnmo:hasPrediction ?UserDevices. ?Predictions tnmo:prediction_timestamp ?Timestamp. ?Predictions tnmo:has_wired_traffic_value ?Traffic. ?Predictions tnmo:MobileDeviceConnected ?Devices. ?Predictions tnmo:hasContext ?Context. FILTER(STRSTARTS(?Context, “S1”)) } LIMIT 2 Response: | |||||
| Predictions | UserDevices | Timestamp | Traffic | Devices | Context |
| <http://127.0.0.1/Prediction_1/> | <http://127.0.0.1/User_device_4/> | 2021-04-29T01:00:00 | 710.9228508805083 | 329 | S1/[] |
| <http://127.0.0.1/Prediction_10/> | <http://127.0.0.1/User_device_4/> | 2021-04-29T10:00:00 | 727.330546586905 | 491 | S1/[] |
9. Conclusions
Author Contributions
Funding
Institutional Review Board Statement
Informed Consent Statement
Data Availability Statement
Conflicts of Interest
References
- Kotseruba, I.; Tsotsos, J.K. 40 years of cognitive architectures: Core cognitive abilities and practical applications. Artif. Intell. Rev. 2018, 52, 1–78. [Google Scholar] [CrossRef] [Green Version]
- Osipov, V.; Nikiforov, V.; Zhukova, N.; Miloserdov, D. Urban traffic flows forecasting by recurrent neural networks with spiral structures of layers. Neural Comput. Applic. 2020, 32, 14885–14897. [Google Scholar] [CrossRef]
- Osipov, V.; Lushnov, M.; Stankova, E.; Vodyaho, A.; Shichkina, Y.; Zhukova, N. Automatic Synthesis of Multilevel Automata Models of Biological Objects. In Proceedings of the International Conference on Computational Science and Its Applications (ICCSA 2019), Saint Petersburg, Russia, 1–4 July 2019; Springer: Cham, Switzerland, 2019; pp. 441–456. [Google Scholar]
- Osipov, V.; Vodyaho, A.; Zhukova, N.; Glebovsky, P. Multilevel Automatic Synthesis of Behavioral Programs for Smart Devices. In Proceedings of the Control, Artificial Intelligence, Robotics & Optimization (ICCAIRO 2017), Prague, Czech Republic, 20–22 May 2017; pp. 335–340. [Google Scholar]
- Cardoso, S.D.; da Silveira, M.; Pruski, C. Construction and exploitation of an historical knowledge graph to deal with the evolution of ontologies. Knowl. Based Syst. 2020, 194, 105508. [Google Scholar] [CrossRef]
- Malik, K.M.; Krishnamurthy, M.; Alobaidi, M.; Hussain, M.; Alam, F.; Malik, G. Automated domain-specific healthcare knowledge graph curation framework: Subarachnoid hemorrhage as phenotype. Expert Syst. Appl. 2020, 145, 113120. [Google Scholar] [CrossRef]
- Liang, Y.; Xu, F.; Zhang, S.H.; Lai, Y.-K.; Mu, T. Knowledge graph construction with structure and parameter learning for indoor scene design. Comp. Vis. Media 2018, 4, 123–137. [Google Scholar] [CrossRef] [Green Version]
- Martinez-Rodriguez, J.L.; Lopez-Arevalo, I.; Rios-Alvarado, A.B. OpenIE-based approach for Knowledge Graph construction from text. Expert Syst. Appl. 2018, 113, 339–355. [Google Scholar] [CrossRef]
- Nguyen, H.L.; Jung, J.J. Social event decomposition for constructing knowledge graph. Future Gener. Comput. Syst. 2019, 100, 10–18. [Google Scholar] [CrossRef]
- Krinkin, K.; Vodyaho, A.; Kulikov, I.; Zhukova, N. Models of Telecommunications Network Monitoring Based on Knowledge Graphs. In Proceedings of the 9th Mediterranean Conference on Embedded Computing (MECO), Budva, Montenegro, 8–11 June 2020; pp. 1–7. [Google Scholar] [CrossRef]
- Kulikov, I.; Wohlgenannt, G.; Shichkina, Y.; Zhukova, N. An Analytical Computing Infrastructure for Monitoring Dynamic Networks Based on Knowledge Graphs. In Lecture Notes in Computer Science, Proceedings of the Computational Science and Its Applications–ICCSA 2020, Caligary, Italy, 1–4 July 2020; Gervasi, O., Murgante, B., Misra, S., Garau, C., Blečić, I., Taniar, D., Apduhan, B.O., Rocha, A.M.A.C., Tarantino, E., Torre, C.M., et al., Eds.; Springer: Cham, Switzerland, 2020; Volume 12254. [Google Scholar] [CrossRef]
- Krinkin, K.; Kulikov, I.; Vodyaho, A.; Zhukova, N. Prediction of Telecommunication Network State Based on Knowledge Graphs. In Proceedings of the 28th Conference of Open Innovations Association (FRUCT), Moscow, Russia, 27–29 January 2021; pp. 200–207. [Google Scholar] [CrossRef]
- Long, J.; Chen, Z.; He, W.; Wu, T.; Ren, J. An integrated framework of deep learning and knowledge graph for prediction of stock price trend: An application in Chinese stock exchange market. Appl. Soft Comput. 2020, 91, 106205. [Google Scholar] [CrossRef]
- Mao, Q.; Li, X.; Peng, H.; Li, J.; He, D.; Guo, S.; He, M.; Wang, L. Event prediction based on evolutionary event ontology knowledge. Future Gener. Comput. Syst. 2021, 115, 76–89. [Google Scholar] [CrossRef]
- Tempelmeier, N.; Demidova, E. Linking OpenStreetMap with knowledge graphs—Link discovery for schema-agnostic volunteered geographic information. Future Gener. Comput. Syst. 2021, 116, 349–364. [Google Scholar] [CrossRef]
- Shi, D.; Wang, T.; Xing, H.; Xu, H. A learning path recommendation model based on a multidimensional knowledge graph framework for e-learning. Knowl. Based Syst. 2020, 195, 105618. [Google Scholar] [CrossRef]
- Lu, W.; Altenbek, G. A recommendation algorithm based on fine-grained feature analysis. Expert Syst. Appl. 2021, 163, 113759. [Google Scholar] [CrossRef]
- Shao, B.; Li, X.; Bian, G. A survey of research hotspots and frontier trends of recommendation systems from the perspective of knowledge graph. Expert Syst. Appl. 2021, 165, 113764. [Google Scholar] [CrossRef]
- Wang, H.; Wang, Z.; Hu, S.; Xu, X.; Chen, S.; Tu, Z. DUSKG: A fine-grained knowledge graph for effective personalized service recommendation. Future Gener. Comput. Syst. 2019, 100, 600–617. [Google Scholar] [CrossRef]
- Yang, Z.; Dong, S. HAGERec: Hierarchical Attention Graph Convolutional Network Incorporating Knowledge Graph for Explainable Recommendation. Knowl. Based Syst. 2020, 204, 106194. [Google Scholar] [CrossRef]
- Sang, L.; Xu, M.; Qian, S.; Wu, X. Knowledge graph enhanced neural collaborative recommendation. Expert Syst. Appl. 2021, 164, 113992. [Google Scholar] [CrossRef]
- Tianxing, M.; Osipov, V.Y.; Vodyaho, A.I.; Kalmatskiy, A.; Zhukova, N.A.; Lebedev, S.V.; Shichkina, Y.A. Reconfigurable monitoring for telecommunication networks. PeerJ Comput. Sci. 2020, 6. [Google Scholar] [CrossRef] [PubMed]
- Zhukova, N.A. General and Specific Problems of Multilevel Synthesis of Models of Monitoring Objects. Autom. Doc. Math. Linguist. 2019, 53, 315–321. [Google Scholar] [CrossRef]
- Vert, G.; Iyengar, S.S.; Phoha, V.V. Introduction to Contextual Processing: Theory and Applications, 1st ed.; Chapman and Hall/CRC: Boca Raton, FL, USA, 2010. [Google Scholar] [CrossRef]
- Serrano, J.M. Applied Ontology Engineering in Cloud Services, Networks and Management Systems; Springer: New York, NY, USA, 2012; Available online: https://books.google.ru/books?id=X8ZBiRXwV0gC (accessed on 5 July 2021).
- Brézillon, P.; Pomerol, J.-C. Contextual knowledge and proceduralized context. In Proceedings of the AAAI Workshop on Modeling Context in AI Applications, Orlando, FL, USA, July 18–19; pp. 16–20, ⟨hal-01574756⟩.
- Smirnov, A.V.; Pashkin, M.P.; Shilov, N.G.; Levashova, T.V.; Kashevnik, A.M. Context-aware decision support in distributed information environment. Informatsionnye Tekhnologii i Vychslitel’nye Sistemy 2009, 38–48. [Google Scholar]
- Liu, H.; Gegov, A.; Haig, E. Rule Based Systems for Big Data: A Machine Learning Approach; Springer: Cham, Switzerland, 2016. [Google Scholar] [CrossRef] [Green Version]
- Bellini, P.; Nesi, P. Performance assessment of RDF graph databases for smart city services. J. Vis. Lang. Comput. 2018, 45, 24–38. [Google Scholar] [CrossRef]
- Bizer, C.; Schultz, A. The Berlin SPARQL benchmark. Int. J. Semant. Web Inf. Syst. 2009, 5, 1–24. [Google Scholar] [CrossRef] [Green Version]
- GitHub Repository. Available online: https://github.com/kulikovia/INTELS-2021 (accessed on 5 July 2021).
- RDF. Available online: https://www.w3.org/RDF (accessed on 5 July 2021).
- RDFS. Available online: https://www.w3.org/TR/rdf-schema (accessed on 5 July 2021).
- OWL. Available online: https://www.w3.org/OWL (accessed on 5 July 2021).


| Context Event | Description | Assessment Parameters for the Monitoring System Side |
|---|---|---|
| Normal operation | Traffic—green zone Number of registered mobile devices—green zone Emergency situation—no | |
| Increased load | Traffic—yellow zone Number of registered mobile devices—yellow zone Emergency situation—no | |
| Overload | Traffic—red zone (below the threshold value) Number of registered mobile devices—yellow or red zone Emergency situation—no | |
| Emergency | Traffic—red zone (above the threshold value) Number of registered mobile devices—any value Emergency situation—yes |
| Policy | Policy Description |
|---|---|
| Rule 1: Aggregate traffic from devices according to hourly/daily rules. No additional operations are required. | |
| Rule 1: Aggregate traffic from devices according to hourly/daily rules. Rule 2: Receive additional monitoring parameters from devices that are at the lower levels of the hierarchy and record these parameters in the monitoring system. | |
| Rule 1: Aggregate traffic from devices according to hourly/daily rules. Rule 2: Record network overload state. Part of the requests from user devices will not be processed by the system. Traffic and number of connected devices will be restricted to the lower limit of the red zone. Rule 3: Receive additional monitoring parameters from devices that are at the lower levels of the hierarchy and record these parameters in the monitoring system. | |
| Rule 1: Aggregate traffic from devices according to hourly/daily rules. Rule 2: Record the emergency situation on the router. Reset the traffic and the number of connected devices if the emergency limit is exceeded. Rule 3: Receive additional monitoring parameters from devices that are at the lower levels of the hierarchy and record these parameters in the monitoring system. |
| Parameter | Green Zone | Yellow Zone | Red Zone |
|---|---|---|---|
| Incoming traffic | 0–0.8 Gb/s | 0.8–1.0 Gb/s | 1.0–1.5 Gb/s |
| Number of open connections to mobile devices | 0–500 | 500–800 | 800–850 |
| Emergency situation | Incoming traffic > 1.5 Gb/s Number of open connections to mobile devices > 850 | ||
Publisher’s Note: MDPI stays neutral with regard to jurisdictional claims in published maps and institutional affiliations. |
© 2021 by the authors. Licensee MDPI, Basel, Switzerland. This article is an open access article distributed under the terms and conditions of the Creative Commons Attribution (CC BY) license (https://creativecommons.org/licenses/by/4.0/).
Share and Cite
Krinkin, K.; Vodyaho, A.; Kulikov, I.; Zhukova, N. Method of Multilevel Adaptive Synthesis of Monitoring Object Knowledge Graphs. Appl. Sci. 2021, 11, 6251. https://doi.org/10.3390/app11146251
Krinkin K, Vodyaho A, Kulikov I, Zhukova N. Method of Multilevel Adaptive Synthesis of Monitoring Object Knowledge Graphs. Applied Sciences. 2021; 11(14):6251. https://doi.org/10.3390/app11146251
Chicago/Turabian StyleKrinkin, Kirill, Alexander Vodyaho, Igor Kulikov, and Nataly Zhukova. 2021. "Method of Multilevel Adaptive Synthesis of Monitoring Object Knowledge Graphs" Applied Sciences 11, no. 14: 6251. https://doi.org/10.3390/app11146251
APA StyleKrinkin, K., Vodyaho, A., Kulikov, I., & Zhukova, N. (2021). Method of Multilevel Adaptive Synthesis of Monitoring Object Knowledge Graphs. Applied Sciences, 11(14), 6251. https://doi.org/10.3390/app11146251


