1. Introduction
The development of automation, robotics, and digital technologies is determined by the global development of the economy and individual industries, but also by the emerging technological and social trends. Three-dimensional printing as part of additive production constitutes an integral part of the concept behind Industry 4.0, the essence of which lies in the automation and digitization of production processes and systems. From the historical perspective, the concept of 3D printing appears in the 1980s, when a paper was published [
1] describing a functional system of rapid prototyping using photopolymers. A layer-by-layer model was created using this system, with each layer corresponding to a cross-section of the model itself. At present, the technology of 3D printing is advancing, as evidenced by the amount of research published in various globally recognized journals. Particular attention is paid to the issue of assessing the properties of materials used in the fused deposition modeling (in short FDM) technology, in its analysis and rationalization [
2,
3,
4,
5,
6,
7]. In their contribution, the authors Cwikla et al. [
8] describe the research of the influence of the infill density, the filling pattern, and the temperature during printing on the mechanical properties of the commonly used ABS material. Conclusions were drawn from the research providing information about the recommended print settings. A similar issue is described in research [
9,
10,
11,
12,
13], where the properties and behavior of the ABS-like material were described. This material was subsequently compared also with the PLA material in the paper by the authors Oviedo et al. [
14], where dimensional deviations of the samples were defined within the tolerances defined by standard test protocols. A comparison of the behavior of materials conventionally used in additive production has also been described by the authors [
15,
16,
17,
18,
19].
Thanks to several advantages, more and more polymer-based materials are being produced using FDM technology. The popularity is amplified by the price-to-size ratio of production units. Heated printer extruder head melts filament and deposit it on the growing work. A simple operating principle allows great material flexibility. Fused deposition modeling in their publication, Garcia E. et. al. [
20] dealt with comparing the improved PLA polymer (PLA-3D) with the GNP reinforced PLA composite (PLA-Graphene), where they analyzed the geometric properties of dimensional accuracy, uniformity errors, surface roughness, and surface texture.
The production of nanocomposite structures is also highly relevant, described, among others, in the publication [
21] addressing the methodology of changes in mesostructures, where the addition of laminate nanofibers resulted in a higher Yong modulus. Research on nanocomposite structures in conjunction with additive technologies is also elaborated on in publications [
22,
23,
24].
The significance and importance of this issue are confirmed by the publications of the authors at the global level. The authors [
25] described the influence of process parameters on the mechanical properties of PLA. Based on the performed experiments, it was found that the extrusion temperature was the parameter of greatest influence in the variation of the analyzed responses. This finding was also described by a prediction model with a low error rate for the obtained data. A similar issue was addressed by the authors [
26], examining the influence of process parameters on the tensile mechanical properties of PLA. This research proved the influence of the fiber-matrix interface on tensile mechanical properties. Also, it was recorded the printing layer height and extrusion width as influential attributes. Research on the influence of process parameters on components produced by 3D printing has also been investigated in other important publications [
27,
28,
29,
30]. Often referenced downsides of FDM printers are part quality. Due to the work of authors on the article [
31] pure PLA plastic was used with no color to perform the tests. As the material must be extruded in layers, and has a certain thickness predefined by the nozzle, and often require lots of post-processing to acquire a professional, finished look. In addition to describing the behavior of the influence of process parameters of 3D printing technology in the analysis of PLA material, research on the optimization of influential parameters using mathematical models was also carried out [
32,
33]. Research has also been conducted on the influence of metals on the PLA composition [
34,
35,
36,
37]. Biodegradable PLA composites have huge potential in healthcare but for their application is important to have exact knowledge about the prediction of degradation [
38].
A similar production process as FDM uses Bound Metal Deposition (BMD) technology where the metal dust is held together by polymer and wax. After the extrusion process, the component is then sintered in the furnace where all the binder is removed and only the compacted metal part remains. When sintering, always work with only one material because different metals have different melting temperatures. Similarly, when using PLA plastic and additives, heat treatment of polymer matrix (of course at much lower temperatures for PLA to crystallize) can increase the thermal performance of the final product. In the used procedures, it is not desirable to break down the plastic element as in BMD [
39,
40,
41]. In the production process, a composite can be further formed where PLA plastic is combined with various additives. In certain cases, it is suitable to have parts with a higher metal content, where the individual grains are insulated from each other by plastic. For example, the cores of transformers are divided into thin plates to reduce eddy currents. In this case, even smaller units are created. If plastic-containing metals are used, the weight can be reduced compared to conventional metal parts or the efficiency can be increased compared to a complete plastic core.
The paper analyses and explains the basic parameters of the given sample produced by a 3D printer. It points out the fact that the mechanical properties of the test sample are affected not only by the composition of the material itself but also by the operating parameters of the machine. Current standards do not define exactly all the conditions of how samples to be torn should be produced. An inexperienced user may produce test samples of the desired form looking visually correct, but with errors that invalidate the test itself. Based on the knowledge of influencing the orientation of internal structures it is possible to determine the final parameters of produced parts such as appearance or strength. For needs of further research, approaches were chosen materials PLA and add-mixtures in PLA matrix. PLA has a huge potential for the creation of a wide variety of composite filaments, production for 4D printing, and is ecological (industrially compostable). Despite the different proportions of admixtures PLA material can be easily joined as filament before the 3D printing process or during layering in the printer. Such approaches help in the creation of functional assemblies in one production process where individual parts have different properties. It is not necessary to manually join simple parts into larger complex bodies. 3D printing allows a change in the design of structures, which leads to a reduction in material consumption by the creation of complex shapes.
2. Materials and Methods
Gradually, a need for unification of the rules for the shape of test samples has emerged on the global market. In Central Europe, emphasis is placed on ISO (International Organization for Standardization) standards, where the Slovak Technical Standards (abbreviated STS) often adopt these standards either simply by translating them or through amendments, if other factors need to be accounted for. In the United States, AM (American Society for Testing and Materials) is preferred. Although standards for testing plastics have been set for a long time, the need to supplement these standards has acutely increased in recent years. An example is insufficiently defined parameters in additive production, especially for 3D printers working with metals, plastic polymers, and composites. Production of products based on additive technologies is gaining in importance, mainly due to the new production possibilities of 3D printers compared to conventional technologies. The components must be produced with the specified parameters and in the required quality. Material research of the working media and research in the field of machine design plays an important role in shortening the production time of 3D production equipment. As advances in these technologies increase, so does the need for standardization.
Thanks to projects such as RepRap, 3D printers, especially of the FDM type, have been able to make the transition from top research centers to ordinary households. Thus, it is possible to produce products of the required industrial quality even at home. Within the concept of Industry 4.0, the technology is important in terms of new standards and from the point of view of the authors of this paper, it appears to be one of the possible cornerstones of the 5th Industrial Revolution, decentralized urban-domestic production.
For the formation of layered plastic bodies, the selected tensile sample to be torn may be produced with some of its parts less resilient if its production parameters were selected inappropriately. Based on similar research raster orientation play a crucial role in the mechanical performance of printed sample [
42]. To achieve optimal results for all manufactured bodies, the account was taken not only of optimally setting the basic production parameters, such as the temperature and the moving speed (listed in
Table 1) but also of guaranteeing dimensional accuracy and production repeatability. The G-code was created in Simplify3D with a postprocessor profile for Creality CR-10s Pro V2 on which the samples were produced.
To guarantee a constant height of the body and to prevent failures, three base layers (Raft) were formed under the body. A thinner Raft Baselayer and two Raft Top ones, on which the resulting body was subsequently printed. This prevented possible defects associated with desk wear, incorrect calibration, and imperfect printing adhesion. The heating bed was turned on throughout the whole manufacturing process. These are basic settings for production from PLA filament with small modifications. The available standards point to the principles of operation of the respective additive technology and the shape of the test specimens. However, they do not address the parameters for creating paths for the production machine, the sequence of individual production steps.
The EN ISO 17296 standard Additive production-basic principles consist of the following parts:
Part 1: Terminology
Part 2: Overview of processes and raw material categories
Part 3: Main characteristics and the corresponding methods of testing
Part 4: Overview of data processing
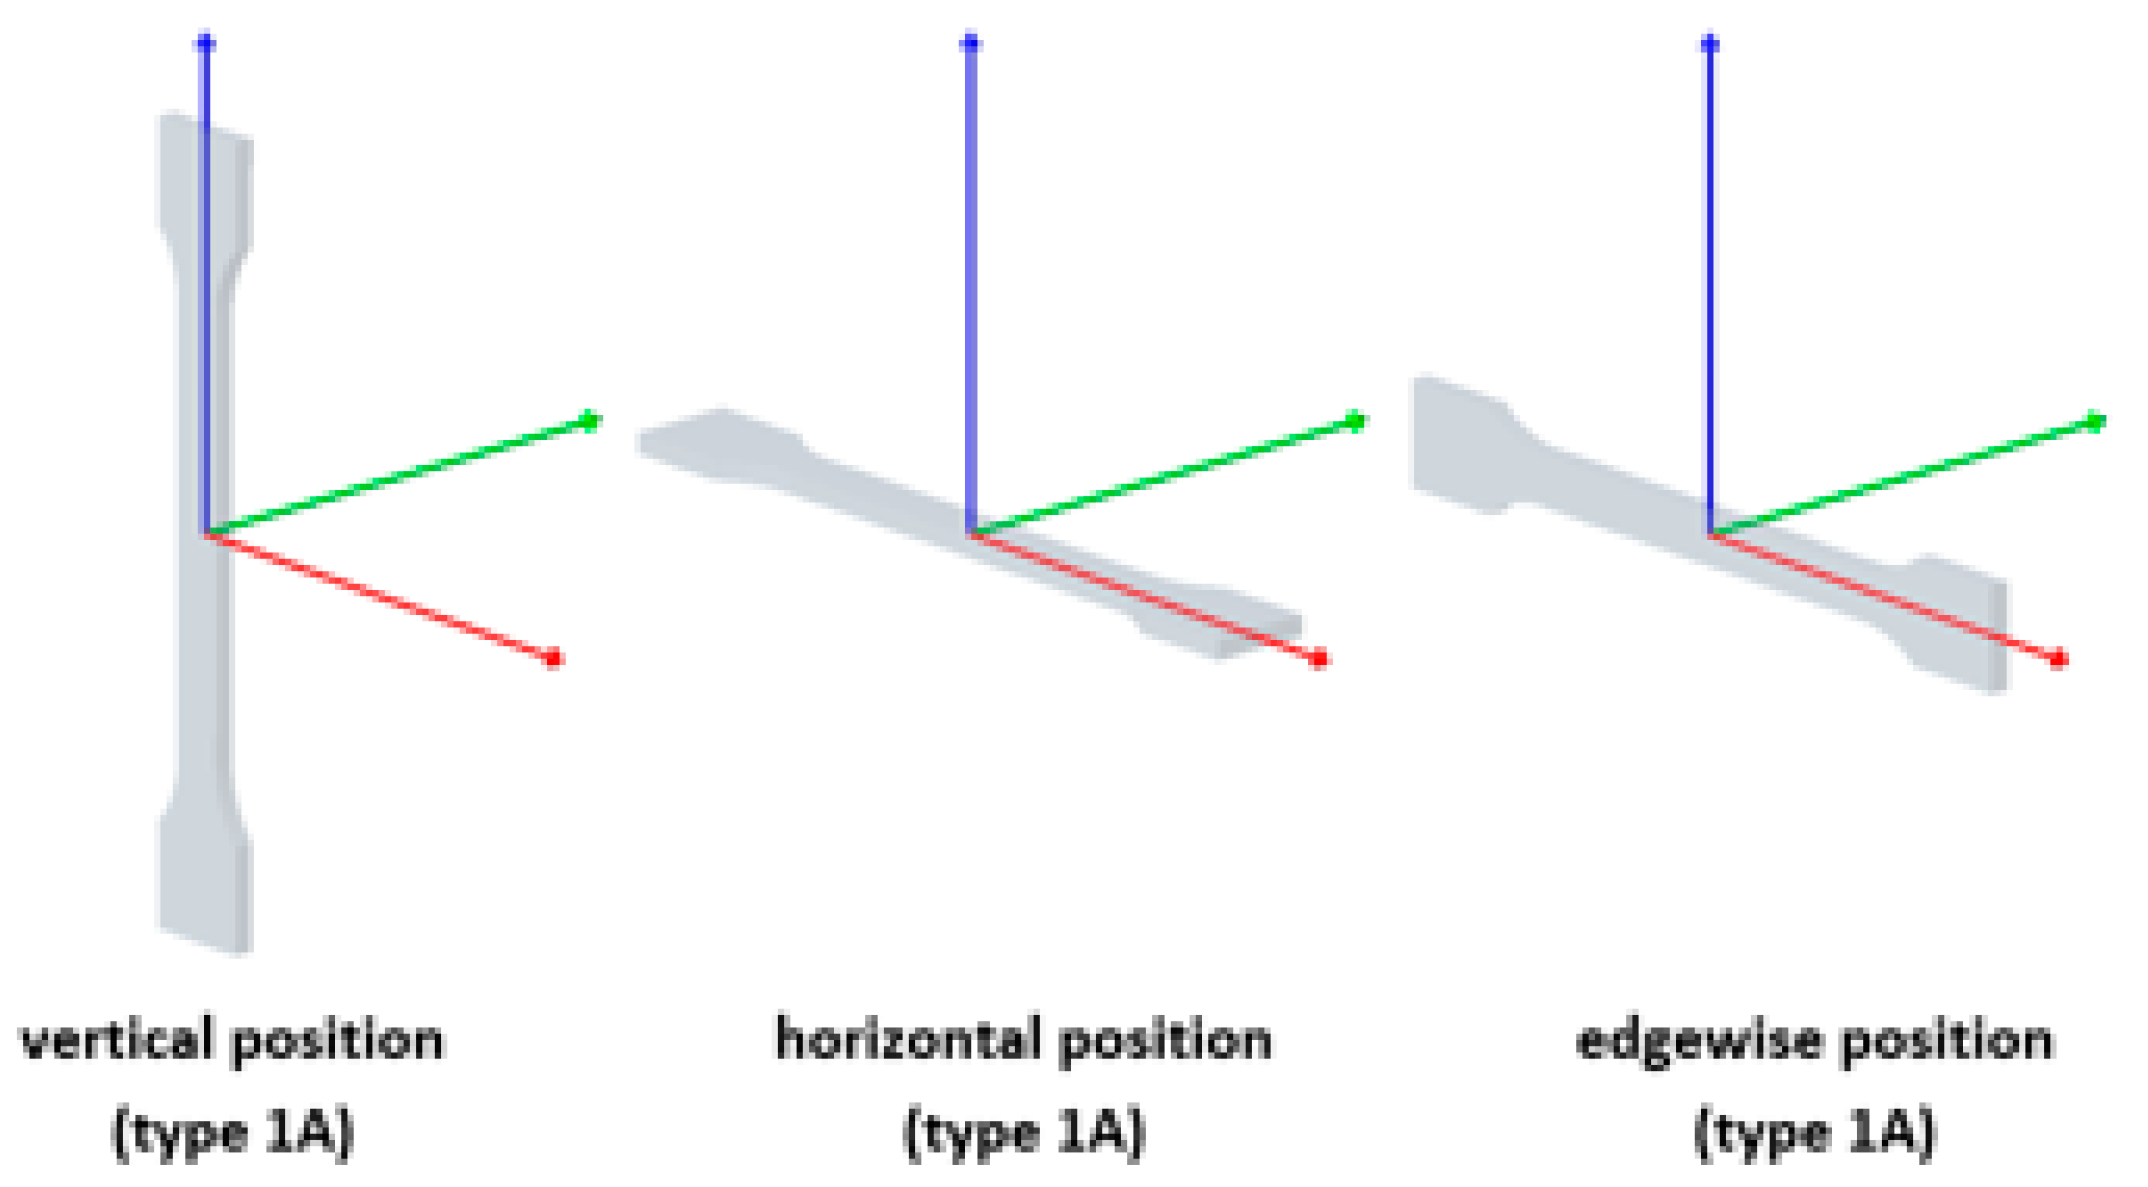
Chapter 4.3 of the ISO 17296-3—Performance criteria and qualitative characteristics, the standard refers to ISO/ASTM [
43] with respect to the specificity of additive production and its anisotropy—the direction in which the load is applied to the sample during the test with respect to the layering of the material fiber during the production process. The common standards do not directly determine the relative position on the building table of printed samples for FDM technology. All tests were conducted on samples produced in the horizontal 1A position (
Figure 1). Several publications have already shown that it is inappropriate to use the vertical position of the sample during the production process using the FDM technology for the tensile test purposes [
27,
28,
29,
30].
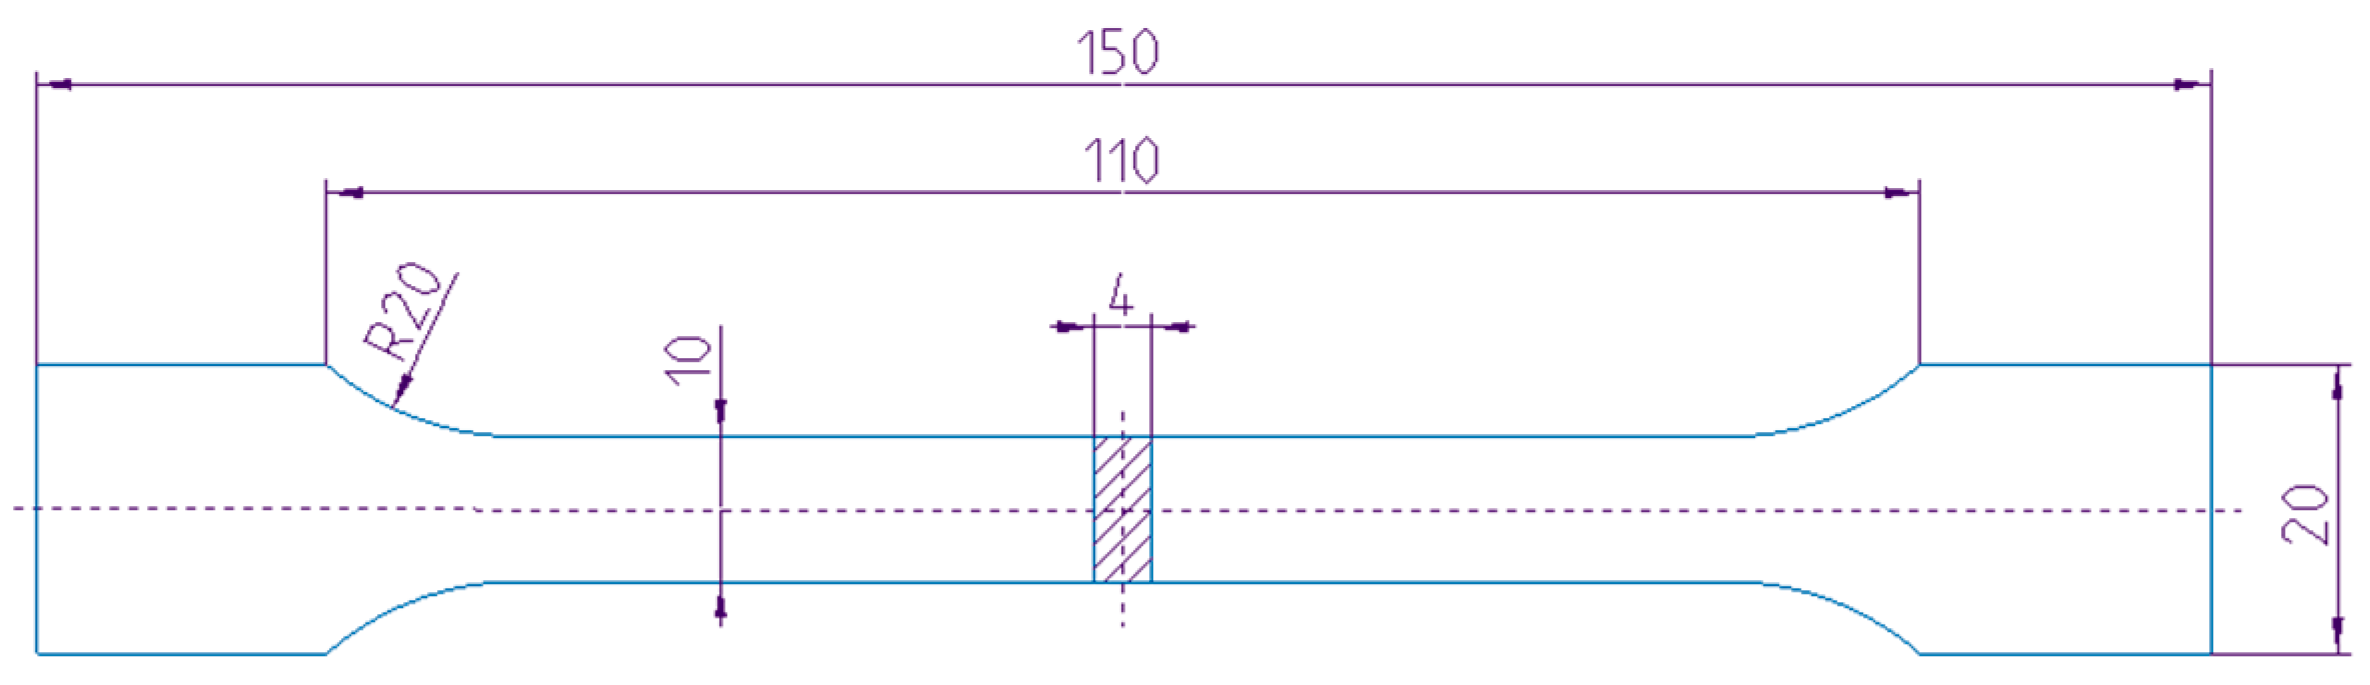
Reference is also made to ISO 527-parts 1–5 [
44,
45,
46] for the sample parameters required to conduct the mechanical tensile test. For our needs, we worked with the sample (
Figure 2) according to the ISO 527-2 standard, conditions for plastics intended for pressing and extrusion, recommended type 1A, as type 1B is recommended for samples produced by machining. This standard is selected most frequently, as it appears closest to the FDM technology used.
Additional parameters are described in the following
Table 2, which compares the standard selected by us with the UNE 116005: 2012.
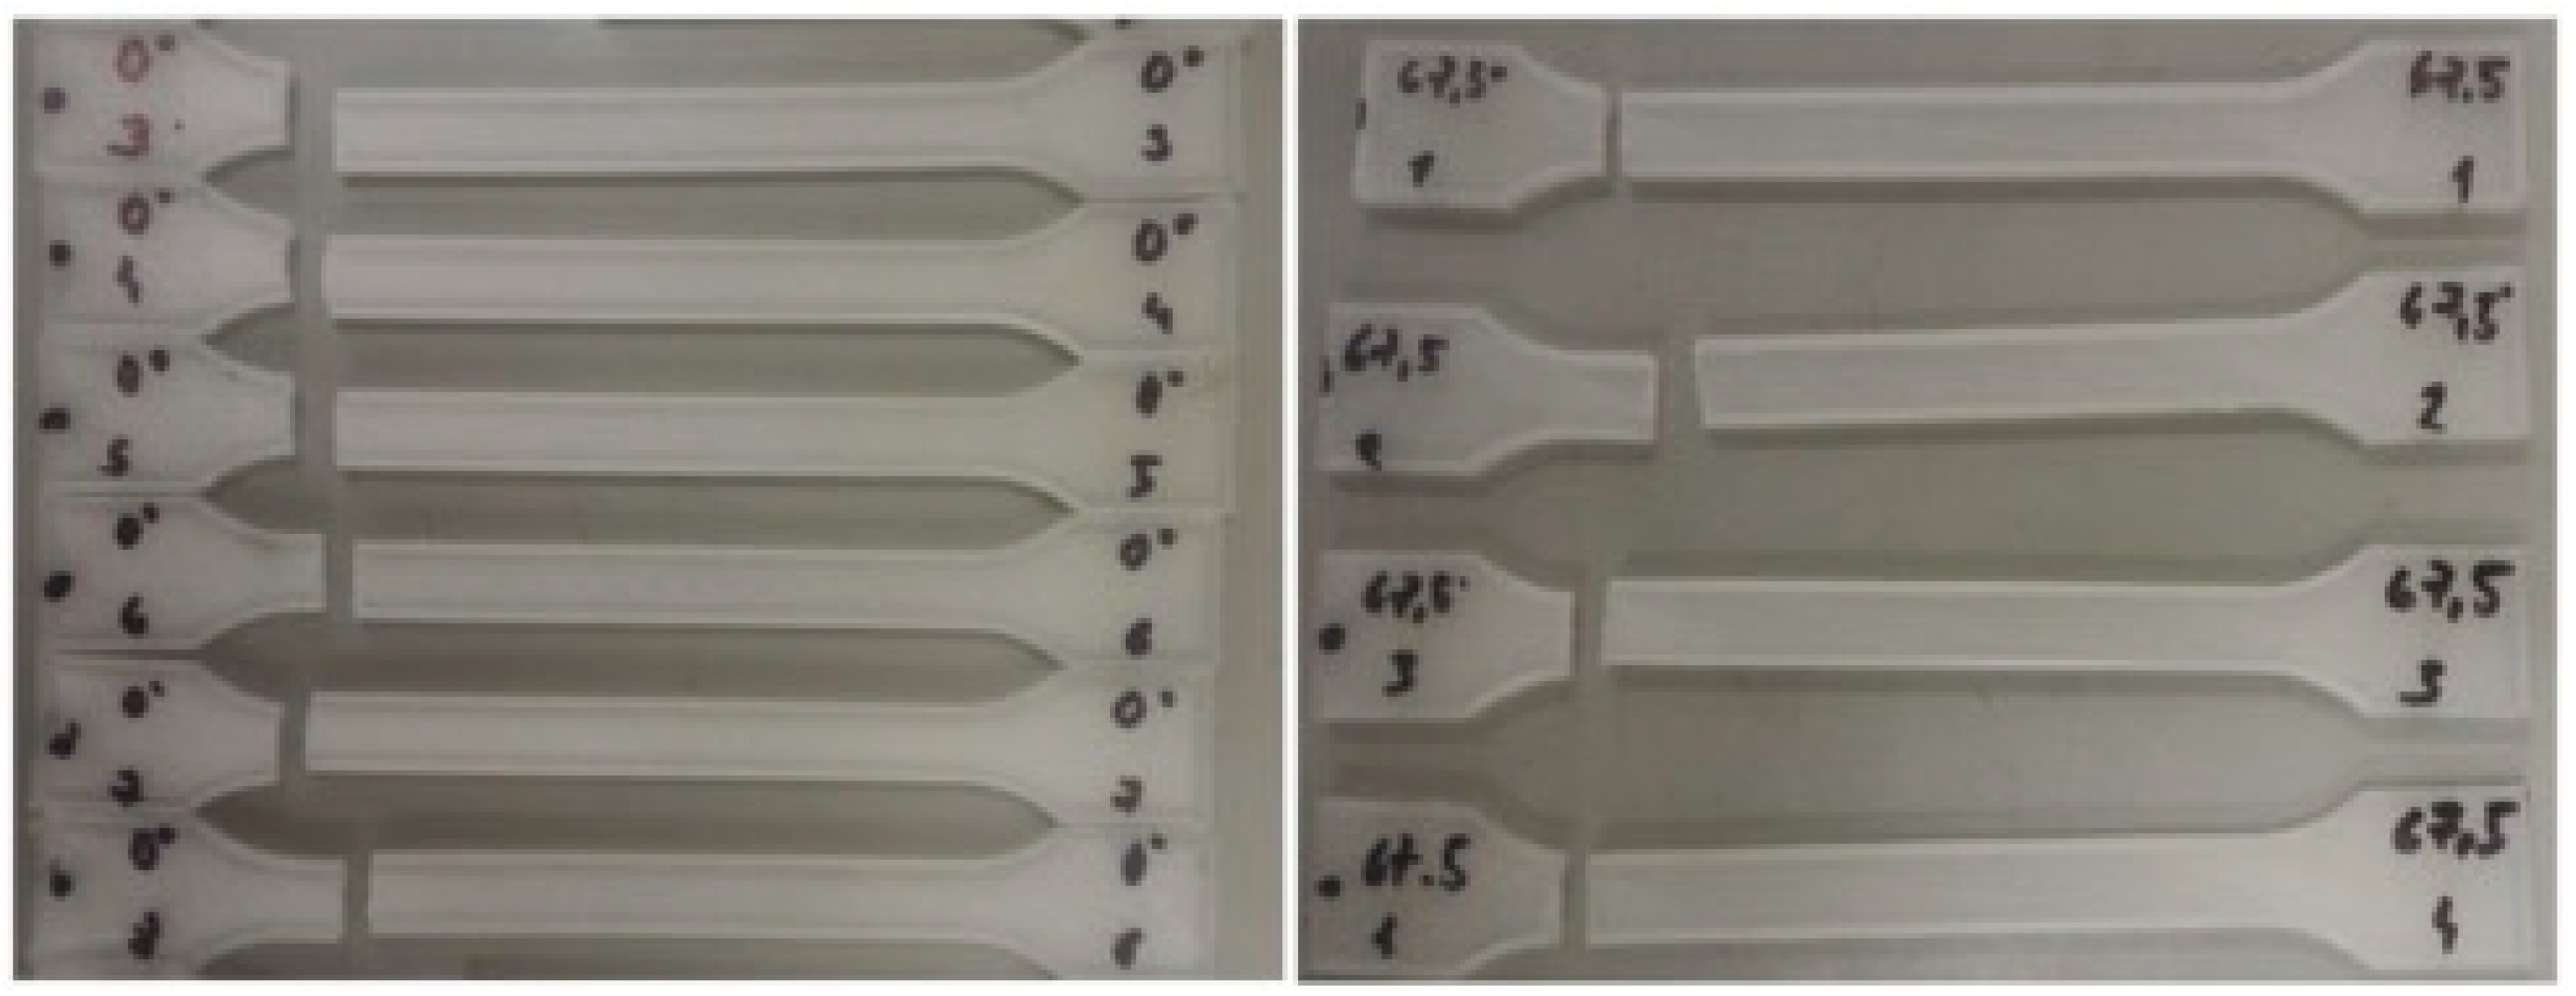
Because the resulting models consist of sequentially laminated plastic and the orientation of the individual layers itself may affect the resulting mechanical properties, the samples are formed with different orientations with respect to the printing base in the Z-axis. This orientation is 0°, 22.5°, 45°, 67.5°, and 90°. The samples were marked with a dot on the side of the blade that pointed to the left edge of the desk. In addition, each blade had an indication of the angle of rotation used and the serial number of the respective batch.
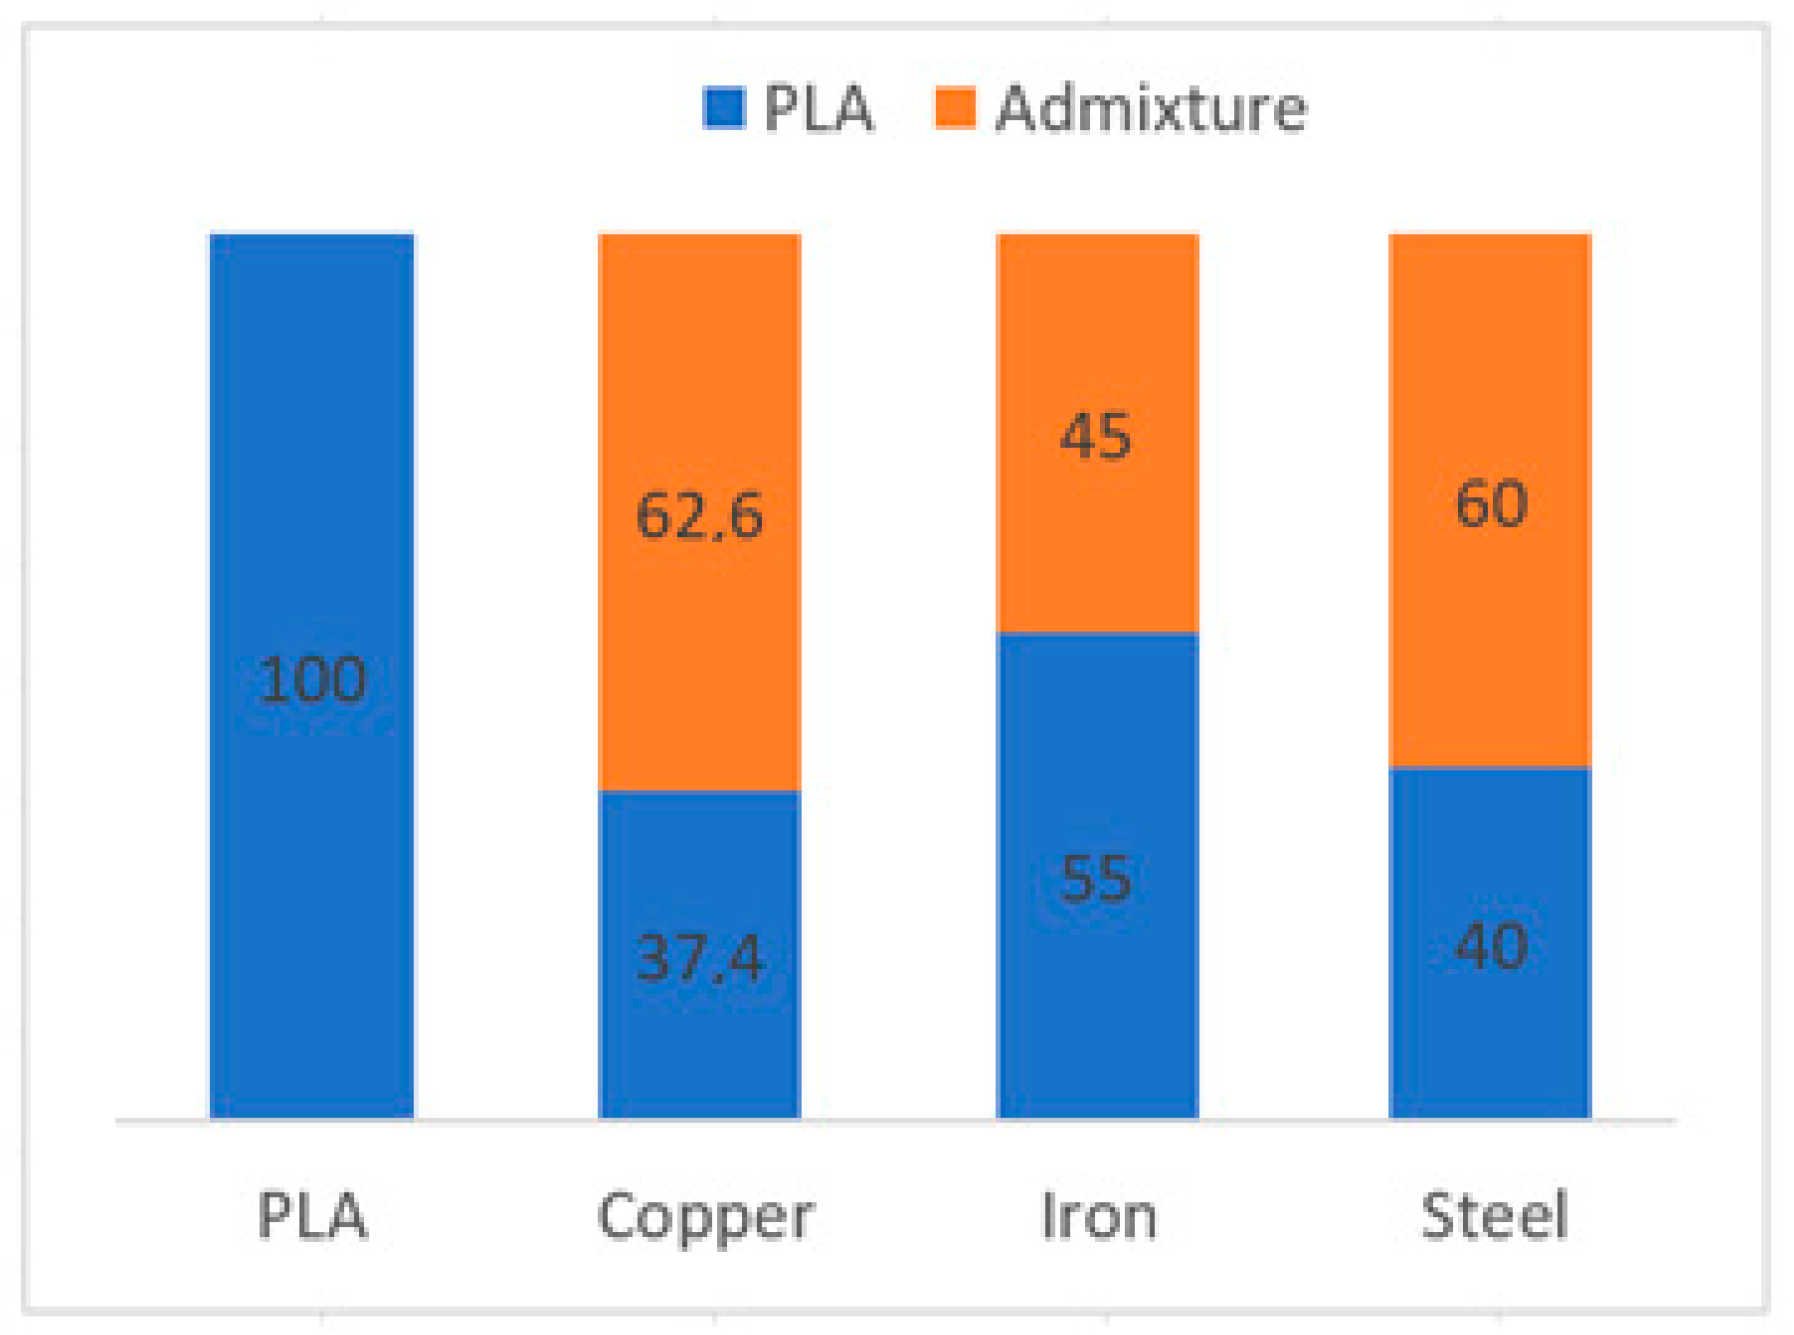
The static tensile test was conducted on a UTM WDW-50 machine, which is suitable for comparing the mechanical properties of different materials (metals, rubber, plastics, textiles, paper, etc.) in tensile, compressive, or bending tests, with a maximum test force of 50 kN. The first phase of testing focused on verifying the dimensional characteristics of test samples. These values met the relevant requirements of ISO 527-1. Pure PLA plastic and subsequently filament with PLA matrix and additives such as copper, iron, and steel were monitored. Used composite materials were from a commercial manufacturer Proto-pasta specifically Copper-filled, Steel-filled, and Iron-filled Composite PLA Percentage of basic components is given in
Figure 3.
Due to different additives particle densities, despite consuming fiber of the same length, the individual samples to be torn showed different weights after production. The average sample weight is given in
Table 3.
Weighing (
Figure 4) was done on an electronic scale KERN EMB 200-3 with a sensitivity of up to 0.001 g. Having its initial parameters checked, the test piece was clamped in the jaws of the UTM WDW-50 shearing device, with the test speed set at 5 mm/min. The course of the test was recorded in real-time and the values were then plotted as a ratio between the proportional elongation and the loading force.
In the evaluation of the materials used, the monitored parameter was also the surface roughness of the sample’s sidewall. The surface as such affects not only the material used but also the parameters selected on the machine, which directly affect the flow of filament from the nozzle. The contact method of measurement was used in the diagnostics, where the test tip sensed the height of the surface profile relative to the path of the head. The result is an undulation corresponding to the height of the predefined layer of the printhead transition for the resulting model.
The purposes of measurement on the Mitutoyo SJ-410 device are met by the transition along the edge of the sample to be torn (4 mm), but to avoid distortion during the measurement by incorrect fixing and tilting of the measured surface, prisms of 40 × 10 × 20 mm were made. The same postprocessor settings as for the samples to be torn were used in the manufacturing process. Cubes with an edge of 20 mm and a layer height of 50 µm, 100 µm, and 200 µm, respectively, were also made for other purposes.
As shown in
Figure 4, despite various additives, the 0.3 mm diameter nozzle managed to produce the individual shapes in the required quality. When layering the filament at a quality of 50 µm, an error rate, which caused deterioration in the production process, was recorded. Plastics are materials with a wide range of properties, resulting from a wide variability of their chemical structure. The resulting values depend on the conditions during the measurement, considering the test’s purpose. The tensile force and elongation of the sample are monitored. The measurement record can be displayed in the form of a graph from which other parameters can be derived. The principle of the test lies in the static loading of a test sample of the prescribed shapes and dimensions up to rupture. During the measurement, different results were obtained depending on the nature of the material. Experimental tests of the materials’ tensile properties were in accordance with the conditions stated in the material data sheets of the tested materials and the STS ISO 527 standard. The tests were conducted at the University of Technology and Business in České Budějovice. A total of 80 test samples from four different materials were tested.
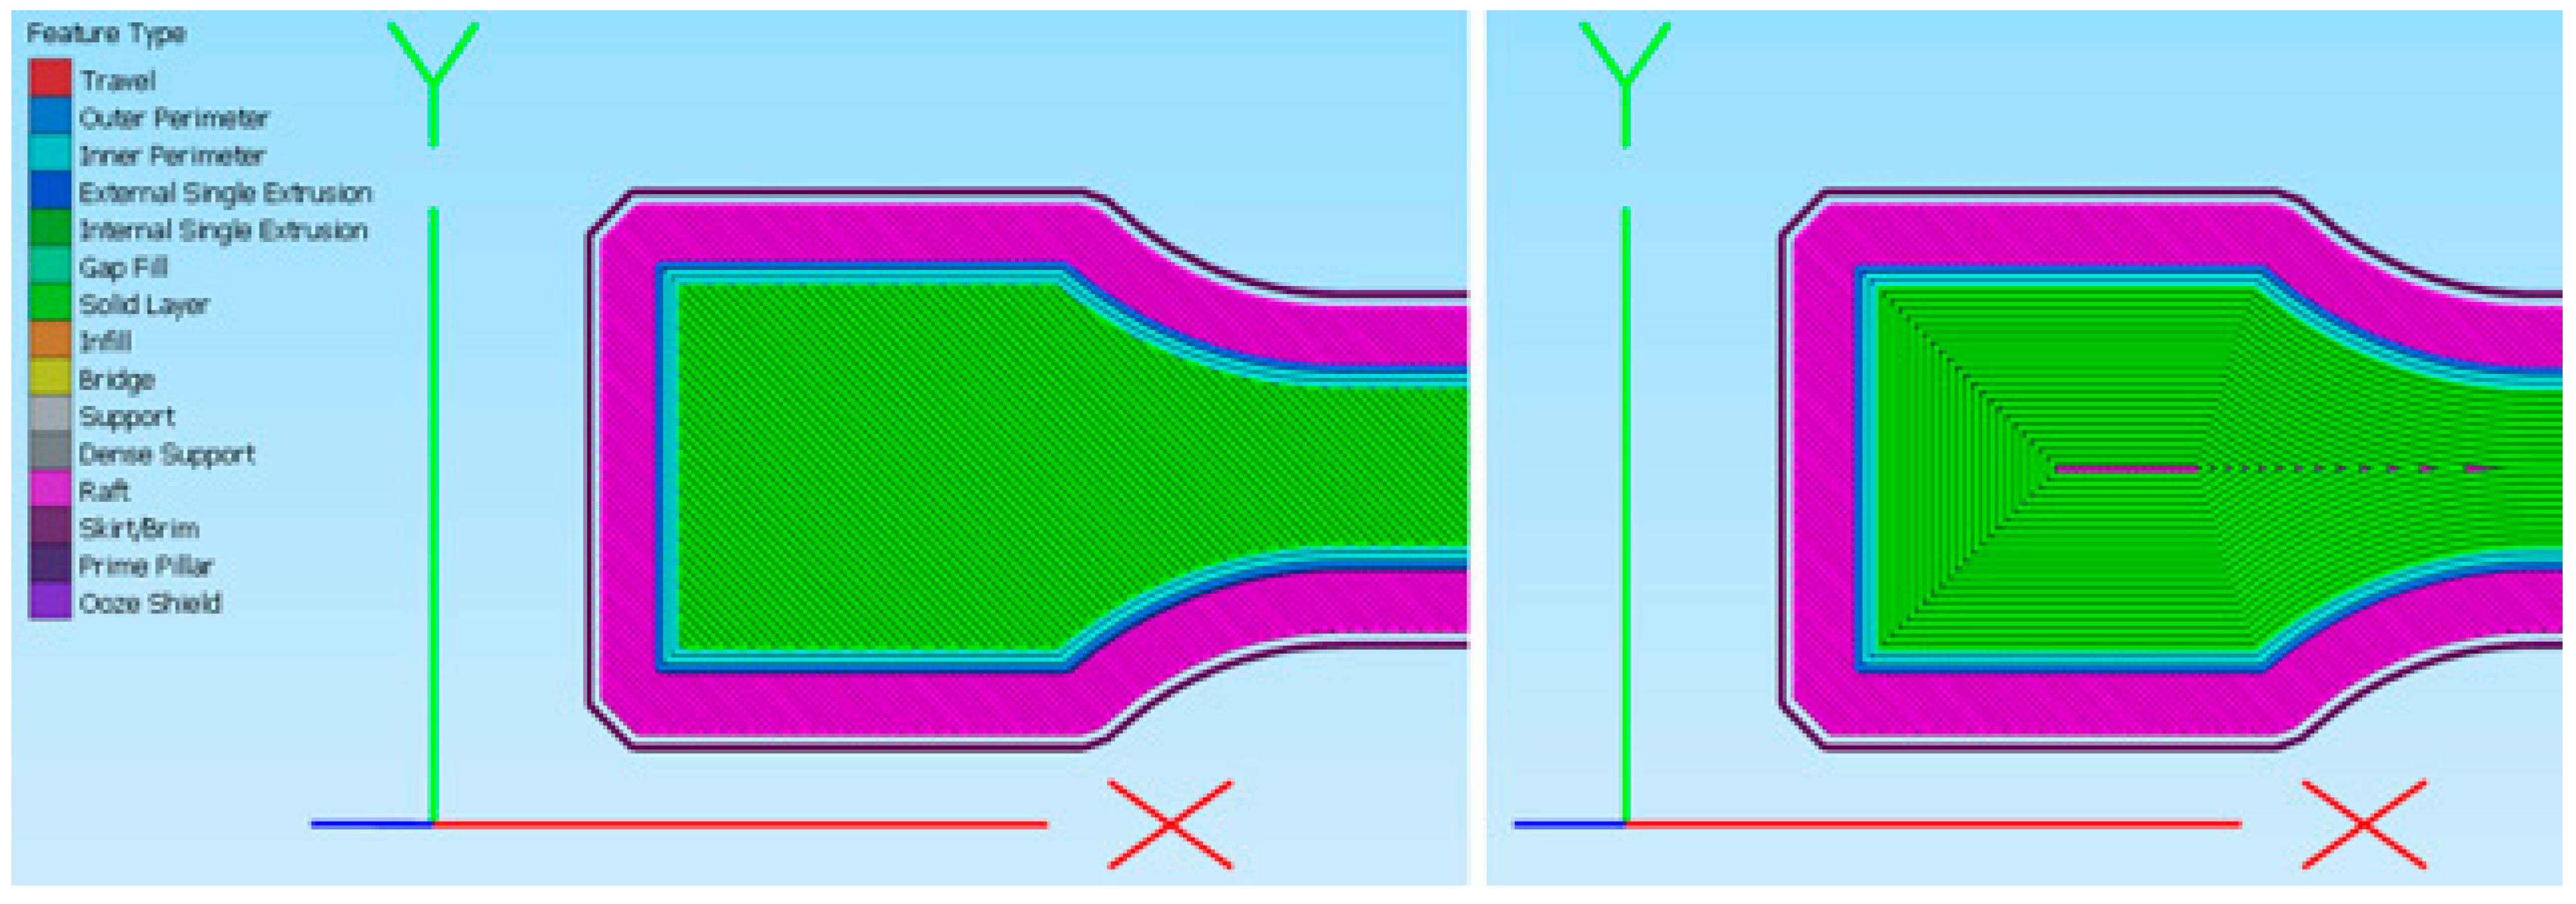
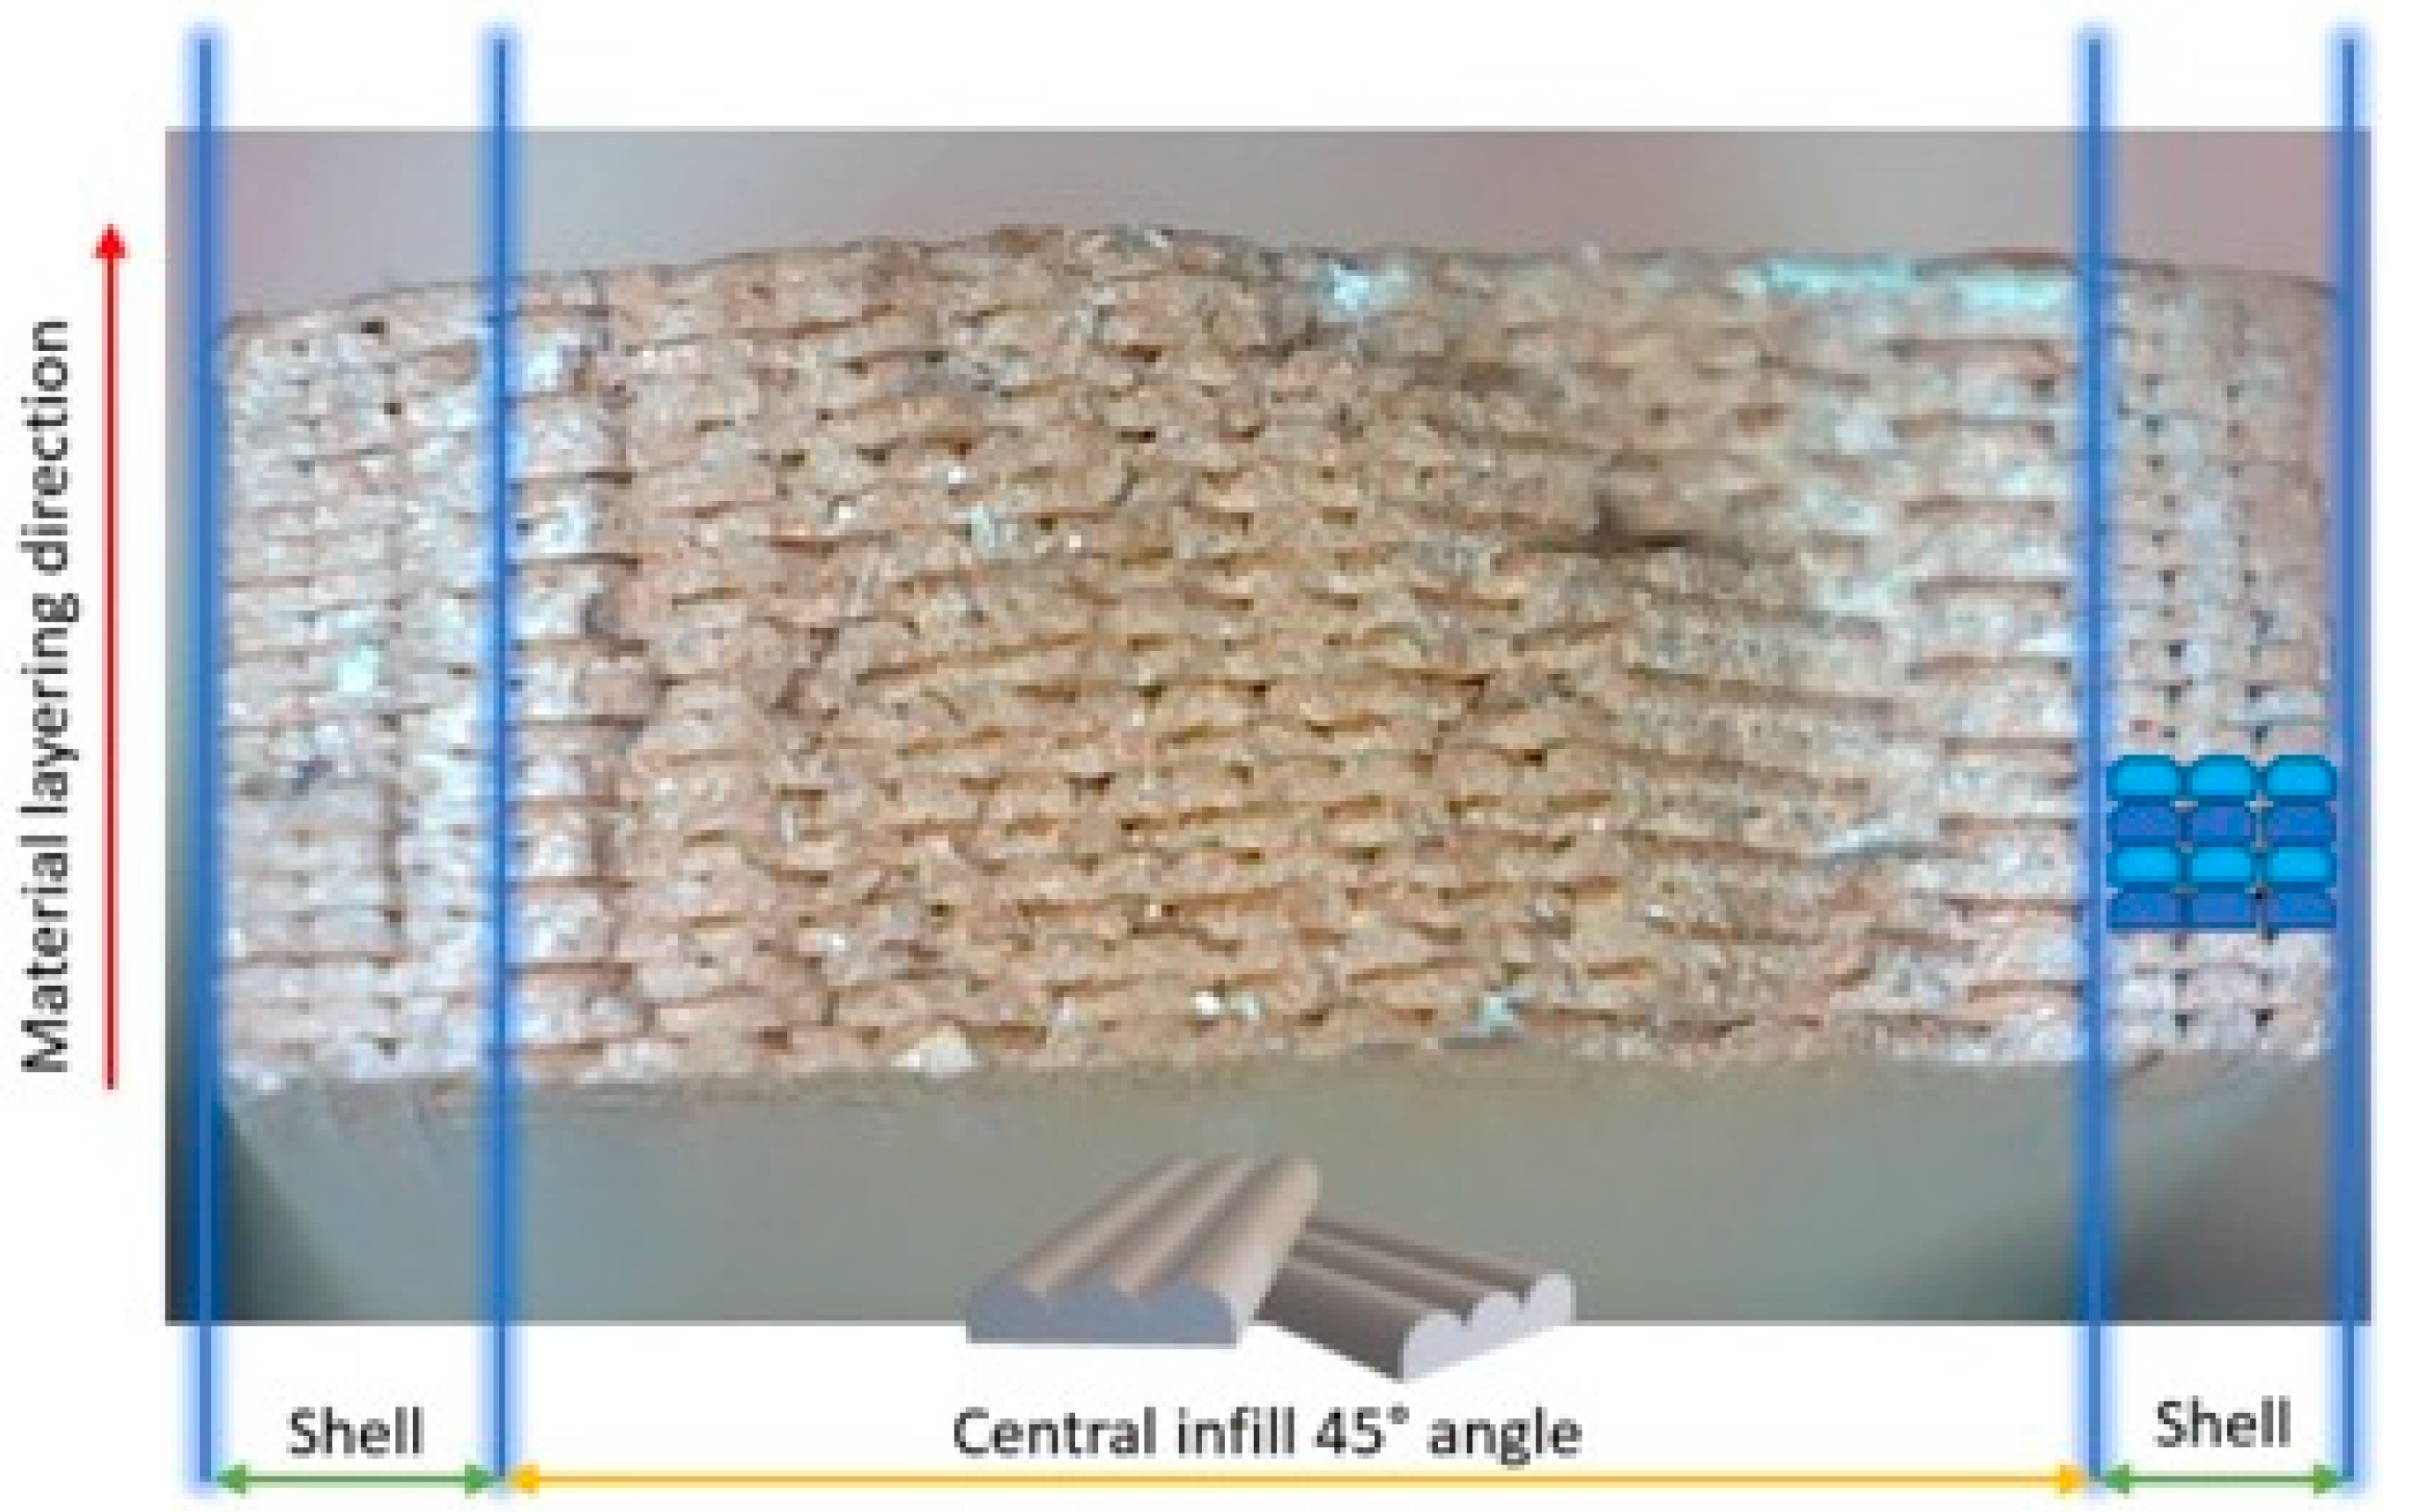
The morphology of the samples produced by successive layering of the filament (according to the specification for FDM) is not completely identical to the bodies produced by the technology described in ISO 527-2. This approach to using the standard in question must be understood as temporary and applied to the development of specific standards, as pointed out by this paper. Even seemingly small changes to the settings of the postprocessor generating paths for the print head bring about a large difference. The following figure (
Figure 5) shows how to set the infill to 100%, but with a changed structure type. Despite the required total fill, the individual settings generate a certain percentage of free space.
With a constant shape and settings, where only the type of the infill changed, the sample consumed 3.45 to 3.9 m of filament. Manufactured test samples with Rectilinear infill (first top left—
Figure 5) required 3769.1 mm of filament 1.75 mm in diameter, including the raft.
Figure 6 shows the setting of the External Fill Pattern parameter in the Infill Table The default setting is usually Rectilinear. Depending on the number of the set outer layers (in this case three), the infill pattern changes gradually, layer by layer, at an angle of 45° and 135°. With the Concentric value (used mainly in delta 3D printers), the pattern in each layer is the same, gradually placed one on top of another.
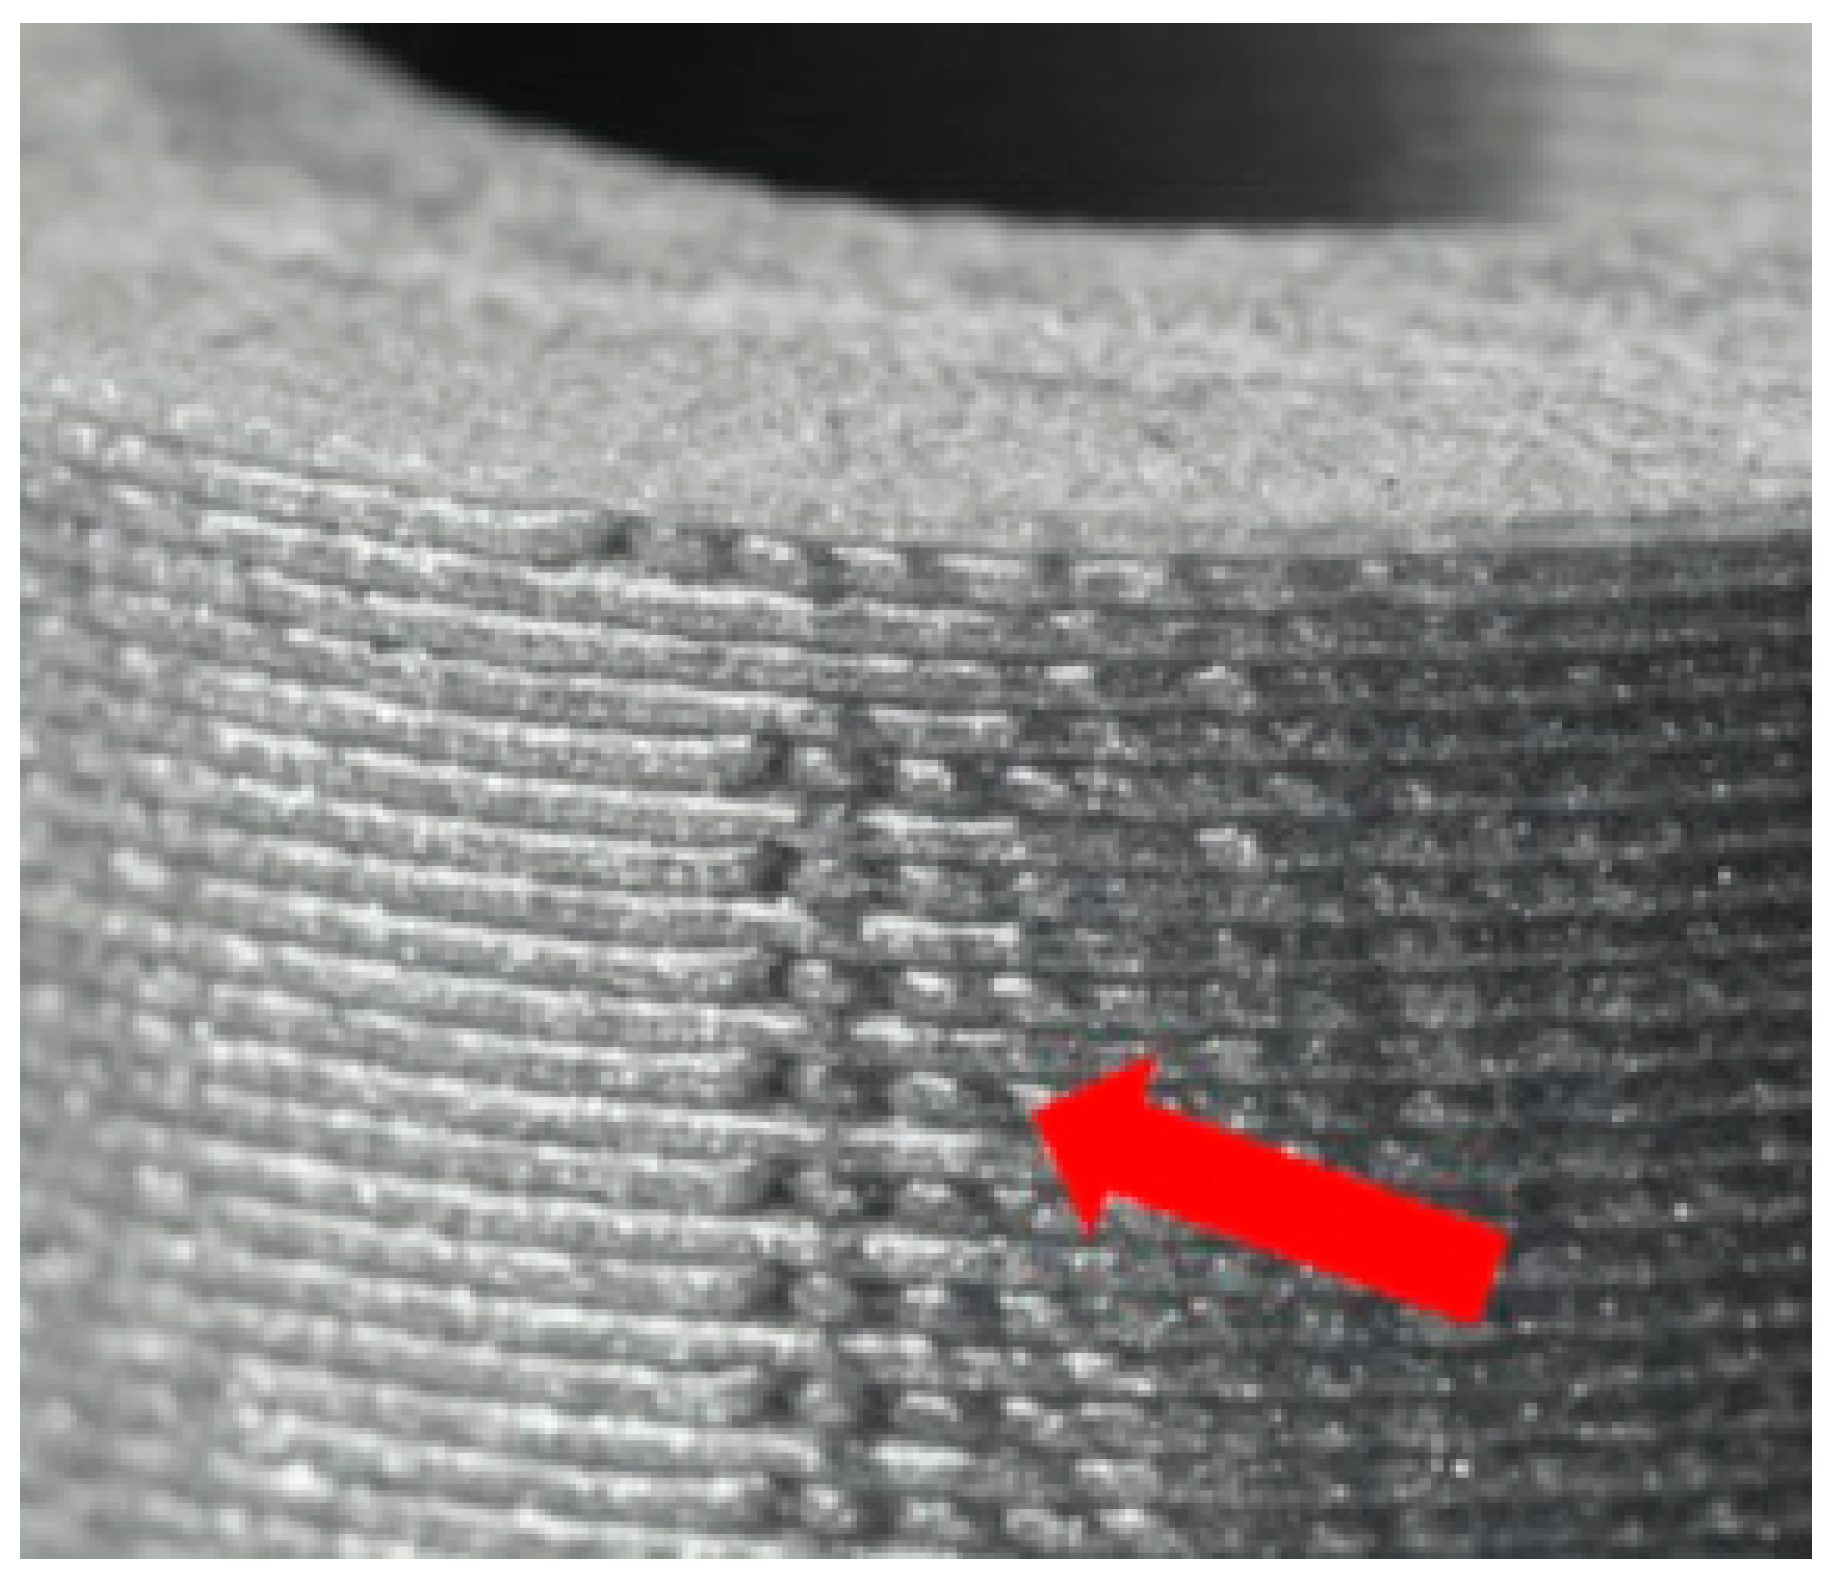
Another problem lies in the individual layers at the beginning and at the end of the production transition.
Figure 7 shows the beginning and end of the outer layer on the body, where these points formed a kind of a seam—a place with a weakened wall.
To not distort the measurement, the basic parameters have been changed in the G-code settings, focused mostly on the creation of visually attractive products. In the native setting, the printhead moves circumferentially to the arc at the outer edge of the enlarged sample blade during the beginning of the printing process, in which the postprocessor tends to close the circumferential motion and continue to the inner circumference. This causes that the start and end of the individual circuits accumulate in the rounded area of the neck of the 3D printed part. This defect results in premature rupture of the sample in the rounded area. Here, the individual beginnings and ends of the work cycles in the creation of, e.g., the external structures scatter along the body in random XY coordinates and gradually in layers (in the
Z-axis) are usually not repeated. This prevents a visible seam.
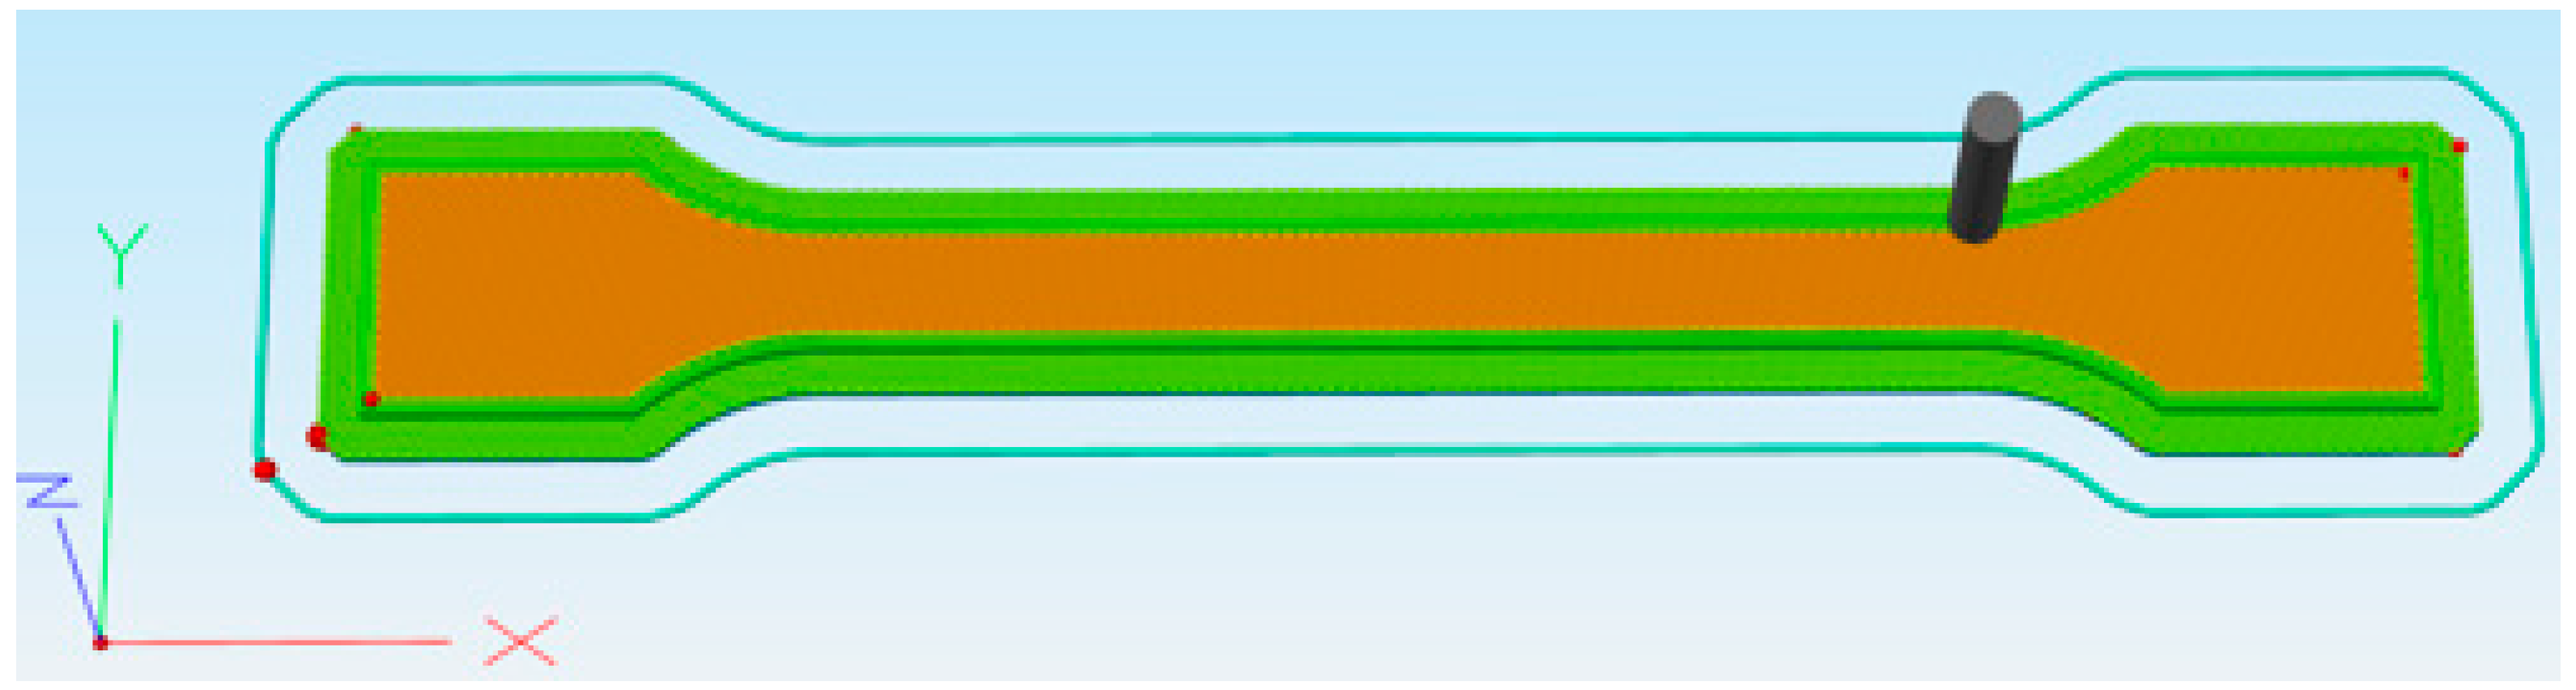
Figure 8 shows such a setting. The individual red dots show the beginnings and ends of the working transition of the extruder tip.
3. Results and Discussion
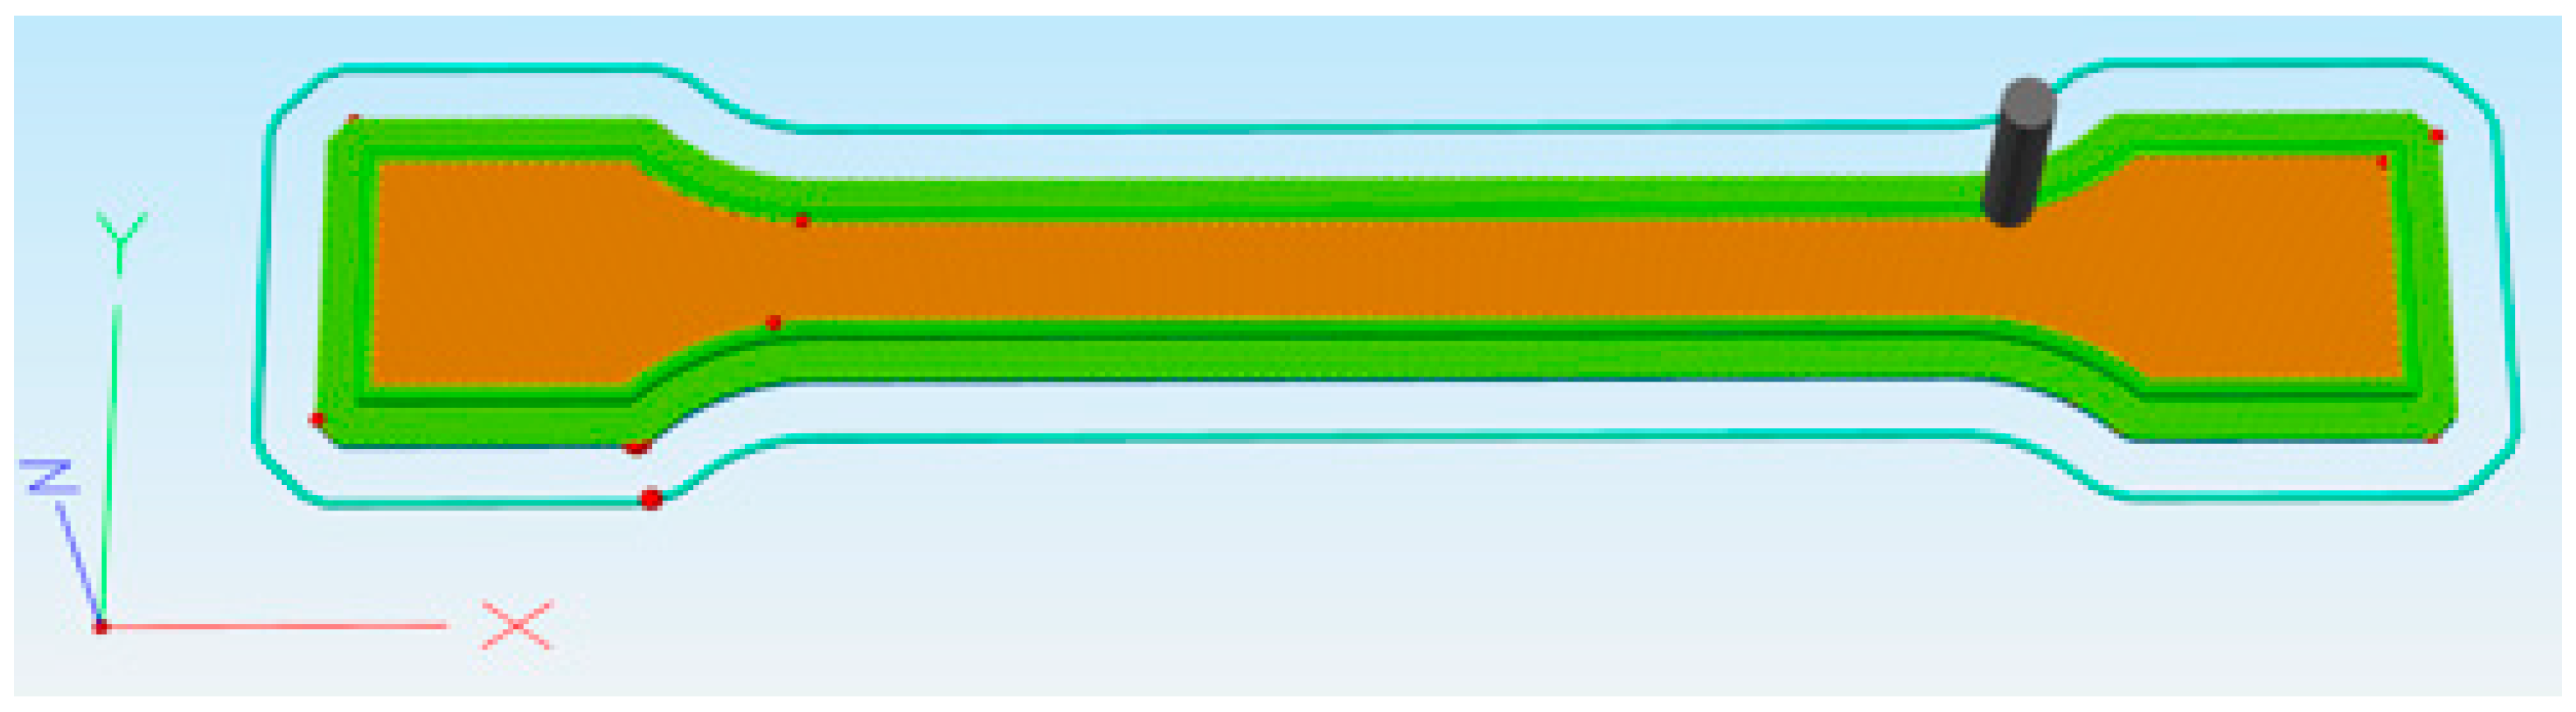
In order not to adversely affect the deformation zone, the beginnings and ends of the individual layers were placed in the corners of the blades of the test sample, so that they varied layer by layer, not forming a single weakened or raised corner. The results of samples printed without adjusting the start of the printing are shown in
Figure 9.
By changing the settings in the postprocessor, the starting point for the printing has been adjusted to achieve the most objective result possible and to prevent the accumulation of defects in the test area. That is, the printhead does not begin its motion at a random location, such as the arc of the printing pattern, but at its corners, as shown in
Figure 10. All the beginnings of the transitions for the peripheral layers (
Figure 11), as well as the body’s infill, were located in the areas intended for clamping the sample to the jaws of the measuring device. The body of the sample is then produced by a continuous passage of the tip of the extruder without interruption in the monitored part.
As mentioned at the beginning of the paper, the starting sample for comparison and evaluation of the measurement results is a sample of pure PLA, free from dyes and additives. Other studied materials are composites composed of PLA plastic with different percentages of admixtures. To determine the effect of the orientation of the infill in the sample to be torn, when applying the FDM technology, a series of samples is created from materials gradually containing an admixture of dust particles of copper, steel, and iron. For the given models, 10 samples of pure PLA material have been made for all five orientations. Composite samples were produced only in the 0° orientation.
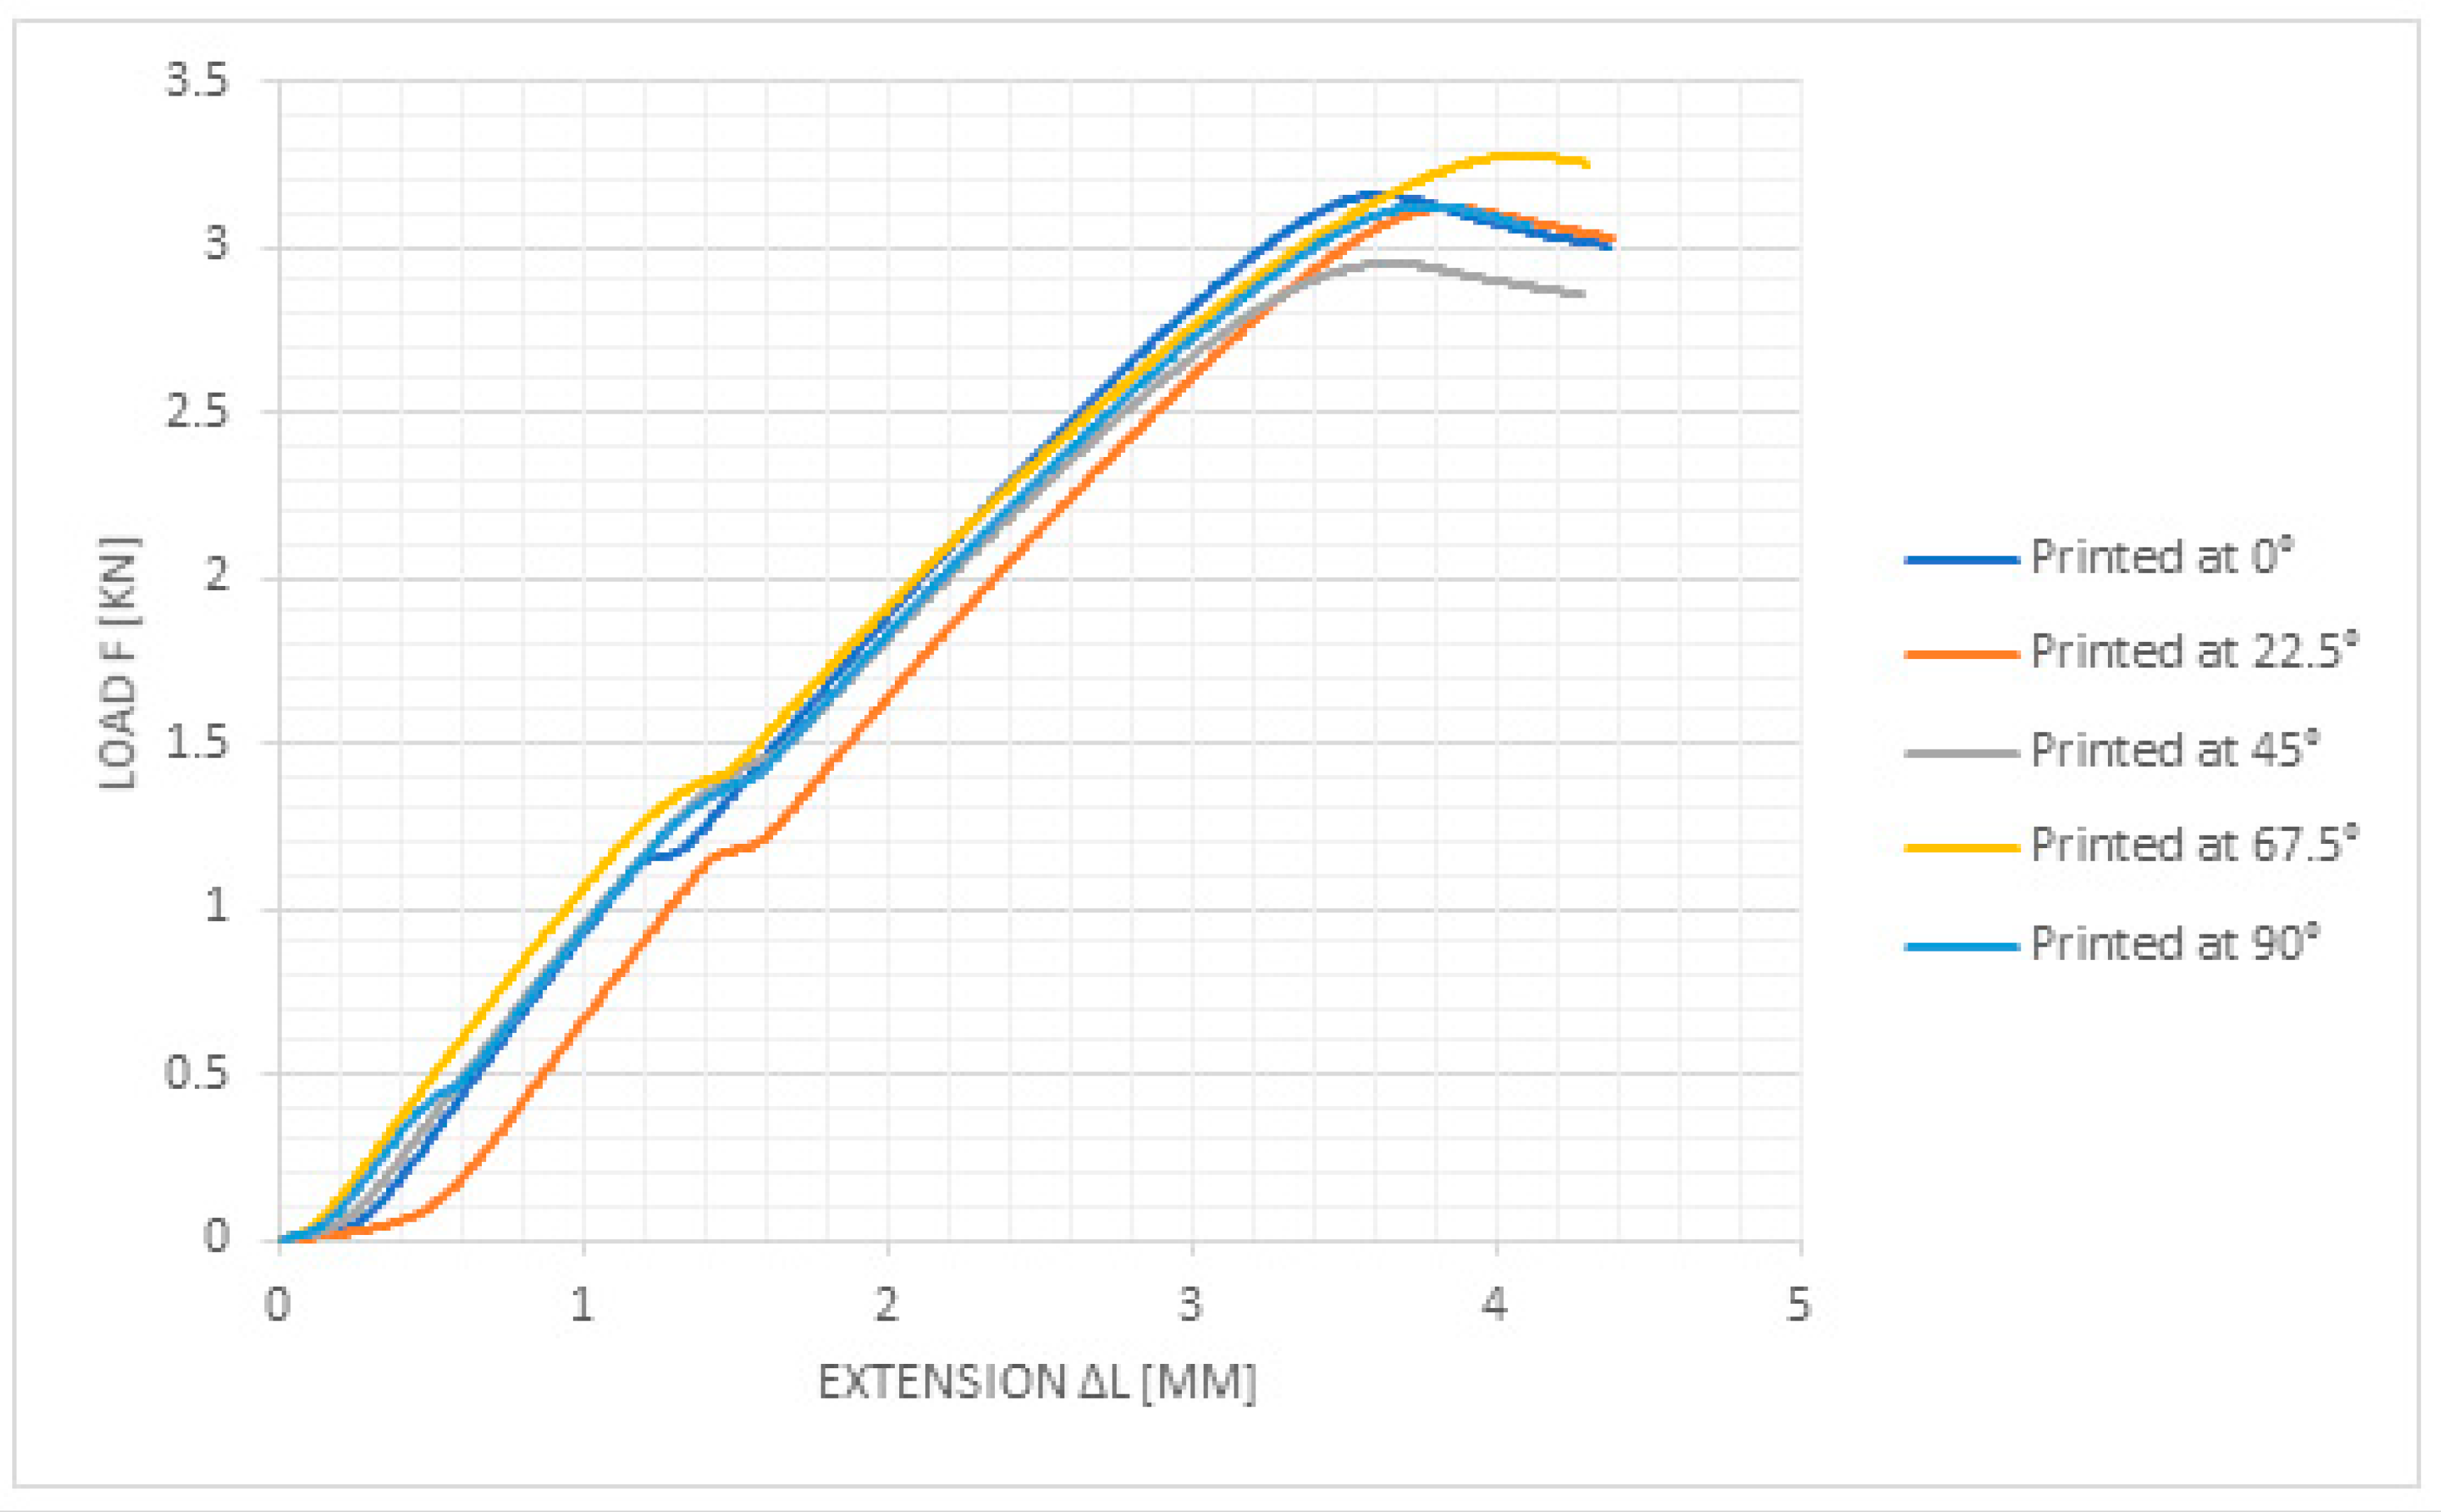
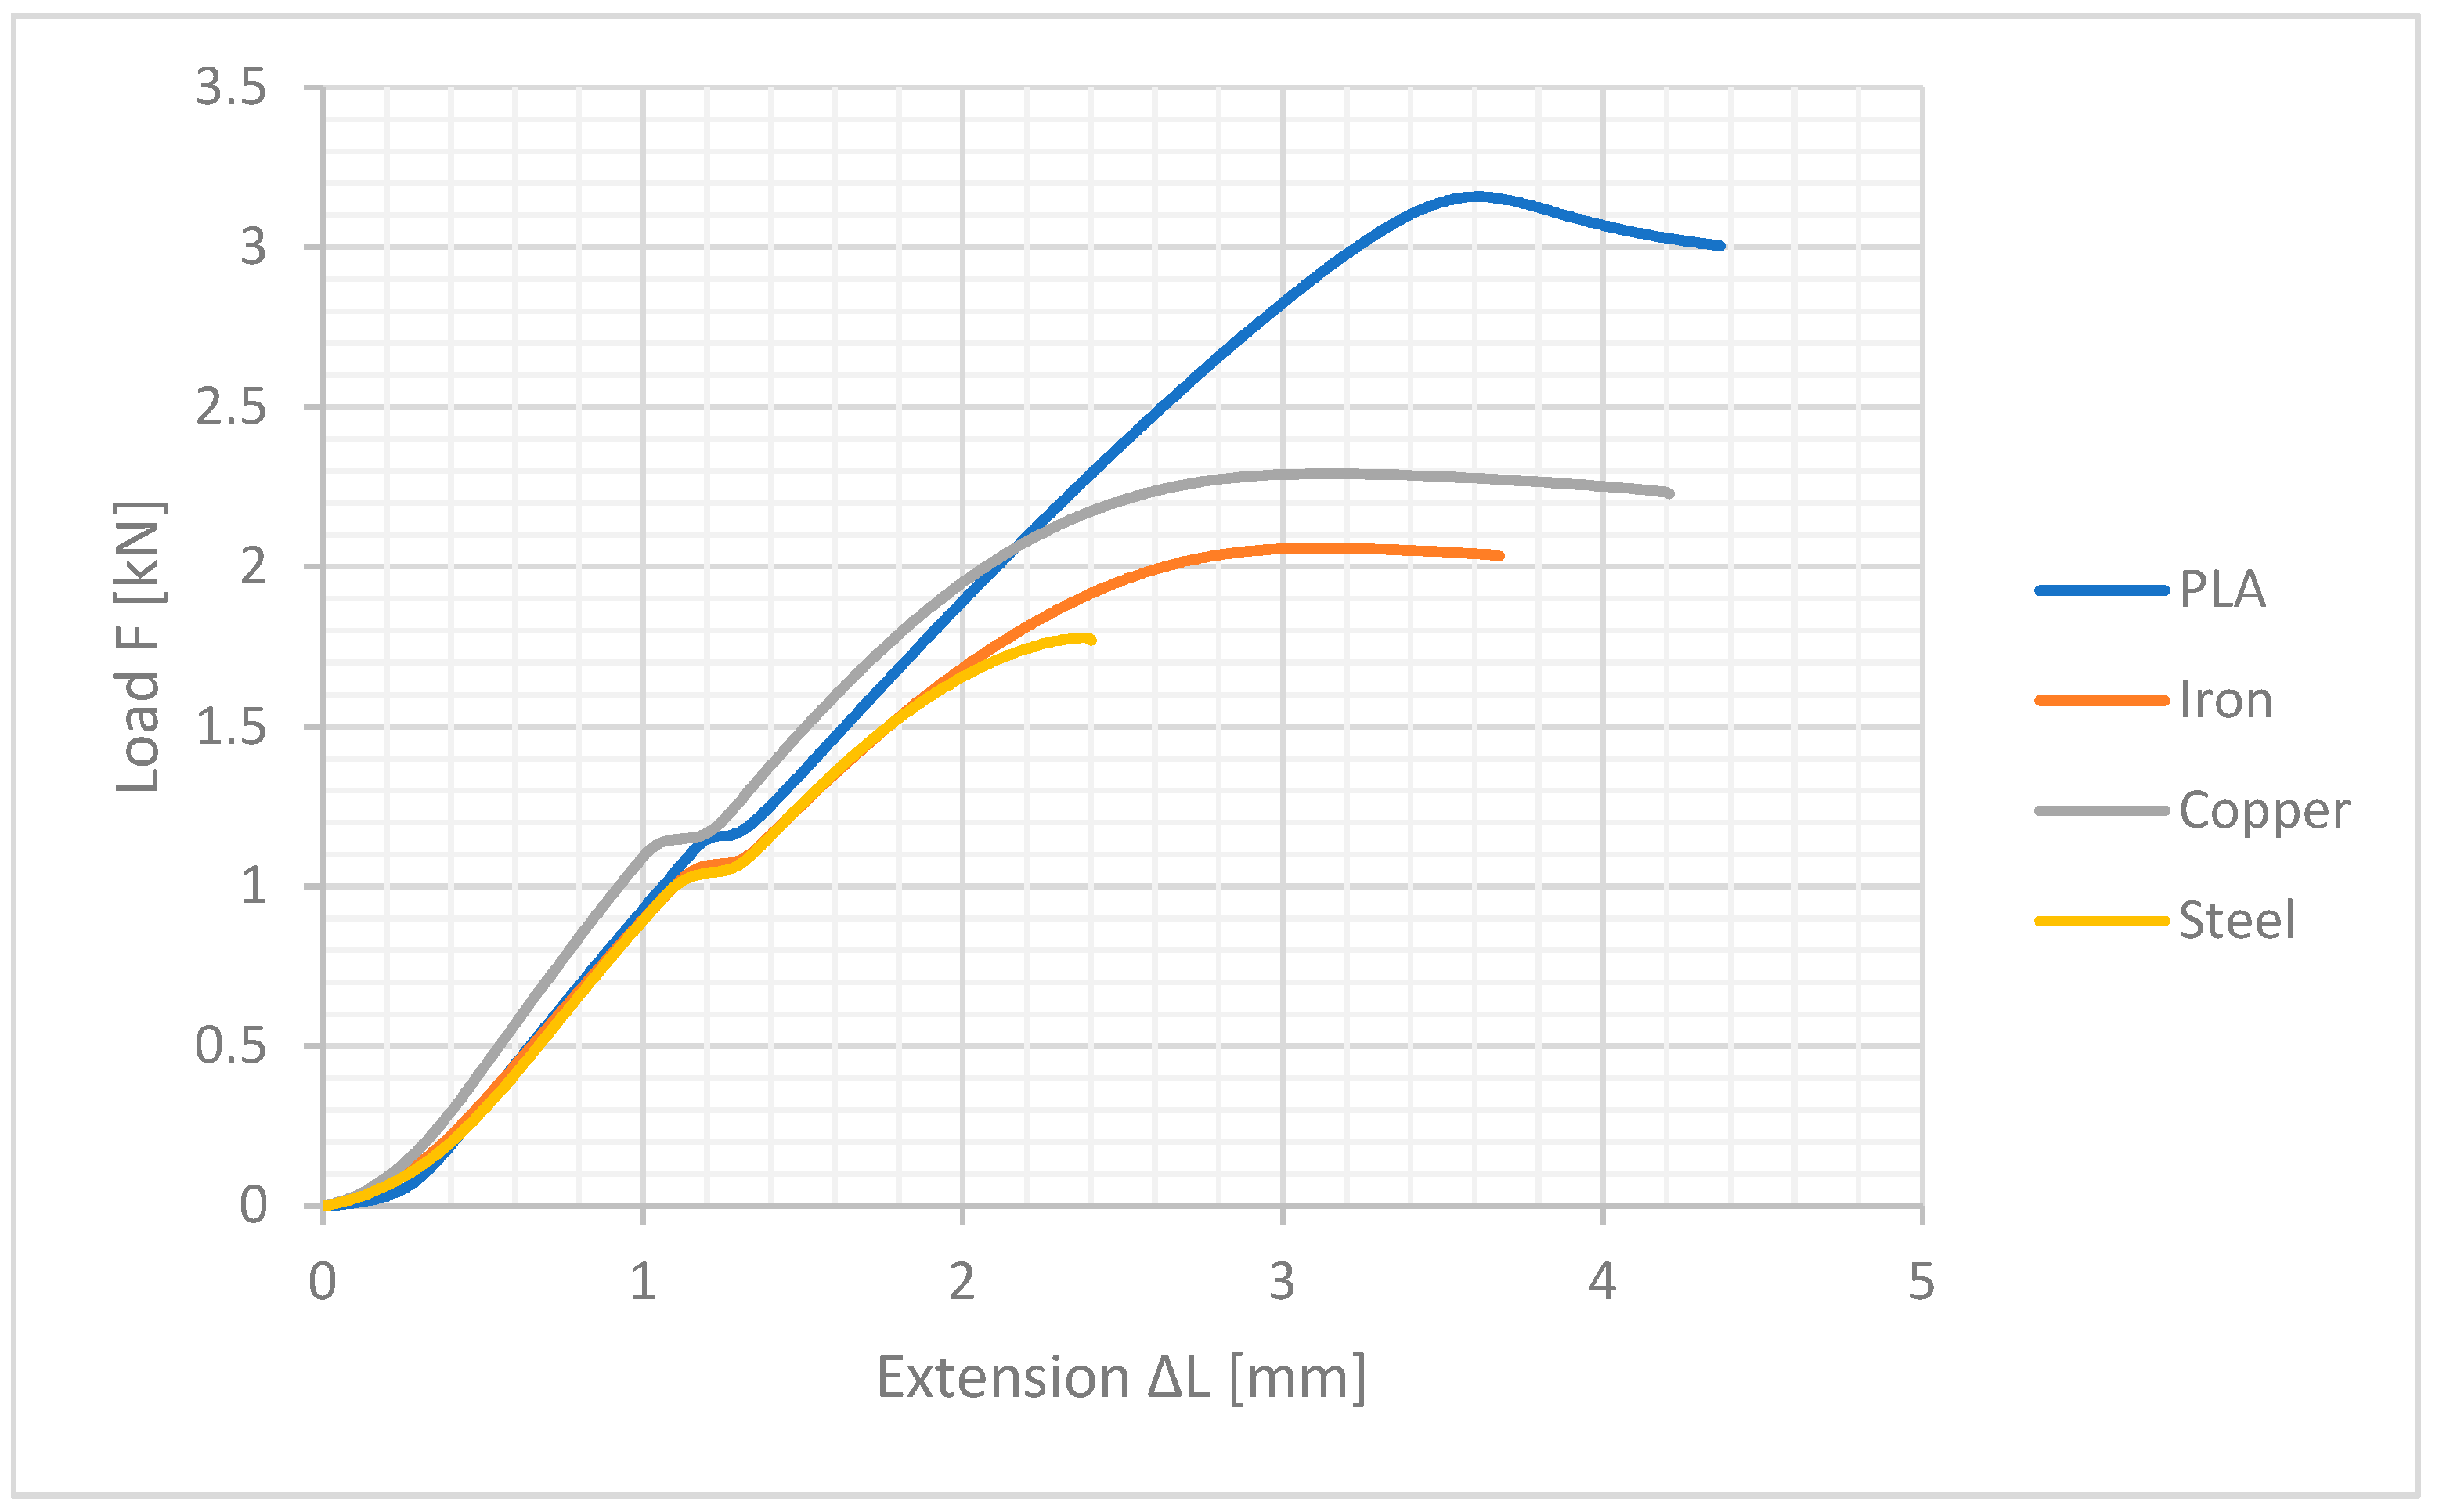
The result of the measurements is a document with individual values obtained in course of the measurement. The measurement is repeated for each test sample and finally evaluated using tables and graphs. The measured and calculated values obtained in the static tensile test are given in
Figure 12. The values of the tensile force Fm show the maximum values of the applied force recorded during the experiment (forces at the peak of the load force).
The subsequent graph of dependence indicates the values of the ΔL elongation under the maximum tensile force (
Figure 13).
The measured values make it possible to determine the tensile strength Rm [MPa]. During a static tensile test (
Figure 14), there is a graphical (or digital) dependence between elongation and stress. Through measurements based on the results, it is possible to claim that the selected material is brittle, with a small yield strength. Due to the layered nature of the filament, there is no significant formation of a narrowed neck.
Breaking zones occur randomly in the space between the grips. The cause may be defects in interlayer mesostructural properties such as pore size. When working with materials containing additives defects can cause the abnormal size of particles and their weak mutual adherence weakening the polymer matrix. Various defects also may occur during printing pure material of the specimens which can lead to the final rupture. The most common causes are uneven material flow, unsuitable thermal conditions, and degraded material. The wet material in the printhead heats up very quickly above the boiling temperature, where the accumulated steam splashes through the nozzle, and the escaping gas damages the produced walls.
When evaluating the static tensile strength test (
Figure 15), the magnitude of the error was determined based on the results of the measured values using mathematical-statistical methods. Determination of tensile properties, Part 1: General principles, Accuracy of measured values are calculated using a confidence interval (95% probability) according to STS ISO 2602—Statistical interpretation of test results, average estimation, confidence interval. The main task of this standard is to give the most correct interpretation of the statistics calculated from the measured values for the most appropriate interpretation of the results obtained. This standard assumes that, in the case of test samples, measurements are made randomly and are independent.
The resulting interval is called the confidence interval for the average. It is associated with a reliability factor that represents the probability expressed as a percentage. The mean value of
m is estimated by the mean of all midpoints
for
n measurements. In this case,
n = 10 measured results of test pieces made of a specific material (M1, M2, M3, M4) according to Formula (1) [
47]:
The actual confidence interval and the confidence interval are calculated from the estimate of the mean and the standard deviation
s by the Formula (2) [
47]:
where:
σM1i—the value of the
ith measurement from the specific material (
i = 1, 2, 3, …,
n);
n—total number of measurements;
σM1—the arithmetic mean of the
n calculated measurements form specific material.
A 95% confidence level is set for STS ISO 527 and in one specific case, a one-sided or two-sided confidence interval must be specified. For the 95% confidence level, the two-sided confidence interval for the average of the set is determined by the subsequent two-sided inequality according to Formula (3) [
47]:
where:
—the mean of all midpoints of classes calculated as in sub-clase;
n—total number of measurements;
s1 —standard deviation from the specific material (1, 2, 3, …,
n);
m—mean value.
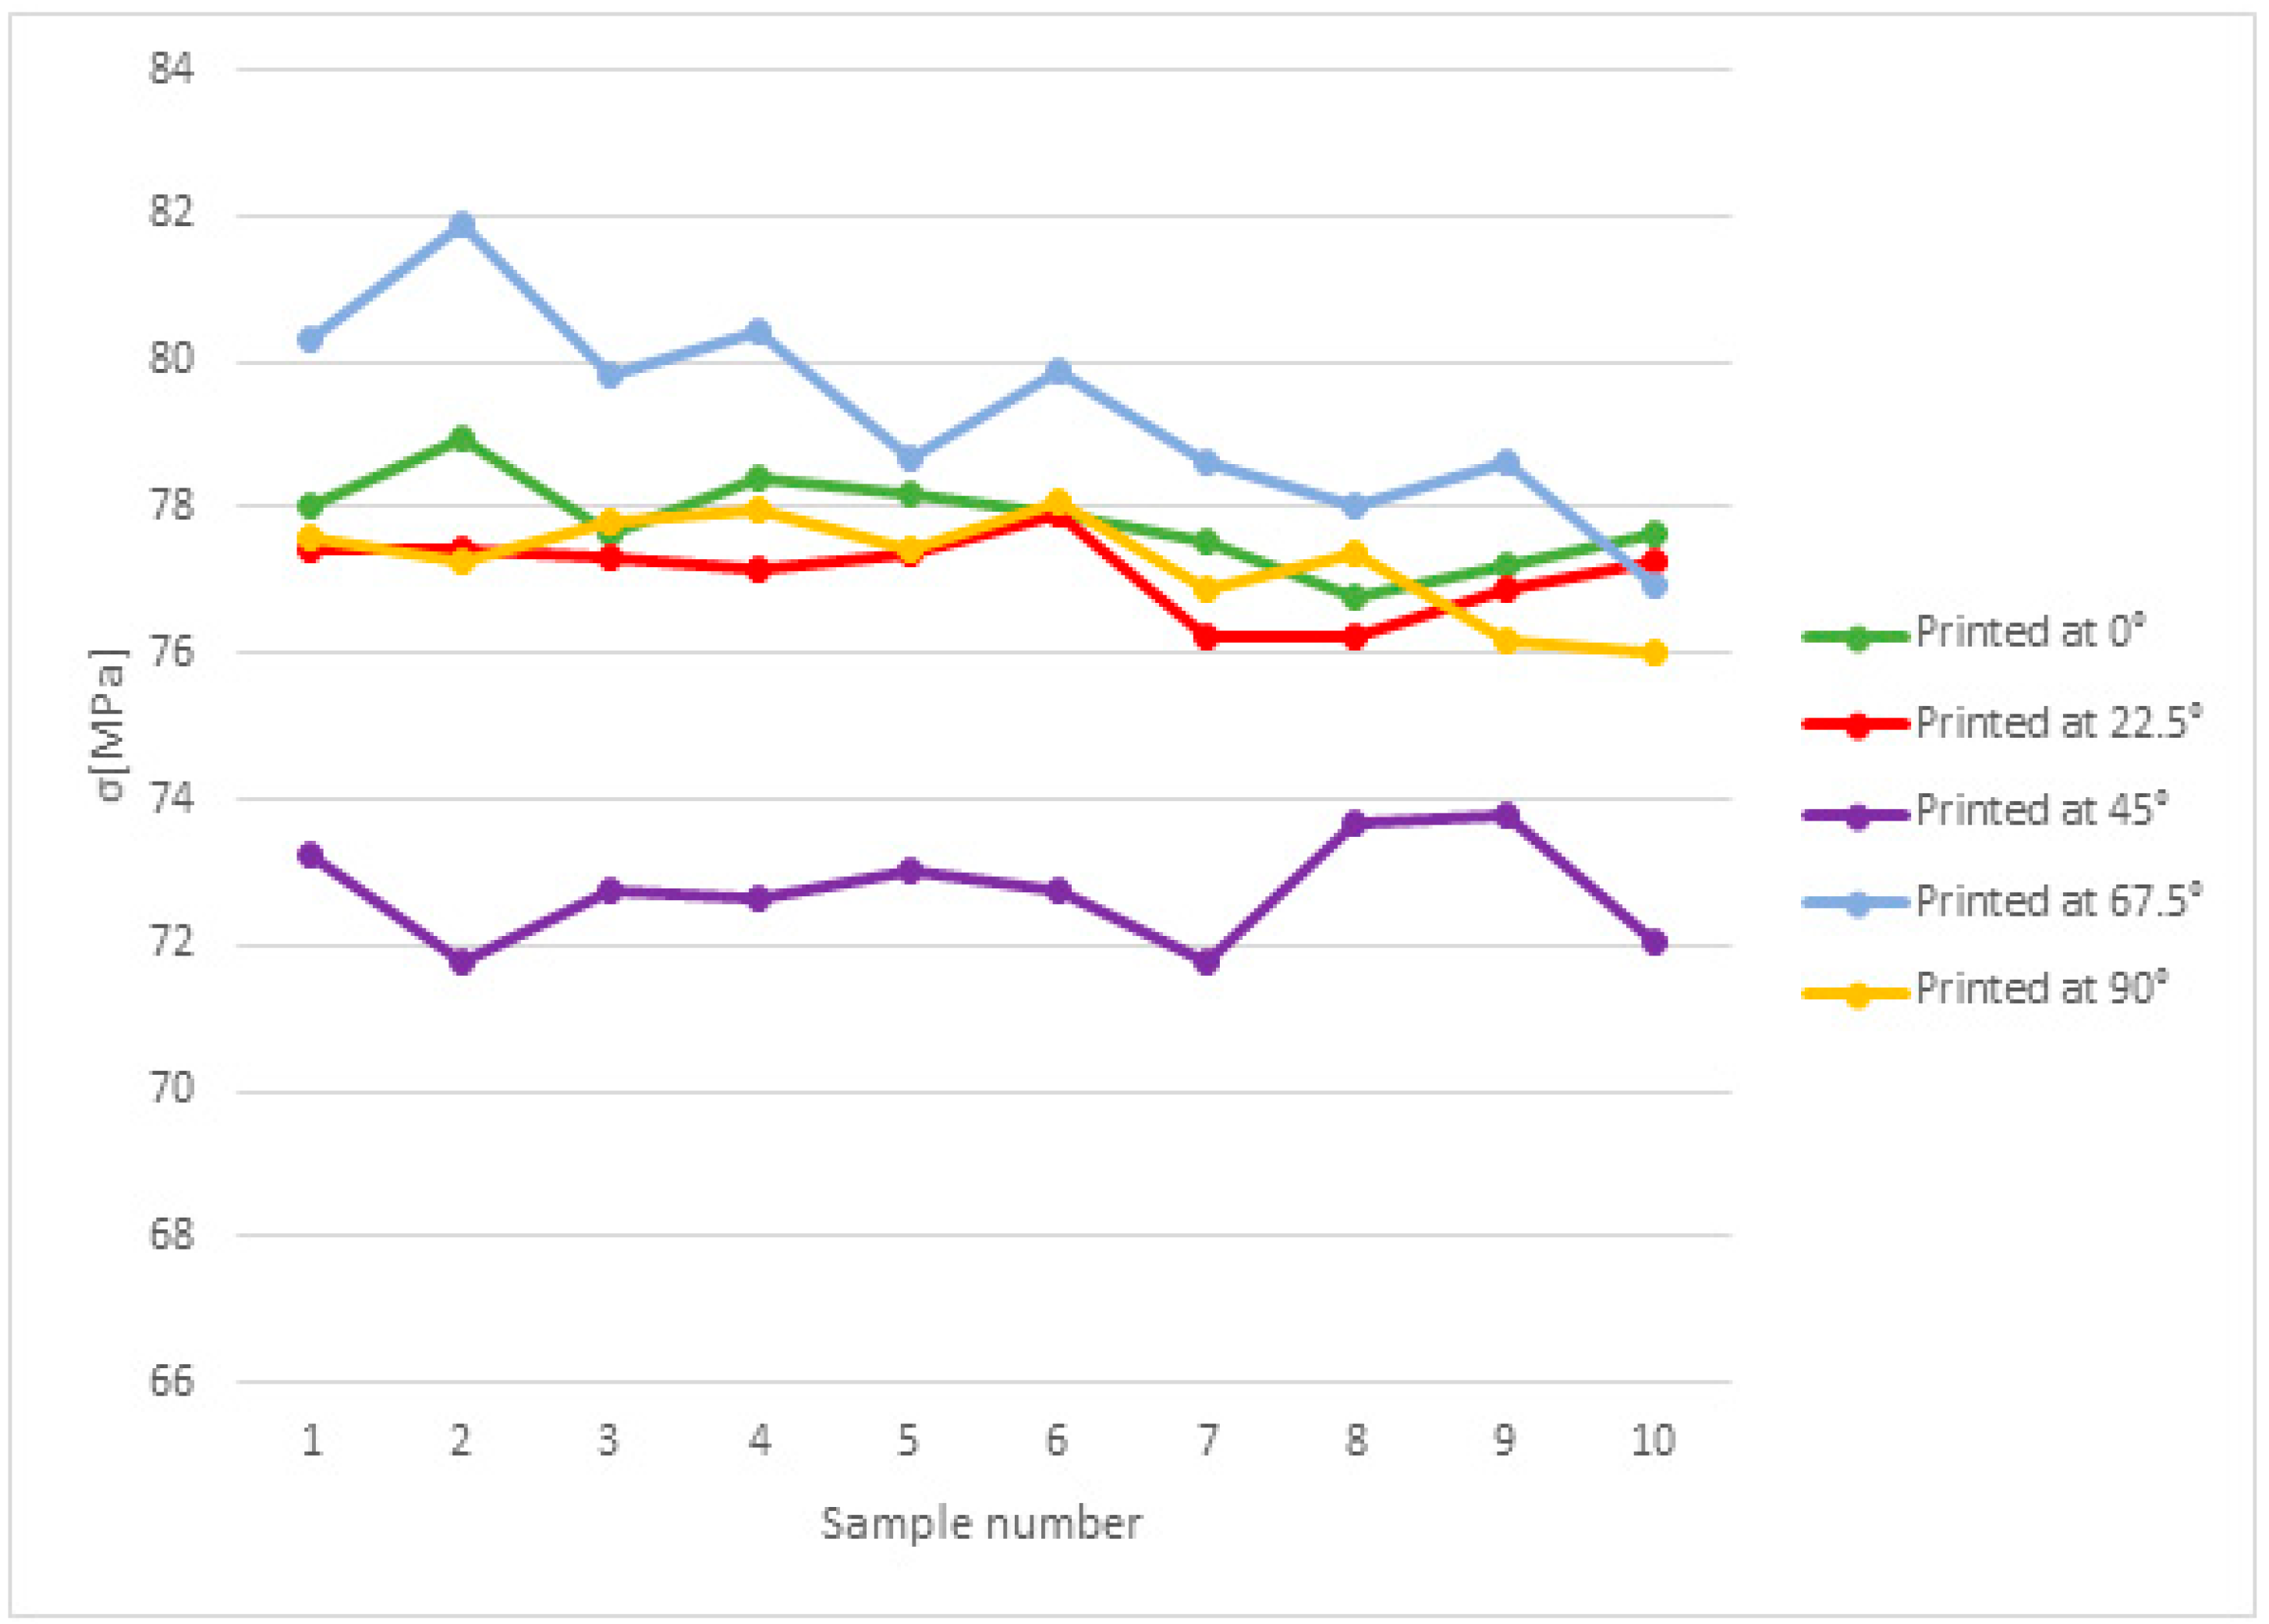
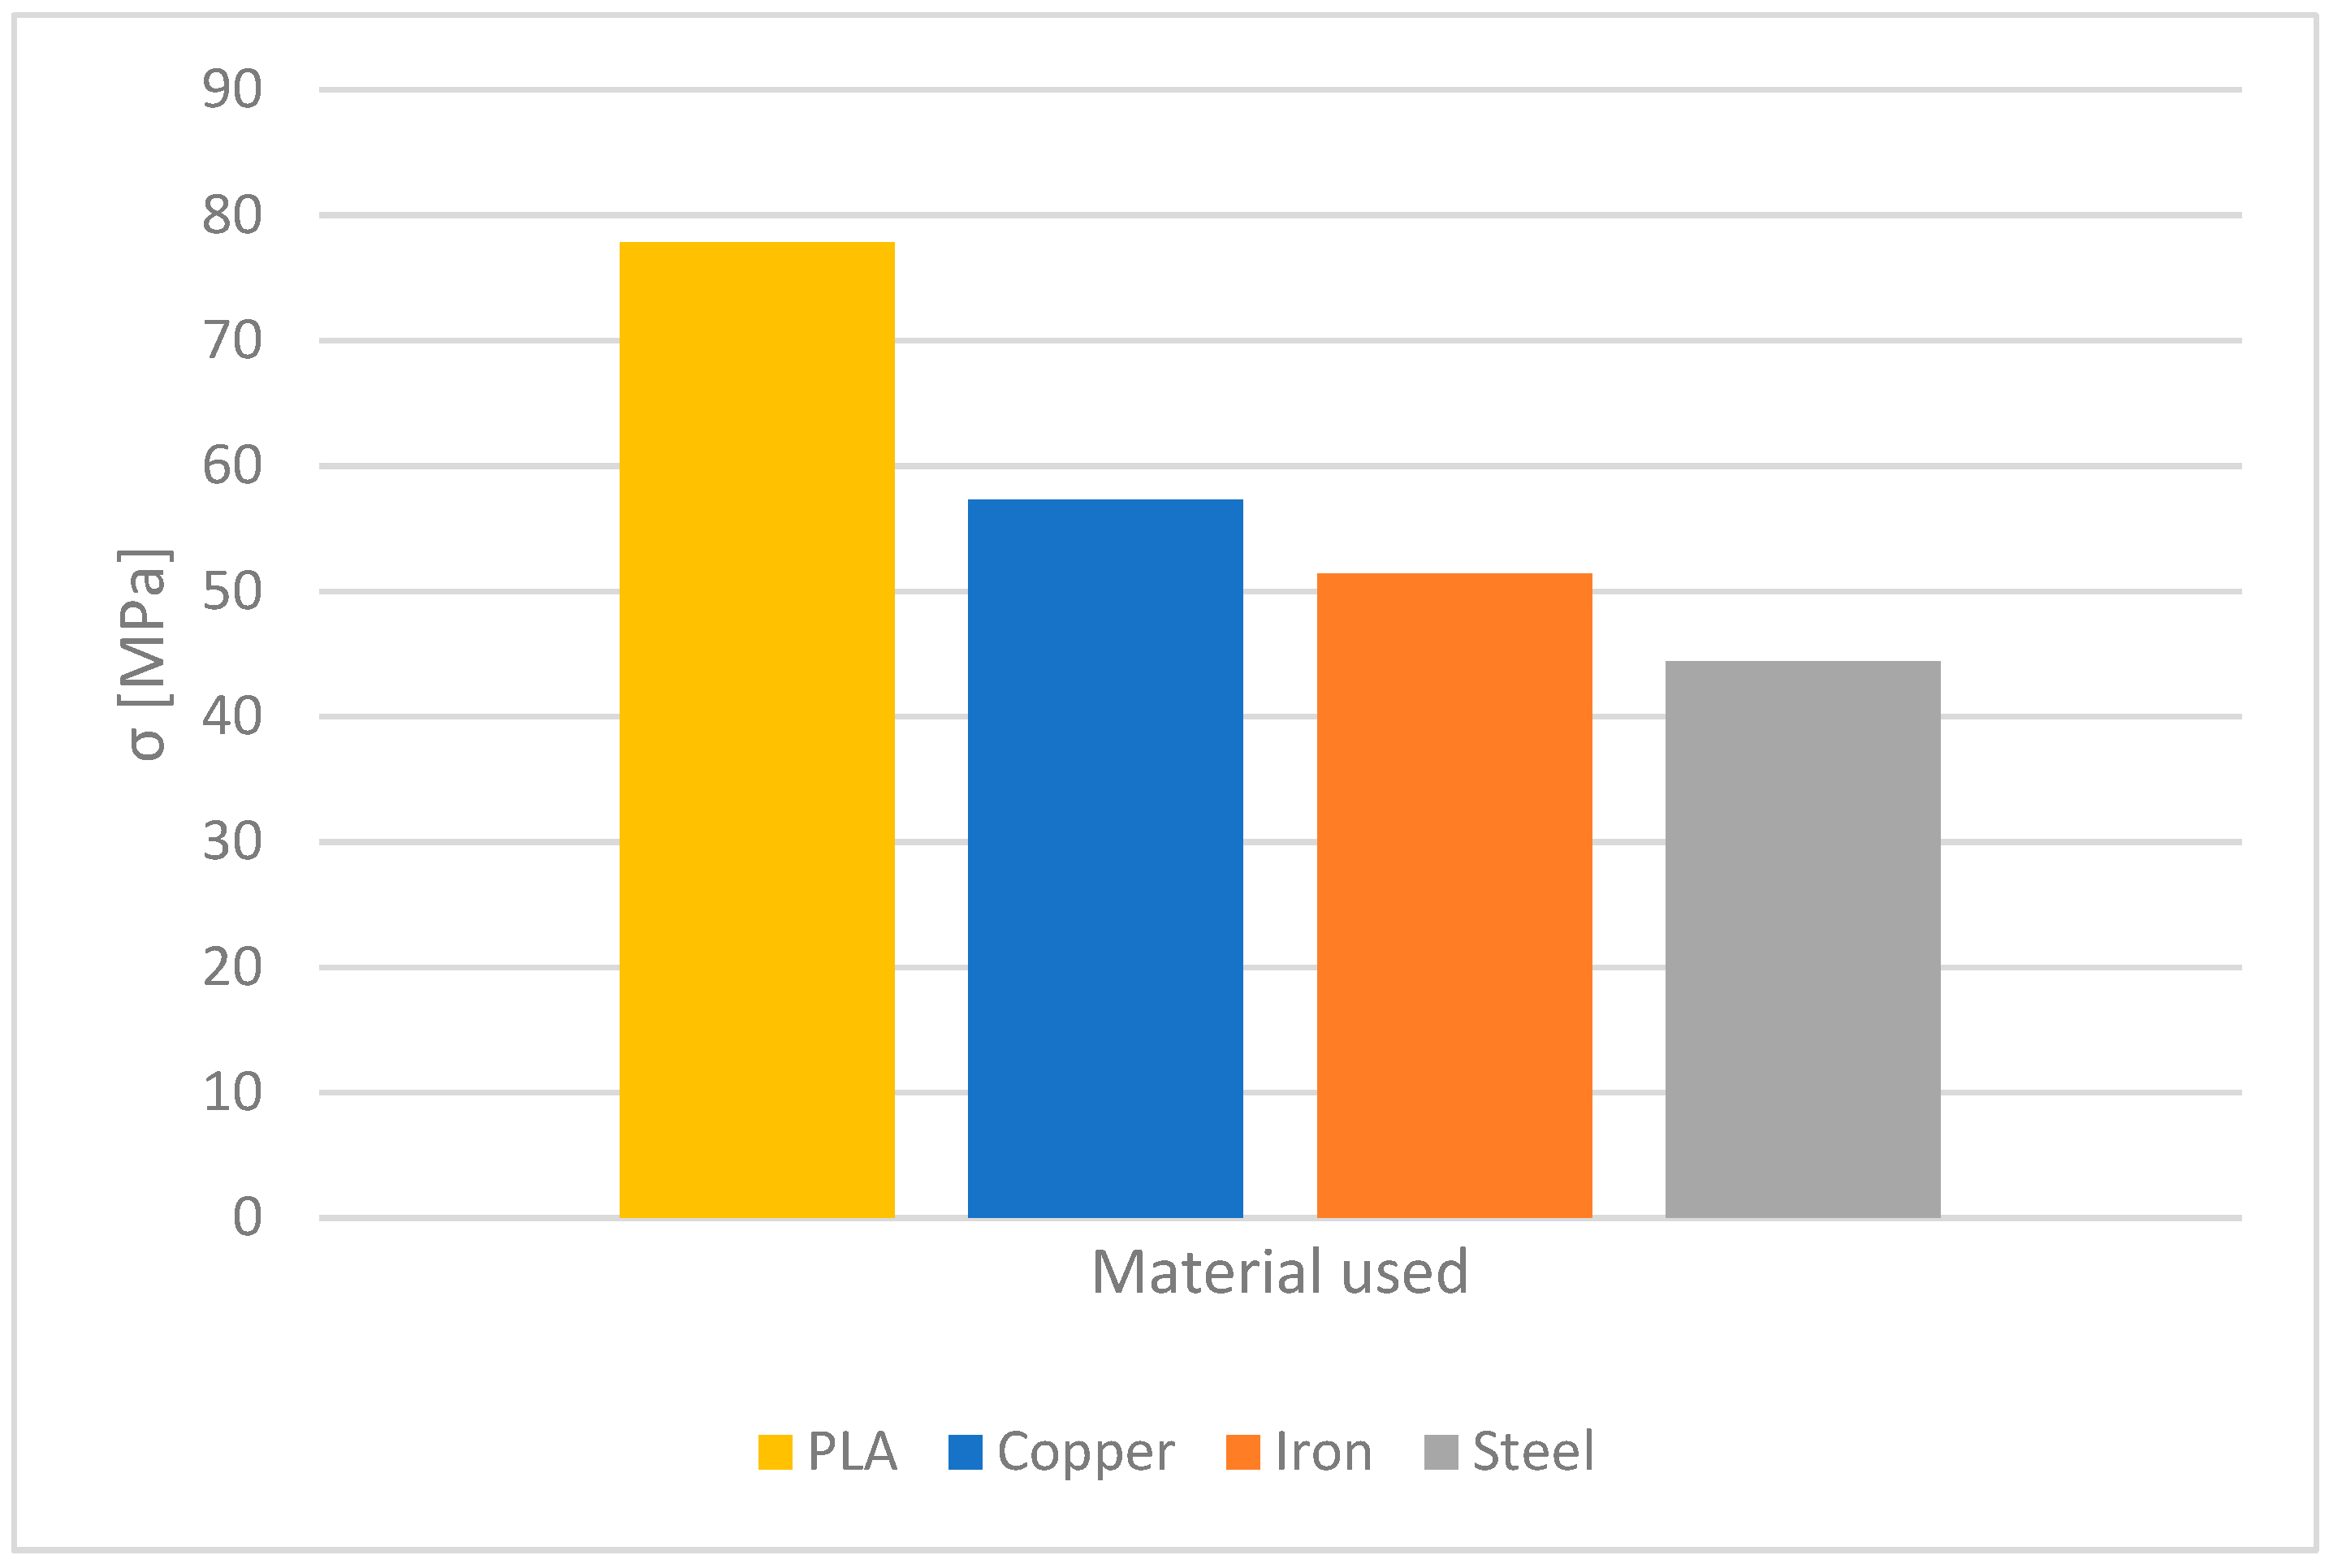
Based on the measurements maximal stress values for test samples made of PLA and PLA matrix with admixtures are presented in
Figure 16. Due to the same particle size of the metal powder admixtures, only the proportion of the particle content in relation to pure PLA affected the strength. For the sample containing copper, due to its higher percentage of particles, the manufacturer added 2.6% polymer binder to avoid breaking the filament during the dosing process into the extruder. Therefore, these results are a little better.
Figure 17 presents the maximal load into the break of a sample printed with 0° print orientation on the build table, rotated around the
Z-axis. All samples were printed at the same settings referred to in
Table 1. 100% infill pattern changed gradually, layer by layer, at an angle of 45° and 135°.
Figure 16 and
Figure 17 show the reduced strength of the samples with additives, but by adjusting the production parameters it is possible to increase the resulting strength. Another treatment is possible to, for example, annealing-process of increasing temperature to improve tensile strength and heat resistance. These possibilities were not realized in the experiments. All samples were made with constant production parameters.
The strength of the sample to be torn is also affected by the shape of the molten fiber flowing from the nozzle and its subsequent binding to the previously produced layer. The basic visual inspection of the outer wall surface will tell a lot about the quality of the correct filament flow setting (
Figure 18). If holes are visible in the layers, there may be more defects, such as an incorrect (or even inconsistent) diameter of the used filament, inappropriately selected operating parameters for layer height and filament dosing. Conversely, when a certain percentage of excess filament is dosed, material may accumulate in the nozzle, resulting in a visually distinct wider layer, often repeated periodically [
48]. With seemingly beautiful surfaces, more accurate measurements are needed to determine the surface quality.
New FDM 3D printed parts can be used as final components in specific cases for example in machines with short life such as missiles, emergency service solutions (temporary replacements), alternative mechanisms with less efficiency, or in prototyping [
49]. It is also necessary to know the surface quality of raw parts and possible treatment options. When using a production machine containing secondary machining spindle, it is possible to machine each layer after extrusion to achieve a higher surface quality, even in internal structures [
50]. For example, extruded bearings with metal additives on the rolling parts can be more abrasion-resistant. When machining the surface with a milling cutter immediately after the formation of the layer and repeating it in the whole 3D printing process it is possible to achieve higher quality surfaces for their smoother operation. Presented results show possibilities of material finish for future use of parts with high-quality surfaces.
When measuring the surface roughness at the edge of test samples, the surface quality is significantly affected by the filament used. In addition to additives in the form of beads of different sizes and the adjustment of the height of the working layer and the flow of the filament itself, it is necessary to pay attention to the correct storage of the filament. Certain plastics can absorb atmospheric moisture very quickly, which results in uneven printing and thus weakening the product walls.
Table 4 offers surface roughness measurement values of different layer heights for the materials used.
The pure PLA filament without additives shows the best parameters. In others, the presence of additives greatly roughens the samples’ outer surface.
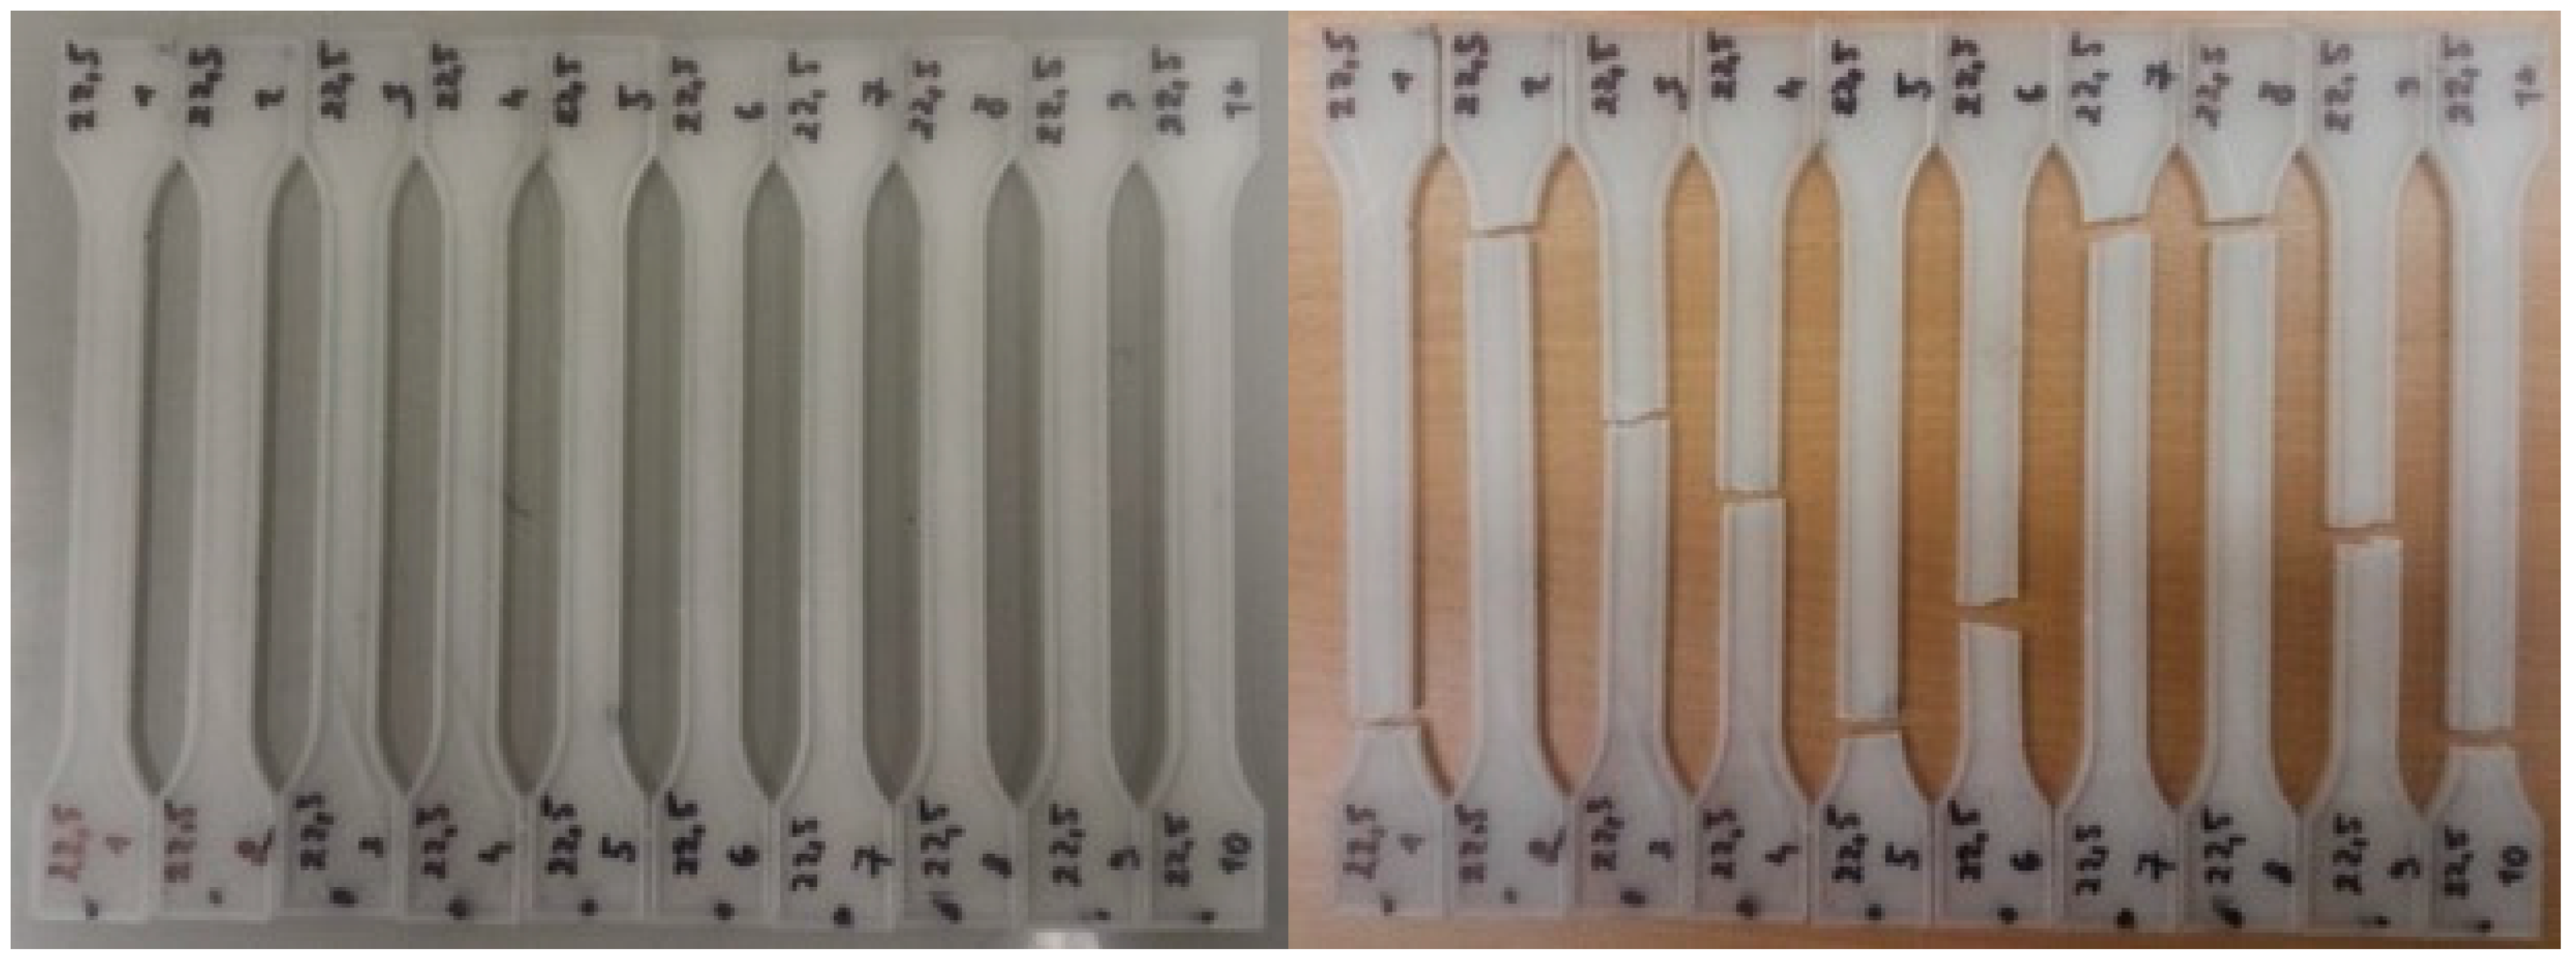
In the next step, the samples were subjected to wet grinding for 10 min on 2000 grit sandpaper.
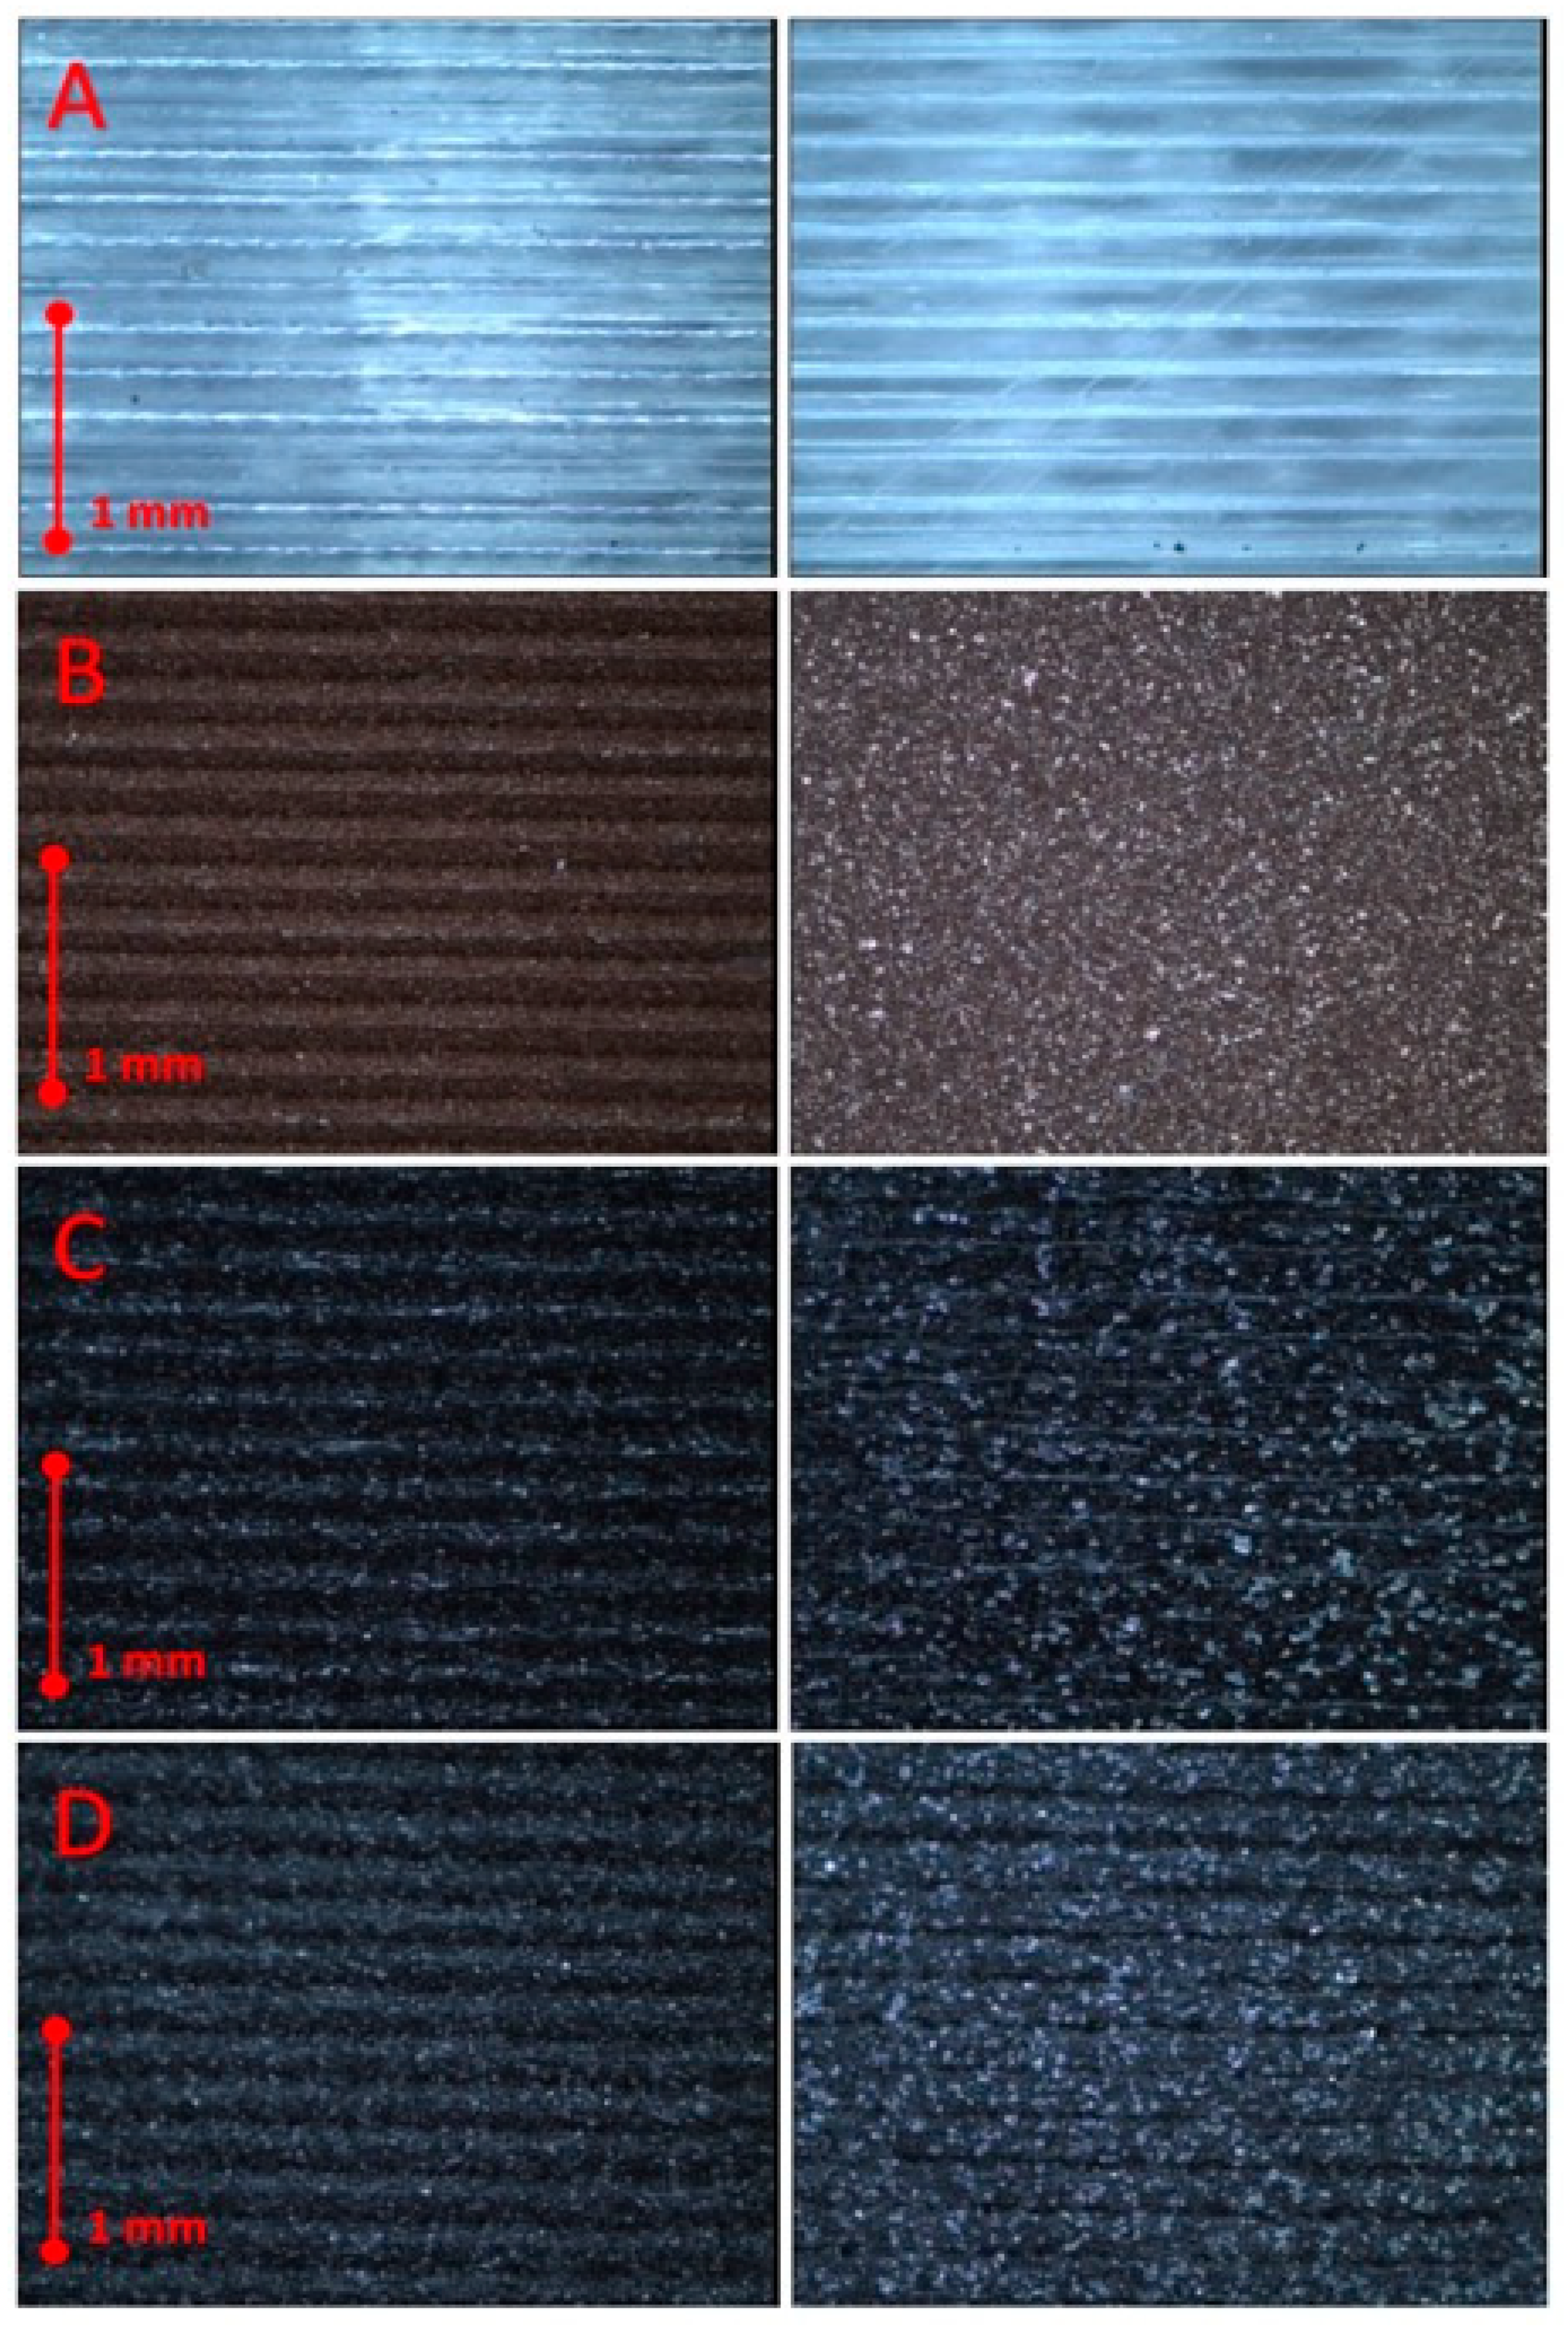
Figure 19 offers a close-up view of the wall of the test specimens before and after grinding. Images were captured under an inverted microscope Nikon Eclipse MA100.
The grinding achieved the sample surface became smooth. Due to the high concentration of copper in the PLA plastic, it was possible to process this material very well. The best values for the surface of 0.2 mm were: Ra = 0.274 [µm], Rq = 0.352 [µm], Rz = 2.338 [µm].
Figure 20 offers a view of the sidewall surface measured before grinding at a layer height of 0.1 mm. This layer offered excellent surface properties for all materials without visible external defects right after 3D printing. The measurement has made it obvious that, despite constant settings, the fiber in each layer flows out inconsistently, an overpressure builds up in the nozzle during certain working transitions, which is manifested in certain layers by a certain increase in the percentage of material flow. This shortcoming can be partially compensated for, but not completely suppressed in the production process on FDM devices. For basic applications of the model, this is only a visual error. If the production process is to be designed to generate functional assemblies, inequalities must be eliminated as much as possible. In the production of individual parts only tenths of a millimeter or less apart without the use of a separating material, surface irregularities result in the parts being connected into one non-functional unit.


 ,
, 


