Article

Plasmonic Elliptical Nanohole Arrays for Chiral Absorption and Emission in the Near-Infrared and Visible Range

Department S.B.A.I., Sapienza Università di Roma, Via A. Scarpa 14, I-00161 Rome, Italy
*
Author to whom correspondence should be addressed.
Appl. Sci. 2021, 11(13), 6012; https://doi.org/10.3390/app11136012
Submission received: 21 May 2021 / Revised: 24 June 2021 / Accepted: 26 June 2021 / Published: 28 June 2021
(This article belongs to the Special Issue Optical Chirality: Structures, Detection and Applications)

Abstract

:

Featured Application

Plasmonic elliptical nanohole arrays coupled with emitting layers for near-infrared and visible chiral sources.

Abstract

Chiral plasmonic nanostructures with tunable handedness-dependent absorption in the visible and infrared offer chiro-optical control at the nanoscale. Moreover, coupling them with emitting layers could lead to chiral nanosources, important for nanophotonic circuits. Here, we propose plasmonic elliptical nanohole arrays (ENHA) for circularly dependent near-infrared and visible emission. We first investigate broadband chiral behavior in an Au-ENHA embedded in glass by exciting it with plane waves. We then study the coupling of ENHA with a thin emitting layer embedded in glass; we focus on the emission wavelengths which provided high chirality in plane-wave simulations. Our novel simulation set-up monitors the chirality of the far-field emission by properly averaging a large set of homogeneously distributed, randomly oriented quantum sources. The intrinsic chirality of ENHA influences the circular polarization degree of the emitting layer. Finally, we study the emission dependence on the field distribution at the excitation wavelength. We demonstrate the chiral absorption and emission properties for Au-ENHA emitting in the near-infrared range, and for Ag-ENHA which is excited in green range and emits in the Lumogen Red range. The simple geometry of ENHA can be fabricated with low-cost nanosphere lithography and be covered with emission gel. We thus believe that this design can be of great importance for tunable chiral nanosources.

1. Introduction

Nanohole arrays (NHAs) are a class of nanostructured surfaces consisting of nanoscale voids fabricated in the surface of a material. Plasmonic NHAs can couple the incoming photons to plasma oscillations, which then result in surface plasmon polaritons (SPPs) [1,2,3]. These specific resonant electromagnetic excitations are strongly confined around the plasmonic NHA, and lead to electromagnetic field enhancement at the interface. SPPs can offering interesting phenomena such as sharp resonances, extraordinary optical transmission and extreme field enhancements. As such, they have been long investigated for applications including sensing, optical spectroscopy, surfaced enhanced Raman scattering etc. [4,5,6,7,8,9].
With the further development of nanotechnology, the introduction of symmetry breaking in plasmonic geometry offered additional, intriguing chiral effects at the nanoscale [10,11,12]. Namely, chiral nanostructures differently absorb circular polarization of the opposite handedness, leading to different optical response when excited by left and right circular polarization (LCP and RCP, respectively). This effect is known as circular dichroism (CD), and it has been long studied in the 3D nanostructures which mimic chiral shapes such as nanohelices [13,14,15], twisted bilayered metamaterials [16], folded eta-shaped metamaterials [17], and vertical nanowires asymmetrically covered by metal and excited at oblique incidence [18,19,20]. Moreover, chiral effects and CD can be obtained by the planarization of chiral nanostructures, which often simplifies the nanofabrication and the coupling with additional sensing or emitting material. Specifically, nanoholes with gammadion- or helix-like chiral shapes provided chiral control in terms of transmission [21,22,23], or diffraction [24]. Moreover, the influence of the lattice asymmetry allows for the asymmetric, non-reciprocal transmission of circularly polarized light through misaligned SPPs in the plasmonic NHA [25]. More recently, we showed that the combination of lattice asymmetry and a simple elliptical nanohole shape can provide a chiral response in the near-infrared range. Namely, elliptical nanohole arrays (ENHA) with in-plane symmetry breaking can provide extremely high circular dichroism in the near-infrared range [26]. Furthermore, similar simple chiral geometries can be fabricated by cost- and time-efficient techniques such as nanosphere lithography (NSL) [27,28], and shadow sphere lithography [29]. Such passive nanostructures provide chiro-optical responses in transmission, reflection and absorption, thus showing the great potential for chiral sensing. On the other hand, similarly to the achiral NHA investigated in [30,31,32], ENHAs can be coupled with an emitting layer. Therefore, they can be of interest for both chiral sensing and chiral light sources.
In this work, we propose ENHAs for chiral emission in the near-infrared and visible ranges. Our numerical set-up combines two types of simulations: with plane-wave excitation, and with dipole excitation of the ENHA. Firstly, we report on the broadband chiral behavior of ENHAs for two plasmonic materials: gold (Au-ENHA) and silver (Ag-ENHA); we embedded the 2D periodic ENHA in glass, and we excited them with LCP and RCP plane waves. Circular dichroism in absorption is mainly governed by the ENHA 2D periodicity, and it can be optimized in the near-infrared and visible domains. We then studied the coupling of the ENHA with a thin emitting layer embedded in glass above the plasmonic layer by exciting the ENHA with numerous electric dipole sources. Specifically, we investigated the chirality of far-field emission at wavelengths which provided high chirality in plane-wave simulations. For the Au-ENHA, we focused on the emission wavelengths of 740 nm and 940nm, which showed opposite chirality in the absorption; we show that the chirality also exhibits inversion in the emitted far-field. Next, we include the possibility of tuning the emitted chiral properties by engineering the excitation field confinement at shorter wavelengths. We demonstrate this effect for visible excitation and near-infrared emission of the Au-ENHA, and for green (532 nm) excitation and red (630 nm) emission of the Ag-ENHA, which is of interest for the commercially relevant Lumogen Red dye. Simulations of a large number of randomly oriented quantum emitters allow us to average the overall response, which makes our set-up adaptable for modelling real applications where emitters such as dye molecules are distributed in the refractive index matching material which covers the plasmonic layer. Moreover, the additional degree of freedom introduced by electromagnetic confinement at the excitation wavelength opens new perspectives in tunable efficient chiral light sources.

2. Materials and Methods

We investigated absorption and emission chirality by using two distinct simulation approaches in the commercially available finite difference time domain (FDTD) solver by Lumerical [33]. The first part of the work involved “passive” simulations of the chiro-optical response of the ENHA previously optimized in [26]. The second part involved “active” simulations of distribution of dipoles within the dielectric layer above the ENHA. Finally, we combined the two approaches to account for the excitation influence on the emission chirality. Below, we present the two main simulation methods of this work.
Firstly, we simulated the broadband optical response of the ENHA in the range of 400–1000 nm using plane-wave excitation. In Figure 1a, we show the geometry of the ENHA, which is defined by the lattice parameter a, while Dx and Dy represent the short and the long nanohole diameters, respectively. Here, the FDTD domain is defined by periodic Bloch boundary conditions (BBC) in the xy-plane, while in the z-plane we define perfectly matched layers (PML). We take t = 100 nm as the thickness of the plasmonic (Au or Ag) layer. This plasmonic layer lies on the semi-infinite dielectric substrate, and it is embedded in 300 nm of additional refractive index matching medium; in this way, the ENHA is surrounded by a dielectric medium with a refractive index of 1.45. The unit cell of the array is defined by the surface of a and a√3, as NHAs with such hexagonal symmetry can be fabricated using the low-cost NSL technique (as in our previous experimental works). The nanohole has elliptical geometry, and the long ellipse axis is 15° shifted with respect to the hexagonal symmetry, as has been previously optimized in [26]. For the Au-ENHA, we used the Au complex refractive index from the Lumerical material database; for the Ag-ENHA, we used experimental data from the ellipsometric measurements performed in our previous work [27]. In order to simulate circularly polarized plane-wave excitation, we combined two x- and y-polarized broadband plane-wave sources with the same properties, except for the phase difference. The phase differences of 90° and −90° correspond to LCP and RCP polarizations, respectively. The ENHA is excited under normal incidence from the top. Power monitors below the plasmonic layer and behind the source, detect transmission and reflection, respectively. Absorption is then calculated as Ai = 1 − Ri − Ti, where i = LCP or i = RCP, and the final result of these passive simulations is the normalized circular dichroism in the absorption CDA:
C D A [ % ] = 100 A L C P A R C P A L C P + A R C P .
While the passive properties of nanohole-based chiral materials have been previously studied, here we investigate the chiral properties of ENHAs coupled with the emitting layer. In the following, we will consider the light emission possibility of the ENHA coupled with dipole sources to be active. In this approach, a large FDTD domain surrounds more than 100 unit cells in the xy-plane, and it is defined by the PML boundaries in all six directions. A larger, non-periodic, FDTD volume is necessary in order to account for the periodic nature of the ENHA without introducing unnatural coherence [34]. An electric dipole oscillates as a point source, exciting the ENHA at 20 nm above the plasmonic layer. We show the schematic of such simulation in Figure 1b. The dipole emits at the single emission wavelength λem, and it is defined by its orientation (x-, y-, or z-orientation), and position in the embedding layer. While we keep z position at 120 nm above the substrate, in the xy-plane we considered a homogeneous dipole distribution, which properly models dielectric layers doped with emitting materials. Next, we explain the novelty of the active simulation set-up for chiral emission, compared to previous, achiral nanostructures. It must be noted that all the chiral phenomena presented, arose from the coupling of an achiral dipole with a chiral nanostructure, as the dipole sources do not represent molecules which possess their own intrinsic chirality.
In the past, electromagnetic modelling followed experimental studies of fluorescence from emitting layers coupled to achiral NHA. The authors in [30,31] reported on SPP-mediated red light emission from circularly shaped nanoholes organized in a 2D periodic array with quadratic symmetry. The authors in [32] investigated low-cost achiral NHAs with hexagonal symmetry, coupled with Er3+ emitters. In these cases, the averaging of different dipole positions across the unit cell was simplified due to the in-plane symmetry of the achiral structures, allowing for the simulation of one quarter of the unit cell. Here, instead, the ENHA in-plane symmetry is broken by both the elliptical shape and the 15° offset from the hexagonal symmetry lines. Therefore, the emitted characteristics need to be averaged over the complete distribution of the dipoles across the unit cell, which is done by properly modelling the homogeneous dipole distribution in the cell with hexagonal symmetry, as shown below.
The position of a dipole for a single simulation is defined by its Δx and Δy offset from the center of the FDTD domain; this domain, now defined by PML layers, has equal dimensions in the x- and y-directions, thus preventing any additional asymmetry in the chirality calculations. Next, we focus on modelling suitable for real applications, where light emitters are homogeneously immersed in the host matrix in the vicinity of the nanostructures. In this case we consider emitters homogeneously distributed across the hexagon of the side a/2, as shown in the inset of Figure 1b. The surface density of the dipoles across this hexagon is constant, while the hexagon itself encompasses one chiral object (i.e., an elliptical nanohole tilted from the symmetry of the hexagon). Therefore, the final averaging of the emitted field and its chirality will take into account both the dipoles close to the nanohole center and those close to the rims of the nanohole. After convergence testing, we chose the ensemble consisting of dipoles on the points defining the hexagon (shared between 3 hexagons), and two or three additional dipoles between these points, on the hexagon rims (shared between 2 hexagons). Considering the constant surface density, the total number of dipole positions equaled 85, while the distance between two neighboring positions was held constant and equal to (1/5)*(a/2); the specific positions are marked as dots in the inset of Figure 1b. In this way, the homogeneity of the emitting material is ensured, while the polarization analysis of the simulation results reveals the overall chiral properties, which stem only from the chiral effects of the underlying nanostructure.
For each of the 85 possible positions, three simulations were run for each dipole orientation. The result of a single simulation was dipole radiation to the far-field, which was detected by a frequency-domain field-profile monitor. This near-field monitor was positioned in the air, 10 nm above the embedding medium, i.e., at 310 nm (dashed lines in Figure 1b); it encompasses the whole xy-plane of the FDTD region. The monitor collects the electromagnetic near-fields and decomposes them into a set of plane waves which propagate to the far-field. The near-to-far field projection results in a complex electromagnetic field which reaches the far-field hemisphere at a point defined by spherical coordinated θem and Ψem; there, it is decomposed into the LCP and RCP components by a Jones transfer matrix formalism. In this way, one can obtain ILCP and IRCP, as well as the total intensity Itot at each point on the hemisphere, which models the extrinsic chirality experiments where a quarter-wave plate and a linear polarizer were placed in the far-field [35,36]. The intensities from 3 × 85 simulations for all positions and orientations are then summed with weights η which account for the dipoles, which are shared between two- or four-unit cells, depending on their position [32]:
I ¯ i = k = 1 k = 85 η k ( I i , k , x + I i , k , y + I i , k , z ) ;
here, the subscript i denotes the LCP or RCP field, or their sum ( I ¯ L C P , I ¯ R C P , and I ¯ t o t , respectively). The final result of these simulations is the circular dichroism in the emission CDem:
C D e m [ % ] = 100 I ¯ L C P I ¯ R C P I ¯ L C P + I ¯ R C P .
We performed convergence testing to ensure that simulation results did not depend on the FDTD volume [37]. As the simulation of single wavelength emission collects total, LCP and RCP far-fields after 3 × 83 single simulations, we saved time-cost of our simulations by means of the far-field filter. This Lumerical property is a parameter of near-to-far field transformation, set between 0 (which turns the filter off) and 1 [33]; it ensures that the electromagnetic fields at the very edges of the near-field monitor in the xy-plane went to zero, which translates to higher numerical stability and faster convergence. For all the following simulations, we opted for an FDTD domain of 36 µm2 in the xy-plane, and a far-field filter of 0.1.
As a final step, we combined the two simulation approaches to investigate the influence of the electromagnetic field at the excitation wavelength. Emission enhancement in plasmonic nanostructures is governed by both enhancement at the emission wavelength, and by the near-field confinement at the excitation wavelength [38]. The previous active simulations of 85 random dipoles account for the weights of dipoles at different positions in the xy-plane by considering the homogeneous medium and dipole sharing between the neighboring unit cells; in Figure 1b, η = 1 for the dipoles inside the hexagon, η = 1/2 for the dipoles on the hexagon margins, and η = 1/4 for the two dipoles at the top and at the bottom. However, if the excitation laser leads to the enhancement and the inhomogeneous distribution of the electric field at the position of the dipoles, this can be approximated by a new weight factor, which now depends on both the position and the electric field confinement at excitation wavelength λexc. We extracted this factor by performing passive single-wavelength simulation at λexc, and by collecting the electric field intensity at the points of the dipole positions at z = 120 nm. Finally, we normalized the emission of the dipoles as:
I ¯ i = k = 1 k = 85 η ( | E ( k , λ e x c ) | 2 ) k ( I i , k , x + I i , k , y + I i , k , z ) .

3. Results and Discussion

Below, we present step by step of the design towards tunable chiral sources based on ENHAs and emitting layers. We start from the passive simulations of CDA in Au- and Ag-ENHA. Then, we investigate the active simulations of single dipoles distributed as the emitting layer for the Au-ENHA, and we investigate their average influence on the chiral emission in the near-infrared range. Finally, we investigate the Ag-ENHA with polarization-dependent excitation in the green range, and emission in the red visible range.

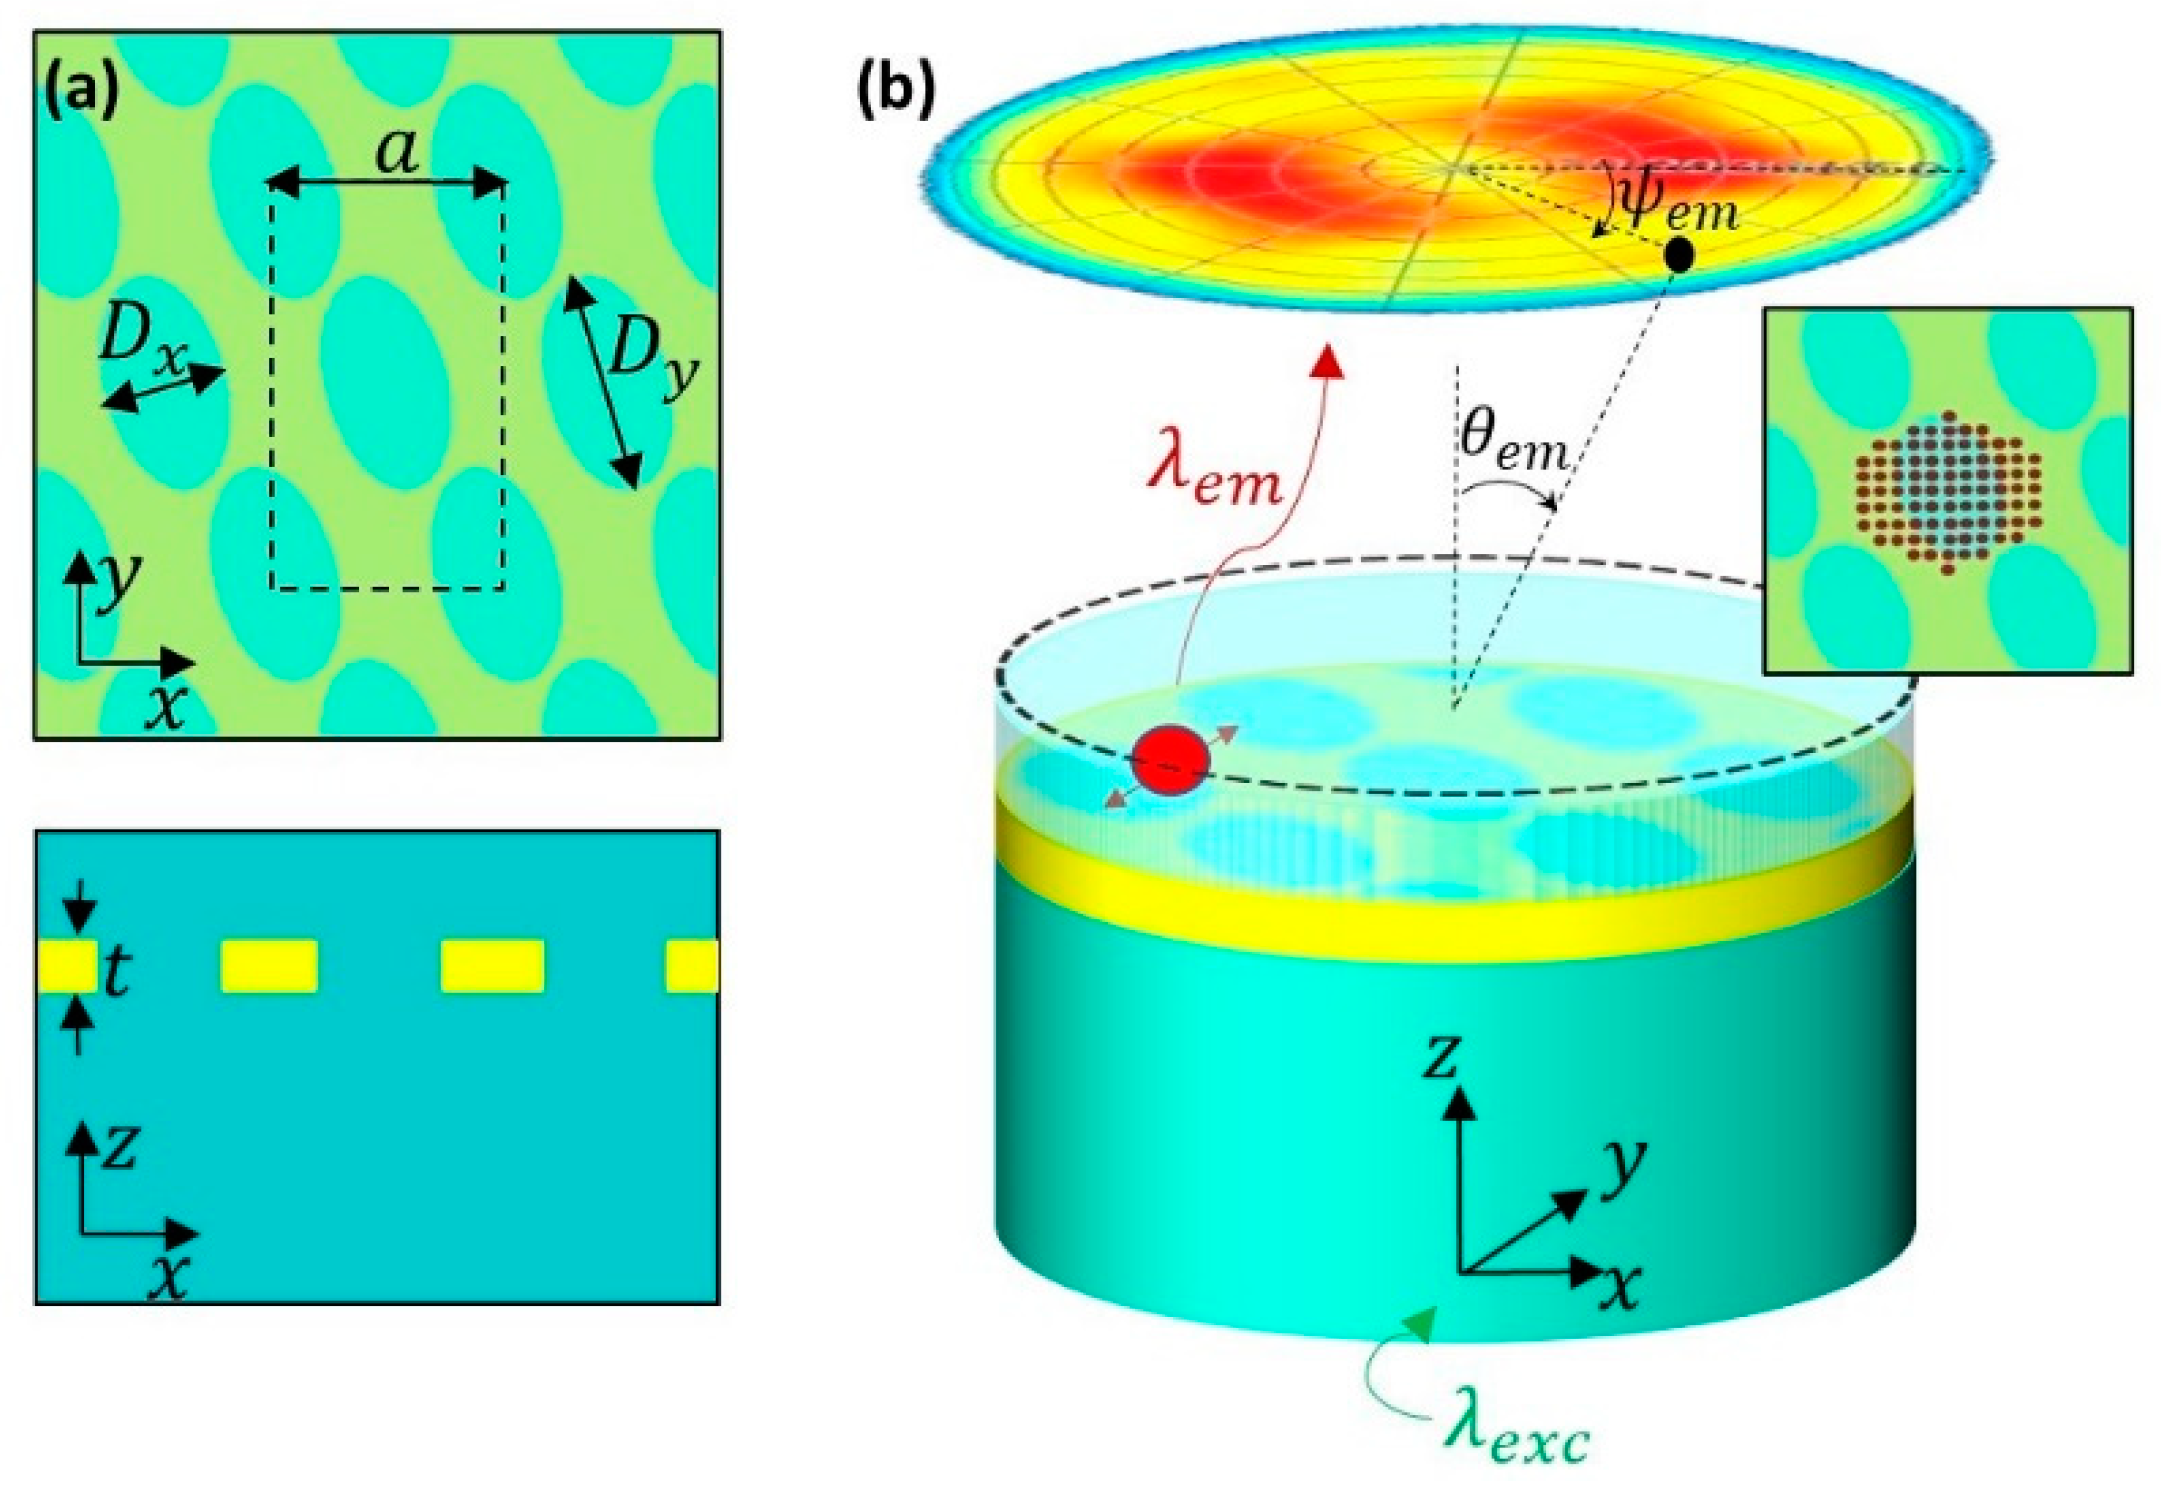
3.1. Passive Simulations

In our previous numerical work, we showed that chiral absorption in ENHA arises due to the different coupling of LCP- and RCP- excited SPPs with elliptical nanoholes tilted from the lines of the 2D array symmetry [26]. We optimized the ENHA with a = 500 nm in terms of Dx, Dy, and the tilt angle ϕ; we found that the optimum CDA (reaching almost 84%) was around 745 nm for ϕ = 15°, Dx = 280 nm, and Dy = 500 nm. These ENHA were standing upon glass substrates in air; therefore, their spectral features and CDA were expected to red-shift with an increase of the refractive index of the surrounding medium.
Here, we started from the previously optimized ENHA geometry, and embedded it in the refractive index-matching layer, which served as a dielectric matrix for the emitters in the active simulations. In a hexagonal lattice, the ENHA tilt angle of ϕ = 15° always provides the highest CDA, so we kept this parameter constant. We investigated CDA dependence on various separate geometric parameters (not shown here), and conclude that its spectral features mainly depend on lattice periodicity, which defines the light coupling to the SPP modes. Therefore, here we show the results of the parameter sweep over the periodicity range of a = 350–550 nm, while we scale the nanohole surface in the unit cell according to the previous optimization, i.e., Dx = 280*a/500, and Dy = a. We investigate this range as it is of interest for future fabrication; namely, the starting diameter of commercial polystyrene nanospheres determines the hexagonal array periodicity in the NSL [32]. Figure 2a,b show spectral maps of Au-ENHA absorption dependence for the LCP and RCP excitations, respectively. Spectral features linearly shift with a, as is expected for the linearity of the phase matching condition of SPPs. Below 540 nm, absorption for both excitations increases in the same manner due to the intraband absorption in Au. For LCP excitation and lattices around a = 500 nm and larger, there is one main plasmonic maximum in the near-infrared. Changing the excitation to RCP, the quality factor of this maximum increases, and other plasmonic features at larger wavelengths appear. This different spectral behavior leads to a high CDA in the near-infrared range, with two prominent branches in the opposite CDA signs, as seen in Figure 2c. Specifically, for a = 500 nm, CDA reaches around 50% at 740 nm, and inverts the behavior at 940 nm. This peculiar behavior of ENHA absorption influences the coupling with the emitting layer; therefore, these two wavelengths will be considered for dipole emission further in the manuscript. Moreover, we note that under 600 nm CDA vanishes because of the absence of the plasmonic coupling, and, eventually, Au intraband absorption. Finally, one can note that the maximum CDA branches red-shifted because of the superstrate, while their absolute value decreased with respect to the design previously optimized in [26]. In this manuscript, we focus on the investigation of the chiral absorption and emission phenomena which take place in the previously designed ENHA, embedded in glass. However, this design is scalable and can be easily re-optimized for specific emission and excitation wavelengths. Once the wavelength of maximum CDA is defined, one can perform multiparameter optimization of parameters a, Dx, Dy, and t, to get the highest contrast of RCP and LCP absorption at those wavelengths by means of particle-swarm algorithm [39].
In Figure 2d–f, we repeat the same a sweep when the plasmonic materials is Ag, by keeping all the geometric features equal as before. As expected, there was a blue-shift of all spectral features compared to the Au-ENHA due to the higher plasma frequency of Ag. The branches of CDA now reach shorter visible wavelengths, where the Ag-ENHA can be excited e.g., with a green laser. Therefore, while Au-ENHA can be used for the near-infrared, while Ag is more suitable for the visible range.

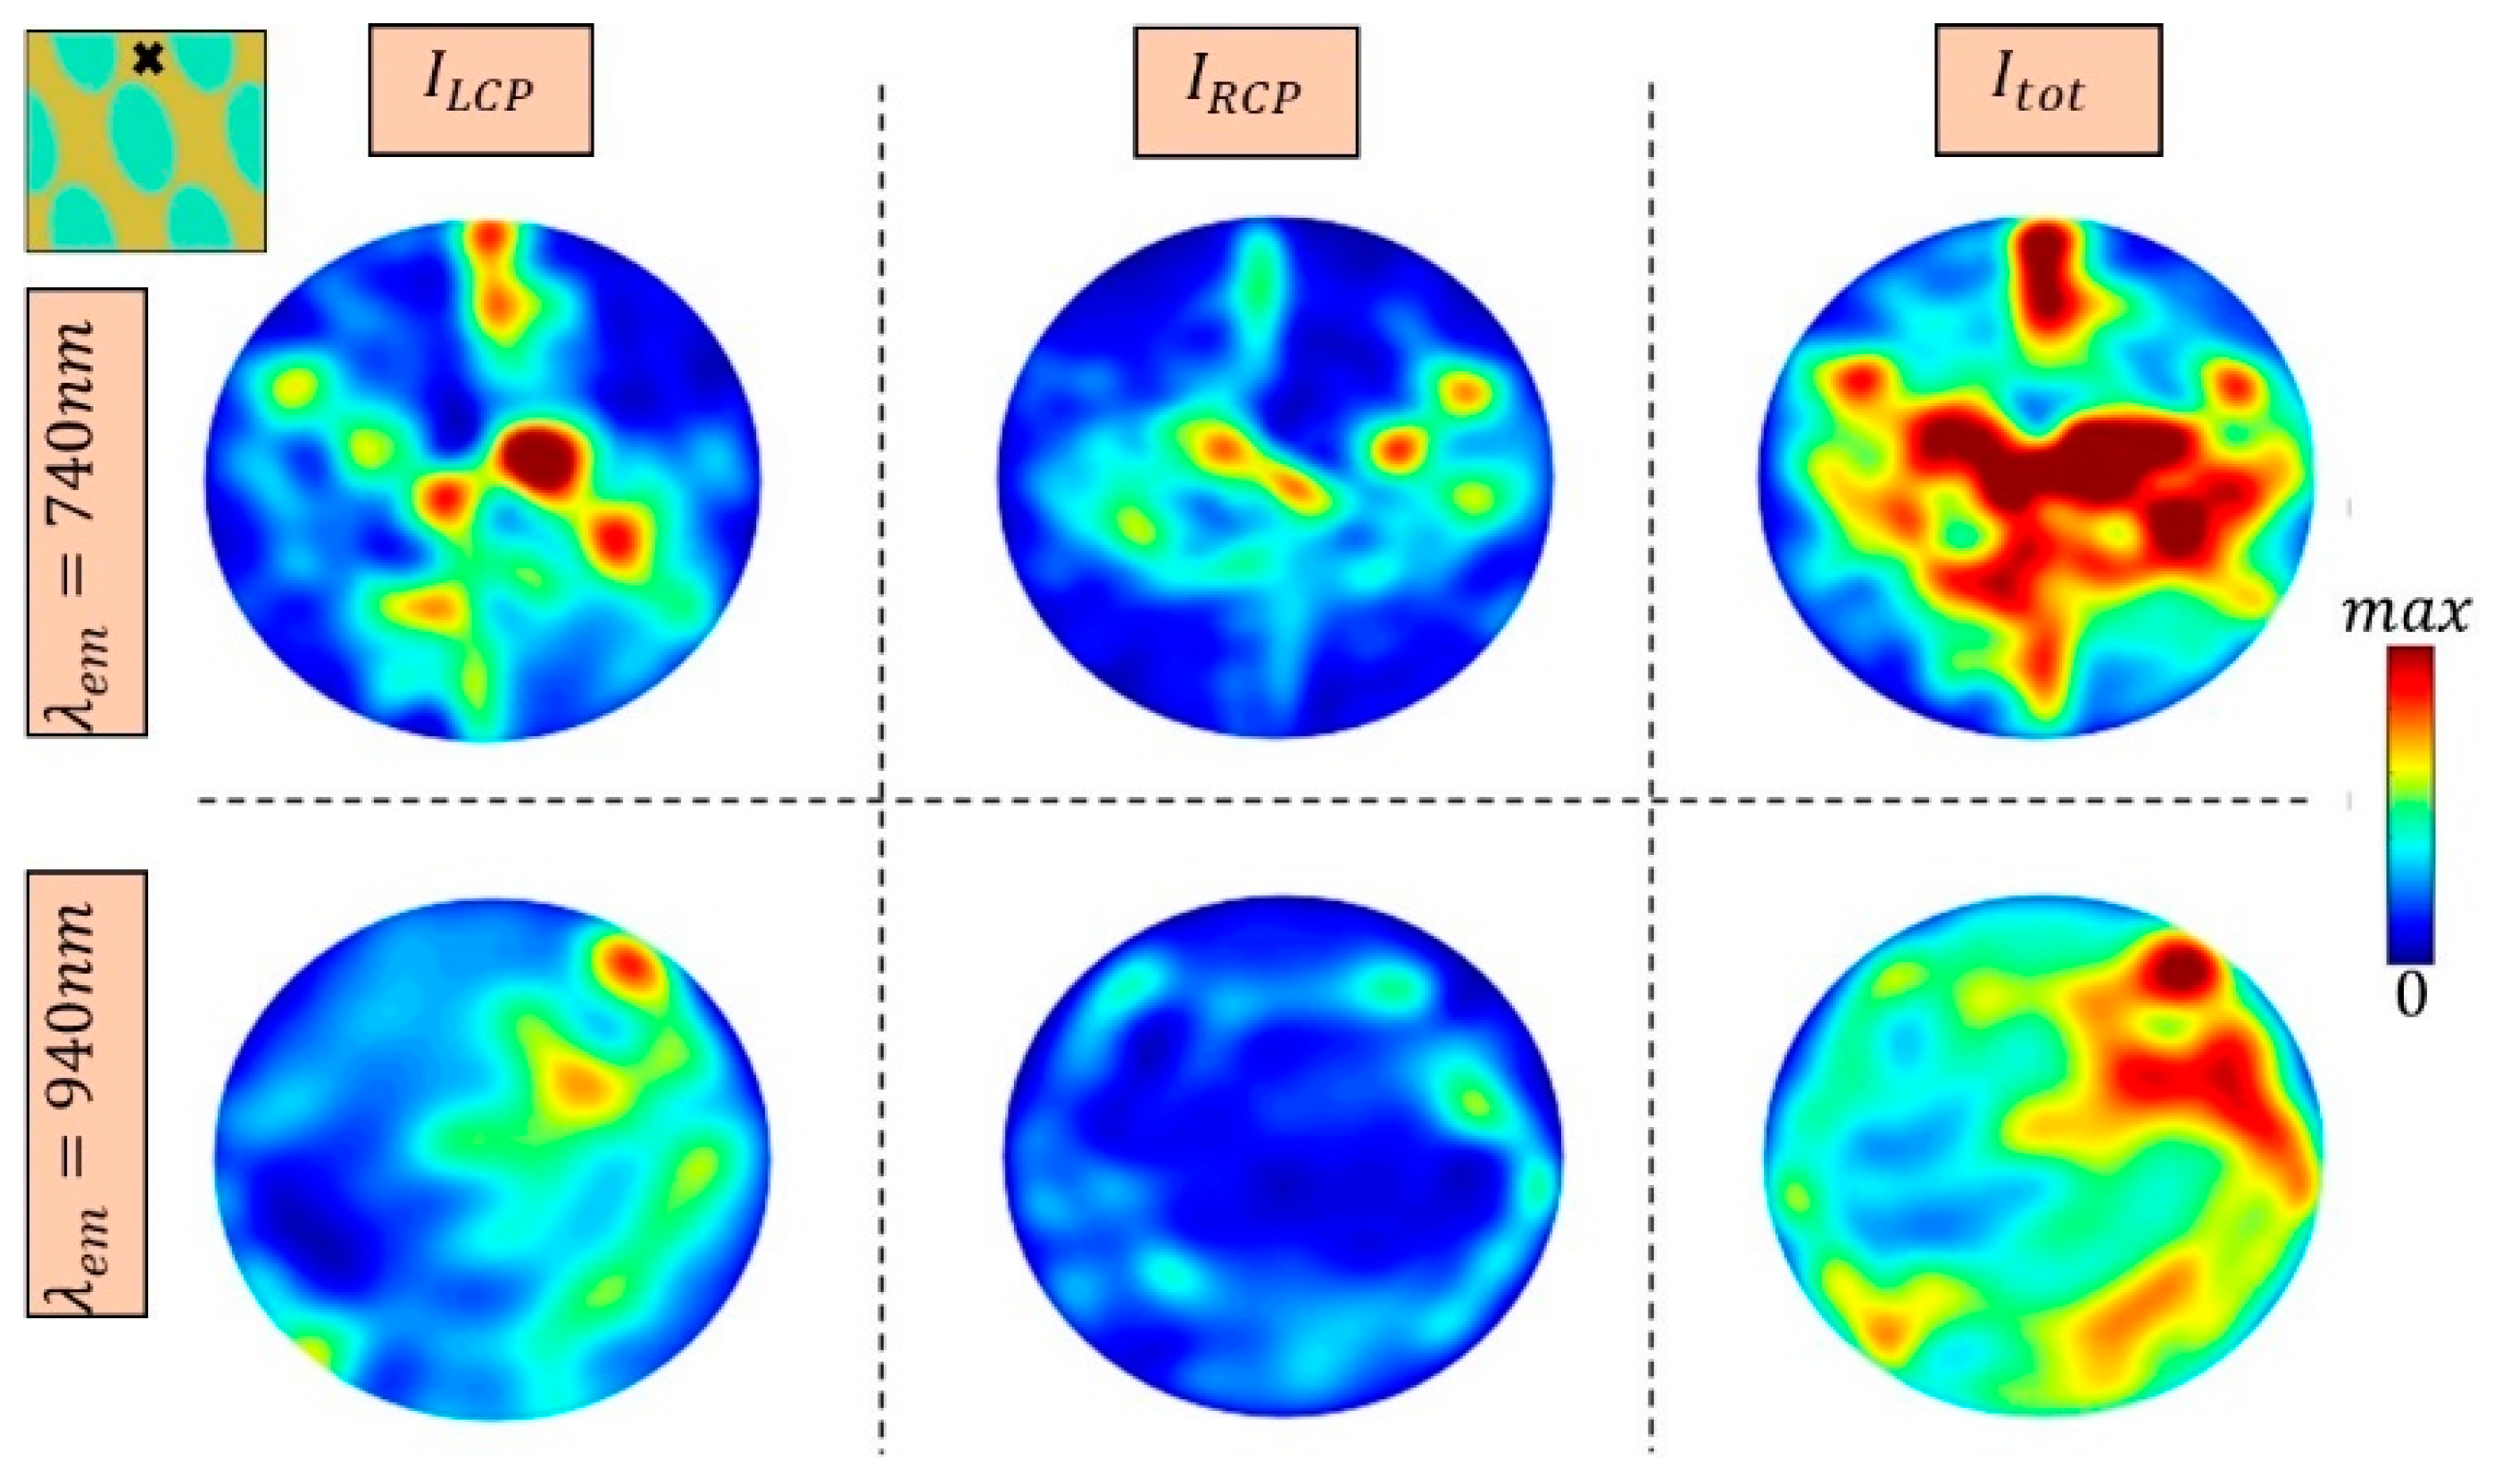
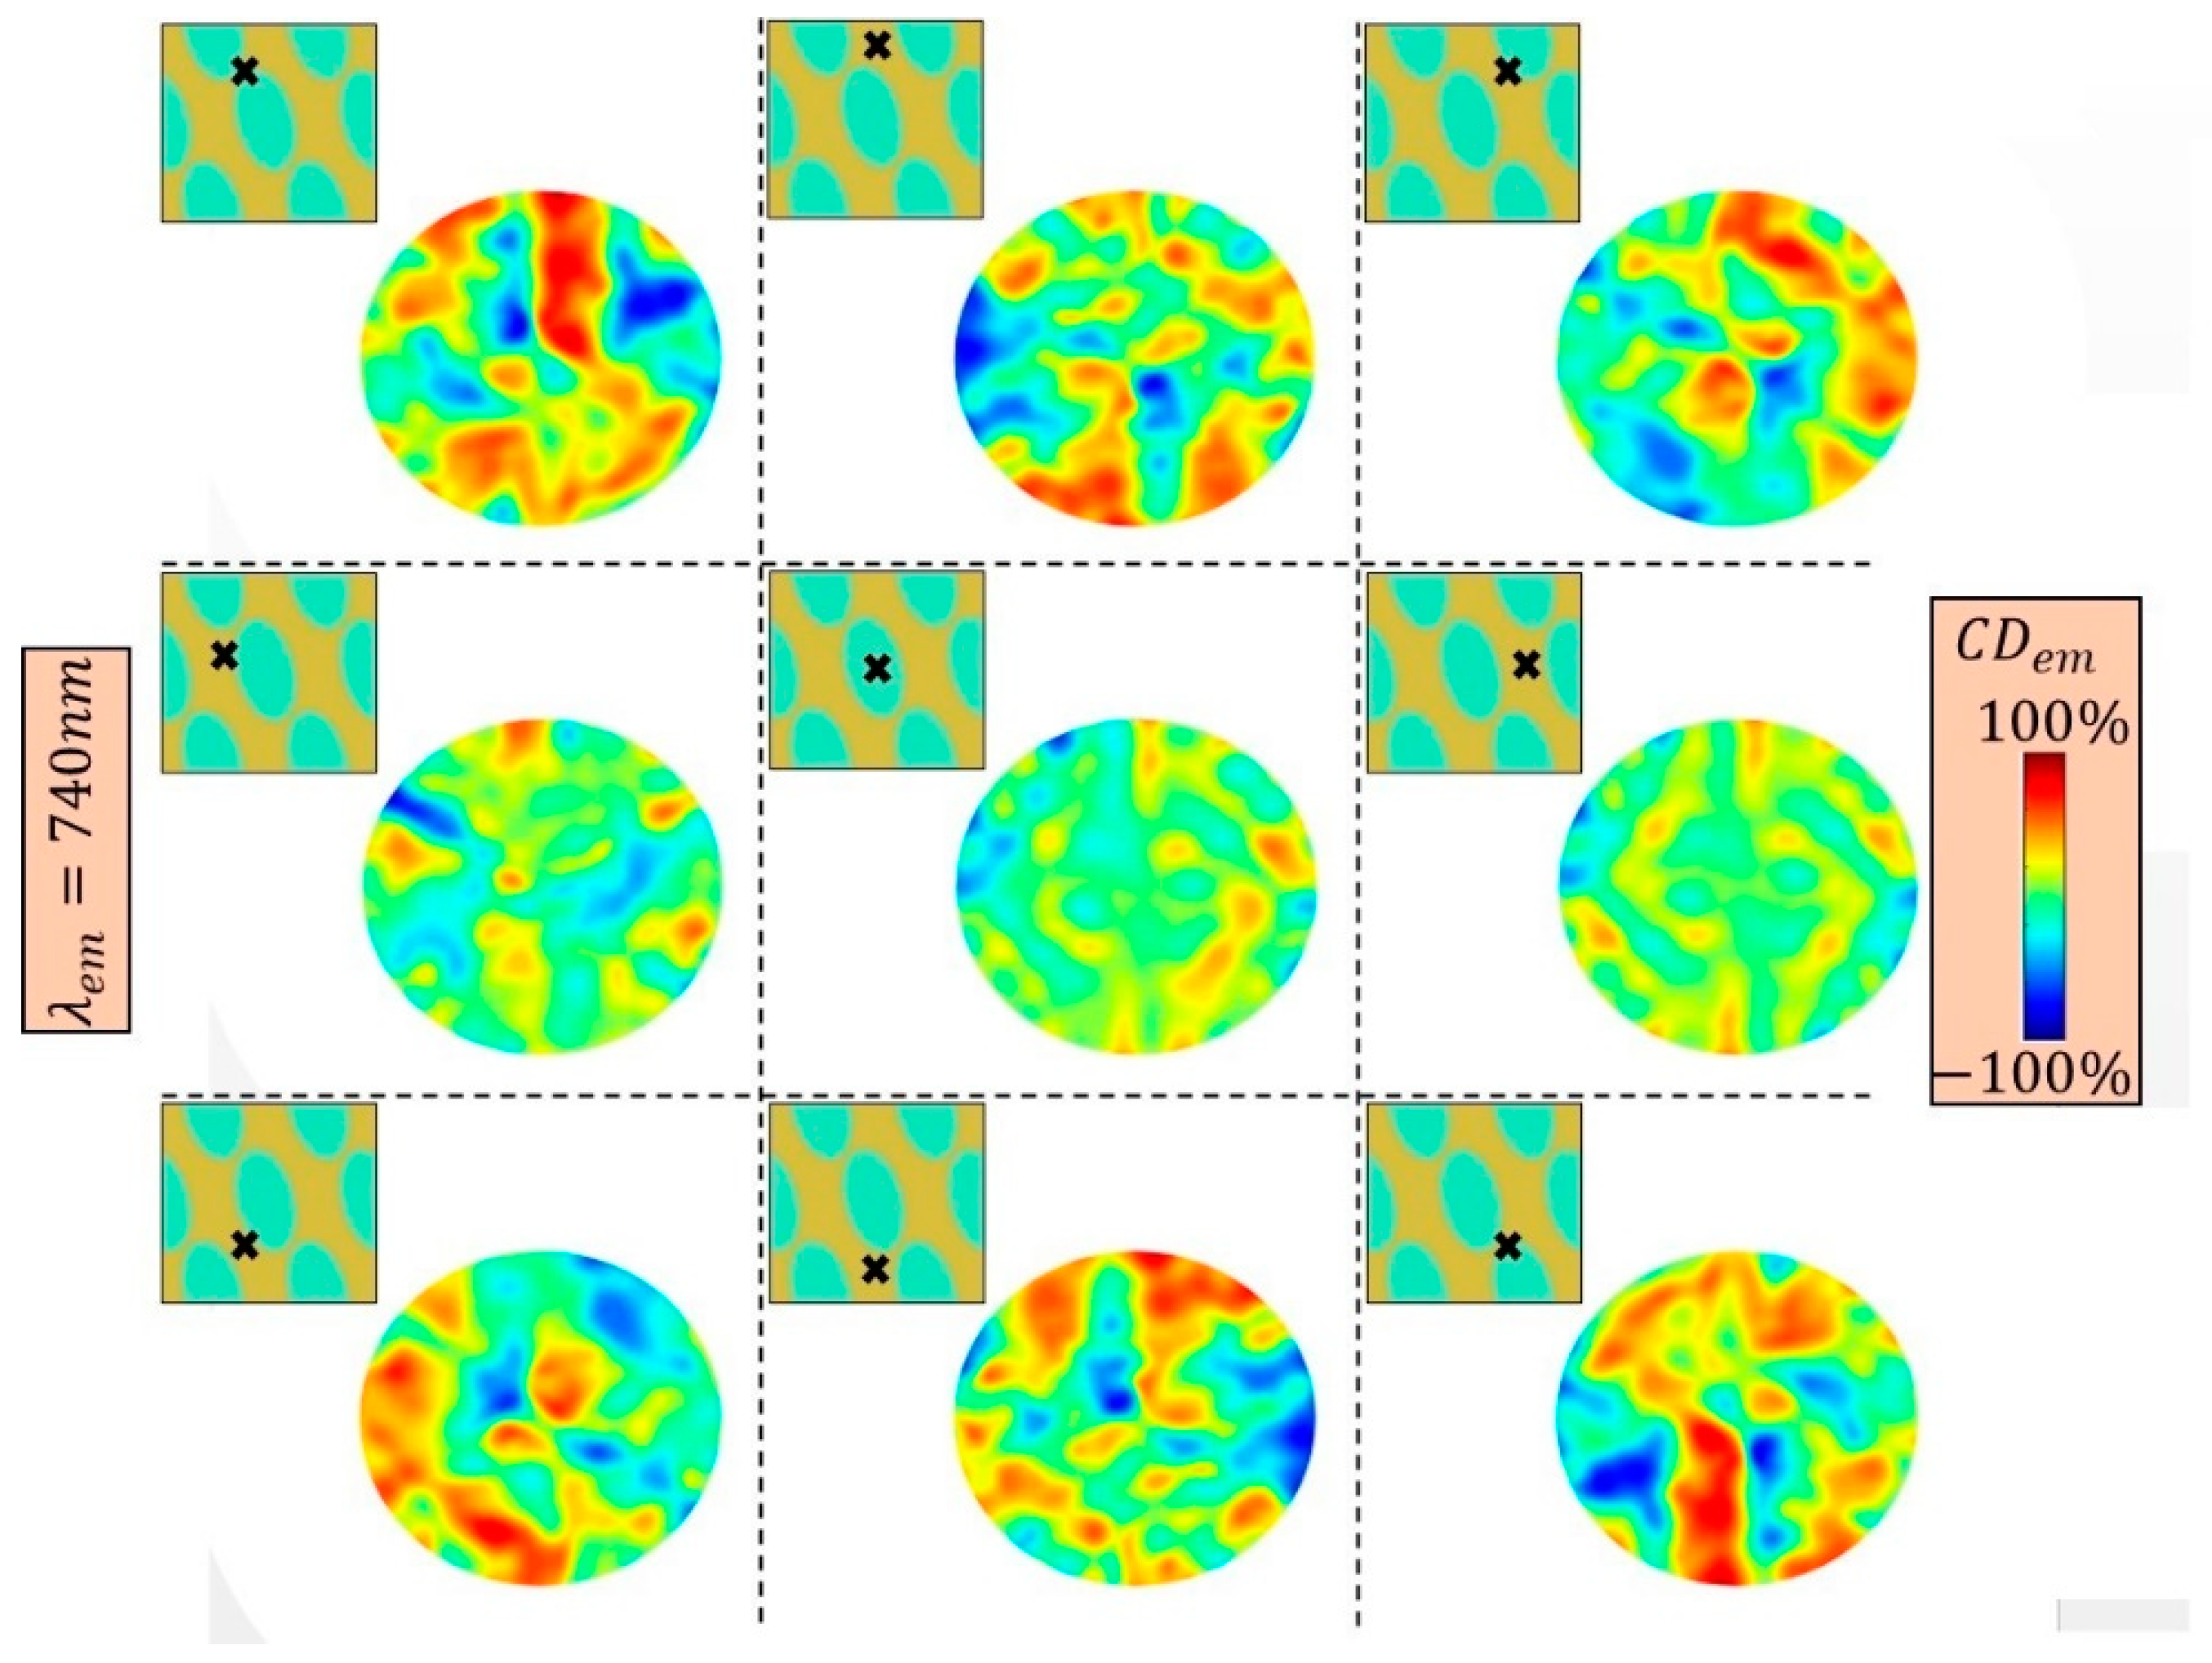
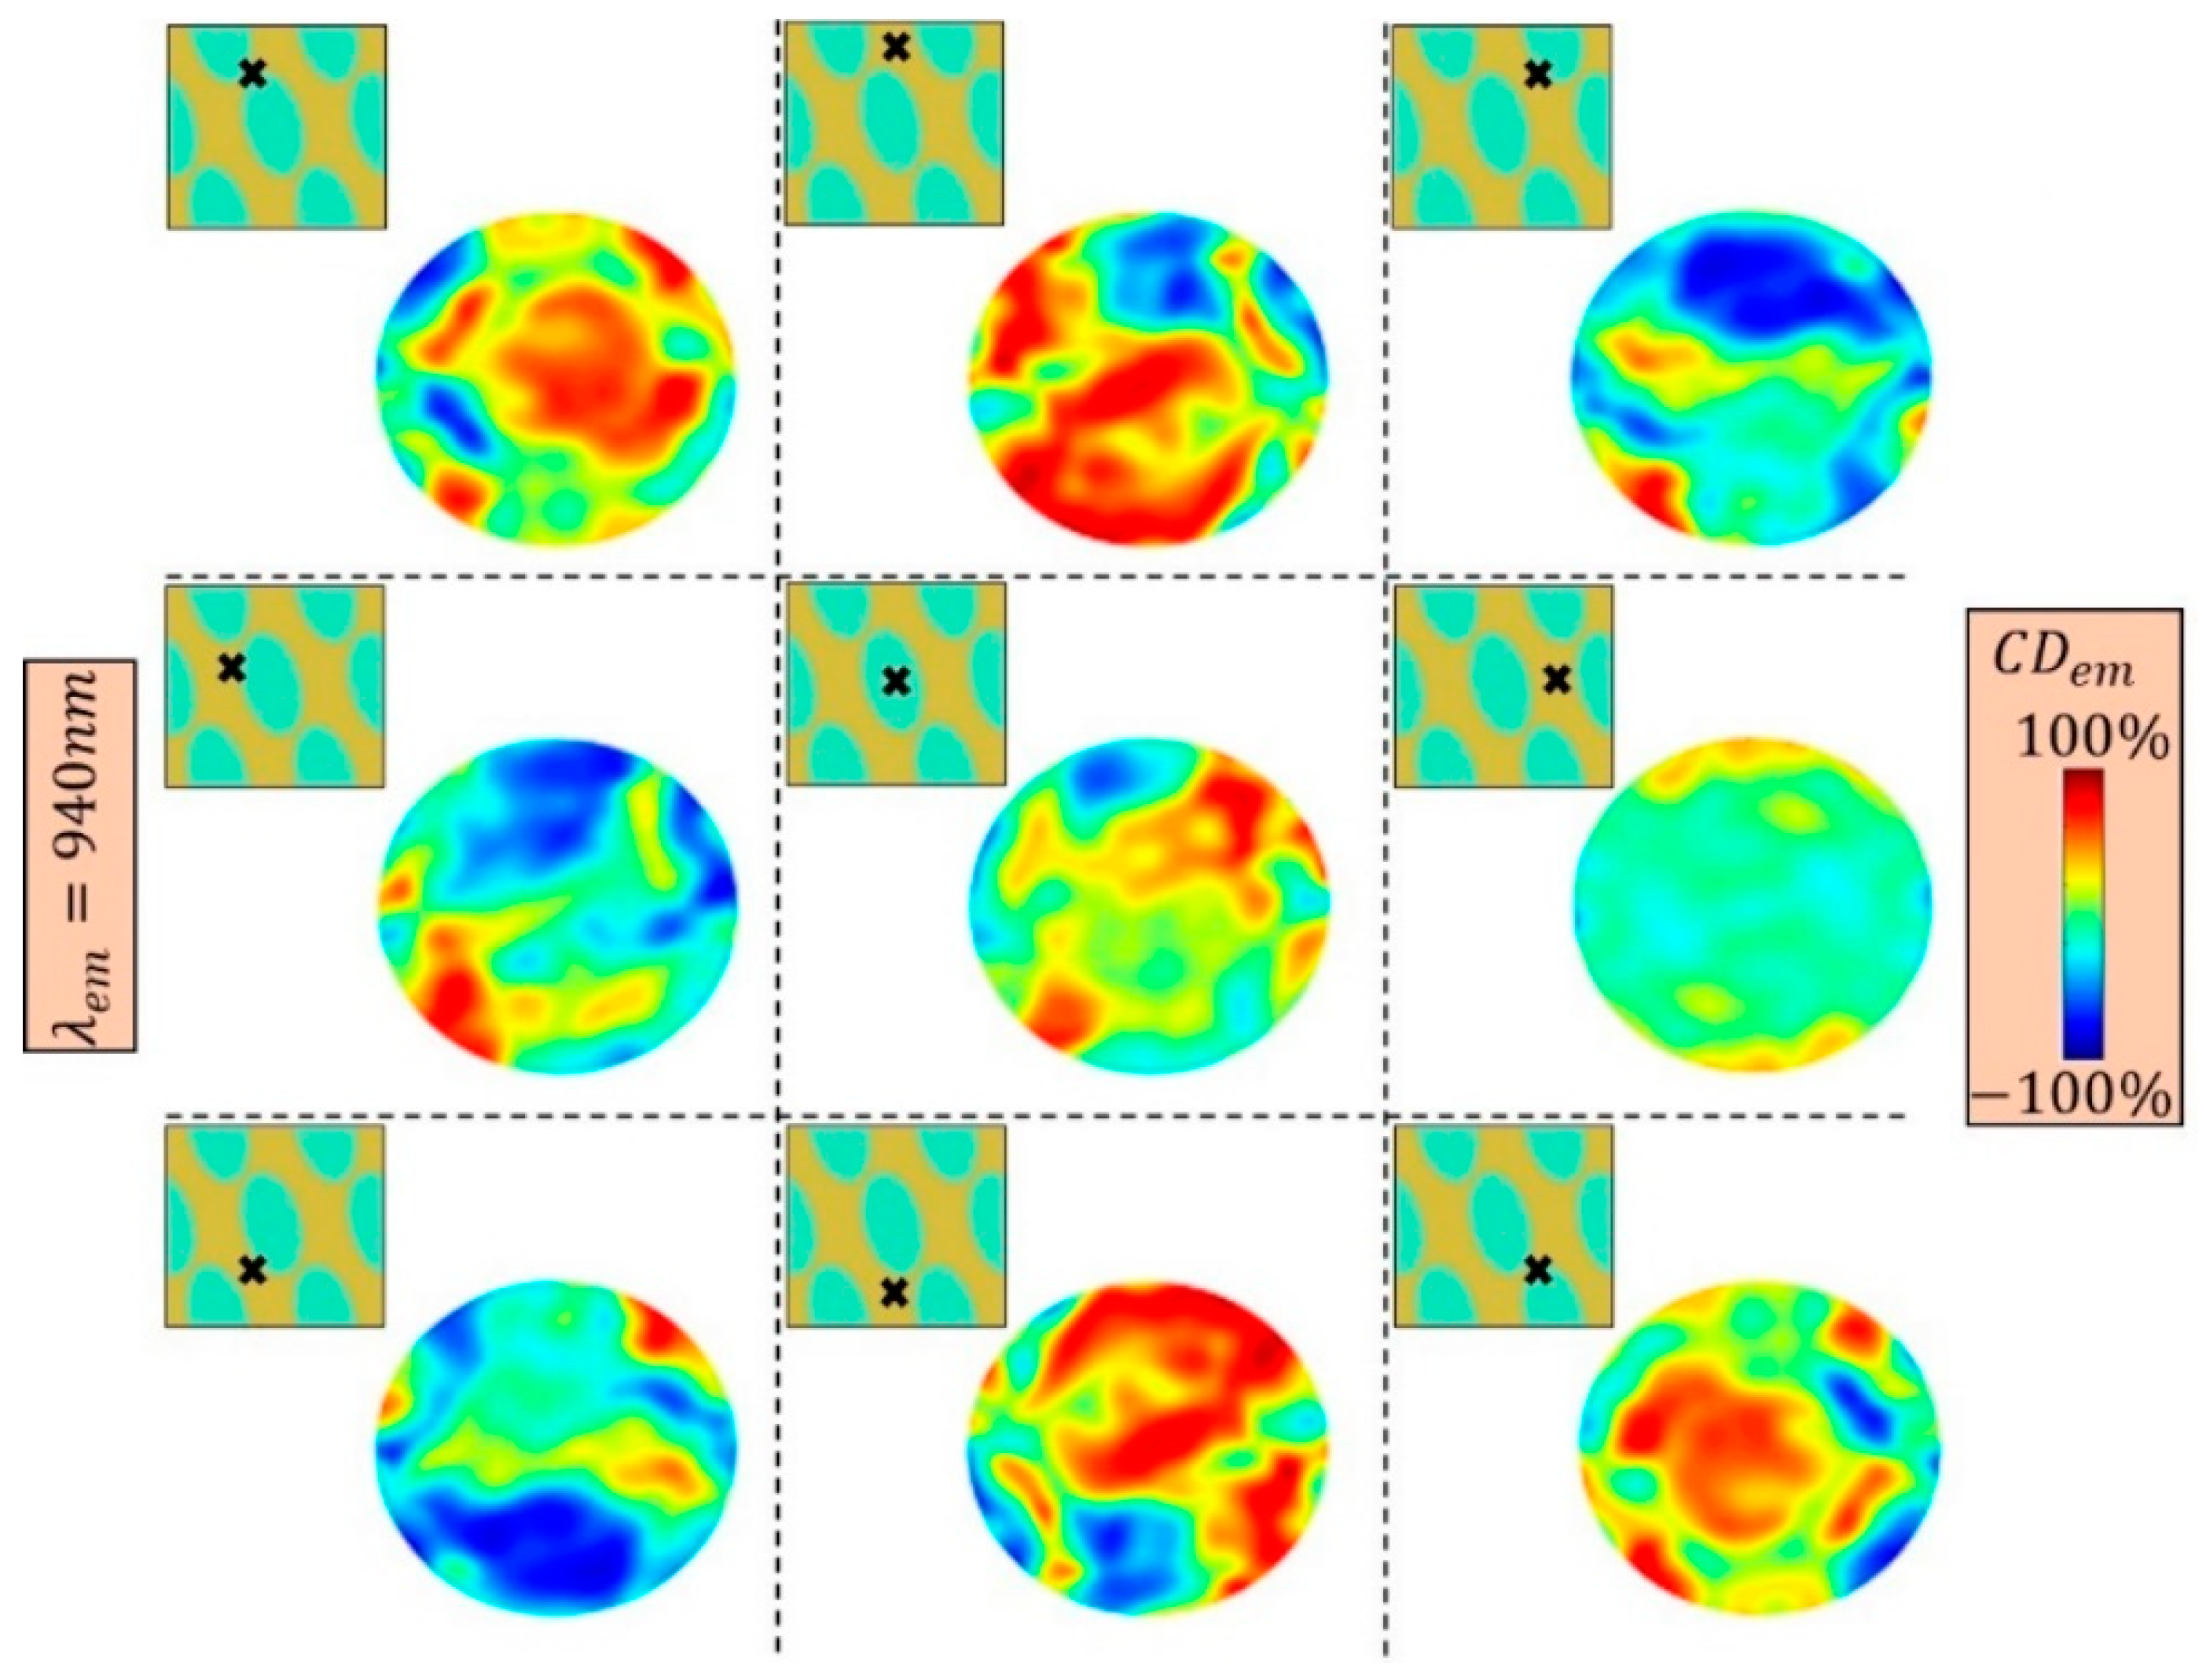
3.2. Active Simulations

The purpose of this section is to investigate the influence of the CDA on CDem. Therefore, we chose the Au-ENHA with a = 500 nm, and we applied active simulations for two typical wavelengths. Figure 3 plots the typical results of our numerical method for a randomly oriented dipole situated at Δx = 0, Δy = a/2, and Δz = 120 nm, emitting at 740 nm (top), and 940 nm (bottom). The simulation of one dipole position contained three simulation runs (for x-, y-, and z-orientation), where the far-field matrices of the total, LCP, and RCP far-field emission were saved, and eventually averaged. At both wavelengths, total intensity is highly irregular due to ENHA chirality and the offset of the dipole with respect to the unit cell center. At longer wavelengths, the overall total light emission is directed towards larger angles, and with less intensity, as is expected due to the coupling with the lattice [30,31]. When the total field is decomposed into opposite circular polarizations, we notice strong chirality, especially at 940 nm: there is an absence of RCP compared to LCP in the central part of the far-field hemisphere. However, a single dipole position cannot account for the chiral properties of the emitting material, situated in a matrix material above the ENHA. We believe that there are two main reasons we need to simulate the emission of large number of dipoles, before taking their average intensities in Equation (2), and calculating the CDem. Firstly, total intensity differed strongly for the dipoles situated on the rims and in the nanohole center, as the local density of states in plasmonic nanostructures strongly depend on spatial confinement. Secondly, in achiral NHAs, two dipoles situated at opposite sides of the NHA give opposite CDem, according to extrinsic chirality, whereas their average gives zero CDem. ENHAs are intrinsically chiral, so we expect that the interplay of these two phenomena would give a non-zero chirality in the averaged emitted field.
We investigate the previous point by calculating the CDem from typical dipole positions in the unit cell (over the hexagon presented in the inset of Figure 1b). In Figure 4, it is evident that the dipoles situated between the nanoholes (corners of the figure), led to extremely high chirality close to the normal incidence. As the dipole position approaches the unit cell center, the circular dichroism drops. This can be of interest for light nanosources such as quantum dots, which can be precisely positioned at the points which exhibited high CDem. On the other side, for emitting layers with fluorescent dopants, the single position-chiral behavior can give guidelines for the engineering of the excitation control, as will be shown later.
In Figure 5, we show chirality of typical dipole positions for the emission at 940 nm. Even though emission intensity was lower (Figure 3), for most positions there was a strong positive chirality in the central part of the hemisphere, which is wider and more pronounced with respect to Figure 4. Again, CDem decreases towards the dipoles closer to the ENHA center.
Finally, we apply Equation (3) to calculate the total, LCP, and RCP fields emitted by the ensemble of 85 dipoles, Figure 6. Here we consider the dipole weights with respect to the shared geometry between the neighboring cells, while we do not consider confinement at the excitation wavelength. As is expected, higher emission at 740 nm corresponds to higher confinement of this wavelength at 120 nm. Moreover, at 940 nm the light was directed towards larger angles in the far-field, in agreement with diffraction-governed optical phenomena. More importantly, in the direction of the maximum emission at 740 nm (Ψem~0°) the overall CDem switched the sign between the two wavelengths, just as in CDA. Therefore, passive ENHA chiral properties directly influence their coupling with the achiral emitting layer situated in the index matching layer. Absolute CDem values reached 20% and 30% for 740 nm and 940 nm, respectively.

3.3. Influence of Excitation

Figure 4 and Figure 5 show that dipole position strongly influences chiral emission in CDem and its intensity. An additional way to boost and tune this performance is to add another degree of freedom: electromagnetic confinement at the excitation wavelength. Apart from controlling the emission direction, polarization and intensity, plasmonic nanostructures can boost absorption in the emitting material by controlling its excitation rate γab, as γ a b ~ | μ a b E e x c | 2 , where μ a b is the absorption dipole moment, and E e x c is the electric field at the excitation wavelength at the dipole position [40]. Different plasmonic systems have been used to optimize molecule fluorescence by means of near field enhancement at the excitation wavelength [38,40,41,42,43,44]. In such systems, excitation field properties such as wavelength, incidence angle, and polarization can be engineered to enhance electromagnetic confinement in the parts of the nanostructure volume filled with the emitting material.
Next, we demonstrate the influence of excitation (wavelength and polarization) on the emitting chiral properties of Au-ENHA with a = 500 nm. We choose to investigate λ e x c = 532   nm , which is a common green laser used for the excitation of emitters with plasmonic nanostructures [45], and λ e x c = 740   nm , where Au-ENHA shows high CDA. As our ENHAs are chiral over a broad spectral range, we expect that the switching of LCP to RCP in the excitation influences emitted field intensity and chirality. We started from the passive behavior of the Au-ENHA at single wavelengths by exciting the ENHA from the bottom (positive z-direction), with RCP or LCP (top and bottom panels of Figure 7, respectively). The electric field intensity at the excitation wavelength | E e x c | 2 was detected by two field-profile monitors over the unit cell in the xz cross-section, centered at y = 0 nm, and in the xy cross-section, centered at z = 120 nm (note that this is the same position as the dipole ensemble in the active simulations). This intensity was normalized to the incident field intensity | E 0 | 2 , with E 0 = 1   V/m . As can be appreciated from Figure 2a,b, at λ e x c = 532   nm there was no increased coupling with the ENHA, hence it did not possess chiral behavior in the absorption (green area in Figure 2c). Indeed, Figure 7a shows that for both LCP and RCP excitation, the electric field was not confined to the metallic layer, and did not overlap with the emitter position (low confinement across the whole xy-monitor). However, there was a slight difference in its distribution, with the switch of the excitation handedness. On the other side, Figure 7b shows high coupling with the ENHA, which was greatly enhanced for the excitation switching from RCP to LCP. This is in agreement with the strong chirality at this wavelength, as seen in the orange region of Figure 2c.
For each of simulations presented in Figure 7, we save the intensities of each field component in the points defined in the inset of Figure 1b. As was expected for the confinement with plasmonic nanohole arrays, the main field component for each excitation was E z (not shown here); this means that the z-oriented dipoles standing on the nanohole rims will enter the sum in Equation (4), with significantly higher weight. Next, we calculated the LCP and RCP light emission by averaging all dipole positions and orientations with this additional weight factor from the passive simulations, thus accounting for the excitation electric field intensity at the position of the dipoles. To demonstrate strong influence of the excitation on both intensity and chirality of emission, we investigated how light emitted at λ e m = 940   nm depends on the excitation wavelengths λ e x c = 532   nm and λ e x c = 740   nm , and on the choice of RCP and LCP, as shown in Figure 8. Since the results are plotted with the same color bar, we note a strong enhancement in the case of LCP excitation at 740 nm. This is a consequence of the high field confinement at the position of the dipole ensemble, as seen in Figure 7b. The emission intensities are ~5 times lower for the excitation at 532 nm, compared to 740 nm, while the resulting emitted field distribution shows distinguishable behavior. Namely, at 532 nm excitation, we notice a slight enhancement of both I ¯ LCP and I ¯ RCP when its handedness is switched from RCP to LCP, as seen in Figure 8a. At 740 nm excitation, the LCP and RCP emitted components drastically change in distribution and increase in intensity from the excitation change from RCP to LCP, as seen in Figure 8b. This is because the Au-ENHA is strongly chiral at this excitation wavelength, with a pronounced change of the electromagnetic confinement over the ensemble (see the xy cross-sections in Figure 7b).
Finally, Figure 9 plots the resulting chiral emission properties for different combinations of the excitation and emission wavelengths, and excitation handedness. We first investigated Au-ENHA, with a = 500 nm. In the left panel of Figure 9, we show the CDem calculated from the maps in Figure 8a; we notice that even a slight change of the excitation field distribution (by changing it handedness) can influence the overall map. CDem is rather low close to the normal incidence, but increases in the far-field points which do not have high emission intensity. Therefore, such a configuration is not suitable for excitation. Moving to λ e x c = 740   nm , which strongly couples to the Au-ENHA, the emitted intensity increases and the emission becomes highly tunable by means of excitation (Figure 8b). Indeed, in the middle panel of Figure 9, the maximum absolute value of CDem increases from 30% in Figure 6, to 50%. As expected, chirality at the excitation wavelength plays an important role in tailoring the CDem: it increases in absolute value for LCP excitation, and it switched the sign for angles close to normal incidence. Finally, we consider a combination which could be of interest for the ENHA coupled with Styryl 8 dye, which emits around 740 nm, and which can be excited at 633 nm [30,31]. In the right panel of Figure 9, we see that an absolute CDem of ~20% can be obtained at in the center of the far-field for the LCP excitation.
Next, we considered Ag-ENHA with a = 510 nm, coupled with a fluorescent ensemble excited at 532 nm and emitting at 630 nm. We choose these wavelengths as they can be of interest for Lumogen Red dye, which has the typical absorption and emission spectra shown in Figure 10a [45]. In this case, both the excitation and emission wavelengths lie in the positive CDA branch of our nanostructure (Figure 2f). In the inset of Figure 10b, we show the normalized electric intensity over the xy cross-section at 120 nm. Compared to the Au-ENHA (Figure 7a), RCP and LCP distribution strongly differed. This means that RCP excitation at 532 nm enhanced the emission of the dipoles situated in the middle of the nanohole. LCP excitation, on the contrary, increased the contribution of the dipoles on the rims of the nanohole. Therefore, the resulting emitted field shows a dramatic change in distribution for the excitation handedness change, as seen in Figure 10b.
CDem can be enhanced and directed differently in the far-field by changing the polarization of the excitation. The rich chiral behavior of ENHAs can be used to optimize the desired far-field properties and chirality for a specific application in many ways. Take as an example an ENHA coupled with molecules which emit at 940 nm. If one needs high CDem emitted directly to the far-field center (θem~0°, Ψem~0°), the excitation can be tuned to enhance the dipoles on the upper left and lower right positions in the unit cell, as seen in Figure 5. Another requirement can be a high contrast ratio between the CDem with excitation switching from RCP to LCP. As an example, the far-field CDem distributions in Figure 9b show that this is possible for light directed in θem~10° cone, and it can be further optimized. Therefore, proper engineering of the field confinement at the excitation wavelength can enhance the contribution of the dipoles which give the highest CDem of the same sign, while the change to their polarization can tune the desired property in the emitted far-field. Moreover, the position of the ensemble in the z-direction can be matched with the high chiral properties. Finally, excitation angle of incidence plays can be used to couple the incident excitation light to the resonance of the nanostructures [41,43,45,46]; e.g., in Figure 8a, this would lead to higher intensity of the emitted light and to an additional degree of freedom in tuning the resulting CDem (Figure 9, left). Finally, the optimization of the emission chiral properties by the excitation of the polarization state, wavelength, and direction will be the subjects of future work.

4. Conclusions

In this work, we proposed the coupling of simple, planar, chiral nanohole arrays with an ensemble of emitting material, for chiral emission in the near-infrared and visible ranges. Our numerical method treats the chiral properties of a large number of randomly oriented dipoles, which were homogeneously positioned in a refractive index matching matrix above the ENHA. The chiral properties of the emitted far-field strongly depend on the chiral properties of the plasmonic substrate. Moreover, the excitation of the dipoles at shorter wavelengths can tune the electromagnetic field confinement in the volume of the emitting layer. As such, the excitation field can be used to enhance the emission of specific dipoles, and to control it by selecting proper excitation wavelength and polarization. Thus, it provides additional degree of freedom in the tuning of the overall emission in terms of the degrees of intensity and circular polarization. Even though our design involves a simple elliptical nanohole geometry in an Au or Ag layer, it provides rich chiral behavior in both absorption and emission. Therefore, we strongly believe that the ENHA coupled with emitting layers can be optimized towards tunable efficient chiral nanosources.

Author Contributions

Conceptualization, E.P. and C.S.; methodology, E.P. and C.S.; software, E.P. and R.G.; validation, C.S.; formal analysis, R.G.; investigation, E.P. and R.G.; resources, C.S.; data curation, R.G.; writing—original draft preparation, E.P. and R.G.; writing—review and editing, C.S.; visualization, R.G.; supervision, C.S.; project administration, C.S.; funding acquisition, C.S. All authors have read and agreed to the published version of the manuscript.

Funding

This research received no external funding.

Institutional Review Board Statement

Not applicable.

Informed Consent Statement

Not applicable.

Acknowledgments

In this section, you can acknowledge any support given which is not covered by the author contribution or funding sections. This may include administrative and technical support, or donations in kind (e.g., materials used for experiments).

Conflicts of Interest

The authors declare no conflict of interest.

References

  1. Maier, S.A. Plasmonics: Fundamentals and Applications; Springer Science & Business: Media, Germany, 2007. [Google Scholar]
  2. García de Abajo, F.J. Colloquium: Light scattering by particle and hole arrays. Rev. Mod. Phys. 2007, 79, 1267. [Google Scholar] [CrossRef] [Green Version]
  3. Polman, A.; Atwater, H.A. Plasmonics: Optics at the nanoscale. Mater Today 2005, 8(1), 56. [Google Scholar] [CrossRef]
  4. Couture, M.; Liang, Y.; Poirier Richard, H.-P.; Faid, R.; Peng, W.; Masson, J.-F. Tuning the 3D plasmon field of nanohole arrays. Nanoscale 2013, 5, 12399. [Google Scholar] [CrossRef]
  5. Maradudin, A.; Sambles, J.R.; Barnes, W.L. Modern Plasmonics, Volume 4, 1st ed.; Elsevier Science: Amsterdam, The Netherlands, 2014. [Google Scholar]
  6. Smolyaninov, I.; Zayats, A. Near-field photonics: Surface plasmon polaritons and localized surface plasmons. J. Opt. A Pure Appl. Opt. 2003, 5, S16. [Google Scholar]
  7. Barnes, W.L.; Dereux, A.; Ebbesen, T.W. Surface plasmon subwavelength optics. Nature 2003, 424, 824. [Google Scholar] [CrossRef] [PubMed]
  8. Salomon, L.; Grillot, F.; Zayats, A.V.; de Fornel, F. Near-Field Distribution of Optical Transmission of Periodic Subwavelength Holes in a Metal Film. Phys. Rev. Lett. 2001, 86, 1110. [Google Scholar] [CrossRef] [PubMed]
  9. Petronijevic, E.; Leahu, G.; Mussi, V.; Sibilia, C.; Bovino, F.A. Photoacoustic technique for the characterization of plasmonic properties of 2D periodic arrays of gold nanoholes. AIP Adv. 2017, 7, 025210. [Google Scholar] [CrossRef] [Green Version]
  10. Schäferling, M.; Dregely, D.; Hentschel, M.; Giessen, H. Tailoring enhanced optical chirality: Design principles for chiral plasmonic nanostructures. Phys. Rev. X 2012, 2, 031010. [Google Scholar] [CrossRef] [Green Version]
  11. Valev, V.K.; Baumberg, J.J.; Sibilia, C.; Verbiest, T. Chirality and chiroptical effects in plasmonic nanostructures: Fundamentals, recent progress, and outlook. Adv. Mater. 2013, 25, 2517–2534. [Google Scholar] [CrossRef]
  12. Hentschel, M.; Schäferling, M.; Duan, X.; Giessen, H.; Liu, N. Chiral plasmonics. Sci. Adv. 2017, 3, e1602735. [Google Scholar] [CrossRef] [Green Version]
  13. Caridad, J.M.; McCloskey, D.; Donegan, J.F.; Krstić, V. Controllable growth of metallic nano-helices at room temperature conditions. Appl. Phys. Lett. 2014, 105, 233114. [Google Scholar] [CrossRef] [Green Version]
  14. Esposito, M.; Tasco, V.; Cuscuna, M.; Todisco, F.; Benedetti, A.; Tarantini, I.; De Giorgi, M.; Sanvitto, D.; Passaseo, A. Nanoscale 3D Chiral Plasmonic Helices with Circular Dichroism at Visible Frequencies. ACS Photonics 2015, 2, 105–114. [Google Scholar] [CrossRef]
  15. Caridad, J.M.; Winters, S.; McCloskey, D.; Duesberg, G.S.; Donegan, J.F.; Krstić, V. Control of the plasmonic near-field in metallic nanohelices. Nanotechnology 2018, 29, 325204. [Google Scholar] [CrossRef] [PubMed]
  16. Plum, E.; Fedotov, V.A.; Schwanecke, A.S.; Zheludev, N.I.; Chen, Y. Giant optical gyrotropy due to electromagnetic coupling. Appl. Phys. Lett. 2007, 90, 223113. [Google Scholar] [CrossRef] [Green Version]
  17. Yang, S.; Liu, Z.; Yang, H.; Jin, A.; Zhang, S.; Li, J.; Gu, C. Intrinsic Chirality and Multispectral Spin-Selective Transmission in Folded Eta-Shaped Metamaterials. Adv. Opt. Mater. 2020, 8, 1901448. [Google Scholar] [CrossRef]
  18. Leahu, G.; Petronijevic, E.; Belardini, A.; Centini, M.; Sibilia, C.; Hakkarainen, T.; Koivusalo, E.; Rizzo Piton, M.; Suomalainen, S.; Guina, M. Evidence of Optical Circular Dichroism in GaAs-Based Nanowires Partially Covered with Gold. Adv. Opt. Mater. 2017, 5, 1601063. [Google Scholar] [CrossRef] [Green Version]
  19. Petronijevic, E.; Leahu, G.; Belardini, A.; Centini, M.; Li Voti, R.; Hakkarainen, T.; Koivusalo, E.; Rizzo Piton, M.; Suomalainen, S.; Guina, M.; et al. Photo-Acoustic Spectroscopy Reveals Extrinsic Optical Chirality in GaAs-Based Nanowires Partially Covered with Gold. Int. J. Thermophys. 2018, 39, 45. [Google Scholar] [CrossRef]
  20. Petronijevic, E.; Centini, M.; Belardini, A.; Leahu, G.; Hakkarainen, T.; Sibilia, C. Chiral near-field manipulation in Au-GaAs hybrid hexagonal nanowires. Opt. Express 2017, 25, 14148. [Google Scholar] [CrossRef]
  21. Gorkunov, M.V.; Ezhov, A.A.; Artemov, V.V.; Rogov, O.Y.; Yudin, S.G. Extreme optical activity and circular dichroism of chiral metal hole arrays. Appl. Phys. Lett. 2014, 104, 221102. [Google Scholar] [CrossRef] [Green Version]
  22. Gorkunov, M.V.; Dmitrienko, V.E.; Ezhov, A.A.; Artemov, V.V.; Rogov, O.Y. Implications of the causality principle for ultra-chiral metamaterials. Sci. Rep. 2015, 5, 9273. [Google Scholar] [CrossRef] [Green Version]
  23. Kondratov, A.V.; Gorkunov, M.V.; Darinskii, A.N.; Gainutdinov, R.V.; Rogov, O.Y.; Ezhov, A.A.; Artemov, V.V. Extreme optical chirality of plasmonic nanohole arrays due to chiral Fano resonance. Phys. Rev. B 2016, 93, 195418. [Google Scholar] [CrossRef]
  24. Kuppe, C.; Williams, C.; You, J.; Collins, J.T.; Gordeev, S.N.; Wilkinson, T.D.; Panoiu, N.; Valev, V.K. Circular Dichroism in Higher-Order Diffraction Beams from Chiral Quasiplanar Nanostructures. Adv. Opt. Mater. 2018, 6, 1800098. [Google Scholar] [CrossRef] [Green Version]
  25. Arteaga, O.; Maoz, B.M.; Nichols, S.; Markovich, G.; Kahr, B. Complete polarimetry on the asymmetric transmission through subwavelength hole arrays. Opt. Express 2014, 22, 13719–13732. [Google Scholar] [CrossRef]
  26. Petronijevic, E.; Ali, H.; Zaric, N.; Belardini, A.; Leahu, G.; Cesca, T.; Mattei, G.; Andreani, L.C.; Sibilia, C. Chiral effects in low-cost plasmonic arrays of elliptic nanoholes. Opt. Quantum Electron. 2020, 52, 176. [Google Scholar] [CrossRef]
  27. Petronijevic, E.; Leahu, G.; Li Voti, R.; Belardini, A.; Scian, C.; Michieli, N.; Cesca, T.; Mattei, G.; Sibilia, C. Photo-acoustic detection of chirality in metal-polystyrene metasurfaces. Appl. Phys. Lett. 2019, 114, 053101. [Google Scholar] [CrossRef]
  28. Petronijevic, E.; Belardini, A.; Leahu, G.; Cesca, T.; Scian, C.; Mattei, G.; Sibilia, C. Circular dichroism in low-cost plasmonics: 2D arrays of nanoholes in silver. Appl. Sci. 2020, 10, 1316. [Google Scholar] [CrossRef] [Green Version]
  29. Ai, B.; Luong, H.M.; Zhao, Y. Chiral nanohole arrays. Nanoscale 2020, 12, 2479–2491. [Google Scholar] [CrossRef]
  30. Cao, Z.L.; Ong, H.C. Determination of coupling rate of light emitter to surface plasmon polaritons supported on nanohole array. Appl. Phys. Lett. 2013, 102, 241109. [Google Scholar] [CrossRef]
  31. Cao, Z.L.; Ong, H.C. Study of the momentum-resolved plasmonic field energy of Bloch-like surface plasmon polaritons from periodic nanohole array. Opt. Express 2017, 25, 30626–30635. [Google Scholar] [CrossRef]
  32. Michieli, N.; Kalinic, B.; Scian, C.; Cesca, T.; Mattei, G. Emission Rate Modification and Quantum Efficiency Enhancement of Er3+ emitters by Near-Field Coupling with Nanohole Arrays. ACS Photonics 2018, 5, 2189–2199. [Google Scholar] [CrossRef]
  33. Lumerical Solutions, Inc. Available online: http://www.lumerical.com/tcad-products/fdtd/ (accessed on 1 April 2021).
  34. Petronijevic, E.; Centini, M.; Cesca, T.; Mattei, G.; Bovino, F.; Sibilia, C. Control of Au nanoantenna emission enhancement of magnetic dipolar emitters by means of VO2 phase change layers. Opt. Express 2019, 27, 24260. [Google Scholar] [CrossRef]
  35. Hakkarainen, T.; Petronijevic, E.; Rizzo Piton, M.; Sibilia, C. Demonstration of extrinsic chirality of photoluminescence with semiconductor-metal hybrid nanowires. Sci. Rep. 2019, 5040. [Google Scholar] [CrossRef]
  36. Petronijevic, E.; Belardini, A.; Cesca, T.; Scian, C.; Mattei, G.; Sibilia, C. Rich near-infrared chiral behavior in diffractive metasurfaces. Phys. Rev. Appl. 2021, 16, 014003. [Google Scholar]
  37. Petronijevic, E.; Belardini, A.; Leahu, G.; Hakkarainen, T.; Rizzo Piton, M.; Koivusalo, E.; Sibilia, C. Broadband optical spin dependent reflection in self-assembled GaAs-based nanowires asymmetrically hybridized with Au. Sci. Rep. 2021, 11, 4316. [Google Scholar] [CrossRef] [PubMed]
  38. Liu, X.; Yuan Lei, D. Simultaneous excitation and emission enhancements in upconversion luminescence using plasmonic double-resonant gold nanorods. Sci. Rep. 2015, 5, 15235. [Google Scholar] [CrossRef] [PubMed] [Green Version]
  39. Petronijevic, E.; Sibilia, C. All-optical tuning of EIT-Like dielectric metasurfaces by means of chalcogenide phase change materials. Opt. Express 2016, 24, 30411. [Google Scholar] [CrossRef] [Green Version]
  40. Bauch, M.; Toma, K.; Toma, M.; Zhang, Q.; Dostalek, J. Plasmon-Enhanced Fluorescence Biosensors: A Review. Plasmonics 2014, 9, 781–799. [Google Scholar] [CrossRef] [PubMed] [Green Version]
  41. Pirruccio, G.; Lozano, G.; Zhang, Y.; Rodriguez, S.R.K.; Gomes, R.; Hens, Z.; Gomez Rivas, J. Coherent absorption and enhanced photoluminescence in thin layers of nanorods. Phys. Rev. B 2012, 85, 165455. [Google Scholar] [CrossRef] [Green Version]
  42. Ayala-Orozco, C.; Liu, J.G.; Knight, M.W.; Wang, Y.; Day, J.K.; Nordlander, P.; Halas, N.J. Fluorescence Enhancement of Molecules Inside a Gold Nanomatryoshka. Nano Lett. 2014, 14, 2926–2933. [Google Scholar] [CrossRef]
  43. Pirruccio, G.; Ramezani, M.; Rahimzadeh-Kalaleh Rodriguez, S.; Gómez Rivas, J. Coherent Control of the Optical Absorption in a Plasmonic Lattice Coupled to a Luminescent Layer. Phys. Rev. Lett. 2016, 116, 103002. [Google Scholar] [CrossRef] [PubMed] [Green Version]
  44. Djalalian-Assl, A. Dipole Emission to Surface Plasmon-Coupled Enhanced Transmission in Diamond Substrates with Nitrogen Vacancy Center- Near the Surface. Photonics 2017, 4, 10. [Google Scholar] [CrossRef] [Green Version]
  45. Ferraro, A.; Zografopoulos, D.C.; Verschuuren, M.A.; de Boer, D.K.G.; Kong, F.; Urbach, H.P.; Beccherelli, R.; Caputo, R. Directional Emission of Fluorescent Dye-Doped Dielectric Nanogratings for Lighting Applications. ACS Appl. Mater. Interfaces 2018, 10, 24750–24757. [Google Scholar] [CrossRef] [PubMed]
  46. Petronijevic, E.; Sandoval, E.M.; Ramezani, M.; Ordóňez-Romero, C.L.; Noguez, C.; Bovino, F.A.; Sibilia, C.; Pirruccio, G. Extended Chiro-optical Near-Field Response of Achiral Plasmonic Lattices. J. Phys. Chem. C 2019, 123, 23620–23627. [Google Scholar] [CrossRef]
Figure 1. (a) xy- and xz-plane views of the ENHA, with geometric parameters. The dashed region in the top schematic shows the unit cell used in the “passive” simulations. (b) Simulation set-up for the “active” simulations; the randomly oriented dipole is positioned inside the embedding medium, 20 nm above the ENHA, and at a distance from the center which corresponds to one of the points in the inset. The dipole emits at a single wavelength λem. The electromagnetic field at the excitation wavelength λexc is further introduced as an additional tuning and optimization possibility.
Applsci 11 06012 g001
Figure 2. Passive simulations of chiral absorption in Au-ENHA and Ag-ENHA as dependences on lattice parameter a. ENHA diameters are scaled as Dx = 280*a/500, Dy = a, while the angle offset from the hexagonal symmetry is held at 15°. (a) ALCP, (b) ARCP, and (c) CDA for the Au-ENHA; (d) ALCP, (e) ARCP, and (f) CDA for the Ag-ENHA.
Applsci 11 06012 g002
Figure 3. Simulation results for a randomly oriented dipole positioned at Δx = 0, Δy = a/2, and Δz = 120 nm, emitting at 740 nm (top), and 940 nm (bottom); we performed three simulation runs for each dipole orientation, extract LCP, RCP and total far-field intensity for each simulation, and then took the average.
Applsci 11 06012 g003
Figure 4. CDem maps for different dipole positions on the Au-ENHA, at 740 nm.
Applsci 11 06012 g004
Figure 5. CDem maps for different dipole positions for the Au-ENHA, at 940 nm.
Applsci 11 06012 g005
Figure 6. I ¯ LCP , I ¯ RCP , I ¯ tot , and CDem maps for the ensemble of 85 homogeneously distributed randomly oriented dipoles for the Au-ENHA, at 740 nm (top), and 940 nm (bottom).
Applsci 11 06012 g006
Figure 7. Passive simulations of the electric field intensity enhancement for the Au-ENHA, when its excited with RCP (top), or LCP (light) from the bottom. We plot normalized electric field intensity in two-unit cell cross-sections, detected by xz-monitor (centered at y = 0 nm), and xy-monitor (situated at z = 120 nm), at (a) 532 nm, and (b) 740 nm.
Applsci 11 06012 g007
Figure 8. I ¯ LCP and I ¯ RCP far-field maps of the Au-ENHA emitting at 940 nm, when it is excited with RCP (top) and LCP (bottom), at the wavelengths (a) λ e x c = 532   nm , and (b) λ e x c = 740   nm .
Applsci 11 06012 g008
Figure 9. CDem for RCP (top) and LCP (bottom) excitations of the Au-ENHA for = λ e x c = 532   nm ,   λ e m = 940   nm (left), λ e x c = 740   nm ,   λ e m = 940   nm (middle), and λ e x c = 633   nm ,   λ e m = 740   nm (right).
Applsci 11 06012 g009
Figure 10. (a) Typical absorption and emission spectra for Lumogen Red dye [45]. (b) CDem for RCP (top) and LCP (bottom) excitations of Ag-ENHA excited at λ e x c = 532   nm , and emitting at λ e m = 630   nm ; the inset shows the xy cross-sections of the electric field intensity, as in Figure 7.
Applsci 11 06012 g010
Publisher’s Note: MDPI stays neutral with regard to jurisdictional claims in published maps and institutional affiliations.

