Article

Advisory and Knowledge Transfer Tool for Ammonia Emission Mitigation on Pig Farms in Hungary

1
Centre for Agricultural Research, Department of Soil Chemistry and Material Turnover, Institute for Soil Sciences, 1022 Budapest, Hungary
2
Szent István Campus, Institute of Animal Sciences, Hungarian University of Agriculture and Life Sciences, 2100 Gödöllő, Hungary
3
Renewable Energy Research Group, Soós Ernő Research and Development Center, Faculty of Engineering, Nagykanizsa Campus, University of Pannonia, 8800 Nagykanizsa, Hungary
4
Georgikon Campus, Institute of Physiology and Nutrition, Hungarian University of Agriculture and Life Sciences, 8360 Keszthely, Hungary
5
University Laboratory Center, Hungarian University of Agriculture and Life Sciences, 2100 Gödöllő, Hungary
6
Georgikon Campus, Institute of Animal Sciences, Hungarian University of Agriculture and Life Sciences, 8360 Keszthely, Hungary
*
Author to whom correspondence should be addressed.
Appl. Sci. 2021, 11(13), 5970; https://doi.org/10.3390/app11135970
Submission received: 30 May 2021 / Revised: 22 June 2021 / Accepted: 25 June 2021 / Published: 27 June 2021
(This article belongs to the Special Issue Applied Agri-Technologies 2)

Abstract

:
The Ammonia Gas Emission Model for Swine (AGEM-S), a nitrogen flow model, was created with the objective of assisting in the reduction of ammonia emissions in the Hungarian pig sector. Regarding the applied technological processes and considering the factors that influence ammonia emissions, the model quantifies the amount of ammonia emissions of pig farming in all stages (feeding, housing technology, manure storage, and application in the field). The aim of the project was to create a system that performs general calculations using the input data used by practicing farmers, without compromising the information content of the output data. Using this system, the input parameters can be entered as simply as possible and in the shortest possible time. In addition to demonstrating the impact of ammonia emission reduction measures to farmers from an integrated N management approach, AGEM-S has the potential to support the transfer of emission reduction technologies and practices at the farm level as a knowledge transfer tool primarily, but also as a decision support tool for technological change.

1. Introduction

At the municipal, national, and EU level, the issue of air quality is receiving increasing attention. Ammonia is one of the most dangerous pollutants in the atmosphere, since it may travel great distances before being deposited in soil and surface waters, either dry or wet. Ammonia from agricultural operations promotes nitrogen overfertilization in natural ecosystems; it contributes to biodiversity loss and leads to general acidification of the environment and new types of deforestation [1,2]. The formation of particulate matter, especially fine particles (PM2.5) with a diameter less than 2.5 µm, which travel vast distances with the wind [2,3], is linked to ammonia emissions [4,5]. The degree of damage to health is determined by the particle size range and chemical composition [6,7].
Agriculture is the primary source of ammonia. According to Hungary’s 2019 air pollutant inventory report, the national total ammonia emission was 79.4 kT, of which agricultural sources accounted for 92%, with over half (45.2%) coming from manure treatment, almost a quarter (21%) from manure application, and a quarter (26%) from fertilizer usage. Pig farming (22.5%) contributes to the emissions related to the manure treatment of certain farm animal species [8].
Recognizing global risks, the National Emission Ceilings Directive 2016/2284 provides for the reduction of national emissions of specific atmospheric pollutants in order to enhance air quality in the European Union [9]. According to this, Hungary must reduce ammonia emissions by 10% by 2020 and 32% by 2030, relative to the 2005 baseline. This obligation requires urgently rethinking agricultural practices.
As a result, pig farms are increasingly under pressure to cut their emissions. To do so, farmers must first understand the measurements at their disposal and the extent to which they can reduce emissions. They must first comprehend the farm-level release processes in order to understand how intervention points function. Despite the fact that research has discovered and measured sources of ammonia emissions in recent decades, and abatement technologies have been developed, these alone do not ensure that farmers use the right technologies on their farms. This was concluded by the Standing Committee on Agricultural Research (SCAR, European Union) according to which, knowledge transfer should be an organic part of research activities to guarantee that research results are useful, easy to comprehend, and relevant to farmers [10]. Thus, the adaptation of scientific findings is required in the application of technology at the farm level in terms of minimizing agricultural emissions.
The National Chamber of Agriculture [11] drew attention to the fact that the gaps in the professional knowledge of Hungarian farmers and employees are significant, as 80% of farm managers operate without specialized qualification or based only on practical experience.
Recognizing this problem, the AGEM-S model has been developed to raise awareness of the pig sector’s contribution to ammonia emissions. The AGEM-S is a farm-scale model that quantifies the amount of ammonia emissions for processes of pig farming in view of the applied technological processes.

2. Materials and Methods

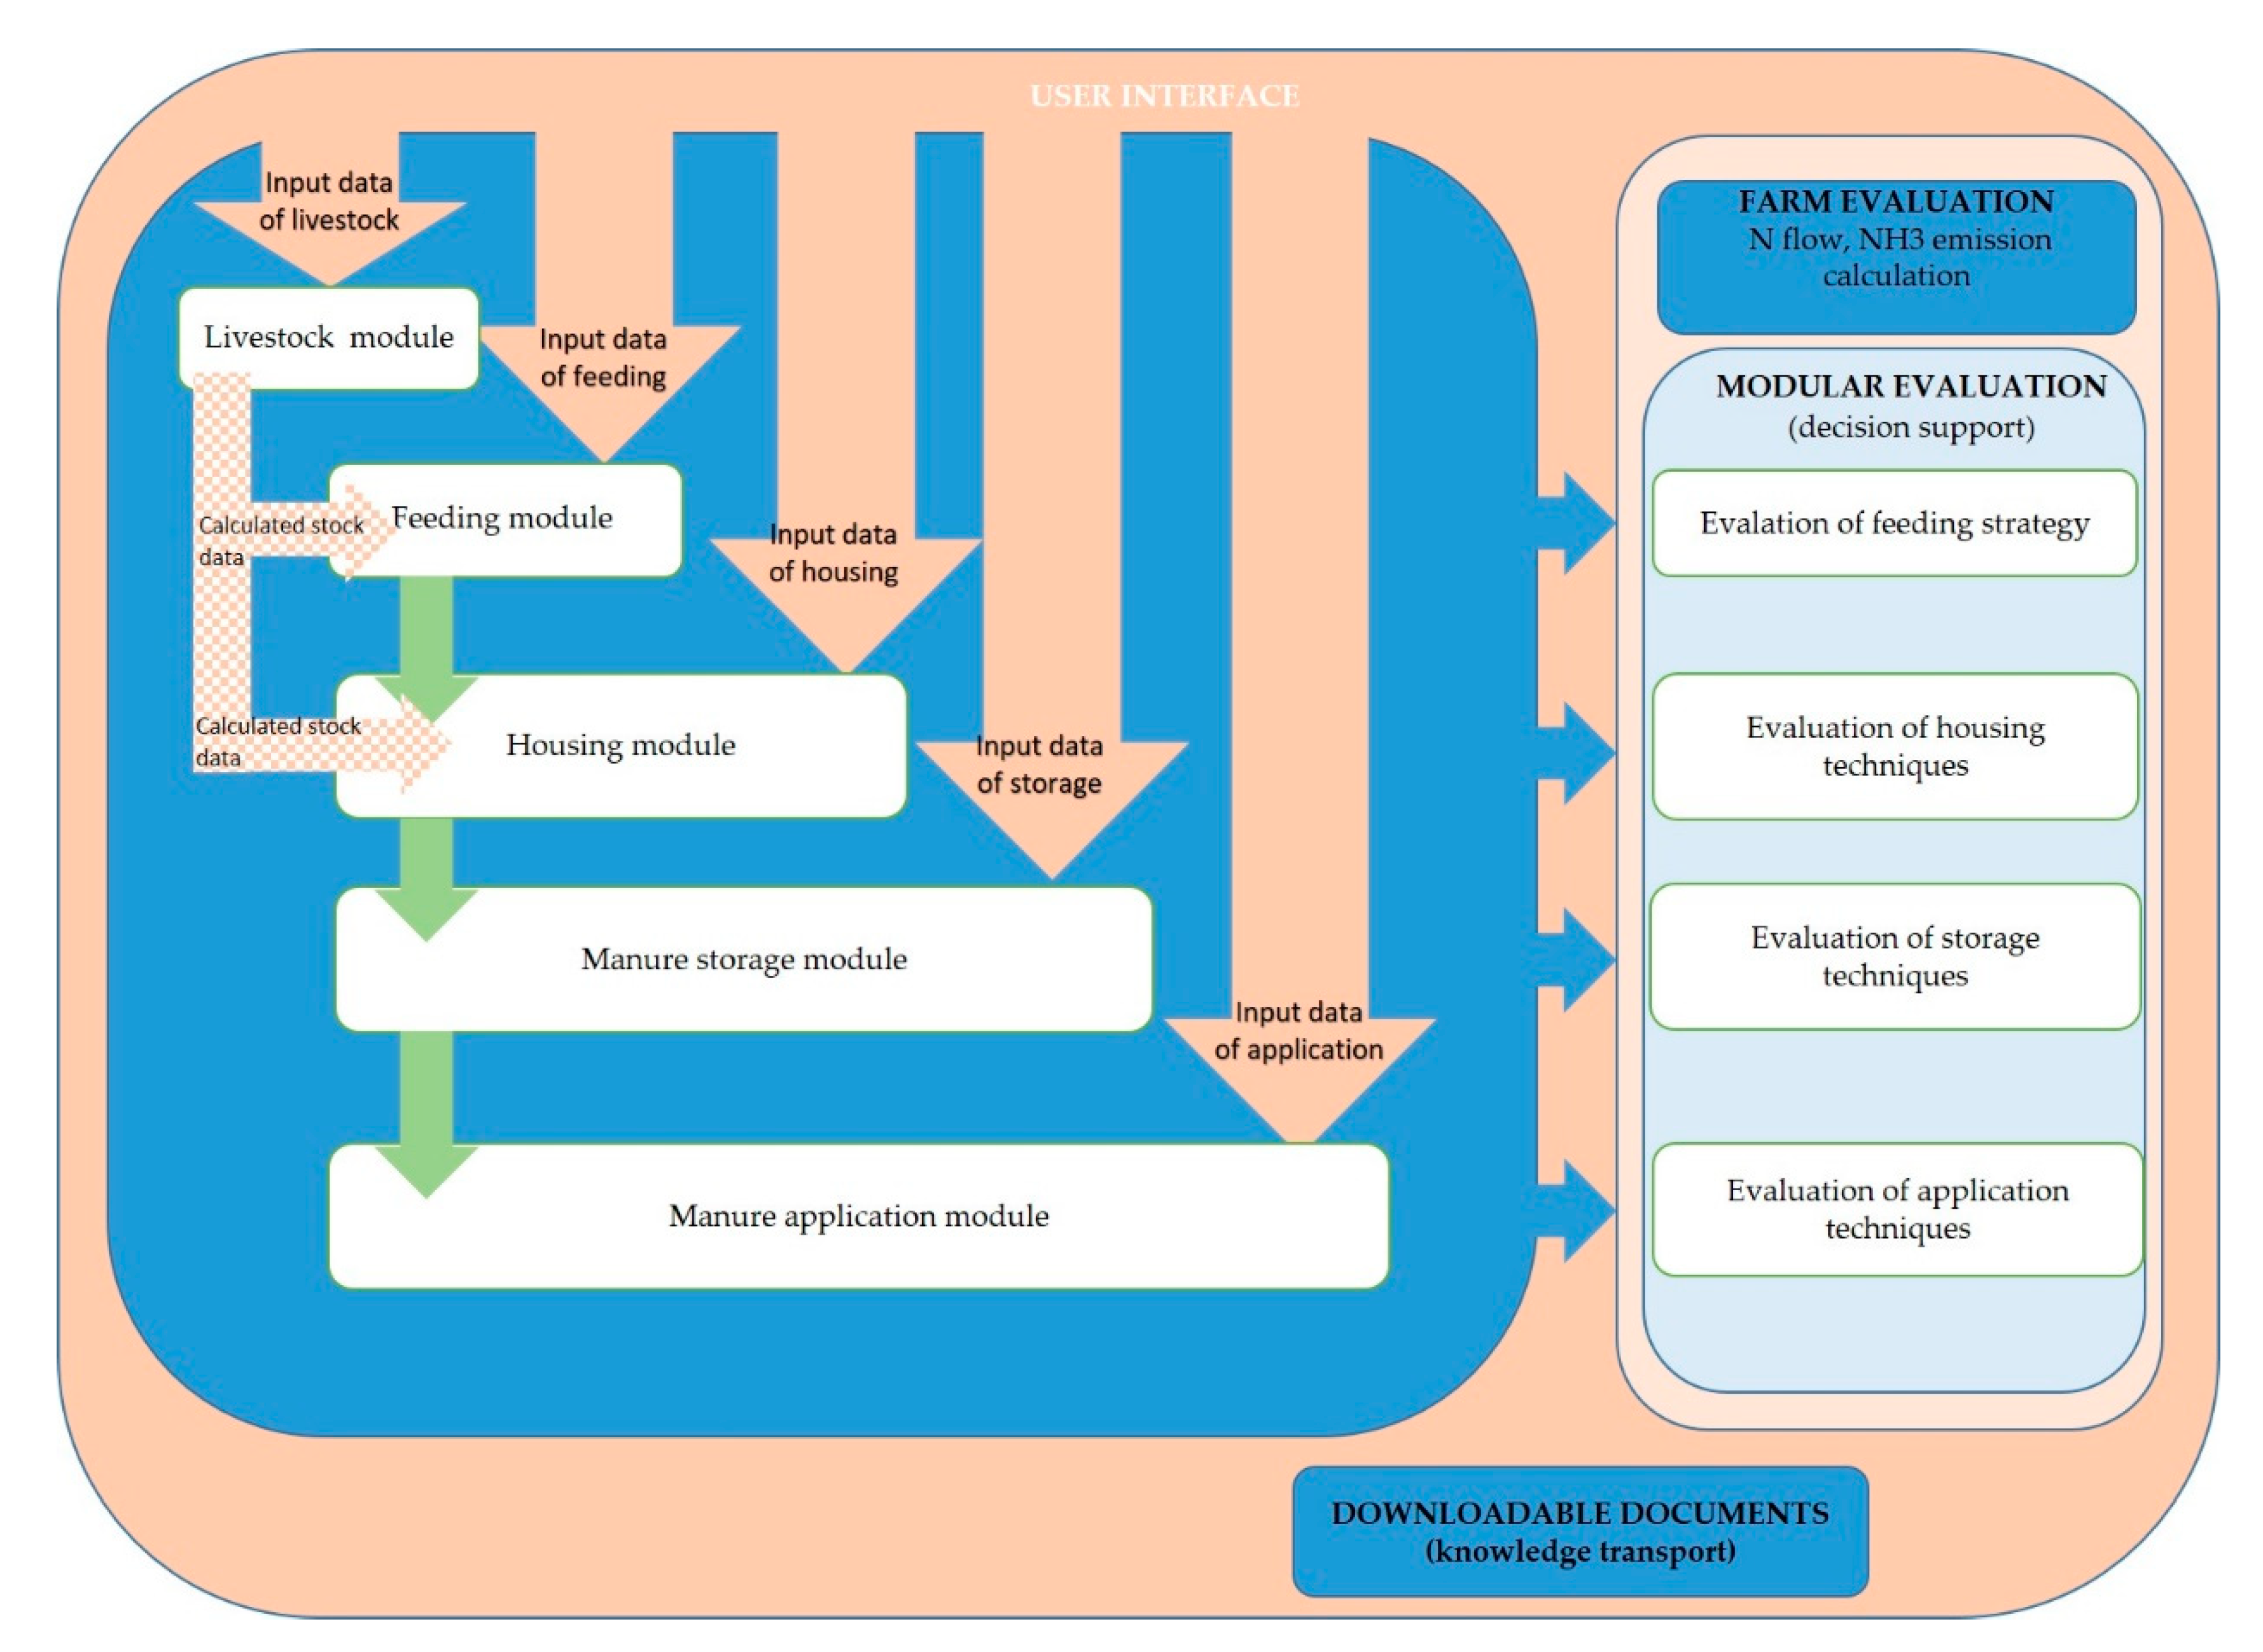
2.1. The System Architecture

In the absence of any country-specific emission factors for ammonia emissions from pig farming in Hungary, the work relied on the international literature. Although the primary focus was on estimating ammonia emissions at the farm level, it was important to develop a model that could be improved in the future and also complemented with modules that support greenhouse gas (GHG) emission estimation. In addition, a pig technology survey carried out by our research group in previous years provided a representative database on the housing, storage and application methods used in Hungarian pig farming.
The most significant ammonia and GHG models [12]—Manure Model [13], DYNAMO [14], NARSES [15,16], FARMSCOOPER [17], NEMA [18], FEM [19], REPRO [20,21,22,23], EFEM [24], MAM/MAMBO [25], AGRAMMON [26], DiaryGEM [27,28], and DNDC Manure [29]—were analysed on the basis of the following considerations: adaptability, taking into account greenhouse gas emissions, calculation of field application, applicability or adaptability at the economic (farm) level, and that its data requirements should stay at a tolerable level for Hungarian farmers. Based on these aspects, the AGRAMMON model was selected [30,31] for adapting the domestic model.
AGEM-S is a TAN-based material flow model for calculating the amount of ammonia emitted from the TAN presented at each module (Nutrition, Housing, Manure storage, Manure application) using emission rates (ERs) and considering the applied techniques and the correction factors (CFs) that influence ammonia emissions. For each technological stage, ERs indicate what percentage of the TAN content of the manure is emitted in the form of ammonia in the stable, storage, or application. The applied CFs take into account the (production) technological parameters that influence the rate of N excretion and ammonia emissions. The efficiency of emission-reducing procedures is indicated in each case in relation to a reference system.
AGEM-S as a model includes strategies, technologies, and ammonia emission abatement techniques that are typical of domestic production practices and have a scientifically proven, i.e., quantifiable, ammonia emission reduction effect, based on literature data. During the development of AGEM-S, a main aim was to ensure that the system could make calculations from input data used daily by practicing farmers without compromising the information content of the output data, so that the input parameters could be entered as simply as possible in the shortest possible time. The calculated results in the form of numerical values are available as farm evaluations.

2.2. Scientific Background of Data Requirement and Modules of AGEM-S

2.2.1. Input Data—Natural Indicators of Pig Livestock

The genotype of pigs influences their nutrient requirements and the rate and duration of incorporation of nutrients into their bodies, which are reflected in the N retention values [32]. Current feeding practices allow feeding each age category in line with their genotypic requirements. The genotype of the pigs was taken into account, and a distinction was made between genotypes with intensive growth capacity (Genotype “A”) and genotypes with lower growth capacity (Genotype “B”).
Therefore, the genotypes of the maternal and paternal herds has to be selected by using a drop-down menu. In addition, reproductive indicators that characterize the standard of production and influence the number of piglet, grower, and finisher groups are also required, thus providing information on the ammonia emission potential of the farm (Table 1).
The data provided by the farmers is the quantitative basis for the emission calculation as it determines the daily average number of animals of each age group. The N input can be calculated by entering the average daily feed intake together with the feed content values of each animal present in the given feeding phase and age category.

2.2.2. Nutrition Module

The starting point for ammonia emissions is the N excretion (N output) of pigs, calculated as the difference between N input and N retention. The rate of N excretion is determined by the digestion and efficiency of protein utilization of the animals. In this respect, the different utilization types differ considerably. Moreover, the N retention of animals varies over time.
Available research findings show that the N retention of pigs is 31–45%. The proportion of unutilized urinary N is 49–51% of the intake, while the proportion of fecal N is around 15–20% [33]. The vast majority of urinary N, i.e., 65–85%, is present in the form of urea and other easily mineralized compounds [34]. In contrast, the majority of fecal N is protein, which is why it is decomposed and converted to ammonia more slowly [35]. For this reason, TAN can be considered as the amount of N excreted via urine [36].
The N retention of pigs differs significantly by genotype and age category, according to our own findings [37]. In the model, average live weight data are considered in each group, which is, of course, a source of smaller or larger errors. While calculating the N retention of the animals in the model, our own results were used. For weaned piglets and for fattening pigs, we distinguished the genotypes (“A” or “B”) based on our own previous results, while for the other pig categories (sows, boars, breeding animals), the retention values from the national inventory calculation were used [38].
There are no large variations in the TAN proportion of excreted nitrogen in these age categories; the proportion of TAN in total excreted nitrogen varies between 55 and 59%. Literature data for intensive pig breeds are close to our measured N-flow values [33,39]. Regarding the TAN content of excreted nitrogen, the most common TAN value used in the available literature is 70% [34]; thus, this was used in the AGEM calculation.
In the integrated approach to calculate ammonia emission reduction in the feeding module, all influencing factors that may modify the amount of N incorporated and excreted by pigs were taken into account in AGEM-S, with the inclusion of correction factors (CFs) accepted in the international literature.
Reduced protein feeding strategy: The amount of nitrogen excreted by pigs is influenced by dietary factors, the most important of which is the protein and amino acid supply. Research results have shown that it is possible to reduce the protein content of pig diets by up to 3–4% without compromising the production results when limited essential amino acids are supplemented [40].
Experiments show that a 1% reduction in dietary protein content reduces the TAN content of manure by 8.6–10% [40,41,42,43,44]. In the AGEM-S, a 10% reduction in TAN was applied, while reducing the protein content of the diet by 1%.
Using more nutritional phases: The protein and amino acid requirements of pigs change daily with age, which is related to the different ratio of weight gain and maintenance. This change of requirements can be followed by different feeding phases. The effect of multiphase feeding is most applicable in the fattening phase. During fattening, the use of a 3-phase feeding reduces N excretion by 16% compared to fattening on a single phase feeding [45], and 5 phases instead of 2 phases results in a reduction of 0.45 kg N/N excretion per animal per year [44]. In the AGEM-S model, the number of feeding phases as an emission influencing factor was used only in the case of fattening, where 3-phase fattening was the reference, and one more phase meant −0.15 kg N/year correction and one less phase meant +0.15 kg N/year correction, respectively. A maximum of 4 fattening, 3 piglet, 2 suckling or pregnant sow, 2 gilt, and 1 boar feeding phases can be chosen. In practice, the reduced protein feeding strategy can be combined with the increase of nutritional phases.
Feed additives: Since NH3 is formed from manure under the influence of bacterial fermentation, the pH of the urine and feces excreted affects the process. For this reason, any feed additive that reduces the pH of urine and feces will result in lower ammonia emissions. For instance, reducing the pH of urine can be achieved by partially replacing limestone with calcium sulphate or calcium chloride or by supplementing the feed with benzoic acid. According to the literature results, additional Ca benzoate reduces the pH of manure from 6.8 to 5.3 and that of urine from 8 to 6.4, in comparison with a control diet [40]. At a concentration of 0.5%, it reduces the ammonia produced in the stable by 3.6–5%, and at a concentration of 1%, by 7.5–14% [44]. The additional use of benzoic acid in the AGEM-S system was taken into account as an NH3 emission decreasing factor in the pig house. A 4% ammonia emission reduction was considered in line with the 0.5% mixing rate, as employed in practice [44].
In the nutrition module the number of feeding phases for each age category must be defined first, followed by the feed intake for each phase, the initial and final weight of piglets and fattening pigs, and the number of days spent in that phase in the case of other age groups. After this, the crude protein content and digestible energy content of the feed, and also the amino acid and benzoic acid supplementation, must be indicated (Table 2). In the background, the model calculates the TAN and N excretion for the age categories and feeding phases, taking into account the genotype-specific N retention factors as well as the protein reduction and phase feeding correction factors. The cumulative daily TAN excretion of the farm is calculated by adding the daily TAN excretion of all existing livestock in each feeding phase.

2.2.3. Housing Module

The ammonia released in the pig houses is derived from urine [45], so the factors that determine the distribution of urine on the floor greatly influence ammonia emission [46,47,48,49], which is a complex physical and chemical process [50].
Ammonia is released into the air from the floor, the contaminated animal body, the walls, and the manure pit; the main sources are the contaminated concrete floor, the slatted floor, and the liquid manure [51,52]. Reducing ammonia emissions in the pig barn can be achieved on the basis of the following [1]: reducing the surface area of the slurry; frequently removing slurry from the pit; additional treatment; cooling the surface of the slurry; changing the physical/chemical properties of the slurry; using easily cleanable surfaces; purifying the exhaust air; reducing the internal temperature and ventilation rate; reducing the air flow over the surface of the slurry.
In the case of litter-based housing systems, deep litter can affect the extent of ammonia emission rates in different ways: urine infiltrates deep into the litter, reducing the surface area in contact with the air, and the structured rough surface of deep litter reduces airflow directly above the emitting litter surface. Moreover, litter material promotes the biological transformation of N through the oxidation and immobilization of TAN [53]. The literature data express contradictory views on the extent of emissions from litter systems. Some authors found significantly higher ammonia emissions from fully slatted floors than from deep litter with straw bedding [54,55,56]; in contrast, others reported that deep litter emits nearly twice as much ammonia as the slatted floor [57,58].
Within the housing module of the AGEM-S, the most typical litter- and slurry-based housing systems and techniques for Hungarian conditions were considered, according to the type of floor and the method of manure removal. Several technologies can be chosen, for which ERs were assigned according to Kupper [31]: outdoor; litter based housing with daily manure removal; deep litter housing; slurry based housing with fully slatted floor; slurry based housing with partly slatted floor; concrete floor with manure channel. If available on the farm, the model considers the applied NH3 emission-reducing housing techniques with the CFs on the basis of the Options for Ammonia Mitigation [1].
The basic unit of the housing module is the stable. The excretion of the indoor livestock, calculated in the feeding module by age categories, is allocated in the given housing environment of each stable using the following input data (Table 3). The effect of feeding benzoic acid is taken into account here. The module calculates how much ammonia is released from the manure indoors and/or outdoors and how much N remains in the manure/slurry storage on the basis of the ERs of the applied housing technology elements and CFs of the emission reduction practices. Continuous production is assumed, with a steady utilization of capacity in the functional stables.

2.2.4. Manure Storage Module

After leaving the livestock building, or occasionally after passing through certain treatment methods, manure of different consistencies is disposed of in storage until the date of use. Emissions from manure storage are influenced by the chemical composition and physical characteristics of the manure (dry matter content, pH); the characteristics of the emitting surface (size, crust, cover); climatic conditions (ambient temperature, rain, wind); and, in the case of solid manure, the compostability potential (water content, density, carbon content) [44].
During storage, the manure should be isolated from the ambient air, and the surface area of the manure should be reduced to achieve the lowest possible ammonia emissions; otherwise, physical and chemical degradation processes could be enhanced [59,60]. Techniques that can be used to cover the surface of the storage include the application of a layer of sprayed straw on the surface of the manure, floating films, plastic covers, roofs, and other materials such as oil or peat [61]. The natural crust that forms on the surface of the stored slurry depends on its dry matter content and on the local climatic conditions. Frequent mixing should be avoided, and tanks should be filled and emptied below the liquid level to avoid disruption of the crust that forms [44]. Ammonia emissions can be reduced by lowering the temperature [62] or by lowering the pH of the slurry [44,63]. In the case of solid manure, the phenomenon of self-heating, which triggers the composting process, must also be taken into account; this also affects ammonia emission, and it is therefore recommended to cover the manure pile to limit air flow, which can be reduced by manure compaction [56].
The AGEM-S storage module treats litter-based manure and slurry separately, taking into account the average annual volumes stored, the type of storage, and the physical characteristics (size, coverage) that determine the amount of ammonia emissions. The ER and CF values are estimated according to Kupper [31] and Bittman et al. [1].
The basic unit of the module is the manure storage. The data requirements of the model are annual quantitative data on manure production, storage, and sale, as well as the volume and surface area of the storage facilities (Table 4 and Table 5). If the farm has more than one storage type, aggregated volume and surface area data are required. Sales data are needed for the calculation of the ammonia emissions from the application.
In order to determine the proportion of the TAN and N content of the manure in storage, it is necessary to determine whether solid manure or slurry is produced and stored according to the applied housing system. AGEM-S calculates according to the formation of solid manure in the case of litter-based techniques, and the formation of slurry in the case of slurry-based housing techniques. The model calculates the ammonia emissions during storage and the N and TAN content of the manure intended for application, taking into account the given storage data.

2.2.5. Manure Application Module

The use of solid and liquid manure in pig farming can result in significant losses of NH3, up to 10–15% of TAN, within hours if not applied correctly [64]. The rate of loss is influenced by a number of factors, including application technique, soil properties, and weather. These interact to produce the actual rate of ammonia loss.
In general, every process that reduces the time or the surface of direct contact of manure with air also reduces ammonia emissions [12]. Therefore, injecting slurry and incorporating manure into the soil in the shortest possible time has a clear emission reduction effect. In contrast, during the spreading, an intensive ammonia release process takes place in the air and later on the surface of the soil.
Soil properties (i.e., physical type, structure, moisture content, pH) affect ammonia emissions in several ways, and the effect of weather is obviously significant under field conditions [1].
In practice, most pig farms in Hungary do not have their own land; thus, in these farms, the manure produced is sold. In this case, the pig farmer has no information on the conditions under which the manure produced on the farm is applied. This could distort the ammonia emissions later on, so the model uses an average value based on the data collection from 100 representative pig farms in Hungary.
The technology survey referred to in Section 2.1 includes, among other data, information on manure application. For both slurry and organic manure, the application technology, the time of application, and the typical period of application are recorded. As the 100 farms selected were representative of the Hungarian pig sector as a whole, the amount of ammonia released into the air during liquid manure application from farms without land was distributed in proportion to the technologies recorded during the survey. This is considered to be as close as possible to the national average.
If some or all of the manure produced is used on a farmer’s own land, the application module requests data from the farmer on the technology of application, time of incorporation after application, the seasonal distribution of the manure application, and additional fertilization (Table 6).
Nitrogen fertilizers used in crop production also emit ammonia [65], which contributes to the total emissions from mixed farms (where livestock and crops are also produced) and should therefore be taken into account. In order to avoid distorted data for farms with a small number of animals but a large agricultural area, the farmer should provide fertilization data only for the plots treated with pig manure or slurry in the given year. ERs are estimated based on the EMEP/EEA air pollutant emission inventory guidebook [12].

3. Results

The main results of the project are the development of the science- and practice- based, widely accessible, free-for-use AGEM-s model. The model determines the annual amount of excreted nitrogen and TAN and the emitted NH3 based on the input data and monitors the changes of all three during housing, storage, and application. The system is available in Hungarian on the AGEM.NAIK.HU website, and the use of the application is free and anonymous, only requiring a one-time email registration.

3.1. The Data Structure and Functionality of AGEM-S

The AGEM-S model is based on the farm as a logical unit, and its data structure consists of five main modules (Figure 1), including farm-level livestock data, nutrition, housing technology, manure storage, and manure application modules, which are presented to the user via the user interface.
Each module contains input data, reference data, and calculated data. The stables and the manure stores are the basic units where the N-related processes take place and are identified by their names. The flow of N and TAN between the modules is taken into account continuously, with the output of one module serving as the input of the next one.
AGEM-S includes both interface and evaluation checks. The interface checks are run in connection with the “Save” button, and in the case of missing, incorrectly entered, or inconsistent data, an error message alerts the user to correct the data. The data can only be saved after being corrected/completed. The evaluation check is available at the end of the data entry, under the “Results” menu, where the data content of the fields is compared. The “Evaluation Document” will only be active if the check has not found any errors. Otherwise, the user will have to follow the instructions in the error list displayed to correct the data entered.
The results of the farm-level ammonia emission estimation are displayed in a downloadable pdf file called “Farm Evaluation Document”. The user can access downloadable information under the documents menu.

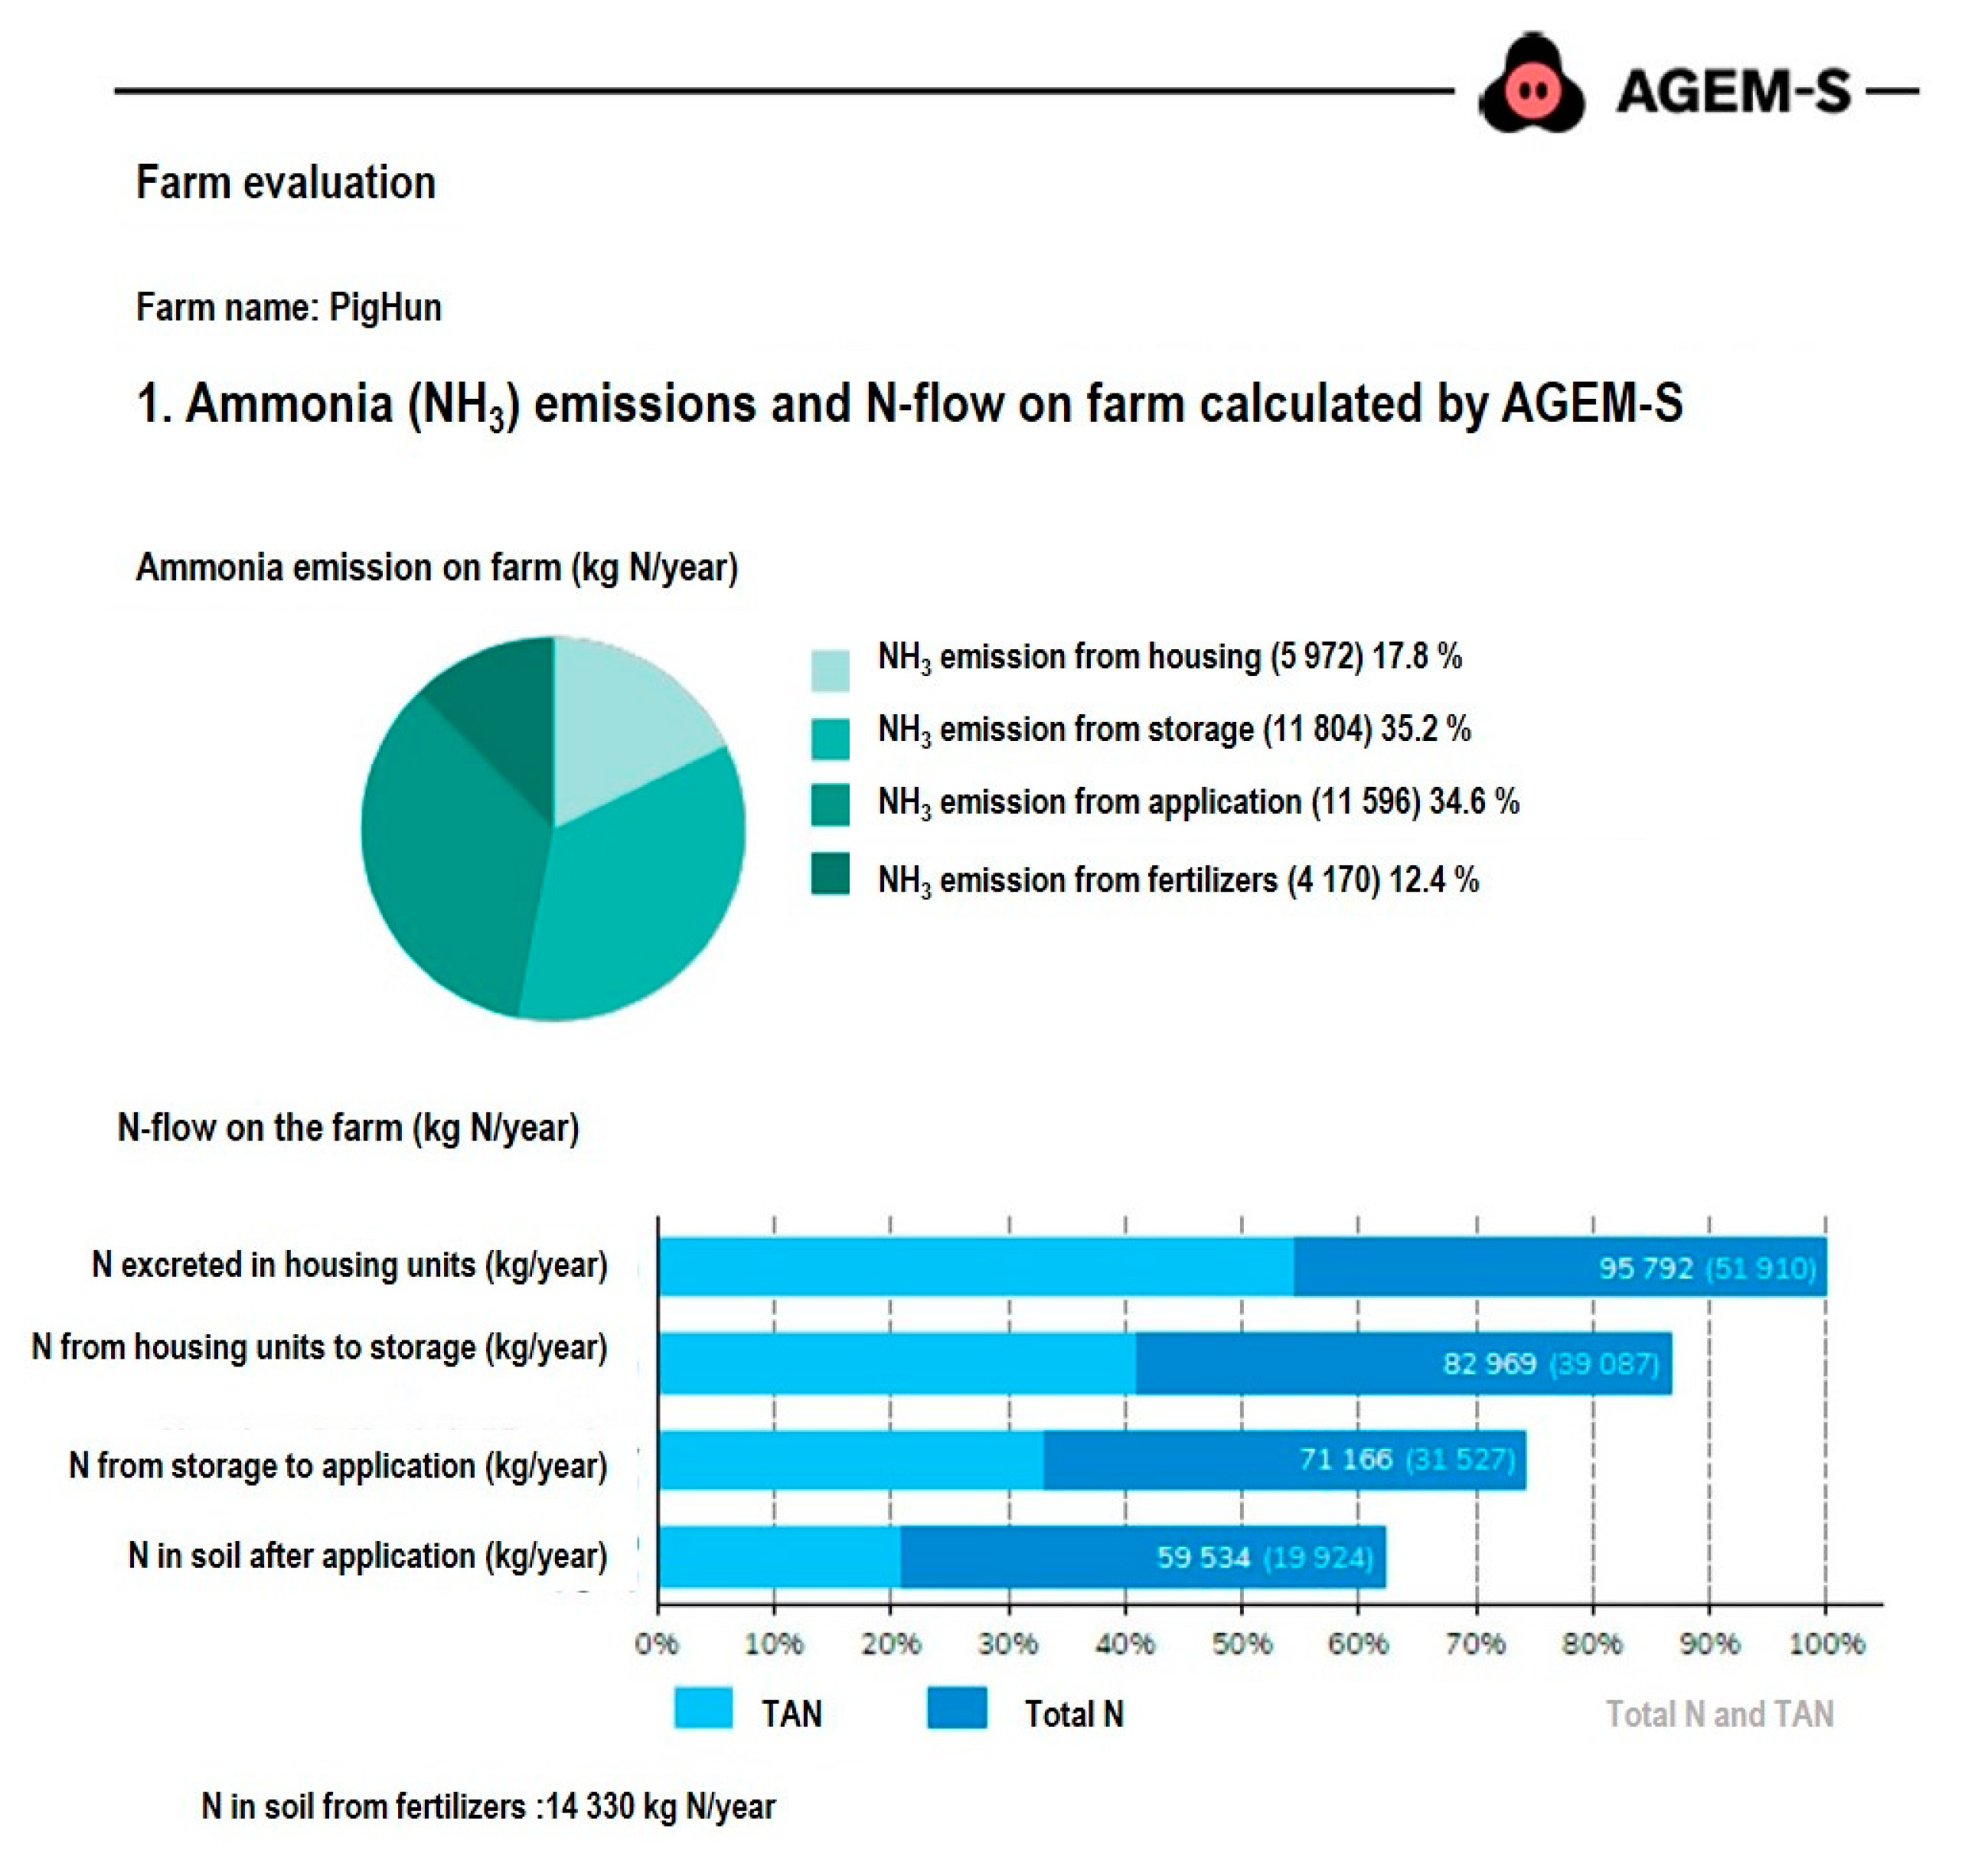
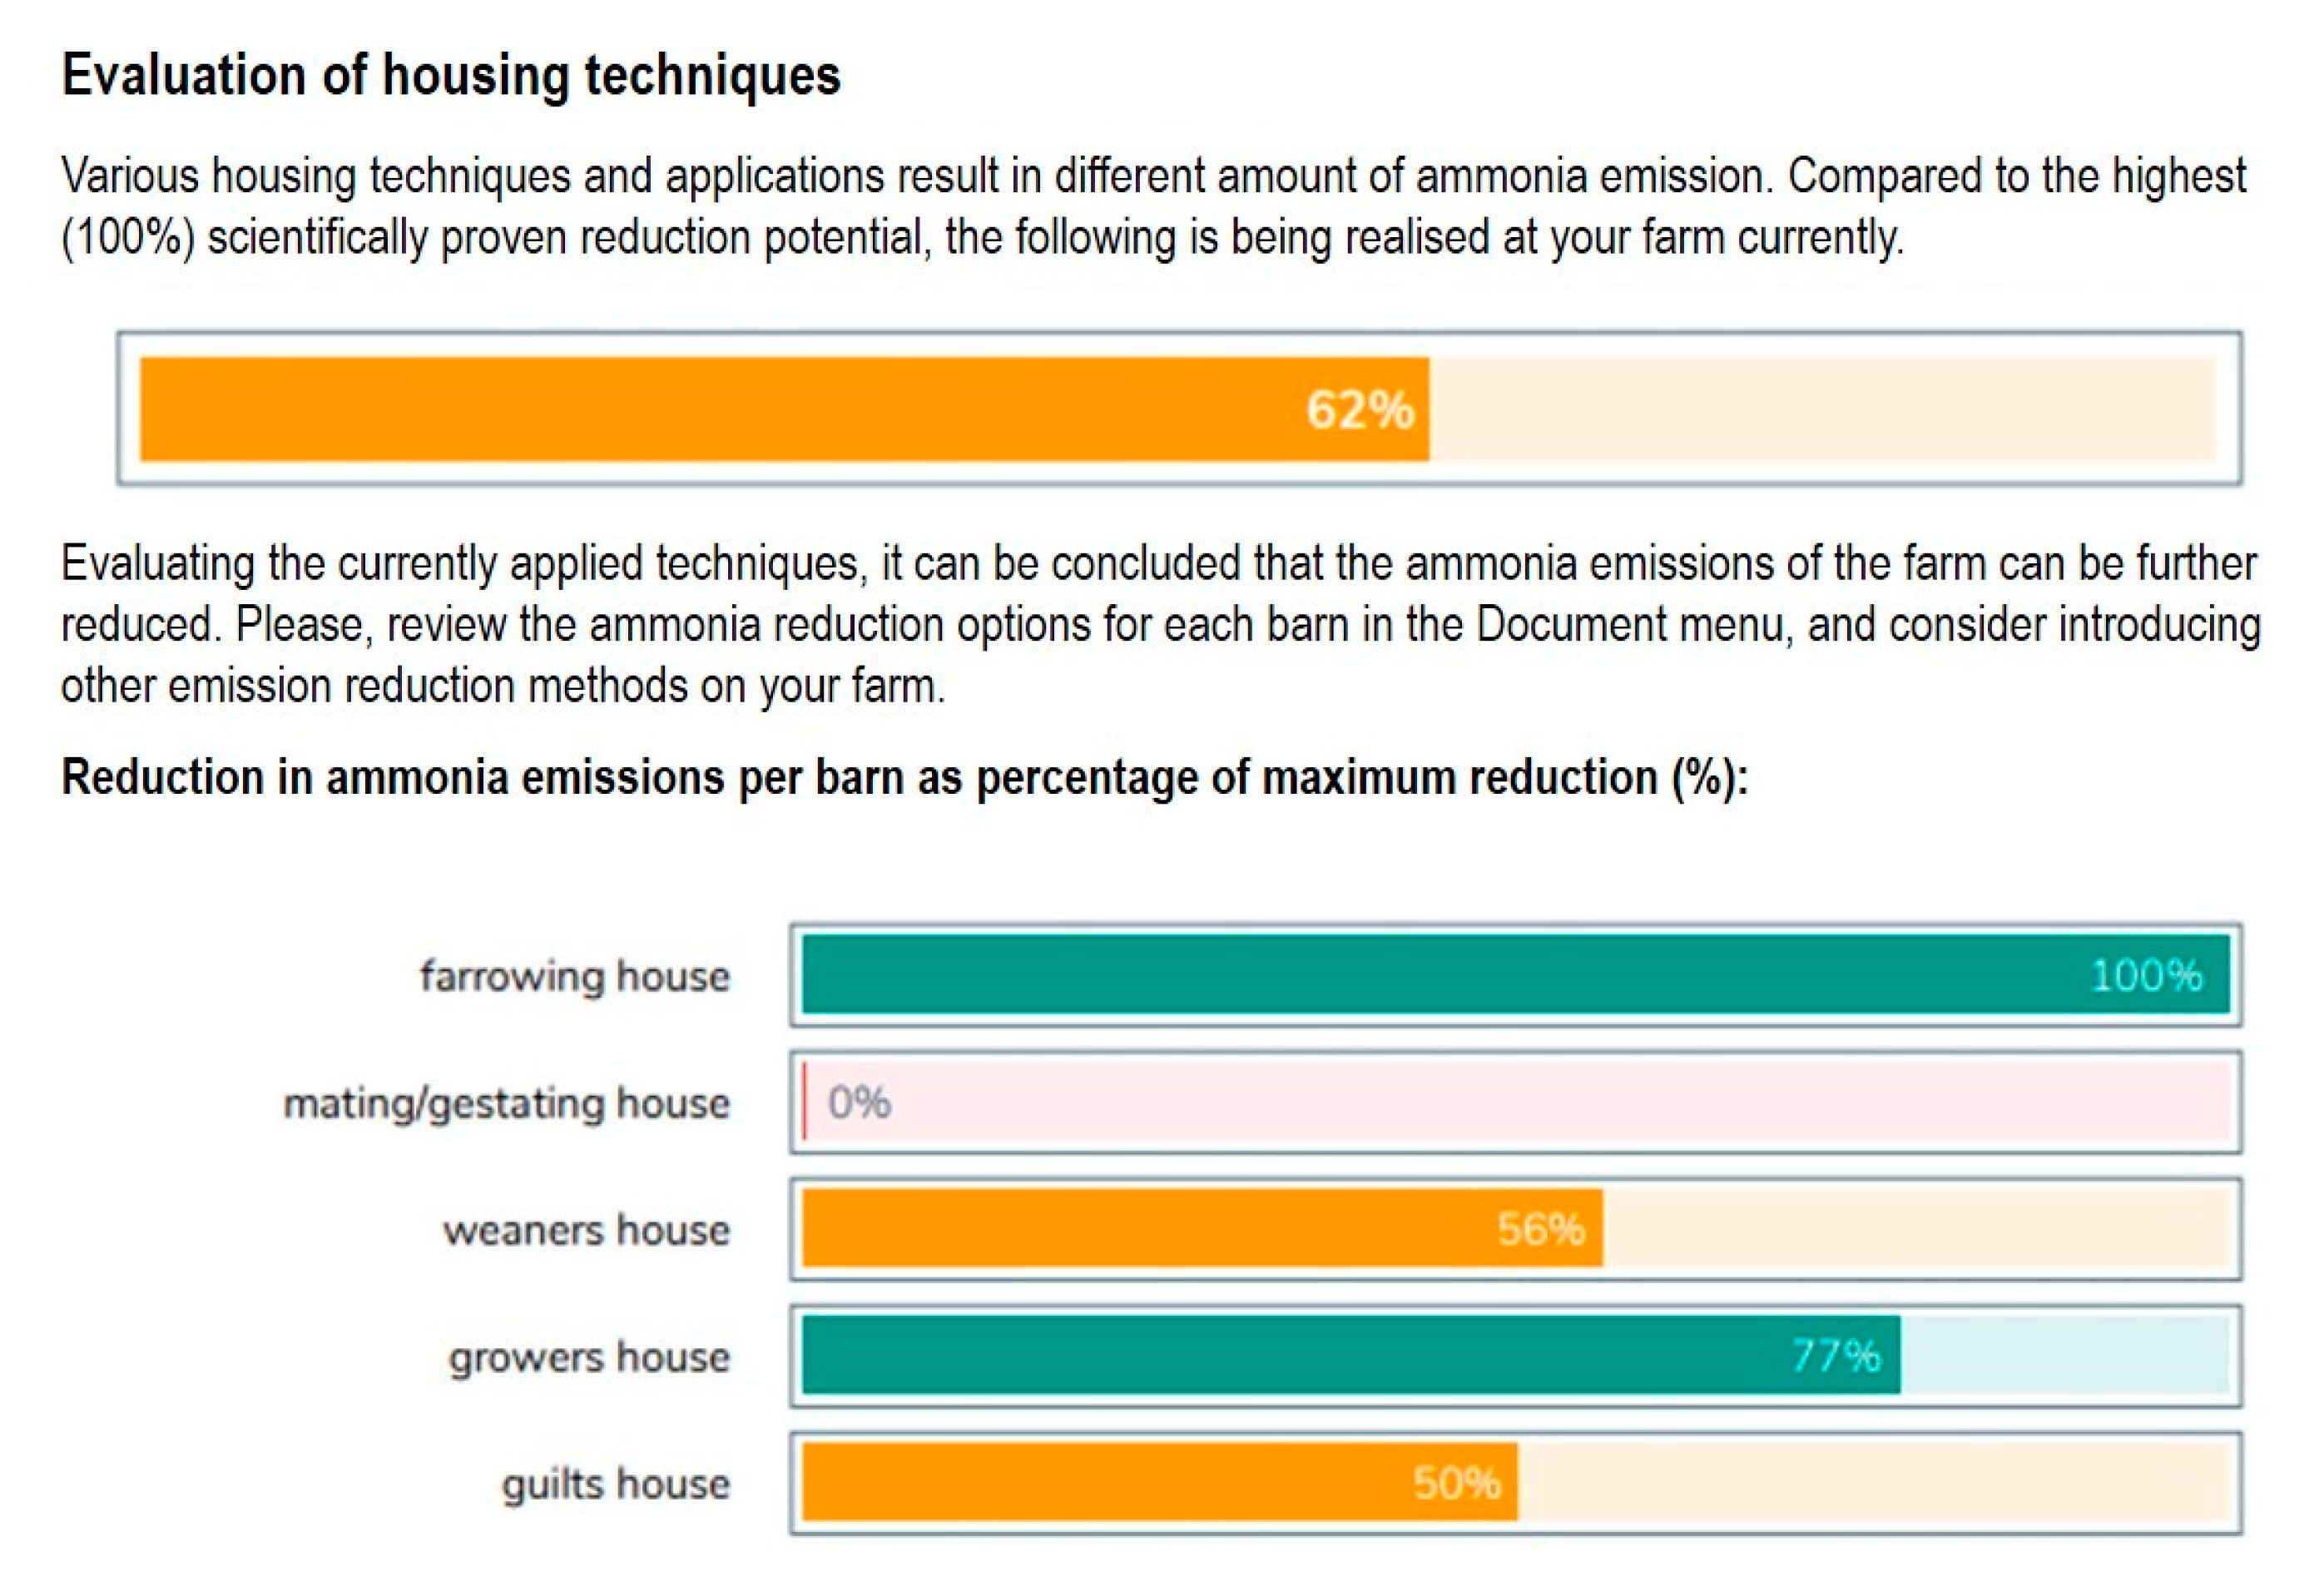
3.2. Farm Scale Evaluations as the Outputs of the AGEM-S

The results are presented in a pie chart showing the total calculated ammonia emissions from the farm, subdivided into emissions from housing, storage, field application, and additional nitrogen fertilization. The following bar chart depicts the on-farm nitrogen flow, which can be used to monitor how the TAN content of nitrogen excreted by animals decreases during the time of housing and subsequently in storage and application (Figure 2).
Farm evaluation is an illustrative tool for demonstrating the total nitrogen flow in the pig farm, providing a realistic picture of NH3 emissions from livestock operation based on the results of a properly completed model. The selected graphical view gives a visual representation of the decreasing TAN content in each module, which together with the total nitrogen content provides a good picture of the changes in the nutrient content of manure. In addition to reducing ammonia emissions, the higher the nitrogen content that remains in manure, the more beneficial for crop production, as it contributes to higher crop yields.
The principle for assessing each module is similar. The amount of NH3 emissions achieved without any abatement measures is determined in parallel with the amount of ammonia emissions realized using most techniques simultaneously (e.g., application) or using the most efficient abatement techniques. These levels form the two endpoints of a “quantitative” scale. The actual reduction achieved should be assessed in proportion to this. This also means that the scale is relative, as each technology element has a different emission reduction potential. However, it is not a disadvantage for the overall assessment, as it will direct the attention of farmers towards technologies with a higher emission reduction potential. The application of the principle allows NH3 emissions to be assessed per module or even within a module (feed per age category, housing technology per livestock building, or other technologies). It is very beneficial for the farmers, giving visibility to the technological elements within the farm that need to be improved the most. For example, in the case of livestock buildings, the introduction of a technology with the highest correction factor does not necessarily result in the lowest ammonia emission if the number of animals is considered. In the majority of farms, the growing/finishing stock is the largest emitter, so even a small reduction in emissions affecting these age groups can lead to significant operational reductions.
A good example of the complexity of judging by the correction factor is the assessment of air purifiers in the model. Air filtration equipment proved to be effective in trapping ammonia in the air released from the stable. Acid scrubbers are 70–90% effective in filtering NH3, depending on pH, and bio-drip filters are 70–75% effective in capturing odor and particulate loads in the barn [1]. Since the use of the AGEM-S model has the dual purpose of determining ammonia emissions and monitoring the amount of nitrogen remaining in manure as a source of nutrients that can be further used, the use of air purifiers cannot be evaluated as the best emission reduction technique from this point of view. Although their impact on ammonia emissions is undebatable, the bound nitrogen is removed from the farm-level N flow system and does not follow the pathway mapped in the model.
The evaluation system therefore follows a unique bottom-up logic. Once the values of each technological element have been determined, a weighted aggregation gives the value of the module. Weighting is done by the rate of the emission reduction potential of each element, so that technologies with a higher reduction potential are weighted more heavily (Figure 3). The figures are explained in detail to further understanding.
The results of the modules are totaled in the score of the farm. The principle of aggregation remains the emission reduction potential. The higher the farm score, the more significant the use of techniques resulting in reduced ammonia emissions.
As the intervention options generally consist of quite costly upgrades, it is important to be as precise as possible about how they are to be implemented and the emission reductions they will achieve. A bottom-up modular assessment system is an appropriate way to do this. The assessment can be downloaded in the form of a pdf document.
Since the range of technologies that can be selected in the model covers the applied solutions in Hungary, it is also possible to model the impact of the planned technological changes. The IT design allows the user to copy and paste the data of an already uploaded farm into a new farm and to model the impact of the planned improvements by modifying the input data. This makes it much easier for the user to compare the emission reduction impact of the technology variants.
Under the “Documents” menu, downloadable files are available to assist in using the system and to facilitate knowledge transfer. For example, the instructions for filling in the form, the system input data requirements, and explanations of concepts are downloadable. In separate documents, the effective emission reduction techniques for nutrition, housing, storage, and application are summarized, depending on the size of farm (household/small-scale farm or medium/large farm), so different techniques can be realistically recommended under Hungarian conditions. In order to provide as much information as possible, a booklet was also published and can be downloaded here, which clearly summarises the background of the model development, explains the ammonia emission as an environmental problem, describes the influencing parameters considered in AGEM-S, details the on-farm assessment, describes the key factors for reducing ammonia emissions in pig farms, and includes a glossary of terms.
As anonymity was an important consideration throughout the development of the system, the data recorded by farmers can only be used for research purposes with their consent. When giving consent, the farmer also declares that the data represent real farm conditions. This is necessary because there is a farm replicator function, which allows a farmer to create several versions of the same farm in order to analyze the impact of different emission reduction technologies and helps the farmer choose the best option for future development of the farm. These test versions do not represent real farm conditions and thus should not be given consent for use by researchers. Only by selecting a checkbox in the graphical interface is the recorded data made available to researchers for further analysis.

3.3. Using AGEM-S Decision Support and Knowledge Transfer Functionality in Practice

Whether or not a decision support tool will ultimately deliver the intended significant decision support functionality is largely influenced by the development process, during which developers need to determine the methodology to be used. In general, the main objective is user-friendliness, and therefore the model developed is simplified.
The Bellagio STAMP (Sustainability Assessment and Measurement Principles) [66], developed in 1997 by leading experts and revised and modified in 2009 with broad stakeholder participation, is a suitable tool for developing a decision support tool that is highly functional in all aspects, based on the principles [67]. The eight principles of the new Bellagio STAMP include (1) Guiding vision; (2) Essential considerations; (3) Adequate scope; (4) Framework and indicators; (5) Transparency; (6) Effective communications; (7) Broad participation; and (8) Continuity and capacity [66]. Bellagio STAMP is also suitable for evaluating decision support tools [67].
On the basis of Bellagio STAMP, AGEM-S can be described as follows:
(1)
Guiding vision: ensuring needs within the capacity of the biosphere to sustain the potential of future generations. The principle is indirect, as it focuses on the possibilities of reducing ammonia emissions from pig farming, with reference to legal (NEC Directive) [9] requirements.
(2)
Consideration of the underlying social, economic and environmental system; the multiple dimensions of sustainability; current trends; and drivers of change, risks, uncertainties, and implications for decision making. The planning process was preceded by a preliminary study of the pig sector and analysis of trends in the European context, but an assessment of uncertainties and possible implications for decision making was not carried out.
(3)
Appropriate time horizon and geographical scope: the factors used for the estimation are only partly country specific (nutrition), while the typical technologies take into account local specificities. The time scale of the model is one year, and improvements can be tracked using the copy/modify function.
(4)
Framework and indicators: AGEM-S is a well-defined framework, in terms of the input data, the emissions and correction factors used for the calculation, the influencing factors included in the calculation, and the assessment methodology.
(5)
Transparency: full transparency of the development is partially achieved. A detailed report documenting the design of the system has been submitted to the supporting Ministry of Agriculture, but no peer-reviewed publications have been published to date. The operation of the system is also documented in detail for the users.
(6)
Effective communication: AGEM-S satisfies this principle. It uses easy-to-understand language to communicate the results and presents them in a comprehensive, graphical way, thus enabling users to better understand the processes affecting farm-level ammonia emissions and the effects of their changes.
(7)
Extensive participation in the development: during the development of AGEM-S, the experts for each module were selected from the respective disciplines. The IT tasks were carried out by IT specialists and the Hungarian Pig Breeding Association (MSTSZ) ensured effective communication between farmers and developers through its field representatives and were involved in the preliminary surveys, the definition of the input data set, and the testing of the system.
(8)
Continuity and capacity: AGEM-S is capable of producing re-estimates on an annual basis. The estimation system can be used to track the annual variation in farm ammonia emissions. The potential for improving the system through the incorporation of new scientific results (factors, techniques) is a targeted and obvious goal.
AGEM-S is designed to be functional not only to assist farmers but also to support regional and national decision-making processes.
In the course of its work, the environmental authority is able to objectively compare farm-level emission reduction options and select the most reasonable way of achieving the expected emission reductions. At the same time, it can also identify the emission reductions that can be achieved across the entire area of its jurisdiction.
AGEM-S supports the work of policy institutions at the national level through its underlying technology database, which can be used in the preparation of calls for proposals, the development of emission reduction scenarios at the national level, and the implementation of cost-effectiveness analyses.

4. Discussion

As a result of our work, a freely usable, scientifically and practically based, integrated technology assessment tool with an N-management approach was developed in Hungarian. The results of the model, based on real data, can be used to evaluate ammonia emission reduction measures at the farm level and, in addition, can be used to promote the adoption of emission abatement technologies and practices at the farm level through the information provided in supporting documents. AGEM-S can thus be used as a knowledge transfer tool and as a decision support tool for technological changes.
Dissemination has been emphasized as the most important factor influencing the publicity of the development. As part of this, the theoretical and the practical operation of the system were presented at events for pig farmers and trainers of future agricultural specialists, with the support of the Hungarian Pig Breeding Association. In addition, the AGEM-S also appeared in agricultural magazines and on agricultural TV programs.
The users of the developed model are almost exclusively from large-scale pig farms subject to Hungarian laws. The BAT conclusions [68] also set limit values for N excreted and ammonia emission levels from livestock buildings, and the pig farms had to demonstrate that their emissions were below the limit values. Since more than 70% of the Hungarian swine stock is kept on intensive rearing farms [69], this affected a significant number of pig farmers. Although AGEM-S was not designed to meet the needs of the BAT conclusions, there was a high level of interest from those who are involved in the environmental licensing of pig farms. However, medium and small/household farms still do not use the system.
This lack of interest may be due to the low level of environmental awareness of farmers, mainly due to their financial success orientation and administrative burden. Csótó’s [70] survey of Hungarian smallholders, which found that farmers can be divided into three types in terms of information technology use: “information accumulators”, “analytically-minded”, and “isolated”, may also provide some explanation. The integration of new agricultural innovations into their farm management is only typical of the second group, which is mostly made up of farmers with higher education. Similar experiences of implementing measures to reduce ammonia emissions and raise farmers’ interest were reported in Poland [71].
Currently, while maintaining the weight and output volume of the livestock sector, the solution to reduce the environmental impact of animal production is to use science-based, practice-oriented emission abatement techniques/technologies that shift production processes towards sustainability. Each emission reduction measure introduced has some significance in terms of its contribution to local, national, and global load reduction. This is highlighted by AGEM-S through pig farming processes.
Triste et al. [72] classified the factors that contribute to the adoption of a tool into three categories: institutional embeddedness, sense of ownership, and tool functions. Institutional embeddedness and tool functions are well defined for our research/development. Although we kept the interests of pig farmers in mind during the development process, with the active involvement of MSTSZ, and we learned from each other and provided coaching on appropriate tool use, a sense of ownership was clearly not achieved. Furthermore, more attention should have been paid to the specificity of large-scale pig farms as stakeholders; their air pollution data, such as ammonia emissions, are not provided by the owners themselves or by the agronomists employed on the farm, but by contracted companies with an environmental profile to carry out these farm surveys on their behalf. As environmental considerations are therefore partly outsourced from the farm, this undermines a better understanding of the issue and the effectiveness of the decision support function.
In order to reach farmers with this knowledge transfer and decision support tool, it is important to have the support of the system decision makers to ensure the accelerated availability of efficient, profitable emission reduction technologies to meet global targets.
Overall, in Hungary, the use of farm-level environmental/sustainability tools is spreading under a kind of official pressure, with very little voluntary interest. Consequently, it can be stated that there is still much to do to improve the awareness of farmers in the field of sustainable agriculture.

Author Contributions

Conceptualization, M.M., Z.B. and B.P.; methodology, M.M., Z.B., J.K.S., V.T. and B.P.; software, M.M., B.P., J.K.S., N.H.B., R.R., A.S. and Z.B.; validation, M.M., B.P., K.D., T.V., G.B. and Z.B.; investigation, M.M., B.P. and B.Z.; writing—original draft preparation, M.M., B.P., J.K.S., N.H.B., K.D., T.V., R.R., G.B., A.S. and Z.B.; writing—review and editing, M.M., Z.B., J.K.S. and Z.B.; visualization, M.M., Z.B. and B.P.; supervision, M.M.; project administration. M.M.; funding acquisition, M.M. and Z.B. All authors have read and agreed to the published version of the manuscript.

Funding

The work was supported by the Hungarian Ministry of Agriculture (MgF-751/2017 and MgF-245-1/2018).

Institutional Review Board Statement

Not applicable.

Informed Consent Statement

Not applicable.

Data Availability Statement

Not applicable.

Conflicts of Interest

The authors declare no conflict of interest. The funders had no role in the design of the study; in the collection, analyses, or interpretation of data; in the writing of the manuscript, or in the decision to publish the results.

References

  1. Bittman, S.; Dedina, M.; Howard, C.M.; Oenema, O.; Sutton, M.A. (Eds.) Options for Ammonia Mitigation: Guidance from the UNECE Task Force on Reactive Nitrogen; Centre for Ecology and Hydrology: Edinburgh, UK, 2014; Available online: http://www.clrtap-tfrn.org/ (accessed on 15 April 2021).
  2. Krupa, S. Effects of atmospheric ammonia (NH3) on terrestrial vegetation: A review. Environ. Pollut. 2003, 124, 179–221. [Google Scholar] [CrossRef]
  3. Sutton, M.; Howard, C.; Erisman, J.W. The European Nitrogen Assessment: Sources, Effects and Policy Perspectives; Cambridge University Press: Cambridge, UK, 2011. [Google Scholar] [CrossRef]
  4. Wu, Y.; Gu, B.; Erisman, J.W.; Reis, S.; Fang, Y.; Lu, X.; Zhang, X. PM2.5 pollution is substantially affected by ammonia emissions in China. Environ. Pollut. 2016, 218, 86–94. [Google Scholar] [CrossRef] [Green Version]
  5. Giannakis, E.; Kushta, J.; Bruggeman, A.; Lelieveld, J. Costs and benefits of agricultural ammonia emission abatement options for compliance with European air quality regulations. Environ. Sci. Eur. 2019, 31, 93. [Google Scholar] [CrossRef] [Green Version]
  6. World Health Organization (WHO). Health Effects of Particulate Matter. Policy Implications for Countries in Eastern Europe, Caucasus and Central Asia, World Health Organization. 2013. Available online: http://www.euro.who.int/__data/assets/pdf_file/0006/189051/Health-effects-of-particulate-matter-final-Eng.pdf (accessed on 14 April 2021).
  7. Schraufnagel, D.; Balmes, J.; De Matteis, S.; Hoffman, B.; Kim, W.J.; Perez-Padilla, R.; Rice, M.; Sood, A.; Vanker, A.; Wuebbles, D. Health Benefits of Air Pollution Reduction. Ann. Am. Thorac. Soc. 2019, 16, 1478–1487. [Google Scholar] [CrossRef]
  8. IIR. Hungary Informative Inventory Report 1990–2019. 2021. Available online: https://www.ceip.at/status-of-reporting-and-review-results/2021-submission (accessed on 15 May 2021).
  9. EP (2016). Directive (EU) 2016/2284 of the European Parliament and of the Council of 14 December 2016 on the Reduction of National Emissions of Certain Atmospheric Pollutants, Amending Directive 2003/35/EC and Repealing Directive 2001/81/EC. Brussels: European Council. Off. J. Eur. Union 2016, 344, 1–34. Available online: http://data.europa.eu/eli/dir/2016/2284/oj (accessed on 16 April 2021).
  10. Murphy, P.; Crosson, P.; O’Brien, D.; Schulte, R.P.O. The Carbon Navigator: A decision support tool to reduce greenhouse gas emissions from livestock production systems. Animal 2013, 7, 427–436. [Google Scholar] [CrossRef] [PubMed] [Green Version]
  11. NAK 2018: Nemzeti Agrárgazdasági Kamara: Erősödő agrár- és Élelmiszergazdaság, Jólétében Gyarapodó Vidék. 2018. Available online: https://www.nak.hu/kiadvanyok/kiadvanyok/2301-erosodo-agrar-es-elelmiszer-gazdasag-joleteben-gyarapodo-videk/file (accessed on 15 May 2021).
  12. EMEP/EEA Air Pollutant Emission Inventory Guidebook: Technical Guidance to Prepare National Emission Inventories; European Environment Agency: Copenhagen, Denmark, 2019. [CrossRef]
  13. Oudendag, D.A.; Luesink, H.H. The Manure Model: Manure, minerals (N, P and K), ammonia emission, heavy metals and the use of fertiliser in Dutch agriculture. Environ. Pollut. 1998, 102, 241–246. [Google Scholar] [CrossRef]
  14. Menzi, H.; Ruttimann, L.; Reidy, B. DYNAMO: A new calculation model for dynamic emission inventories for ammonia. In International Symposium on Gaseous and Odour Emission from Animal Production Facilities; Horsens, Denmark; pp. 378–381.
  15. Webb, J.; Misselbrook, T.H. A mass-flow model of ammonia emissions from UK livestock production. Atmos. Environ. 2004, 38, 2163–2175. [Google Scholar] [CrossRef]
  16. Webb, J.; Sommer, S.G.; Kupper, T.; Groenestein, K.; Hutchings, N.J.; Eurich-Menden, B.; Rodhe, L.; Misselbrook, T.H.; Amon, B. Gaseous emissions during the management of solid manures. Sustain. Agric. Rev. 2012, 8, 67–107. [Google Scholar]
  17. Zhang, Y.; Collins, A.L.; Gooday, R.D. Application of the FARMSCOPER tool for assessing agricultural diffuse pollution mitigation methods across the Hampshire Avon Demonstration Test Catchment, UK. Environ. Sci. 2012, 24, 120–131. [Google Scholar] [CrossRef]
  18. Velthof, G.L.; van Bruggen, C.; Groenestein, C.M.; de Haan, B.J.; Hoogeveen, M.W.; Huijsmans, J.F.M. A model for inventory of ammonia emissions from agriculture in the Netherlands. Atmos. Environ. 2012, 46, 248–255. [Google Scholar] [CrossRef]
  19. Pinder, R.W.; Anderson, N.J.; Strader, R.; Davidson, C.I.; Adams, P.J. Ammonia Emissions from Dairy Farms: Development of a Farm Model and Estimation of Emissions from the United States. In Proceedings of the 12th International Emission Inventory Conference-”Emission Inventories-Applying New Technologies”, San Diego, CA, USA, 29 April–1 May 2003; Available online: https://www3.epa.gov/ttnchie1/conference/ei12/part/pinder.pdf (accessed on 15 April 2021).
  20. Deike, S.; Pallut, B.; Christen, O. Investigations on the energy efficiency of organic and integrated farming with specific emphasis on pesticide use intensity. Eur. J. Agron. 2008, 28, 461–470. [Google Scholar] [CrossRef]
  21. Küstermann, B.; Kainz, M.; Hülsbergen, K.J. Modelling carbon cycles and estimation of greenhouse gas emissions from organic and conventional farming systems. Renew. Agric. Food Syst. 2008, 23, 1–16. [Google Scholar] [CrossRef] [Green Version]
  22. Küstermann, B.; Christen, O.; Hülsbergen, K.J. Modelling nitrogen cycles of farming systems as basis of site- and farm-specific nitrogen management. Agric. Ecosyst. Environ. 2010, 135, 70–80. [Google Scholar] [CrossRef]
  23. Rücknagel, J.; Hofmann, B.; Paul, R.; Christen, O.; Hülsbergen, K.-J. Estimating precompression stress of structured soils on the basis of aggregate density and dry bulk density. Soil Tillage Res. 2007, 92, 213–220. [Google Scholar] [CrossRef]
  24. Neufeldt, H.; Schäfer, M. Mitigation strategies for greenhouse gas emissions from agriculture using a regional economic-ecosystem model. Ecosyst. Environ. 2008, 123, 305–316. [Google Scholar] [CrossRef]
  25. Reidy, B.; Dammgen, U.; Dohler, H.; Eurich-Menden, B.; van Evert, F.K.; Hutchings, N.J.; Luesink, H.H.; Menzi, H.; Misselbrook, T.H.; Monteny, G.-J.; et al. Comparison of models used for national agricultural ammonia emission inventories in Europe: Liquid manure systems. Atmos. Environ. 2008, 42, 3452–3464. [Google Scholar] [CrossRef]
  26. Available online: https://www.agrammon.ch/ (accessed on 15 April 2021).
  27. Available online: https://www.ars.usda.gov/northeast-area/up-pa/pswmru/docs/dairygem-download-instructions/ (accessed on 15 April 2021).
  28. Available online: https://www.ars.usda.gov/northeast-area/up-pa/pswmru/docs/dairy-gas-emissions-model/ (accessed on 15 April 2021).
  29. Li, C.; Salas, W.; Zhang, R.; Krauter, C.; Rotz, A.; Mitloehner, F. Manure-DNDC: A biogeochemical process model for quantifying greenhouse gas and ammonia emissions from livestock manure systems . Nutr. Cycl. Agroecosyst. 2012, 93, 163–200. [Google Scholar] [CrossRef]
  30. Kupper, T.; Bonjour, C.; Zaucker, F.; Achermann, B.; Menzi, H. Agrammon: An internet based model for the estimation of ammonia emissions. In 14th RAMIRAN International Conference; Cordovil, C., Ferreira, L., Eds.; RAMIRAN: Lisboa, Portugal, 2010; pp. 334–337. Available online: http://ramiran.uvlf.sk/ramiran2010/docs/Ramiran2010_0167_final.pdf (accessed on 15 April 2021).
  31. Kupper, T. Dokumentation Technische Parameter Modell Agrammon (Stand 2018). 2018. Available online: https://agrammon.ch/assets/Documents/Dokumentation-Technische-Parameter-20180925.pdf (accessed on 15 April 2021).
  32. Schinckel, A.P.; de Lange, C.F.M. Characterization of growth parameters needed as inputs for pig growth models. J. Anim. Sci. 1996, 74, 2021–2036. [Google Scholar] [CrossRef]
  33. Aarnink, A.J.A.; Verstegen, M.W.A. Nutrition, key factor to reduce environmental load from pig production. Livest. Sci. 2007, 109, 194–203. [Google Scholar] [CrossRef]
  34. Aarnink, A.J.A.; Canh, T.T.; Mroz, Z. Reduction of ammonia volatilization by housing and feeding in fattening piggeries. In Ammonia and Odour Control from Animal Production Facilities; Voermans, J.A.M., Monteney, G.J., Eds.; NVTL: Rosmalon, NL, USA, 1997; pp. 283–2911. [Google Scholar]
  35. Van Faassen, H.G.; Van Dijk, H. Manure as a source of nitrogen and phosphorus in soils. In Animal Manure on Grassland and Fodder Crops. Fertilizer or Waste? Van Der Meer, H.G., Unwin, R.J., Van Dijk, T.A., Ennik, G.C., Eds.; Developments in Plant and Soil Sciences; Springer: Dordrecht, The Netherlands, 1987; Volume 30. [Google Scholar] [CrossRef]
  36. Hutchings, N.J.; Sørensen, P.; Cordovil, C.M.; Leip, A.; Amon, B. Measures to increase the nitrogen use efficiency of European agricultural production. Glob. Food Secur. 2020, 26, 100381. [Google Scholar] [CrossRef]
  37. Koltay, I.A.; Benedek, Z.; Hegedűsné Baranyai, N.; Kovács, Á.; Valásek, S.; Such, N.; Farkas, V.; Török, N.; Farkas, L.; Wágner, L.; et al. The Effects of Genotype and Age on the Nitrogen Excretion of Young Pigs. 18. BOKU-Symposium Animal Nutrion, Wien. 2019, pp. 202–205. Available online: https://boku.ac.at/fileadmin/data/H03000/H97000/H97600/Symptagungsbaende/Tagungsband_2019_Internet_low.pdf (accessed on 16 April 2021).
  38. Informative Inventory Report (2015): Informative Inventory Report—Hungary 1990–2013; Agriculture (NFR Sector 3); Compiled by the Hungarian Meteorological Service, Unit of National Emissions Inventories: Budapest, Hungary, 2015; pp. 121–143. Available online: ceip.at (accessed on 16 June 2016).
  39. Mroz, Z.; Jongbloed, A.W.; Partanen, K.H.; Vreman, K.; Kemme, P.A.; Jogut, J. The effects of calcium benzoate in diets with or without organic acids on dietary buffering capacity, apparent digestibility, retention of nutrients and manure characteristics in swine. J. Anim. Sci. 2011, 78, 2622–2632. [Google Scholar] [CrossRef]
  40. Canh, T.T.; Aarnink, A.J.A.; Mroz, Z.; Jongbloed, W.; Schrama, J.W.; Verstegen, M.W.A. Influence of electrolyte balance and acidifying calcium salts in the diet of growing finishing pigs on urinary pH, slurry pH, and ammonia volatilisation from slurry. Livest. Prod. Sci. 1998, 56, 1–13. [Google Scholar] [CrossRef]
  41. Seradj, A.R.; Balcells, J.; Morazan, H.; Alvarez-Rodriguez, J.; Babot, D.; de la Fuente, G. The impact of reducing dietary crude protein and increasing total dietary fiber on hindgut fermentation, the methanogen community and gas emission in growing pigs. Anim. Feed Sci. Technol. 2018, 245, 54–66. [Google Scholar] [CrossRef] [Green Version]
  42. Aarnink, A.J.A.; Hoeksma, P.; van Ouwerkerk, E.N.J. Factors affecting ammonium concentration in slurry from fattening pigs. In Nitrogen flow in Pig Production and Environmental Consequences; Verstegen, M.W.A., den Hartog, L.A., van Kempen, G.J.M., Metz, J.H.M., Eds.; EAAP-Publication: Roma, Italy, 1993; Volume 69, pp. 413–420. [Google Scholar]
  43. Sutton, A.L.; Kephart, K.B.; Verstegen, M.W.A.; Canh, T.T.; Hobbs, P.J. Potential for reduction of odorous compounds in swine manure through diet modification. J. Anim. Sci. 1998, 77, 430–439. [Google Scholar] [CrossRef]
  44. Santonja, G.G.; Goergitzikis, K.; Scalet, B.M.; Montobbio, P.; Roudier, S.; Sancho, L.D. Best Available Techniques (BAT) Reference Document for the Intensive Rearing of Poultry or Pigs; JRC Science for Policy Report; EUR 28674 EN; Publications Office of the European Union: Luxembourg, 2017. [Google Scholar] [CrossRef]
  45. Muck, R.E.; Steenhuis, T.S. Nitrogen losses in free stall dairy barns. In Livestock Waste: A Renewable Resource; American Society of Agricultural Engineers: Amerillo, TX, USA, 1981; pp. 406–409. [Google Scholar]
  46. Aarnink, A.J.A. Ammonia Emission from Houses for Growing Pigs as Affected by Pen Design, Indoor Climate and Behaviour. Ph.D. Thesis, Wageningen University, Wageningen, NL, USA, 1997; p. 175. Available online: https://research.wur.nl/en/publications/ammonia-emission-from-houses-for-growing-pigs-as-affected-by-pen- (accessed on 16 April 2021).
  47. Elzing, A.; Monteny, G.J. Modeling and experimental determination of ammonia emissions rates from a scale model dairy-cow house. Trans. Am. Soc. Agric. Eng. 1997, 40, 721–726. [Google Scholar] [CrossRef]
  48. Monteny, G.J. Modelling of Ammonia Emissions from Dairy Cow Houses. Ph.D. Thesis, Wageningen University, Wageningen, NL, USA, 2000; p. 156. Available online: https://library.wur.nl/WebQuery/wurpubs/65624 (accessed on 16 April 2021).
  49. Groenestein, C.M.; Hendriks, M.M.W.B.; den Hartog, L.A. Effect of feeding schedule on ammonia emission from individual and group-housing systems for sows. Biosyst. Eng. 2003, 85, 79–85. [Google Scholar] [CrossRef]
  50. Harper, L.A. Ammonia: Measurement Issues Micrometeorology in Agricultural Systems (2005) Agronomy Monograph no. 47: 345–379. Available online: https://digitalcommons.unl.edu/usdaarsfacpub/1339 (accessed on 15 April 2021).
  51. Ni, J.Q.; Vinckier, C.; Coenegrachts, J.; Hendriks, J. Effect of manure on ammonia emission from a fattening pig house with partly slatted floor. Livest. Prod. Sci. 1999, 59, 25–31. [Google Scholar] [CrossRef]
  52. Kai, P.; Kaspers, B.; van Kempen, T. Modeling Sources of Gaseous Emissions in a Pig House with Recharge Pit. Trans. ASABE 2006, 49, 1479–1485. [Google Scholar] [CrossRef]
  53. Feilberg, A.; Sommer, S.G. Ammonia and Malodorous Gases: Sources and Abatement Technologies. In Animal Manure Recycling: Treatment and Management; Sommer, S.G., Christensen, M.L., Schmidt, T., Jensen, L.S., Eds.; John Wiley and Sons Ltd.: Chichester, UK, 2013; pp. 153–173. [Google Scholar]
  54. Philippe, F.X.; Cabaraux, J.F.; Baudouin, N. Ammonia emissions from pig houses:Influencing factors and mitigation techniques. Agric. Ecosyst. Environ. 2011, 141, 245–260. [Google Scholar] [CrossRef]
  55. Aarnink, A.J.A.; Elzing, A. Dynamic model for ammonia volatilization in housing with partially slatted floors, for fattening pigs. Livest. Prod. Sci. 1998, 53, 153–169. [Google Scholar] [CrossRef]
  56. Webb, J.; Sommer, S.G.; Kupper, T.; Groenestein, K.; Hutchings, N.J.; Eurich-Menden, B.; Rodhe, L.; Misselbrook, T.H.; Amon, B. Emissions of Ammonia, Nitrous Oxide and Methane During the Management of Solid Manures. Agroecol. Strateg. Clim. Chang. 2012, 67–107. [Google Scholar] [CrossRef]
  57. Cabaraux, J.F.; Philippe, F.X.; Laitat, M.; Canart, B.; Vandenheede, M.; Nicks, B. Gaseous emissions from weaned pigs raised on different floor systems. Agric. Ecosyst. Environ. 2009, 130, 86–92. [Google Scholar] [CrossRef]
  58. Philippe, F.X.; Laitat, M.; Canart, B.; Vandenheede, M.; Nicks, B. Comparison of ammonia and greenhouse gas emissions during the fattening of pigs, kept either on fully slatted floor or on deep litter. Livest. Sci. 2007, 111, 144–152. [Google Scholar] [CrossRef]
  59. Chadwick, D.R. Emissions of ammonia, nitrous oxide and methane from cattle manure heaps: Effect of compaction and covering. Atmos. Environ. 2005, 39, 787–799. [Google Scholar] [CrossRef]
  60. Hansen, M.N.; Henriksen, K.; Sommer, S.G. Observations of production and emission of greenhouse gases and ammonia during storage of solids separated from pig slurry: Effects of covering. Atmos. Environ. 2006, 40, 4172–4181. [Google Scholar] [CrossRef] [Green Version]
  61. Amon, B.; Kryvoruchko, V.; Amon, T.; Zechmeister-Boltenstern, S. Methane, nitrous oxide and ammonia emissions during storage and after application of dairy cattle slurry and influence of slurry treatment. Agric. Ecosyst. Environ. 2006, 153–162. [Google Scholar] [CrossRef]
  62. Misselbrook, T.; Hunt, J.; Perazzolo, F.; Provolo, G. Greenhouse Gas and Ammonia Emissions from Slurry Storage: Impacts of Temperature and Potential Mitigation through Covering (Pig Slurry) or Acidification (Cattle Slurry). J. Environ. Qual. 2016, 45, 1520–1530. [Google Scholar] [CrossRef]
  63. Berg, W.; Brunsch, R.; Pazsiczki, I. Greenhouse gas emissions from covered slurry compared with uncovered during storage. Agric. Ecosyst. Environ. 2006, 112, 129–134. [Google Scholar] [CrossRef]
  64. Sommer, S.G.; Hutchings, N.J. Ammonia emission from field applied manure and its reduction-invited paper. Eur. J. Agron. 2001, 15, 1–15. [Google Scholar] [CrossRef]
  65. Sommer, S.G.; Schjoerring, J.K.; Denmead, O.T. Ammonia emission from mineral fertilizers and fertilized crops. Adv. Agron. 2004, 557–622. [Google Scholar] [CrossRef]
  66. Pintér, L.; Hardi, P.; Martinuzzi, A.; Hall, J. Bellagio STAMP: Principles for sustainability assessment and measurement. Ecol. Indicat. 2012, 17, 20–28. [Google Scholar] [CrossRef]
  67. Arulnathan, V.; Heidari, M.D.; Doyon, M.; Li, E.; Pelletier, N. Farm-level decision support tools: A review of methodological choices and their consistency with principles of sustainability assessment. J. Clean. Prod. 2020, 256, 120410. [Google Scholar] [CrossRef]
  68. EU 2017/302 Best Available Techniques (BAT) Conclusions, under Directive 2010/75/EU of the European Parliament and of the Council, for the Intensive Rearing of Poultry or Pigs. Available online: https://eur-lex.europa.eu/legal-content/EN/TXT/?uri=uriserv%3AOJ.L_.2017.043.01.0231.01.ENG (accessed on 14 April 2021).
  69. BAT 2020. Útmutató az Elérhető Legjobb Technika Meghatározásához az Intenzív Sertéstartási Tevékenység Engedélyeztetése Során (Guideline for Determining the Best Available Techniques in the Process of Authorisation of Intensive Rearing of Pigs); Hermann Ottó Intézet: Budapest, Hungary, 2020; p. 212. Available online: http://www.hermanottointezet.hu/docs/BAT_utmutato_az_intenziv_sertestenyeszteshez_2020.pdf (accessed on 15 April 2020).
  70. Csótó, M. Analysis of smallholder farmers’s ICT-adoption and use through their personal information space. J. Agric. Inform. 2017, 8, 1–12. [Google Scholar] [CrossRef]
  71. Piwowar, A. Farming Practices for Reducing Ammonia Emissions in Polish Agriculture. Atmosphere 2020, 11, 1353. [Google Scholar] [CrossRef]
  72. Triste, L.; Marchand, F.; Debruyne, L.; Meul, M.; Lauwers, L. Reflection on the development process of a sustainability assessment tool: Learning from a Flemish case. Ecol. Soc. 2014, 19, 47. [Google Scholar] [CrossRef] [Green Version]
Figure 1. General structure of AGEM-S.
Applsci 11 05970 g001
Figure 2. Ammonia emission and N flow on the farm in the AGEM-S (example).
Applsci 11 05970 g002
Figure 3. Evaluation of housing techniques in AGEM-S (example).
Applsci 11 05970 g003
Table 1. Input data for livestock.
Livestock DataComments
Average number of sowsYearly average
Total number of farrowing per year
Culling rate of sows (%)Culling and death of breeding sows
Litter size at farrowing (piglets)Average number of live born piglets in one litter
Lactation length (days)Time of weaning in days
Mortality rate in nursery (%)Mortality from farrowing to weaning
Average weight at weaning (kg/piglet)Starting weight of growing if there is no farrowing and weaning on the farm.
Starting number of weaners (pigs/year)Should be zero if there is farrowing and weaning at the farm. The date should be other than zero if there is no farrowing and weaning at the farm.
Length of growing (days)
Mortality rate during growing (%)
Average final weight at growing (kg/pig)If there is no growing phase at the farm, but fatteners are purchased, the average starting weight of fatteners should be given.
Total number of sold growers (pigs/year)
Starting number of fatteners (pigs)The date should be zero if own pigs are fattened. The date should be other than zero if there is no growing phase at the farm.
Length of fattening (days)
Mortality rate during fattening (%)
Average slaughter weight of pigs (kg/pig)
Total number of sold slaughters (pigs/year)
Average number of gilts from own stock (gilts/year)
Average number of purchased gilts (pigs/year)
Starting age of gilt rearing (days)
Age of gilts at first mating (days)
Average number of breeding boars (pigs/year)
Table 2. Input data of the nutrition module.
Dry matter content of the diet (%)
Number of dietary phases in the fattening period (1–4)
Crude protein content of the diets (%)
Daily feed intake (g)
Crystalline amino acid supplements
Lysineyes/not
Methionineyes/not
Threonineyes/not
Tryptophanyes/not
Benzoic acid supplementation of the diets yes/not
Table 3. The input data requirements of housing modules.
Name of the stable
Place for pigs in stable
Function of the stablenursery
mating and gestating unit
weaner unit
grower/finisher unit
replacing gilt unit
Days in free range (optional)
Housing techniquestypical housing techniques in Hungary: outdoor;
litter-based housing: daily manure removal or deep litter;
slurry-based housing: fully or partly slatted floor, concrete floor with manure channel
Mitigation techniques
The most effective emission reduction technology used in the stable
frequent manure removal with vacuum, flushing gutters, cooling manure surface, feeding stalls and manure pit with slanted walls, floating balls on manure surface, water and manure channels, manure pan underneath, partially slatted floor with reduced pit, partially slatted floors and flushing gutters, partially slatted floor and collection in acidified liquid, partially slatted floor and cooling manure surface, partially slatted floor and manure channel with slanted walls, air scrubbing techniques (according to Bittman et al. [1])
Table 4. The input data requirements of manure storage.
Amount of manure produced (tons/year)
Amount of manure sold (tons/year)
Amount of manure stored in covered storage (tons/year)
Amount of manure stored in uncovered storage (tons/year)
Table 5. The input data requirements of liquid manure storage.
Amount of liquid manure produced (m3/year)
Amount of liquid manure sold (m3/year)
Amount of liquid manure stored in covered storage (m3/year)OptionsInput data
storage bag, tight roof, tent structure, floating covers, low technology floating covers, natural crust, tall open tanks surface (m2)
Amount of liquid manure stored in uncovered storage (m3/year)store with no cover or crustsurface (m2)
Table 6. The input data requirements of manure application technology.
Techniques of liquid manure application (distribution %)Spreading
Trailing hose
Trailing shoe
Shallow injection
Deep injection
Time of incorporation after slurry/manure application (distribution %)Incorporation within 1 h by ploughing
Incorporation within 1 h by non-inversion cultivation
Within 4 h
Within 24 h
Within 72 h
Over 72 h
No incorporation
Seasonal distribution of slurry/manure application (%)Application in summer time
(April to September)
Application in winter time
(October, February, March)
Publisher’s Note: MDPI stays neutral with regard to jurisdictional claims in published maps and institutional affiliations.

