Article

Computational Simulation of 3D Fatigue Crack Growth under Mixed-Mode Loading

by
Abdulnaser M. Alshoaibi
Mechanical Engineering Department, Jazan University, P.O. Box 114, Jazan 45142, Saudi Arabia
Appl. Sci. 2021, 11(13), 5953; https://doi.org/10.3390/app11135953
Submission received: 24 May 2021 / Revised: 17 June 2021 / Accepted: 23 June 2021 / Published: 26 June 2021

Abstract

:
The purpose of this research was to present a simulation modelling of a crack propagation trajectory in linear elastic material subjected to mixed-mode loadings and investigate the effects of the existence of a hole and geometrical thickness on fatigue crack growth and fatigue life under constant amplitude loading. For various geometry thickness, mixed-mode (I/II) fatigue crack growth studies were carried out to utilize a single edge cracked plate with three holes and compact tension shear specimens with various loading angles. Smart Crack Growth Technology, a new feature in ANSYS, was used in ANSYS Mechanical APDL 19.2 to predict the cracks’ propagation trajectory and their consequent fatigue life associated with evaluating the stress intensity factors. The maximum circumferential stress criterion is implemented as a direction criterion under linear elastic fracture mechanics (LEFM). According to the hole position, the results demonstrate that the fatigue crack grows towards the hole due to the unbalanced stresses on the hole induced crack tip. The results of this simulation are verified in terms of crack growth paths, stress intensity factors, and fatigue life under mixed-mode load conditions, with several crack growth studies published in the literature showing consistent results.

1. Introduction

Most structures are subjected to cyclic loading, tension, and shear loads, known as mixed-mode fatigue loading. Fatigue failure is the most common type of failure in such configurations, caused by cracks and other defects in the components. The primary objective of fracture mechanics is to evaluate whether or not a structure will fail based on the presence of a crack. Crack growth is crucial in engineering structures, because it significantly impacts the quality and stability of engineering structures. Thus, the safety or reliability of engineering structures is vital to predicting the crack propagation path. As a result, in many industries, the accurate estimation of the crack path and fatigue life is essential in terms of reliability. Fracture mechanics is an essential tool in current materials science for enhancing the mechanical performance of mechanical components. A significant parameter for estimating a cracked structure’s lifetime is the stress intensity factor (SIFs). The stress intensity factor is defined physically as the intensity of load transmitted through the crack tip area due to introducing a crack into the component [1].
The SIFs evaluate the severity of the stress induced by remote loading around the crack tip. The associated instantaneous value of SIFs would follow the changes in crack geometry and stresses during crack growth. The stress intensity factor has a complicated function of the load, boundary conditions, crack propagation, geometry, and material characteristics. The fatigue crack propagation is evaluated using the equivalent stress intensity factor in Paris’ law. Experimental investigations are essential for fatigue assessment in several applications, such as the aerospace industry and the aviation industries. However, accurate calculation methods are needed to analyze crack propagation to prevent crack propagation and fatigue life in both static and dynamic loading [2]. The failure was caused by (a) faults such as interfaces and cracks and (b) the nature of fluctuating loads. When exposed to variable loads, cracks tend to initiate and grow until the structure no longer bears the load, leading to catastrophic failure. These cracks are characterized as fatigue cracks, and the predicted life is one of the most critical factors in determining the structure’s reliability. It can be calculated by adding the required number of loading cycles to nucleate the fatigue crack and cause the failure. The crack propagation rate is generally determined using the relationship between SIFs and the crack geometry. Crack initiation and propagation are always associated with SIFs in a complicated state in general [3,4,5,6]. In recent studies, the extended finite element technique (XFEM) introduced by [7] has frequently been adopted to study the fracture due to crack growth. Based on a standard finite element framework, it uses a unique displacement feature to allow for discontinuities, eliminating the need to re-mesh continuously during the crack tip growth process.
XFEM was utilized to perform crack growth analysis without updating the mesh to evaluate SIFs [8,9,10]. Nowadays, numerous codes could be used to model cracks propagating through structures, e.g., FEM [11] and BEM [11,12], both in mixed-mode [13,14,15,16] or in-plane [17]. In addition, the methods used for calculating K values, kink angles, and crack-growth rates can be numerous [6,7,8]. Significant work was done to establish appropriate models for evaluating the fatigue crack growth (FCG) and fatigue life to avoid fatigue failures. Numerous experimental methods were proposed; nevertheless, the methods are frequently time-consuming and expensive to perform. Using a simulation strategy that involves numerical analysis and the ANSYS APDL.19.2 finite element approach to decrease laboratory effort, time, and expenses is a great way to save time and money. Meanwhile, there are several of modern finite element simulation tools for fatigue crack propagation problems, including ANSYS, ABAQUS, FRANC3D, etc. Many fatigue crack problems identified to date by the literature use different computational approaches in simulation for simple and complex structures in 2D and 3D [2,18,19,20,21,22,23,24]. An energy-based criterion was developed by [25] using additively manufactured materials to analyze the effects of material anisotropy on the behavior of fatigue creak growth. The criteria are established based on the concept of strain energy density in the anisotropic domain by including T-stress into the solution and considering the effects of the specimen geometry. Therefore, this work uses the ANSYS APDL 19.2 to predict the mixed-mode SIFs accurately and the associated fatigue life for the single edge cracked plate and compact tension shear specimens. In particular, three methods have been widely used to illustrate the fatigue analysis of materials: the method of fracture mechanics developed by Paris and Erdogan [26], the method of strain-life independently proposed by Coffin [27], and the method of stress-life proposed by Wöhler [28]. The first approach was employed in this study for predicting fatigue life, whereby the crack tip could be described separately by the stress intensity factors. The primary motivation for this study was to make a significant contribution to the use of ANSYS as an efficient tool for modelling FCG under the condition of mixed-mode loading and monitoring the influence of the holes on the crack growth trajectory.

2. Mixed Mode Fatigue Life Evaluation Procedure Using ANSYS

ANSYS can model three kinds of cracks: arbitrary, semi-elliptical, and pre-meshed. The smart crack growth analysis tool uses the crack front in the pre-meshed crack approach, and the stress intensity factor is the failure criteria. The rendered nodes will distribute to the front, bottom, and top of the crack, and the front of the crack is included in the pre-meshed crack process, which is used by the “Smart Crack Growth” simulation tool. This is used instead of employing the XFEM’s enrichment area (splitting), which eliminates the re-mesh process around the crack tip and assumes that the discontinuities cut the element entirely. In this case, the displacement formulation does not account for the presence of singularity. As the crack propagates, the newly introduced crack segments are always assumed to have cohesive zone behavior. SMART automatically updates the mesh from crack geometry changes due to crack propagation on each solution stage, reducing the need for long pre-processing sessions. The sphere of influence was used to refined the crack tip mesh and around the geometric edge that passes through the thickness. The geometric regions ‘contain the crack tip, the crack’s top surface, and the bottom surface of the crack. However, each of these regions is connected to a set of nodes that will be utilized for analysis. In order to analyze a mixed-mode fracture, it is essential to have a proper understanding of the crack growth direction. The direction of crack extension is defined by an angle θ measured from the initial crack plane [29,30,31]. The direction of a mixed-mode crack is definitely determined by the ratio of modes stress intensity at the crack tip. The ANSYS software considers mixed-mode loading where the maximum circumferential stress criterion is implemented. The following are the formulas for the direction of crack propagation in ANSYS [32,33]:
θ = cos 1 ( 3 K I I 2 + K I K I 2 + 8 K I I 2 K I 2 + 9 K I I 2 )
where:
KI = Max KI during cyclic loading and KII = Max KII during cyclic loading.
In the present simulation using ANSYS, the simulation of crack propagation is restricted to region II of the typical crack propagation under fatigue loading that can be represented as:
d a d N = C ( Δ K e q ) m
From Equation (2), for a crack increment, the number of life cycles of fatigue may be predicted as:
0 Δ a d a C ( Δ K e q ) m = 0 Δ N d N = Δ N
The equivalent range for the stress intensity factor formula can be found as follows [19]:
Δ K e q = 1 2 cos θ 2 [ ( Δ K I ( 1 + cos θ ) ) 3 Δ K I I sin θ ]
where:
Δ K I = the range of SIF in mode I loading and Δ K I I = the range of SIF in mode II loading.
Based on numerical analysis, there are many methods formulated for estimating the SIFs. The integral interaction method is usually the most accurate method that can estimate KI and KII separately. ANSYS proposes two methods, the Displacement Extrapolation Method (DEM) and the Integral Interaction Method (IIM), to determine SIFs. The second method was adopted because it is numerically easier to implement and has better precision and less mesh requirement. This approach depends on the domain integral approach [34], where an auxiliary field uses to separate KI from KII, as this ability is missing in the domain integral itself. The energy release rate is expressed in terms of mixed-mode stress intensity factors KI, KII, and KIII, which were proposed by [34,35] as follows:
Equation (5) becomes for the superimposed state:
J ( s ) = K I 2 + K I I 2 E + 1 + ν E K I I I 2 E = [ E ( 1 ν 2 ) E Plane   strain Plane   stress
where
J S ( s ) = 1 E [ ( K I + K I a u x ) 2 + ( K I I + K I I a u x ) 2 ] + 1 + ν E ( K I I I + K I I I a u x ) 2 = J ( s ) + J a u x ( s ) + I ( s ) I ( s ) = 1 E ( 2 K I K I a u x + 2 K I I K I I a u x ) + 1 + ν E ( 2 K I I I K I I I a u x )
where superscript (S) denotes the superimposed state, J(s) is the actual state domain integral, Jaux(s) is the auxiliary state domain integral, and I(s) is integral with interacting auxiliary and actual terms.
By setting K I a u x = 1 and K I I a u x = K I I I a u x = 0 , Equation (6) yields:
K I = E 2 I ( s )
By setting K I I a u x = 1 and K I a u x = K I I I a u x = 0 , that gives the relationships between KII, KIII as follow:
K I I = E 2 I ( s )
K I I I = μ I ( s )
where E and μ are the modulus of elasticity and modulus of rigidity, respectively.

3. Numerical Results and Discussion

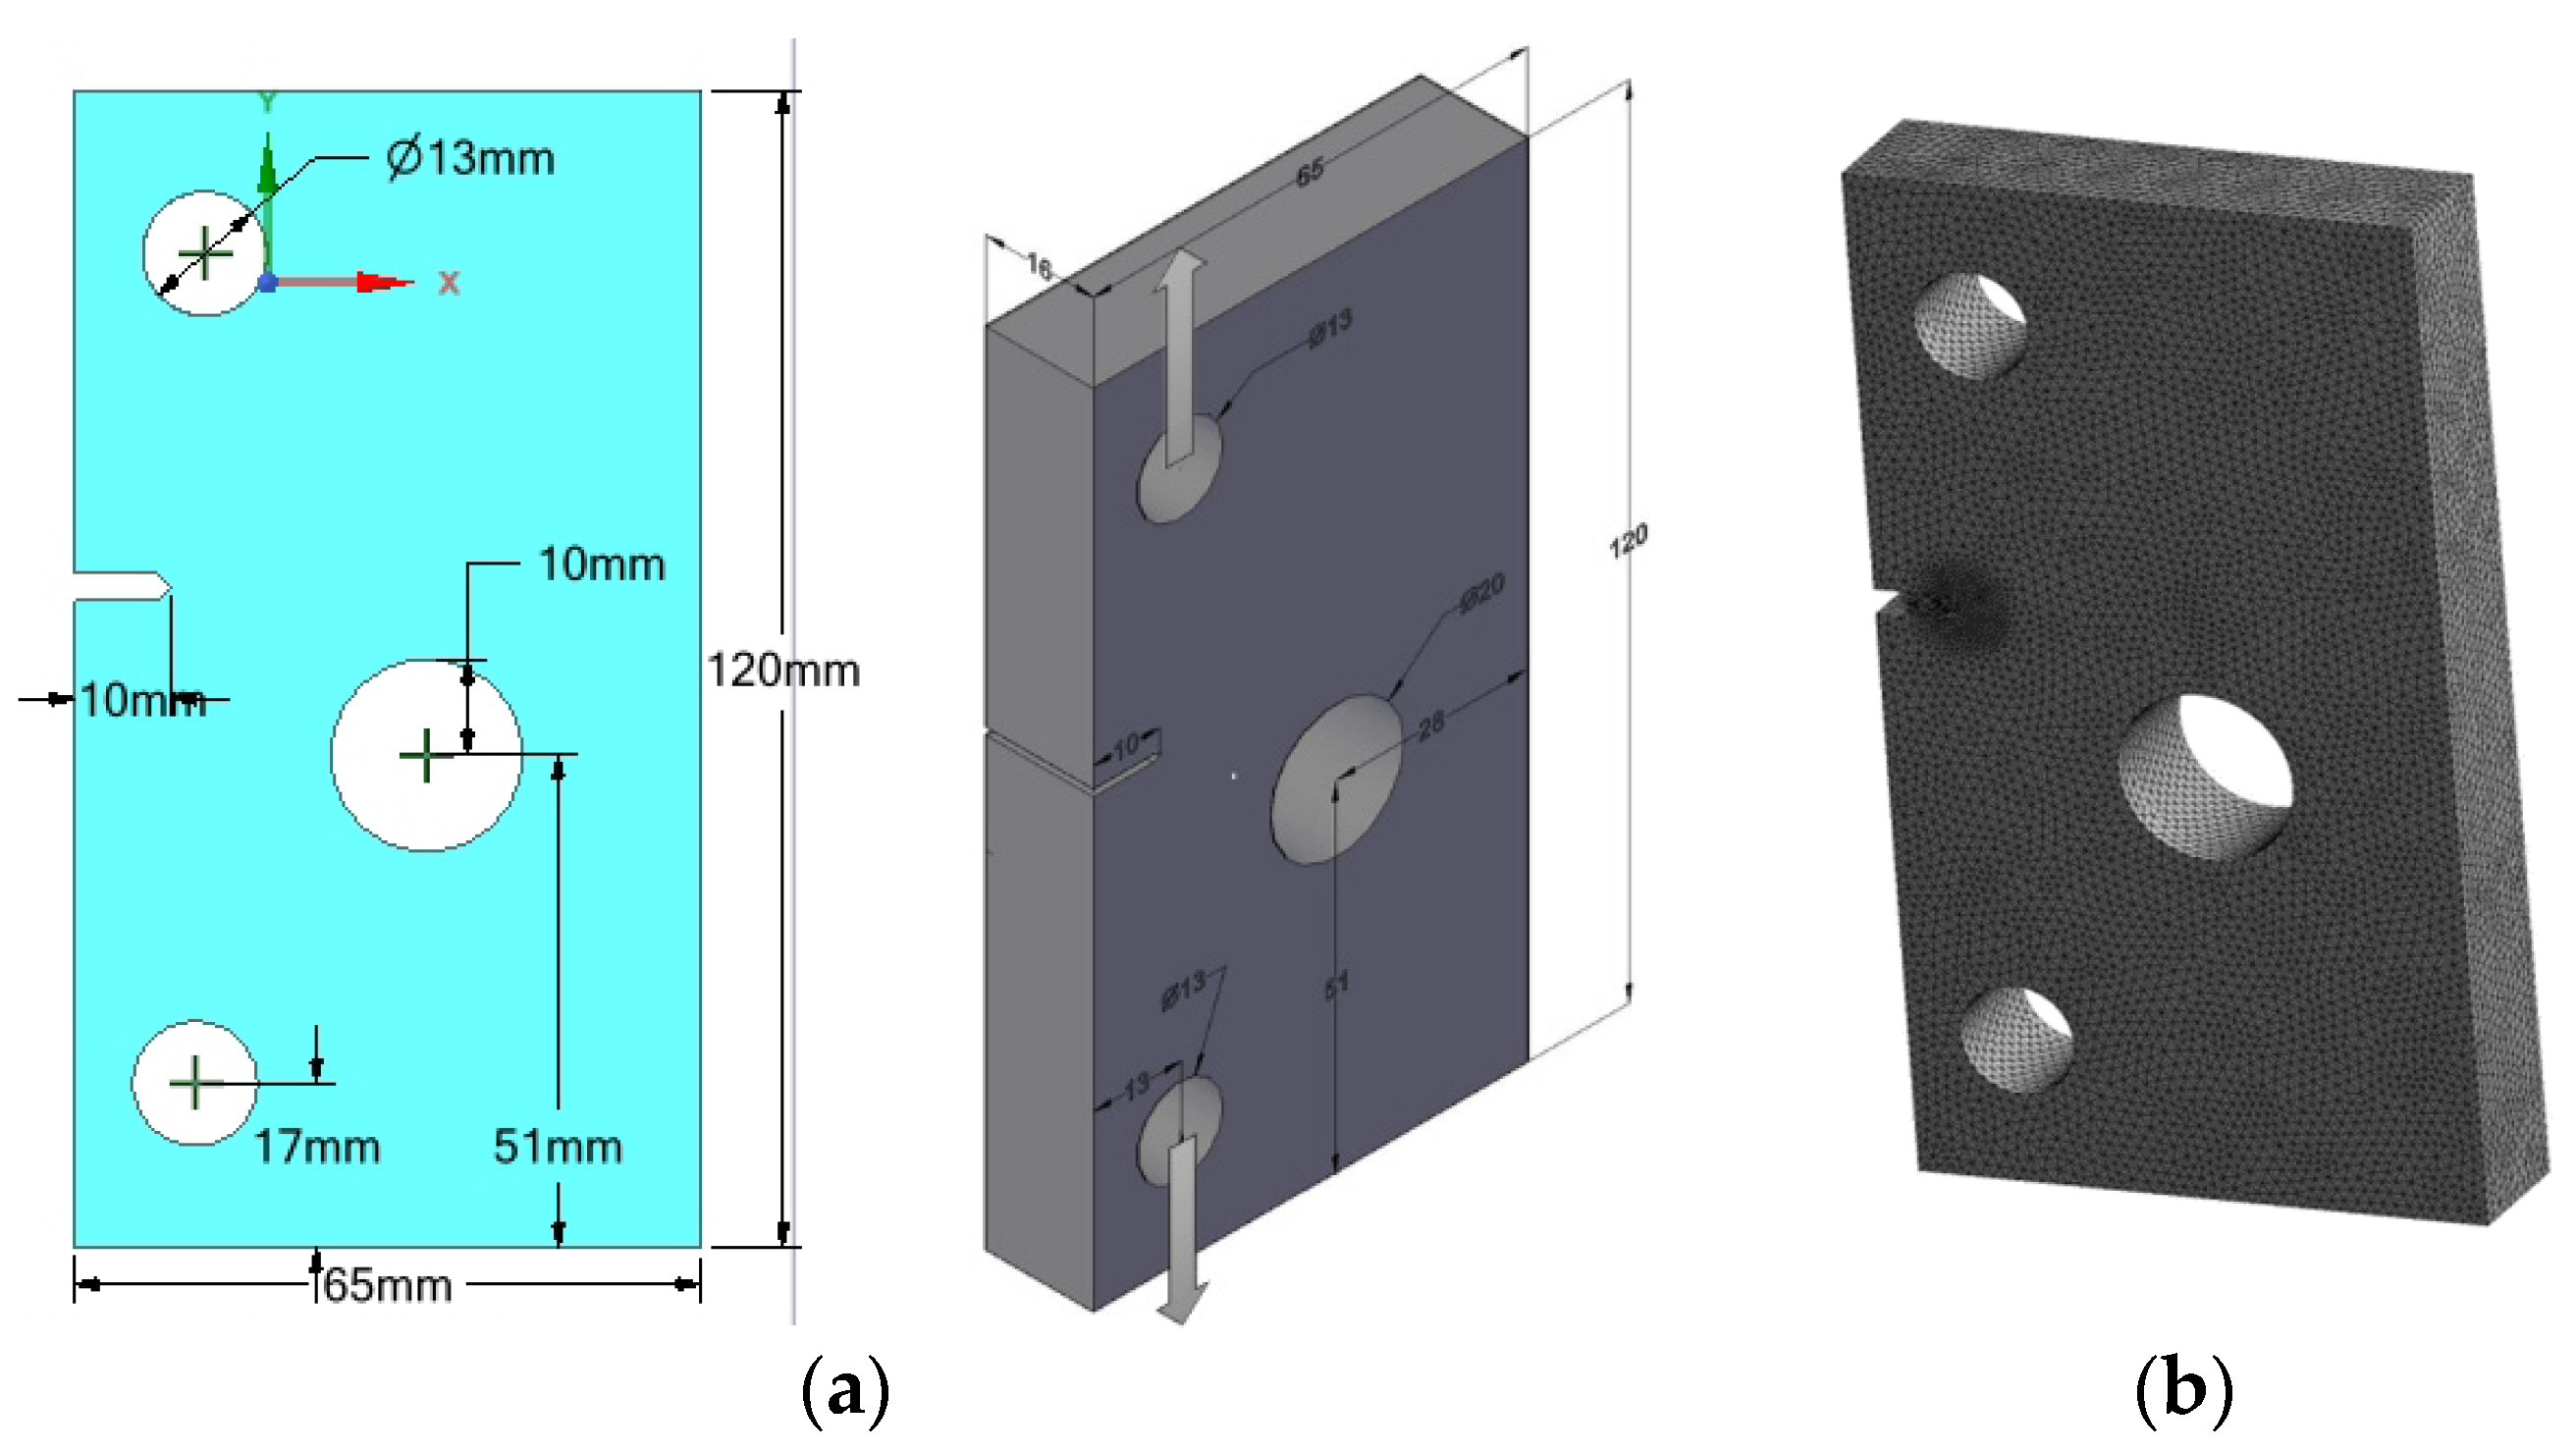
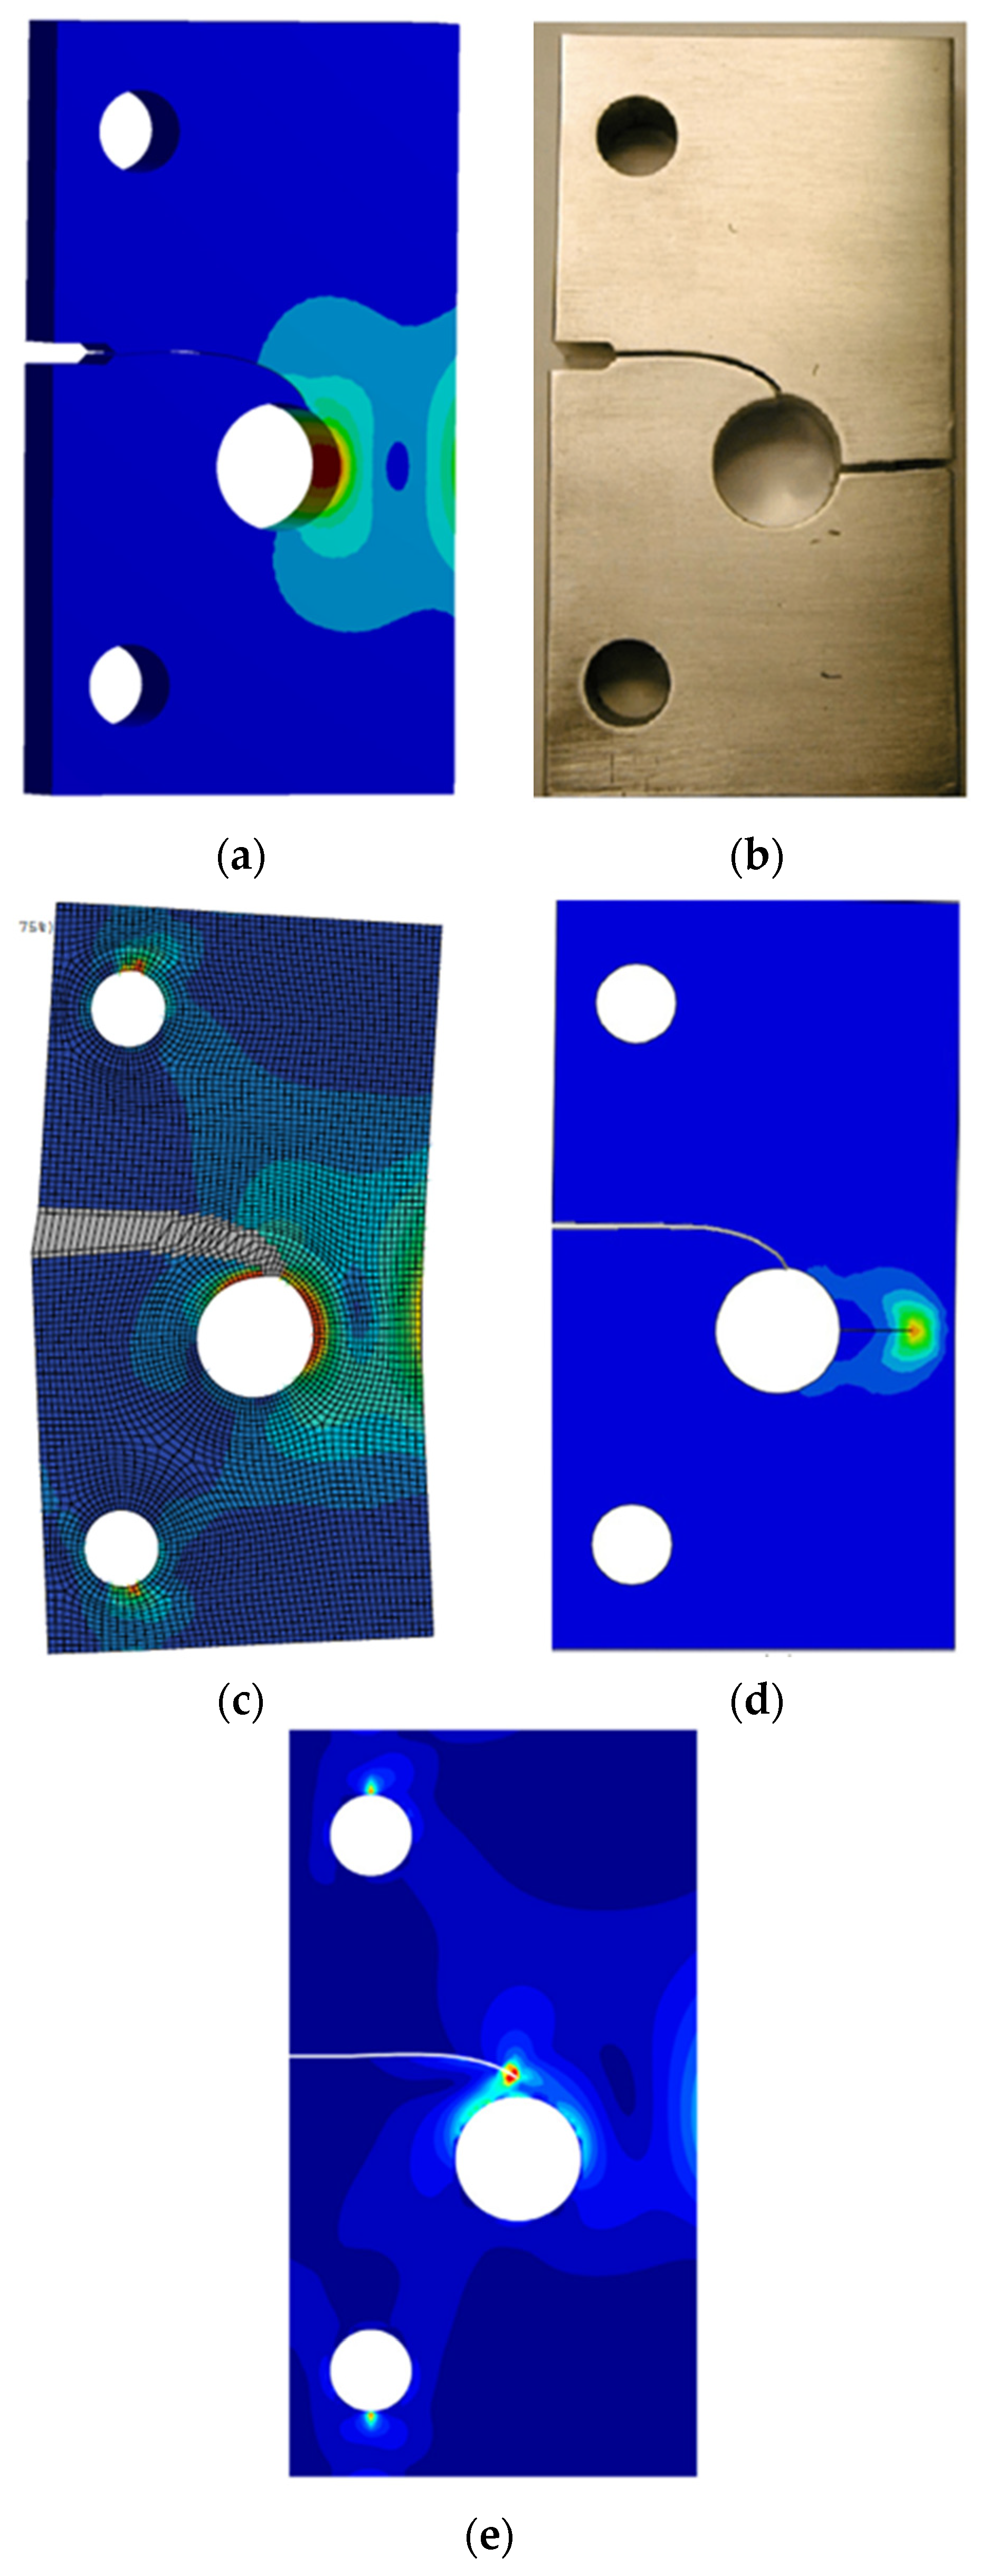
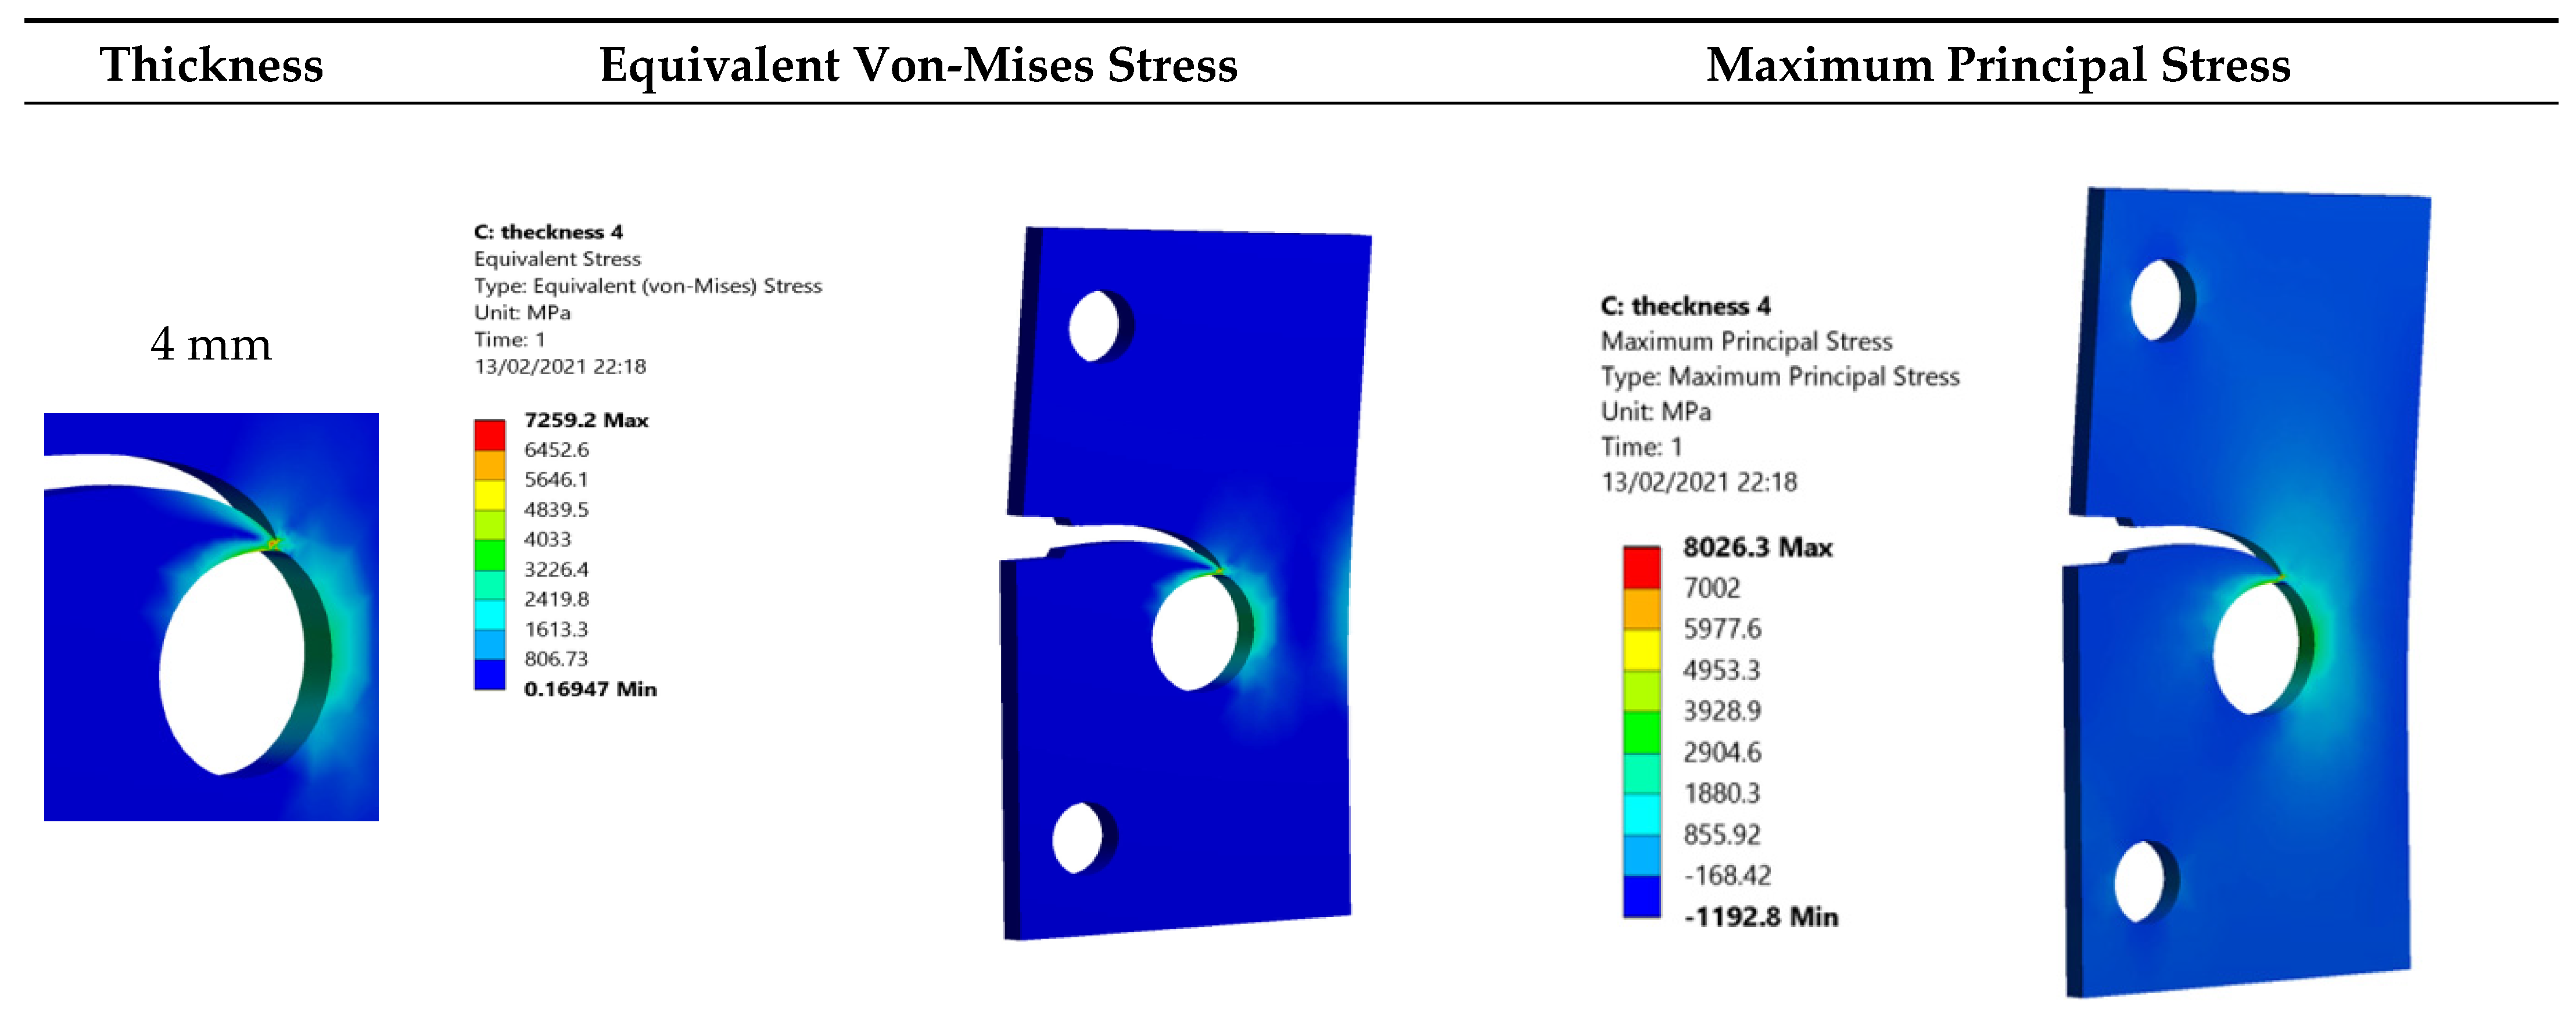
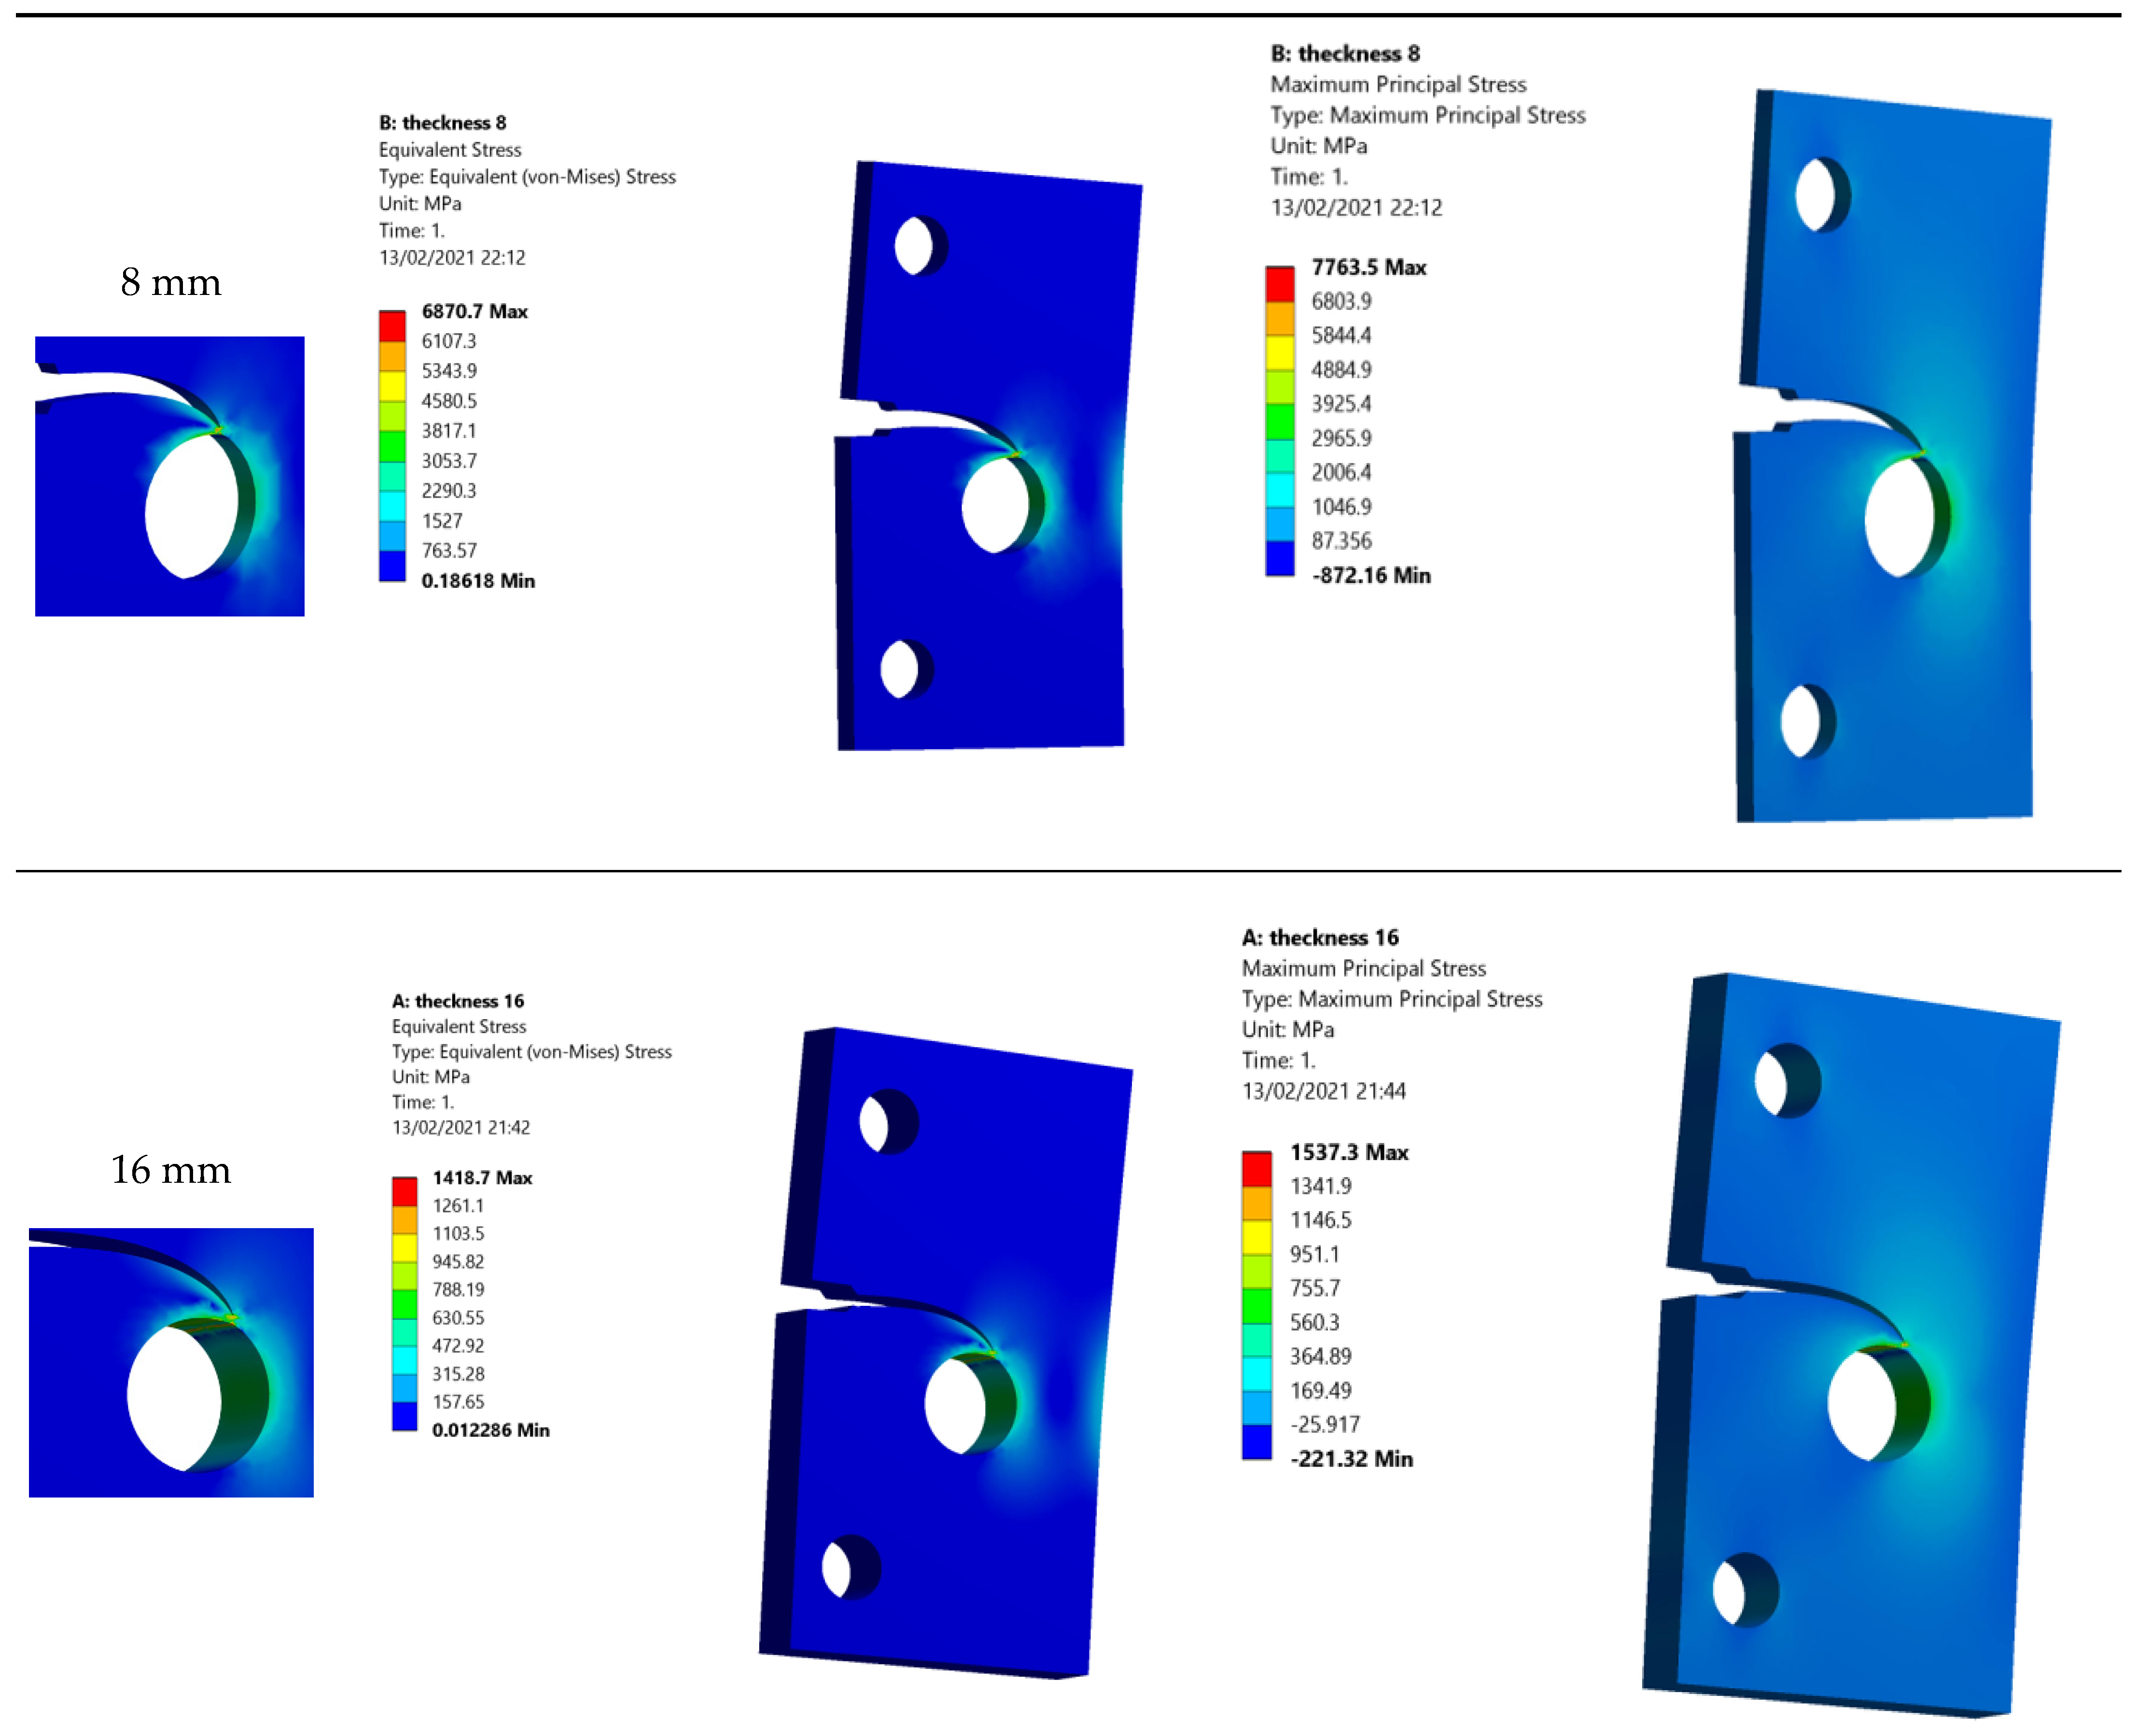
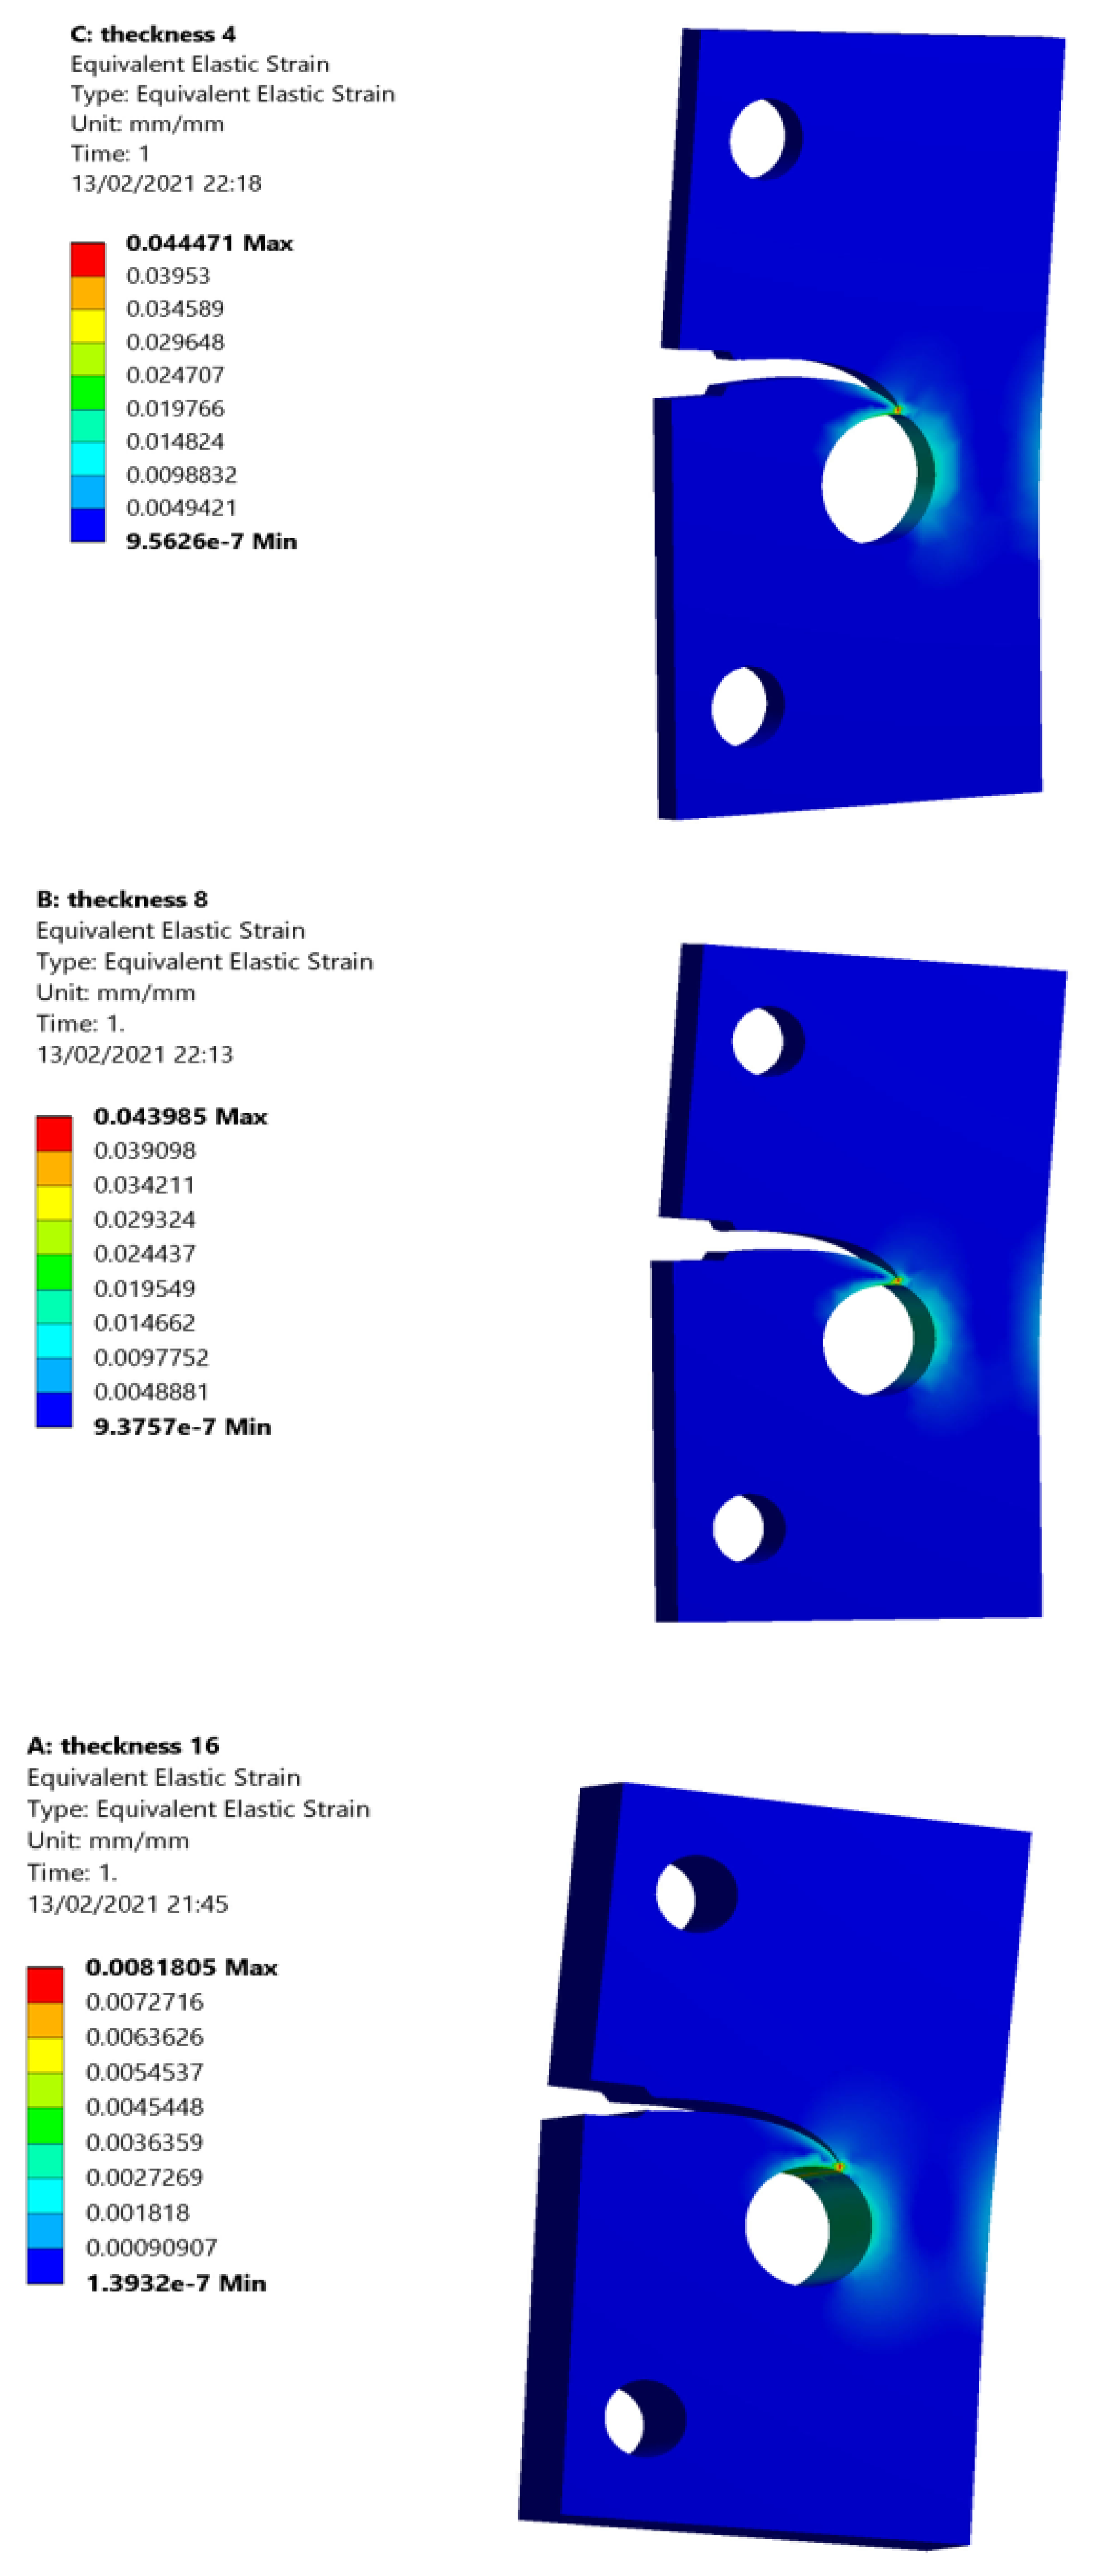
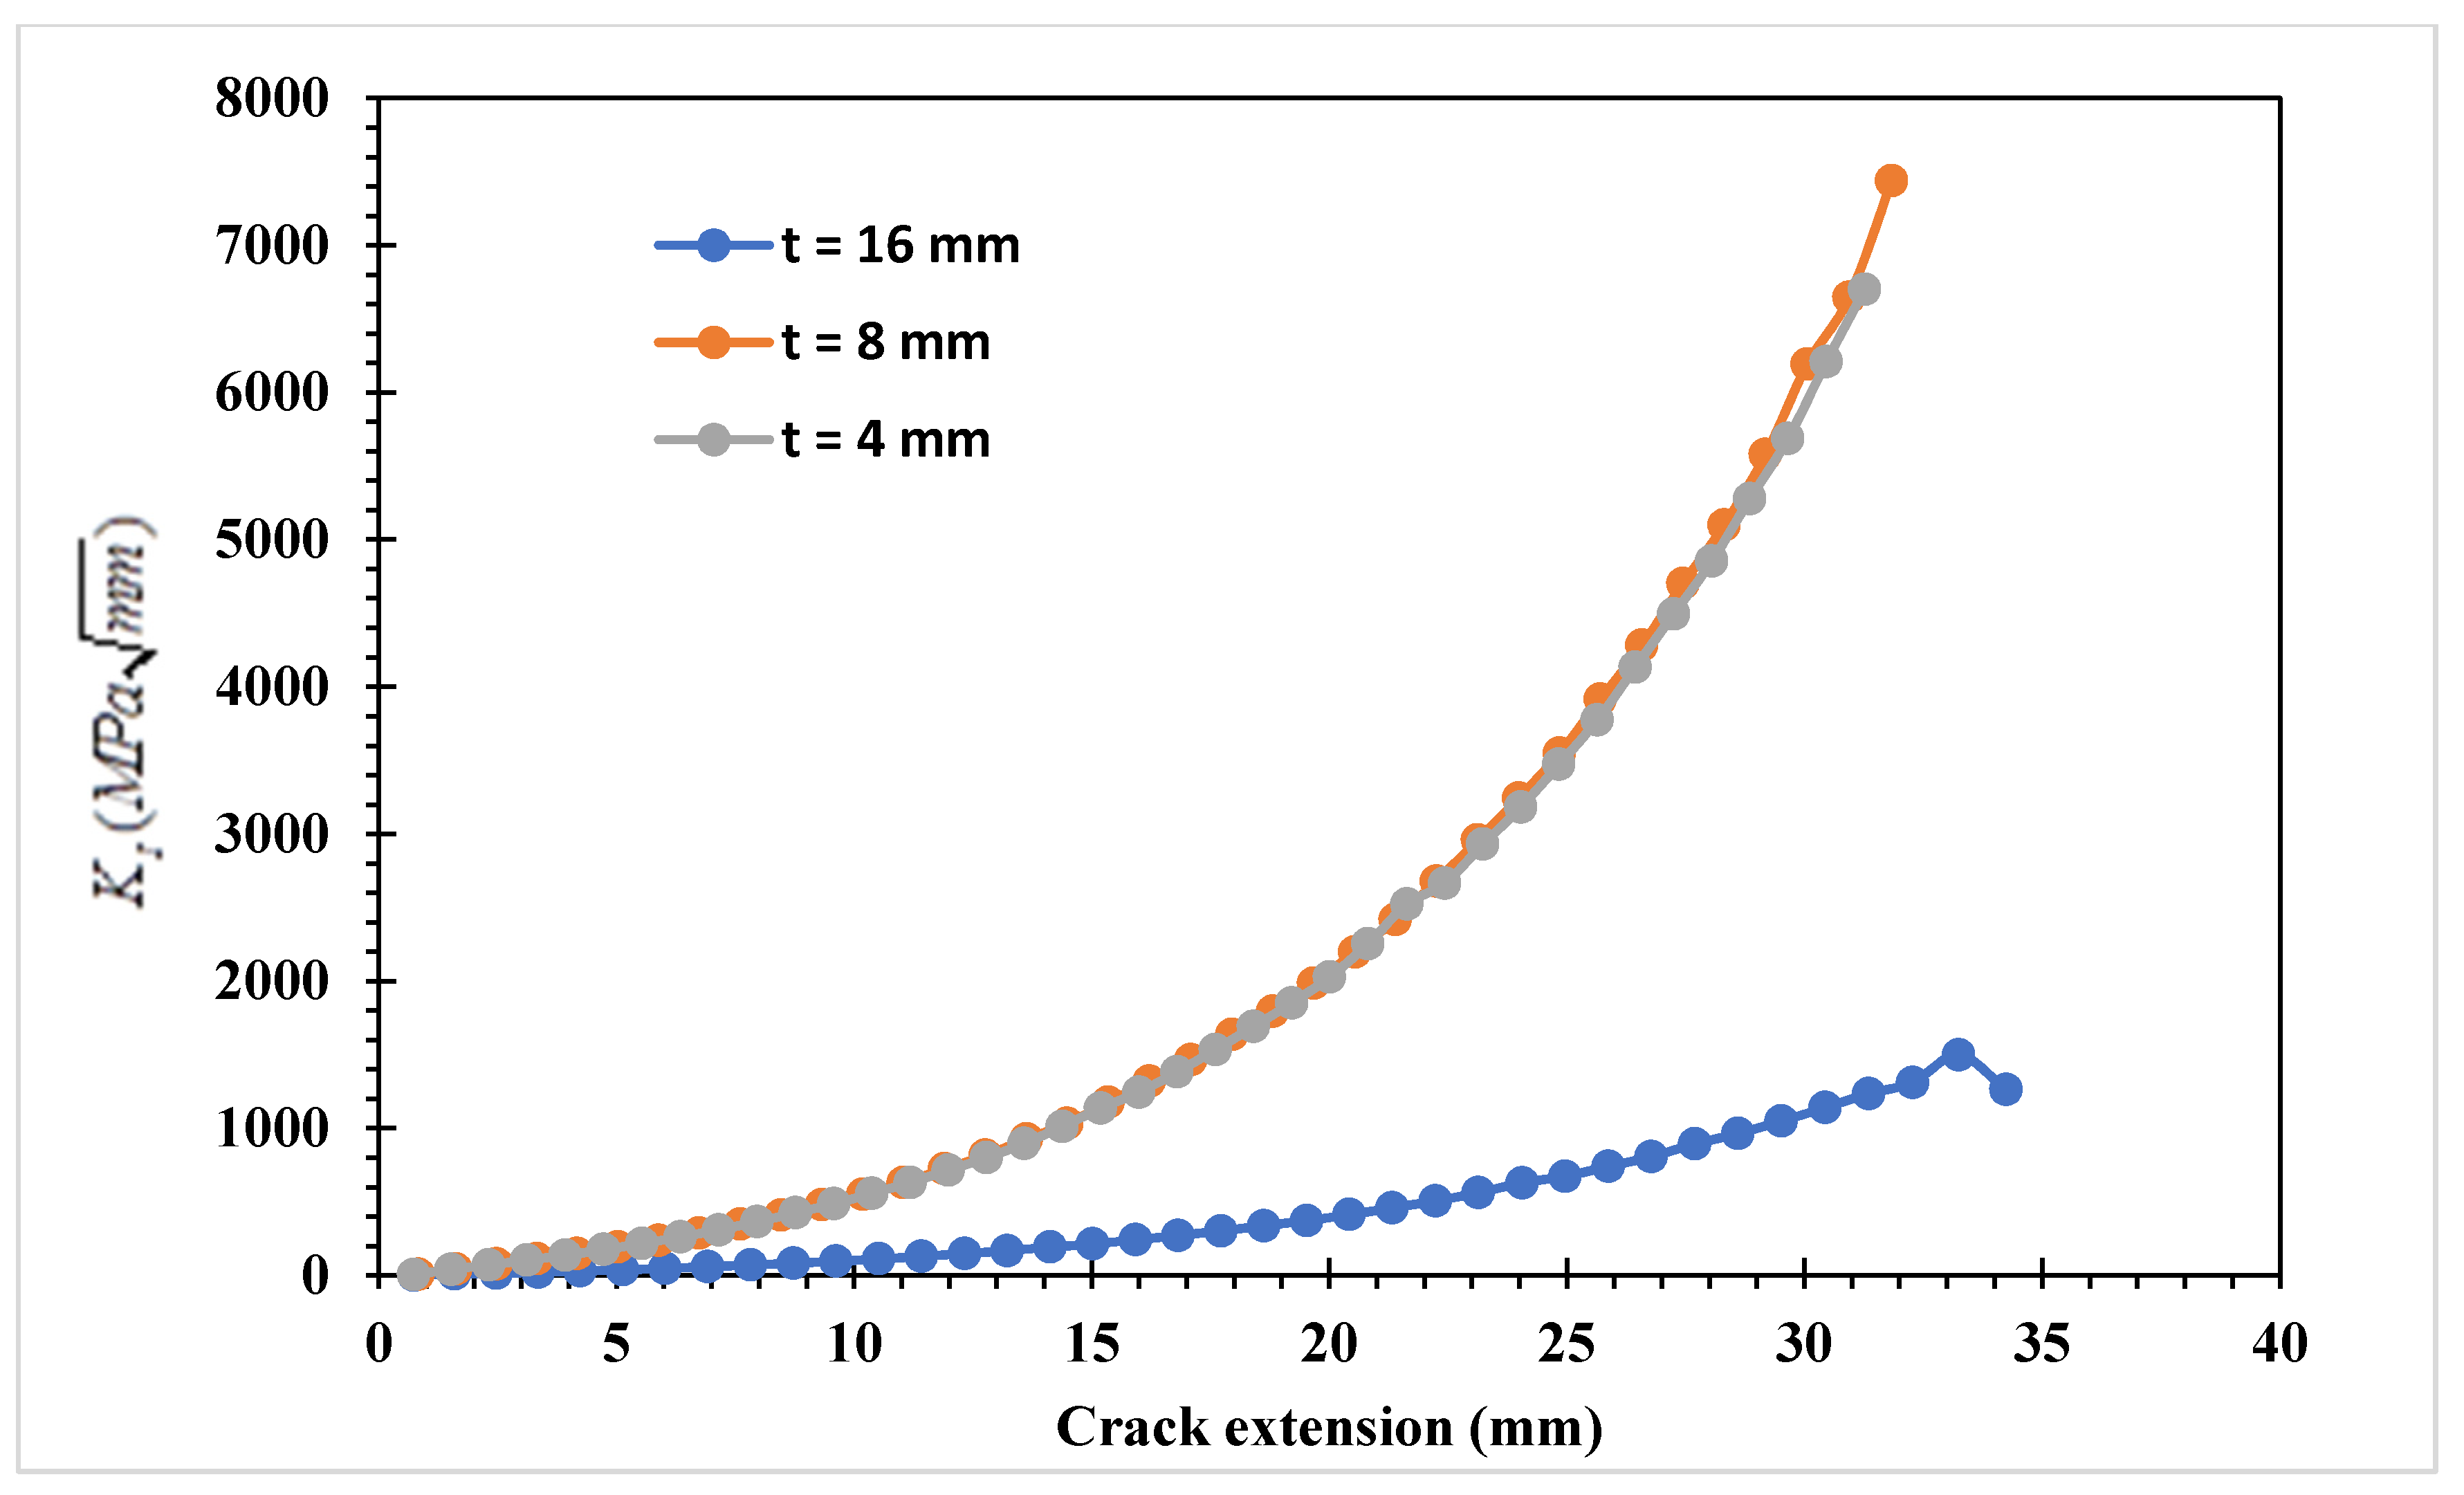
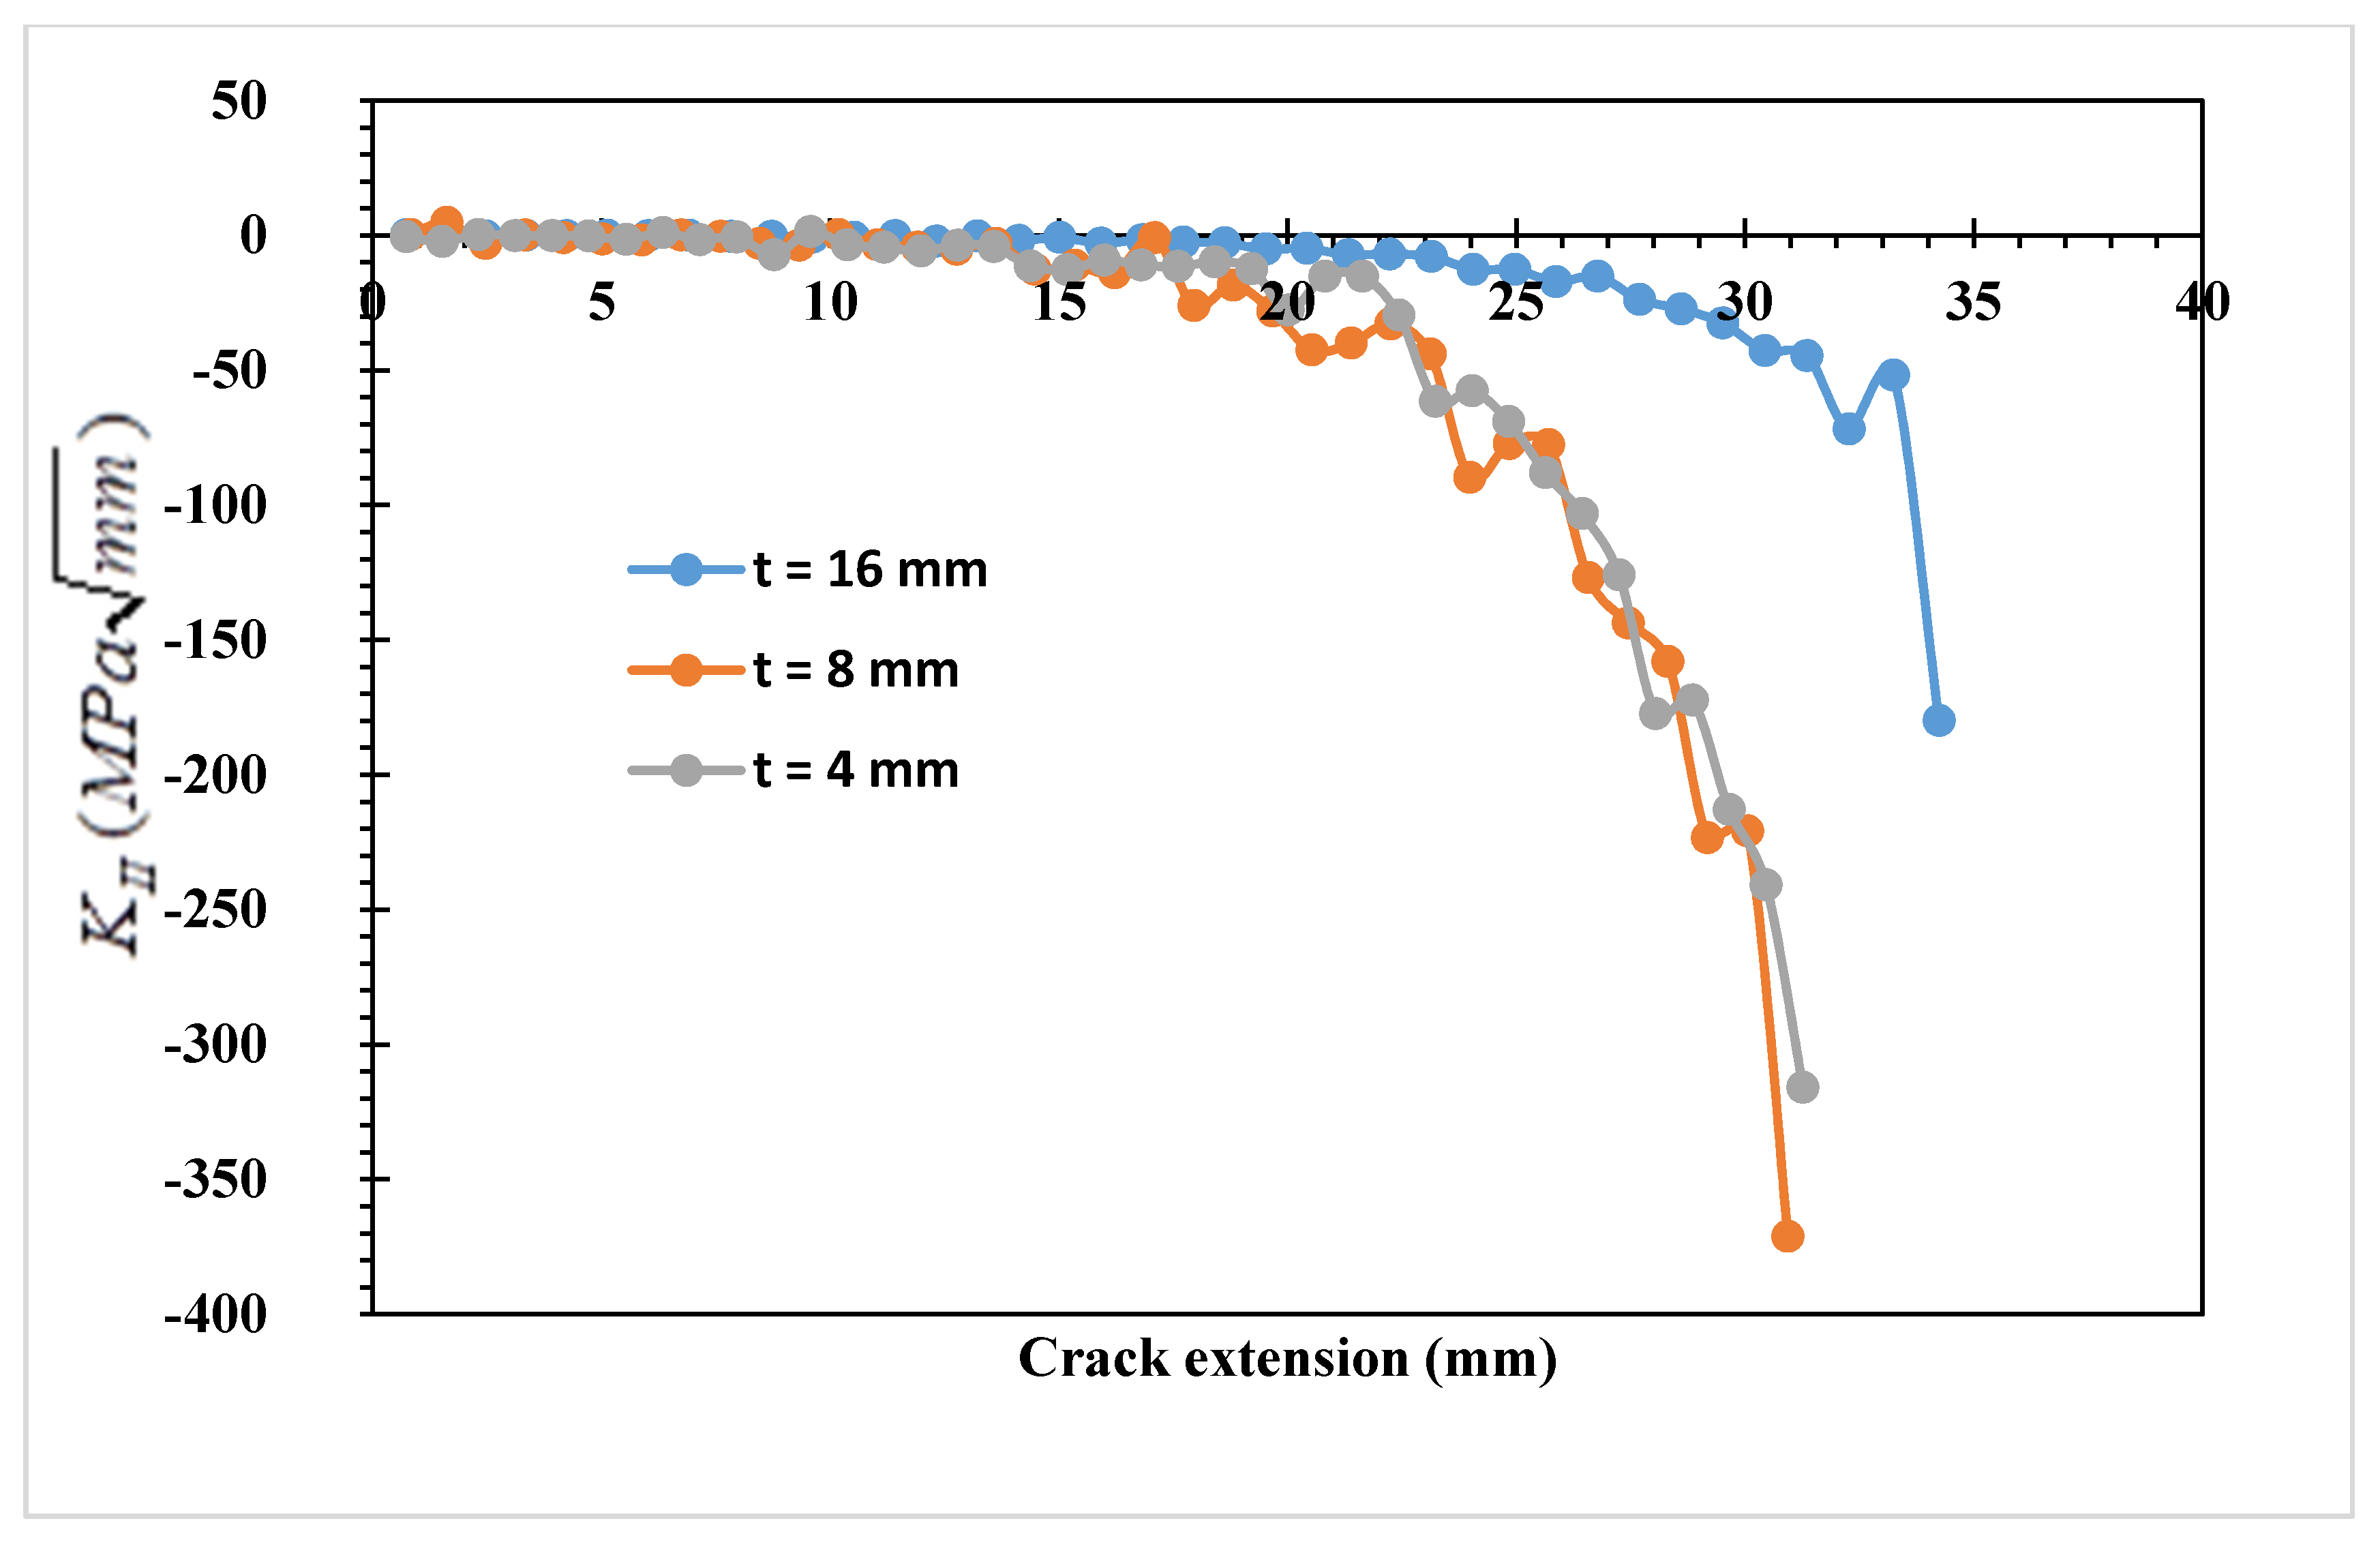
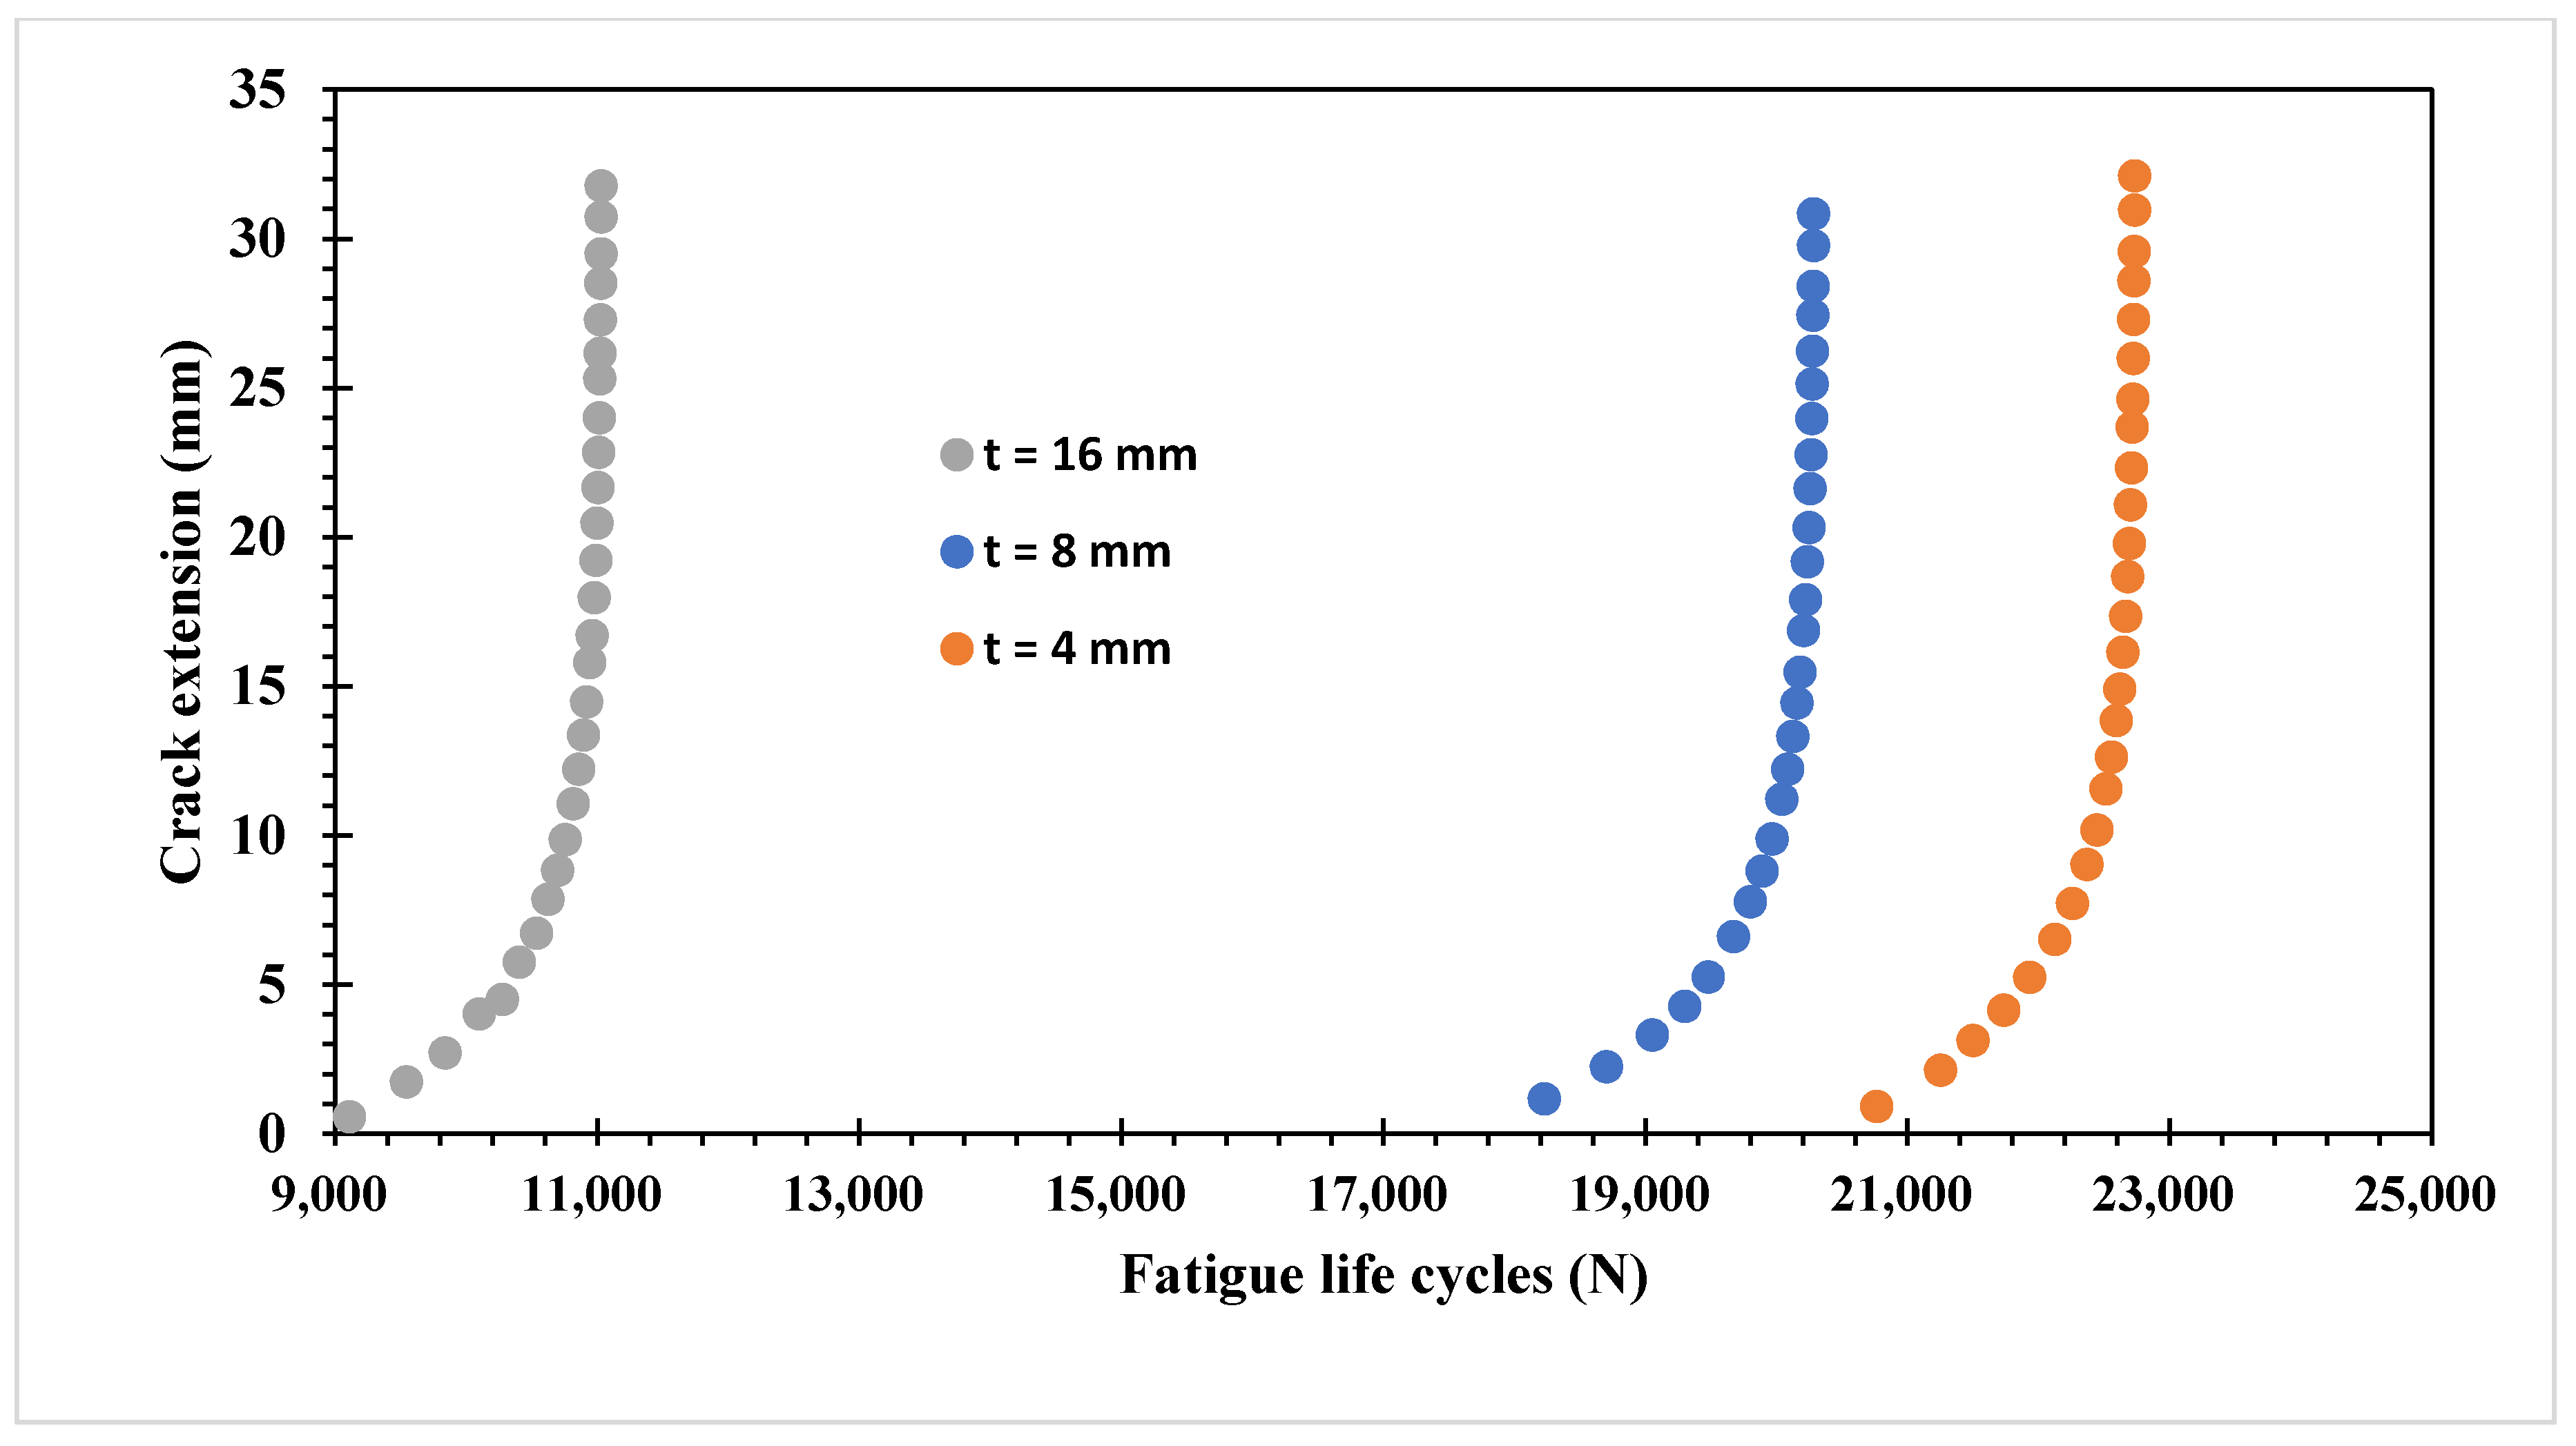
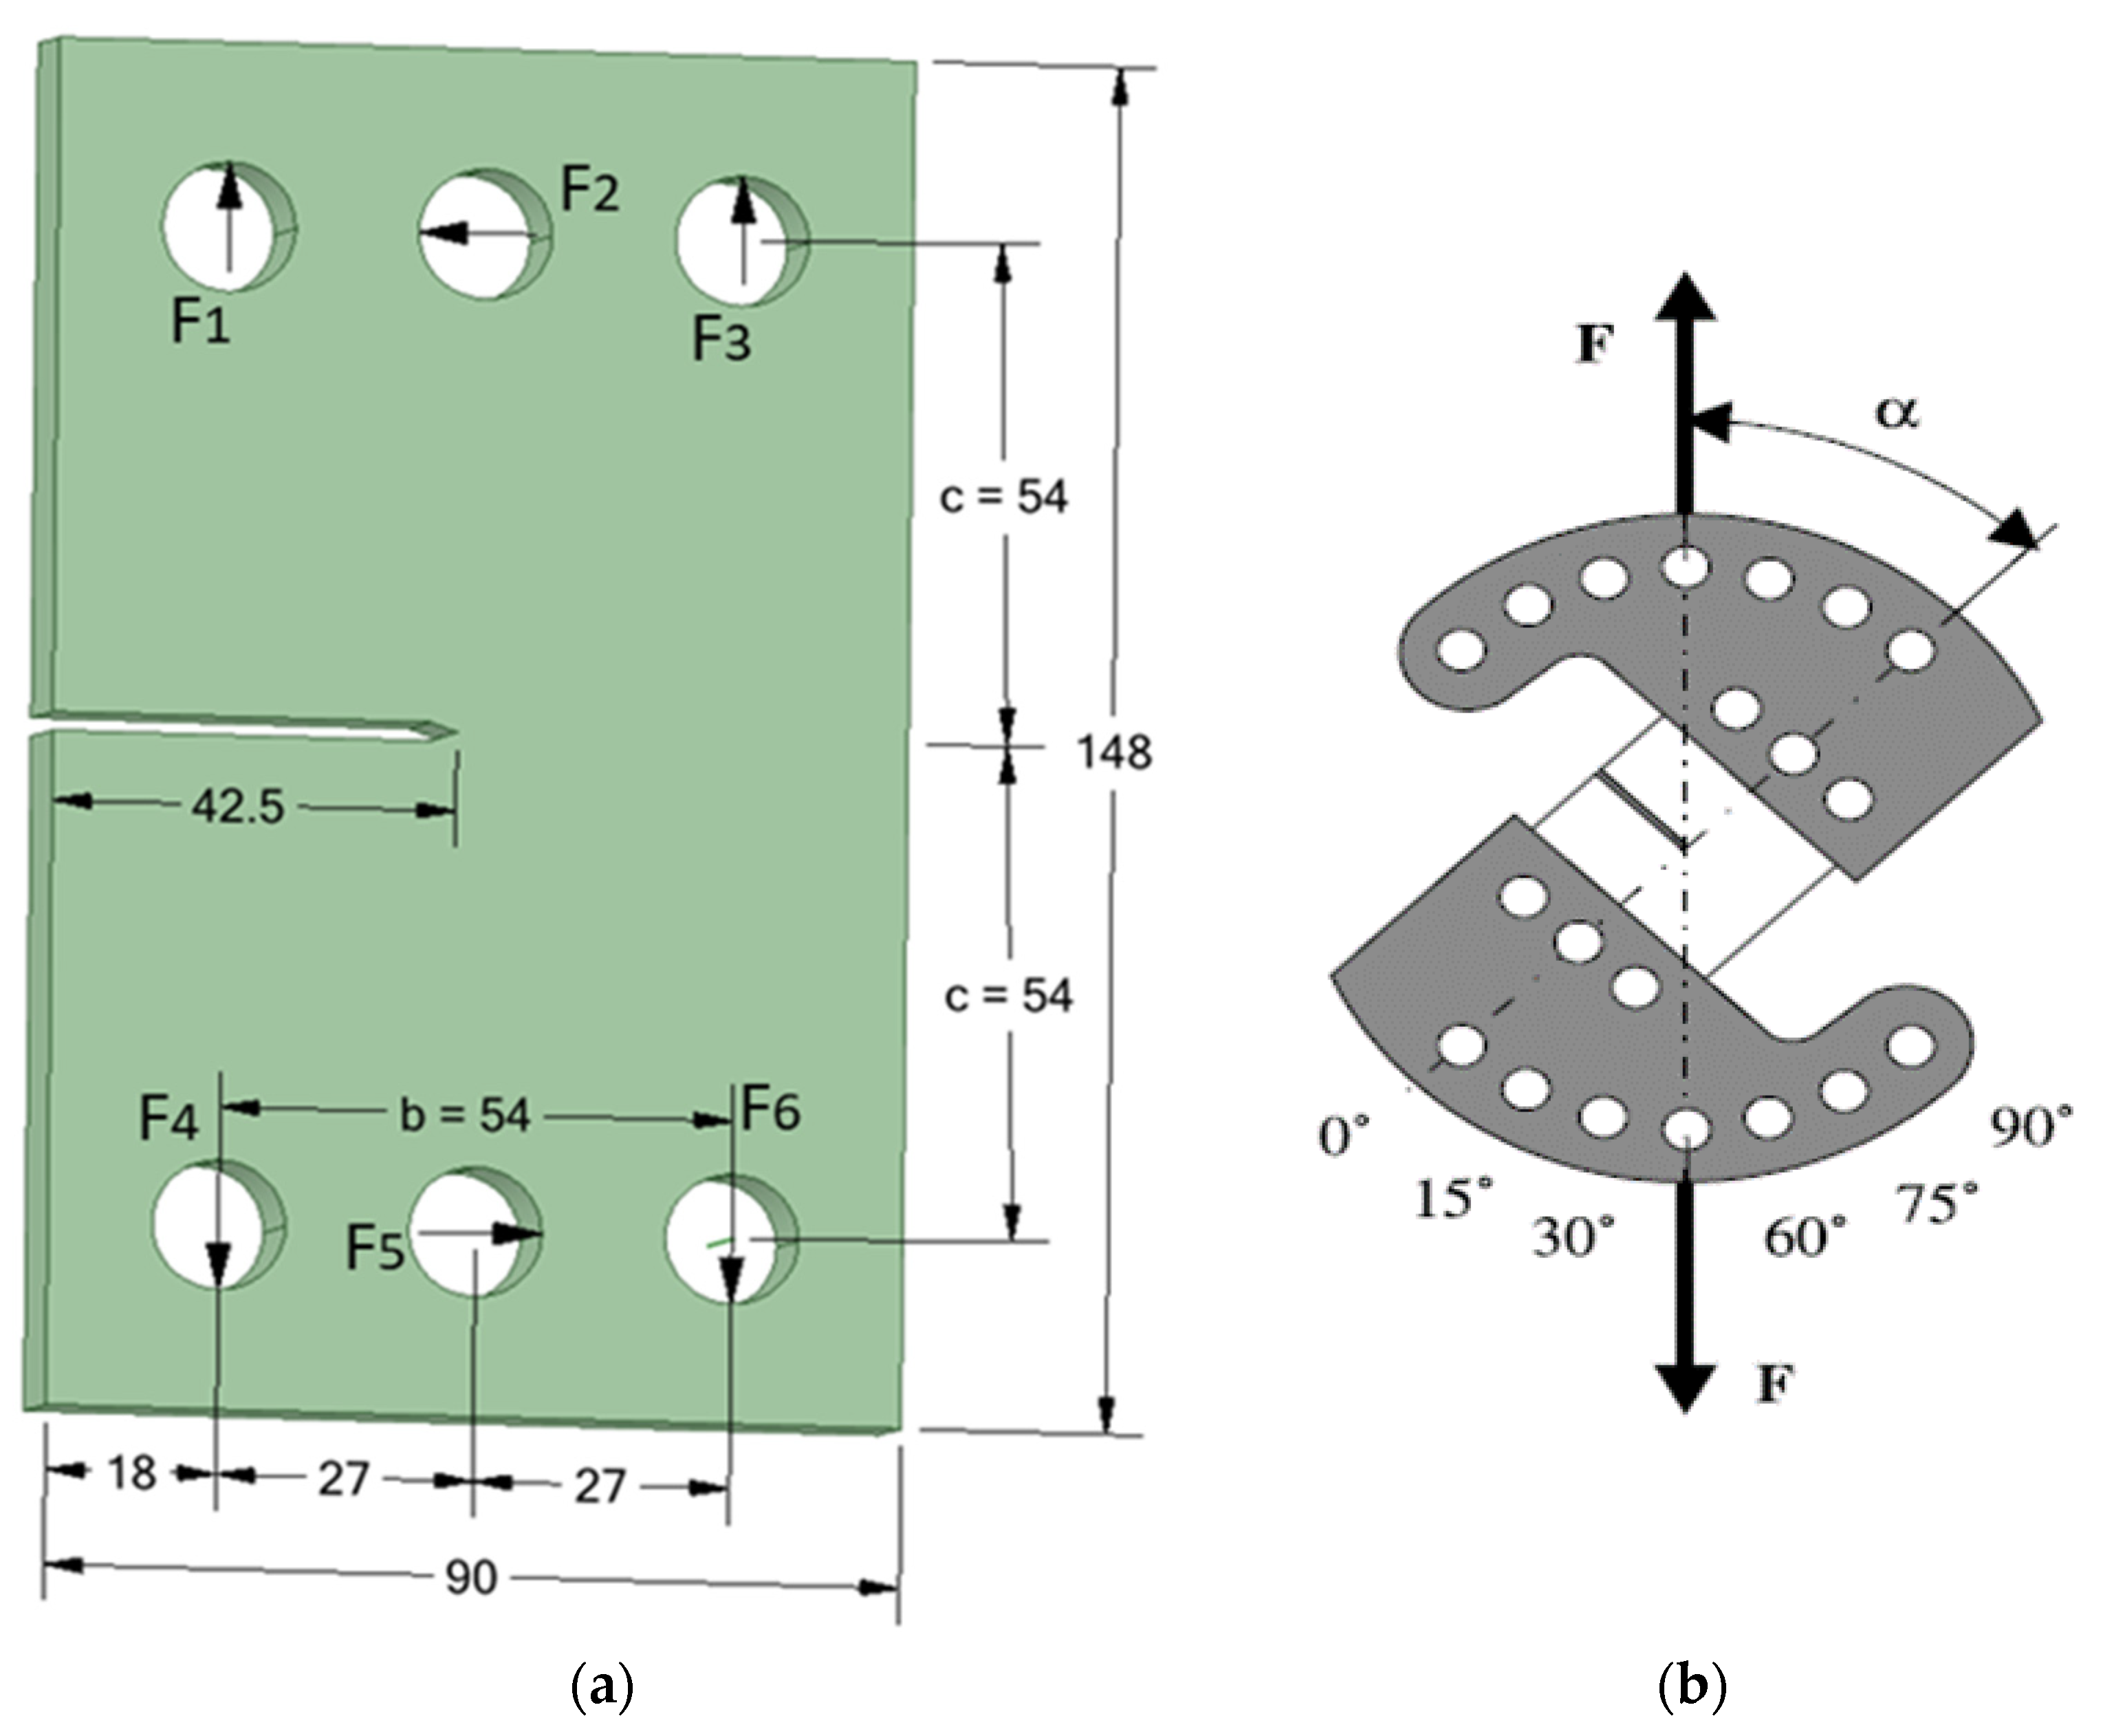
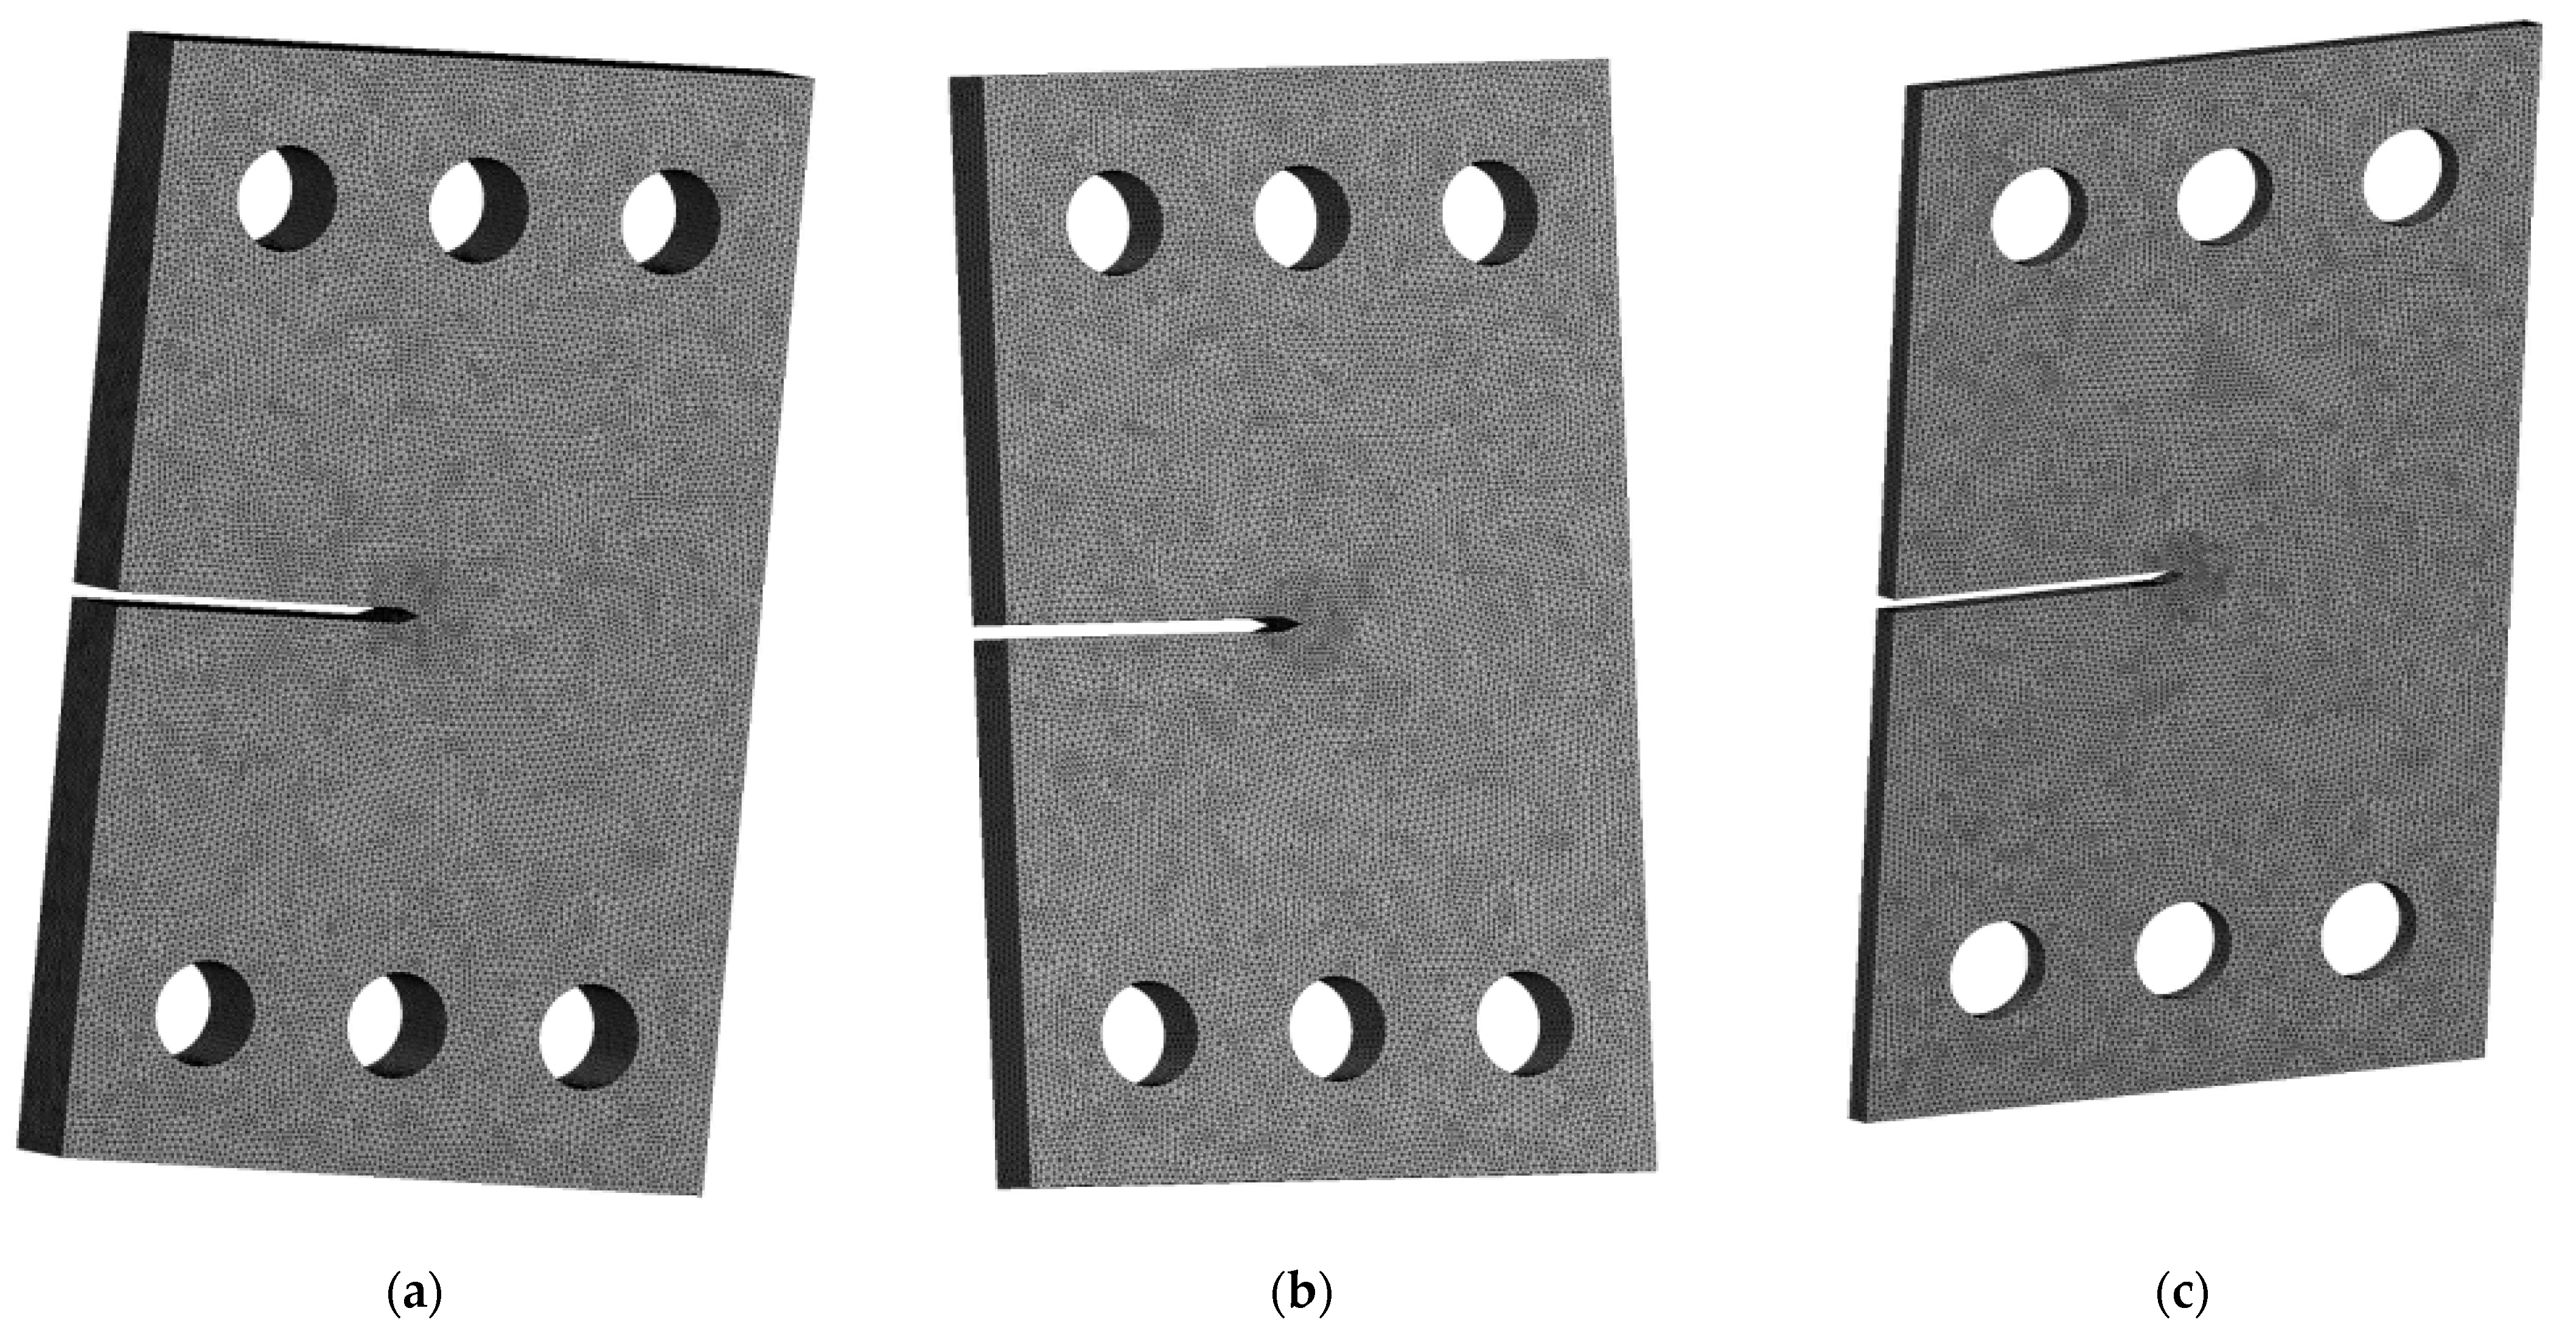
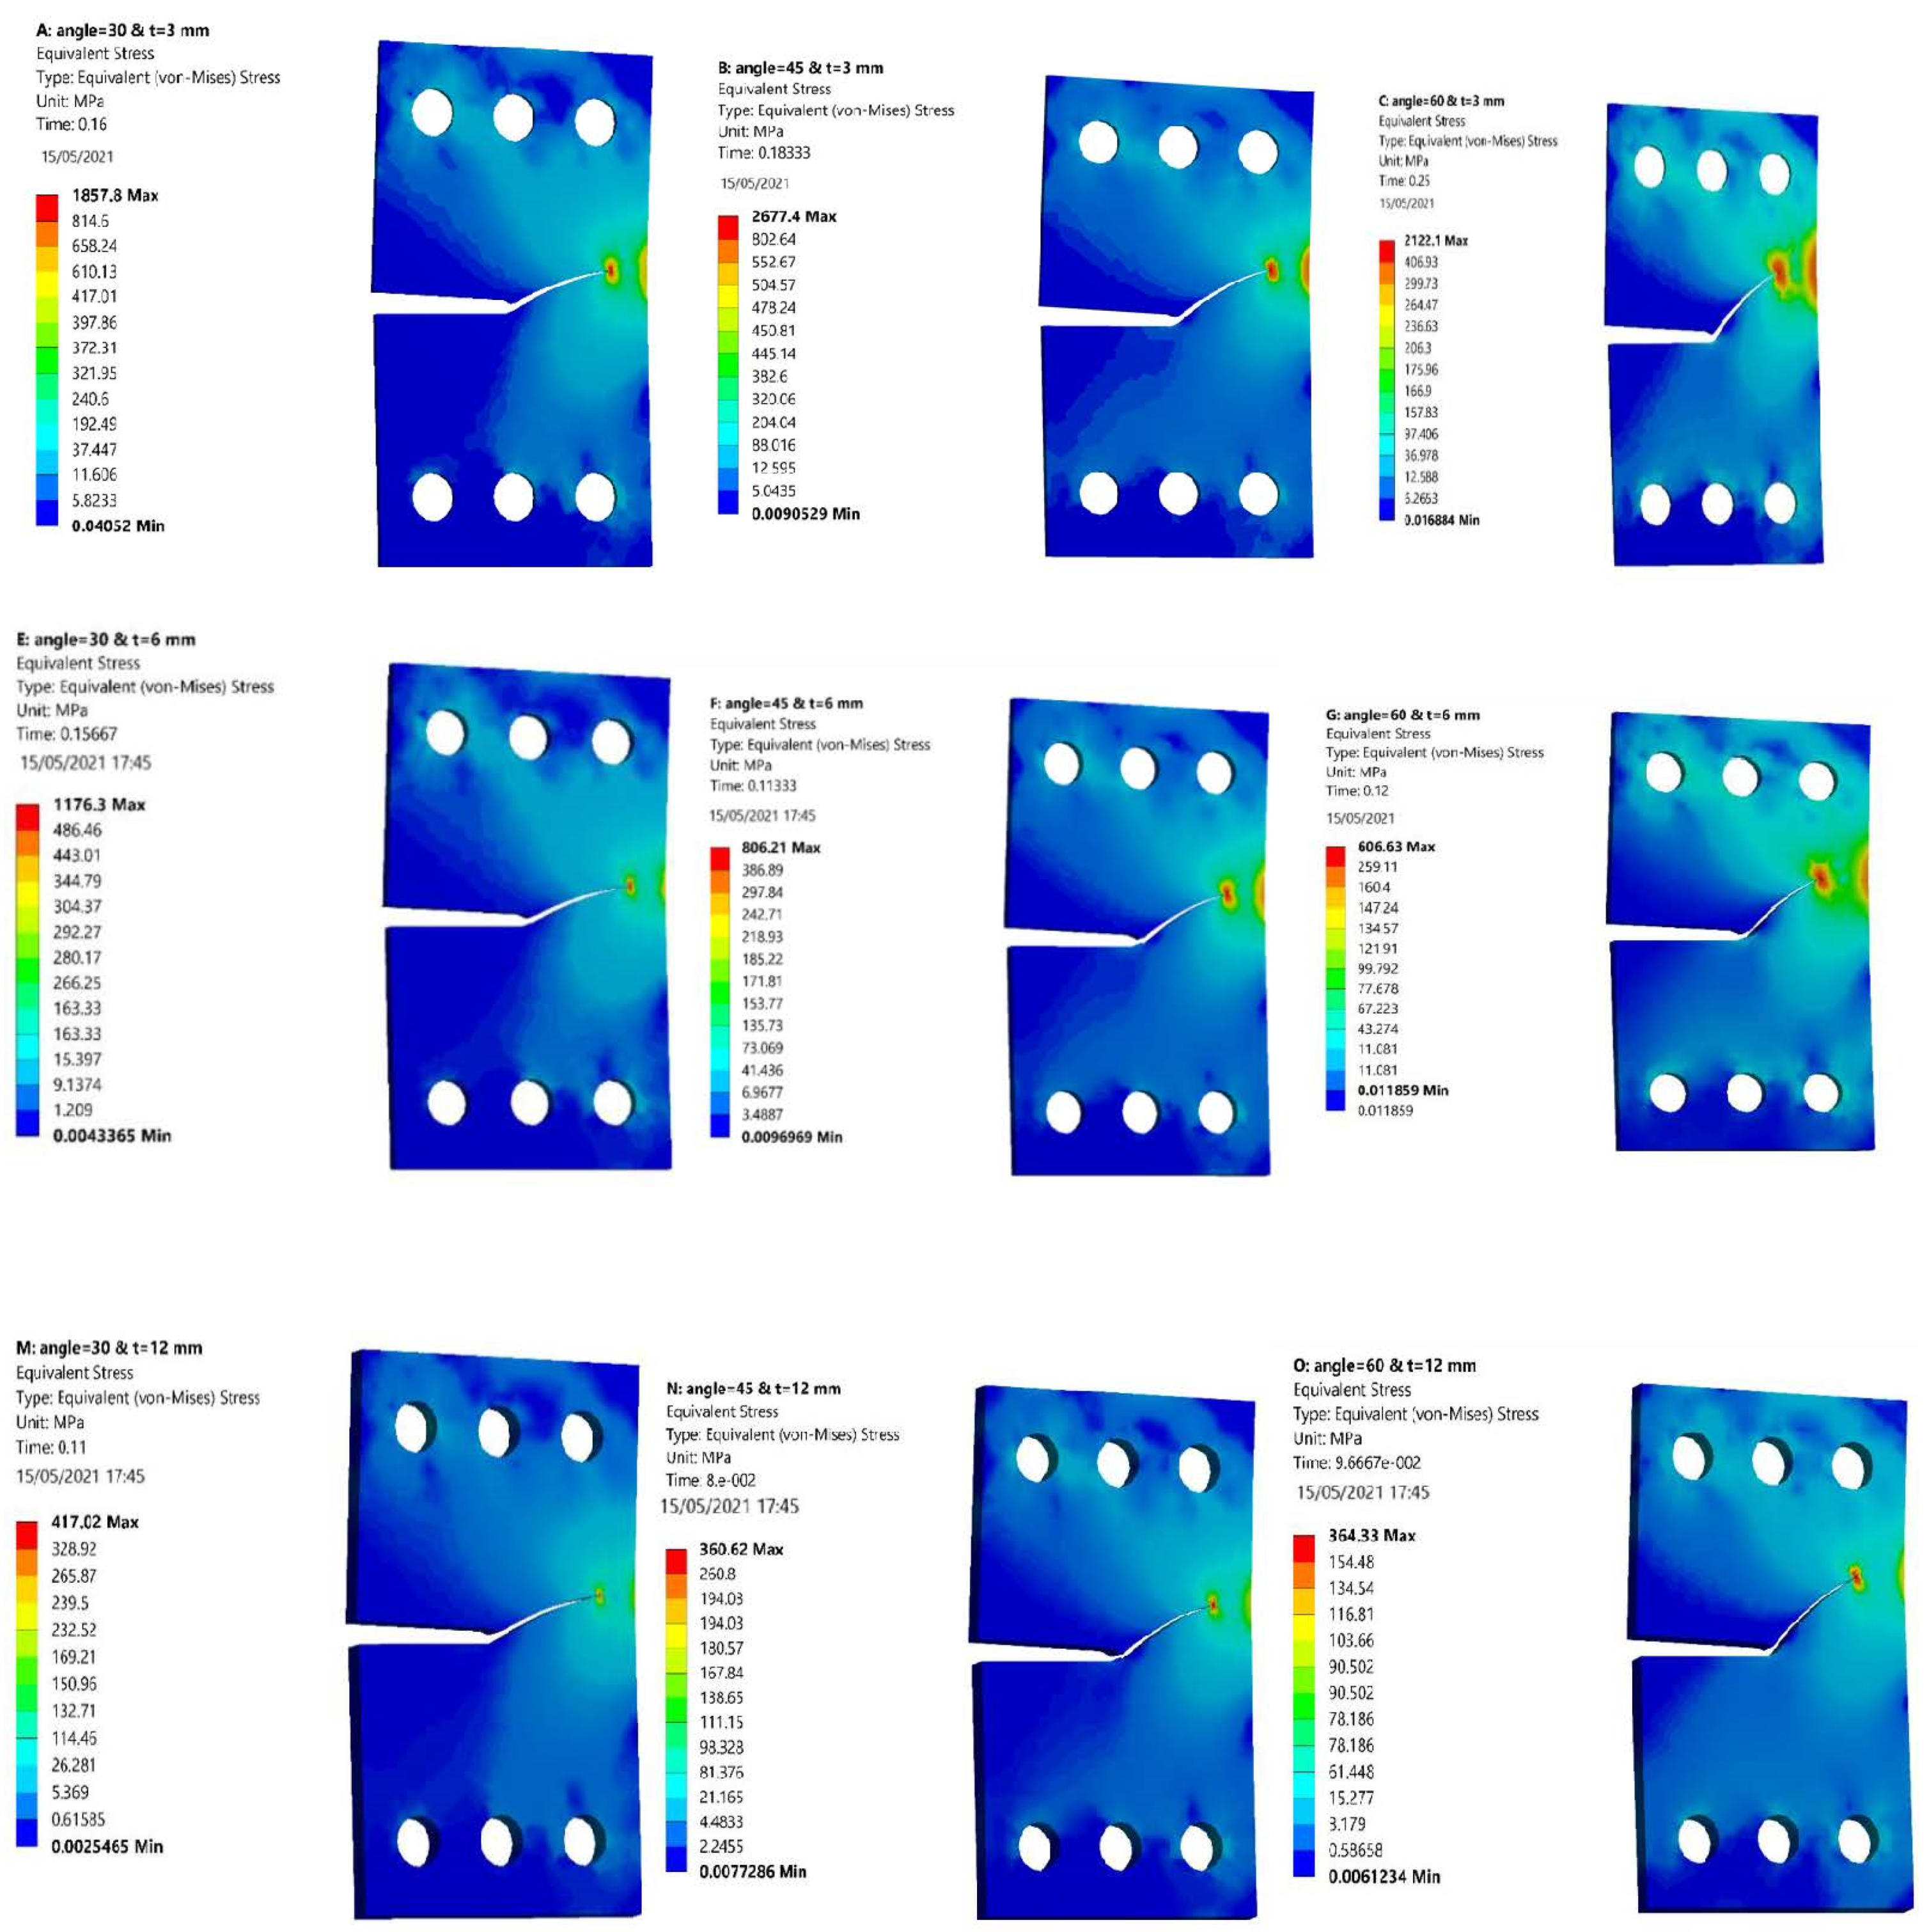
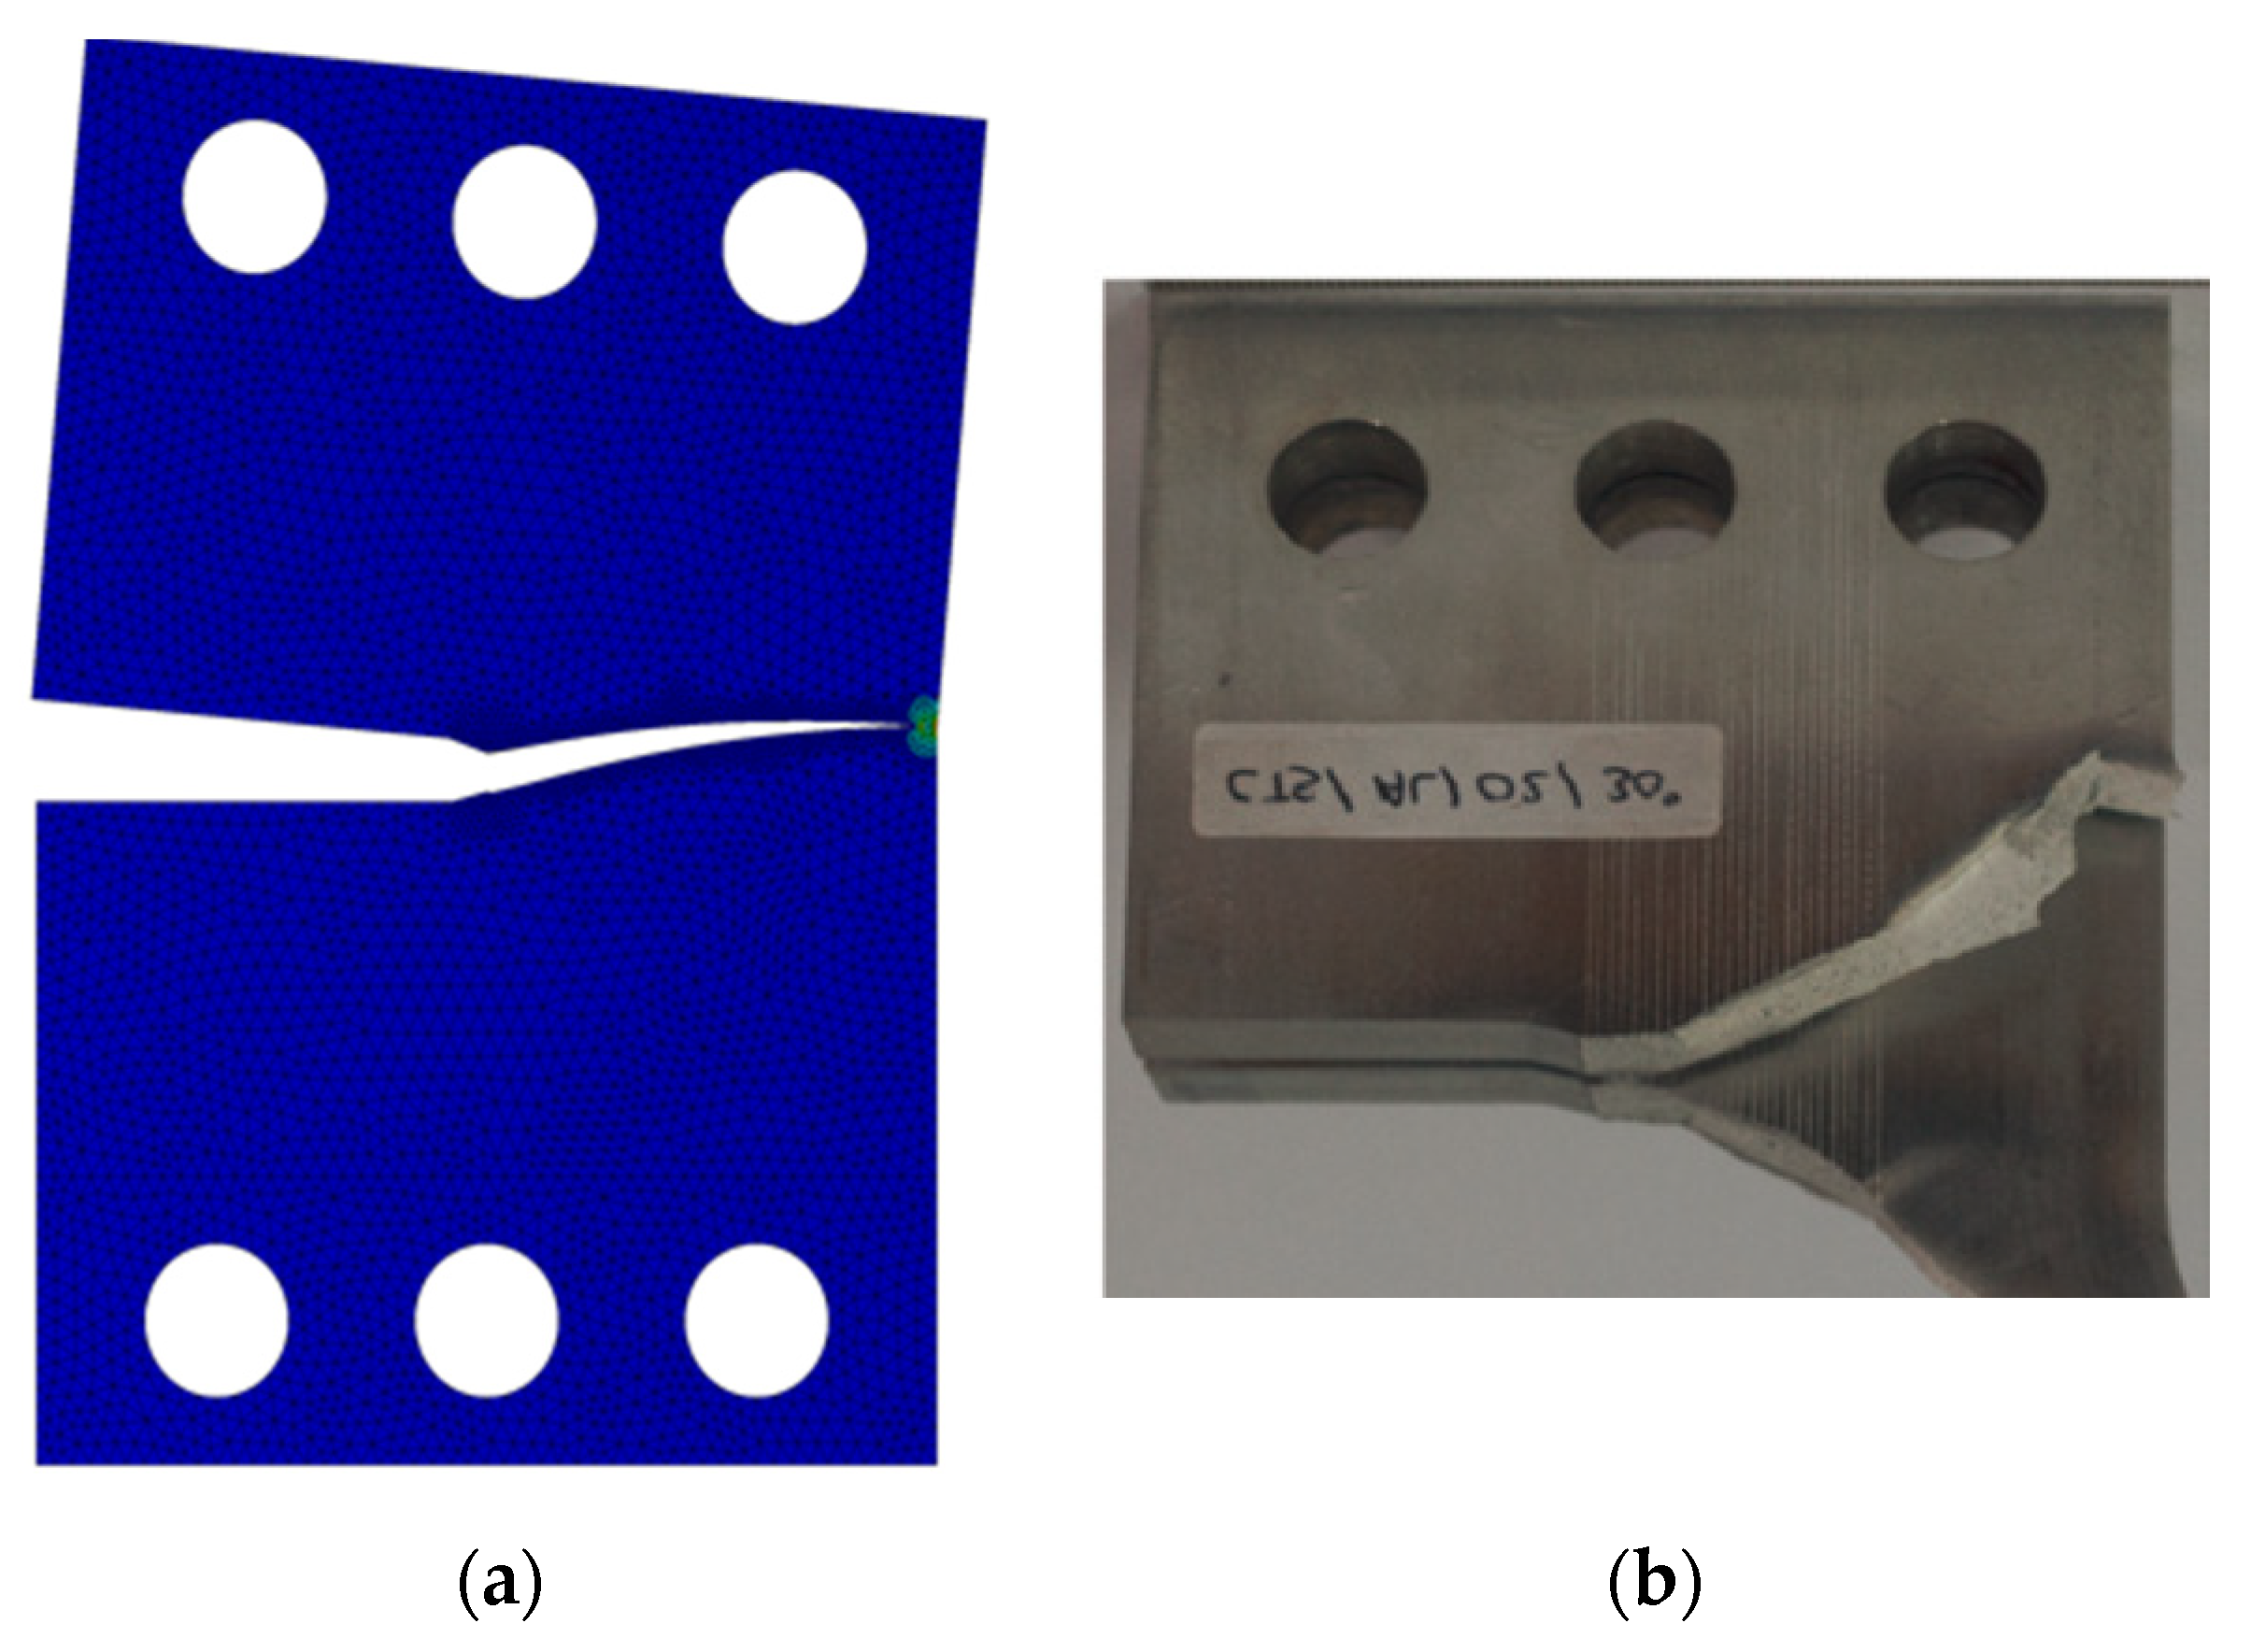
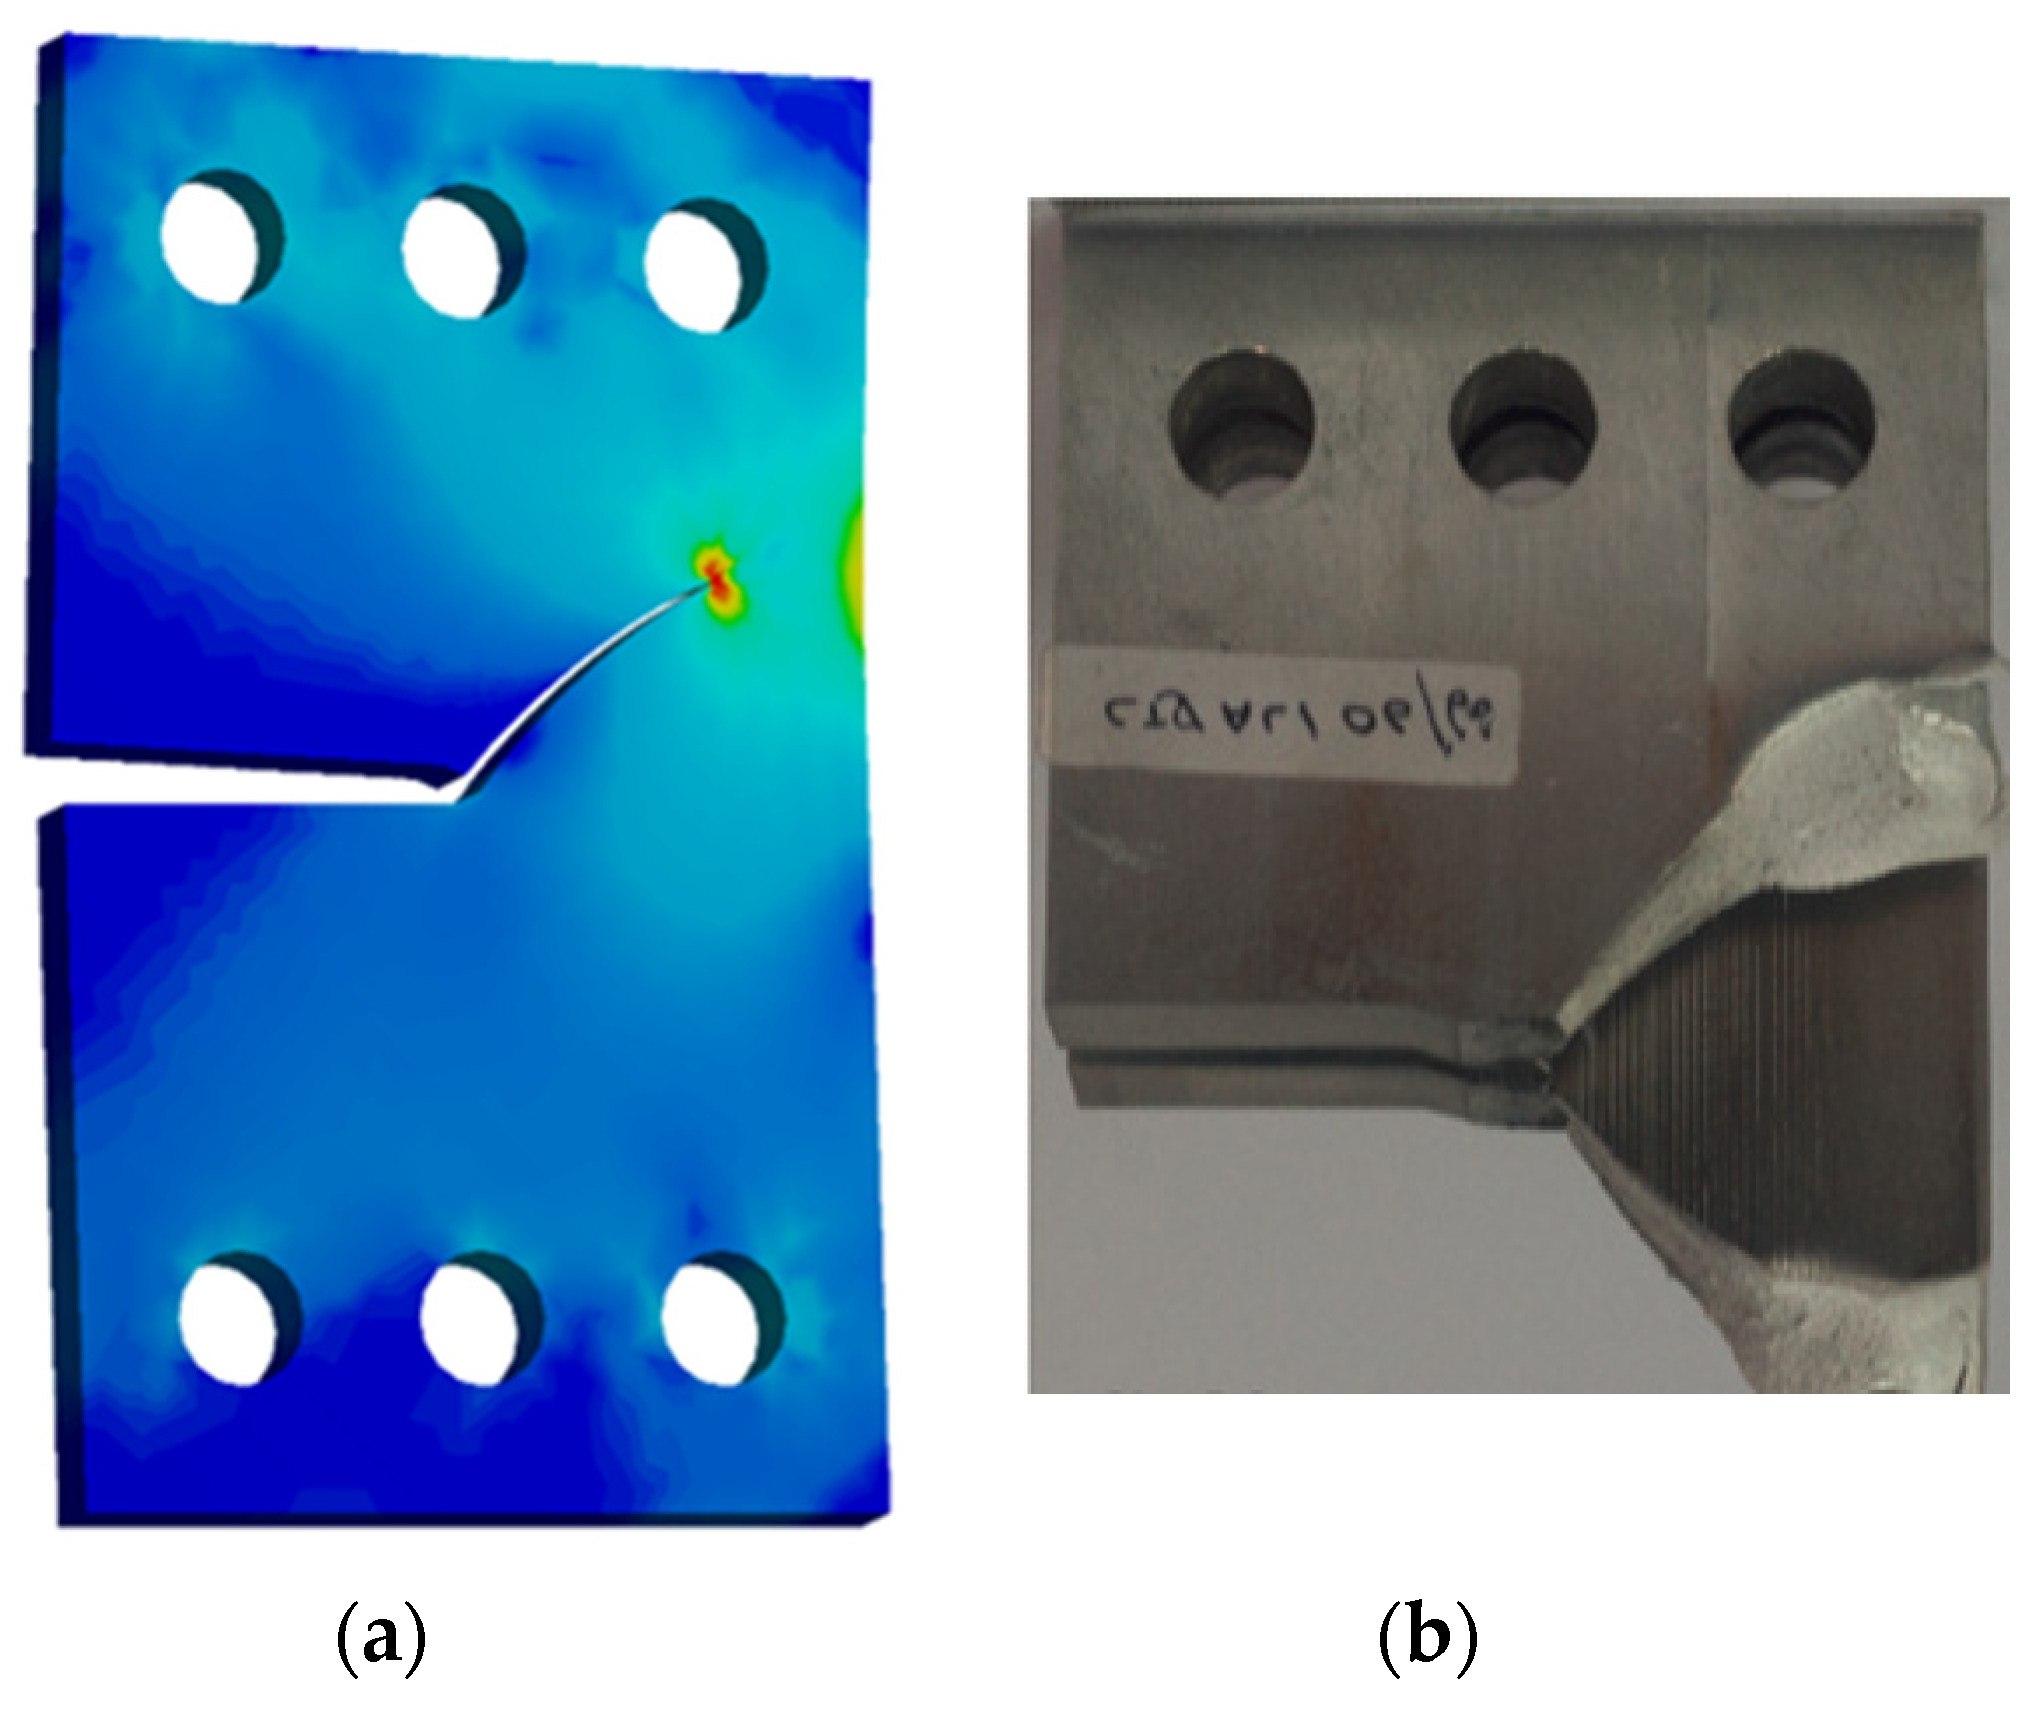
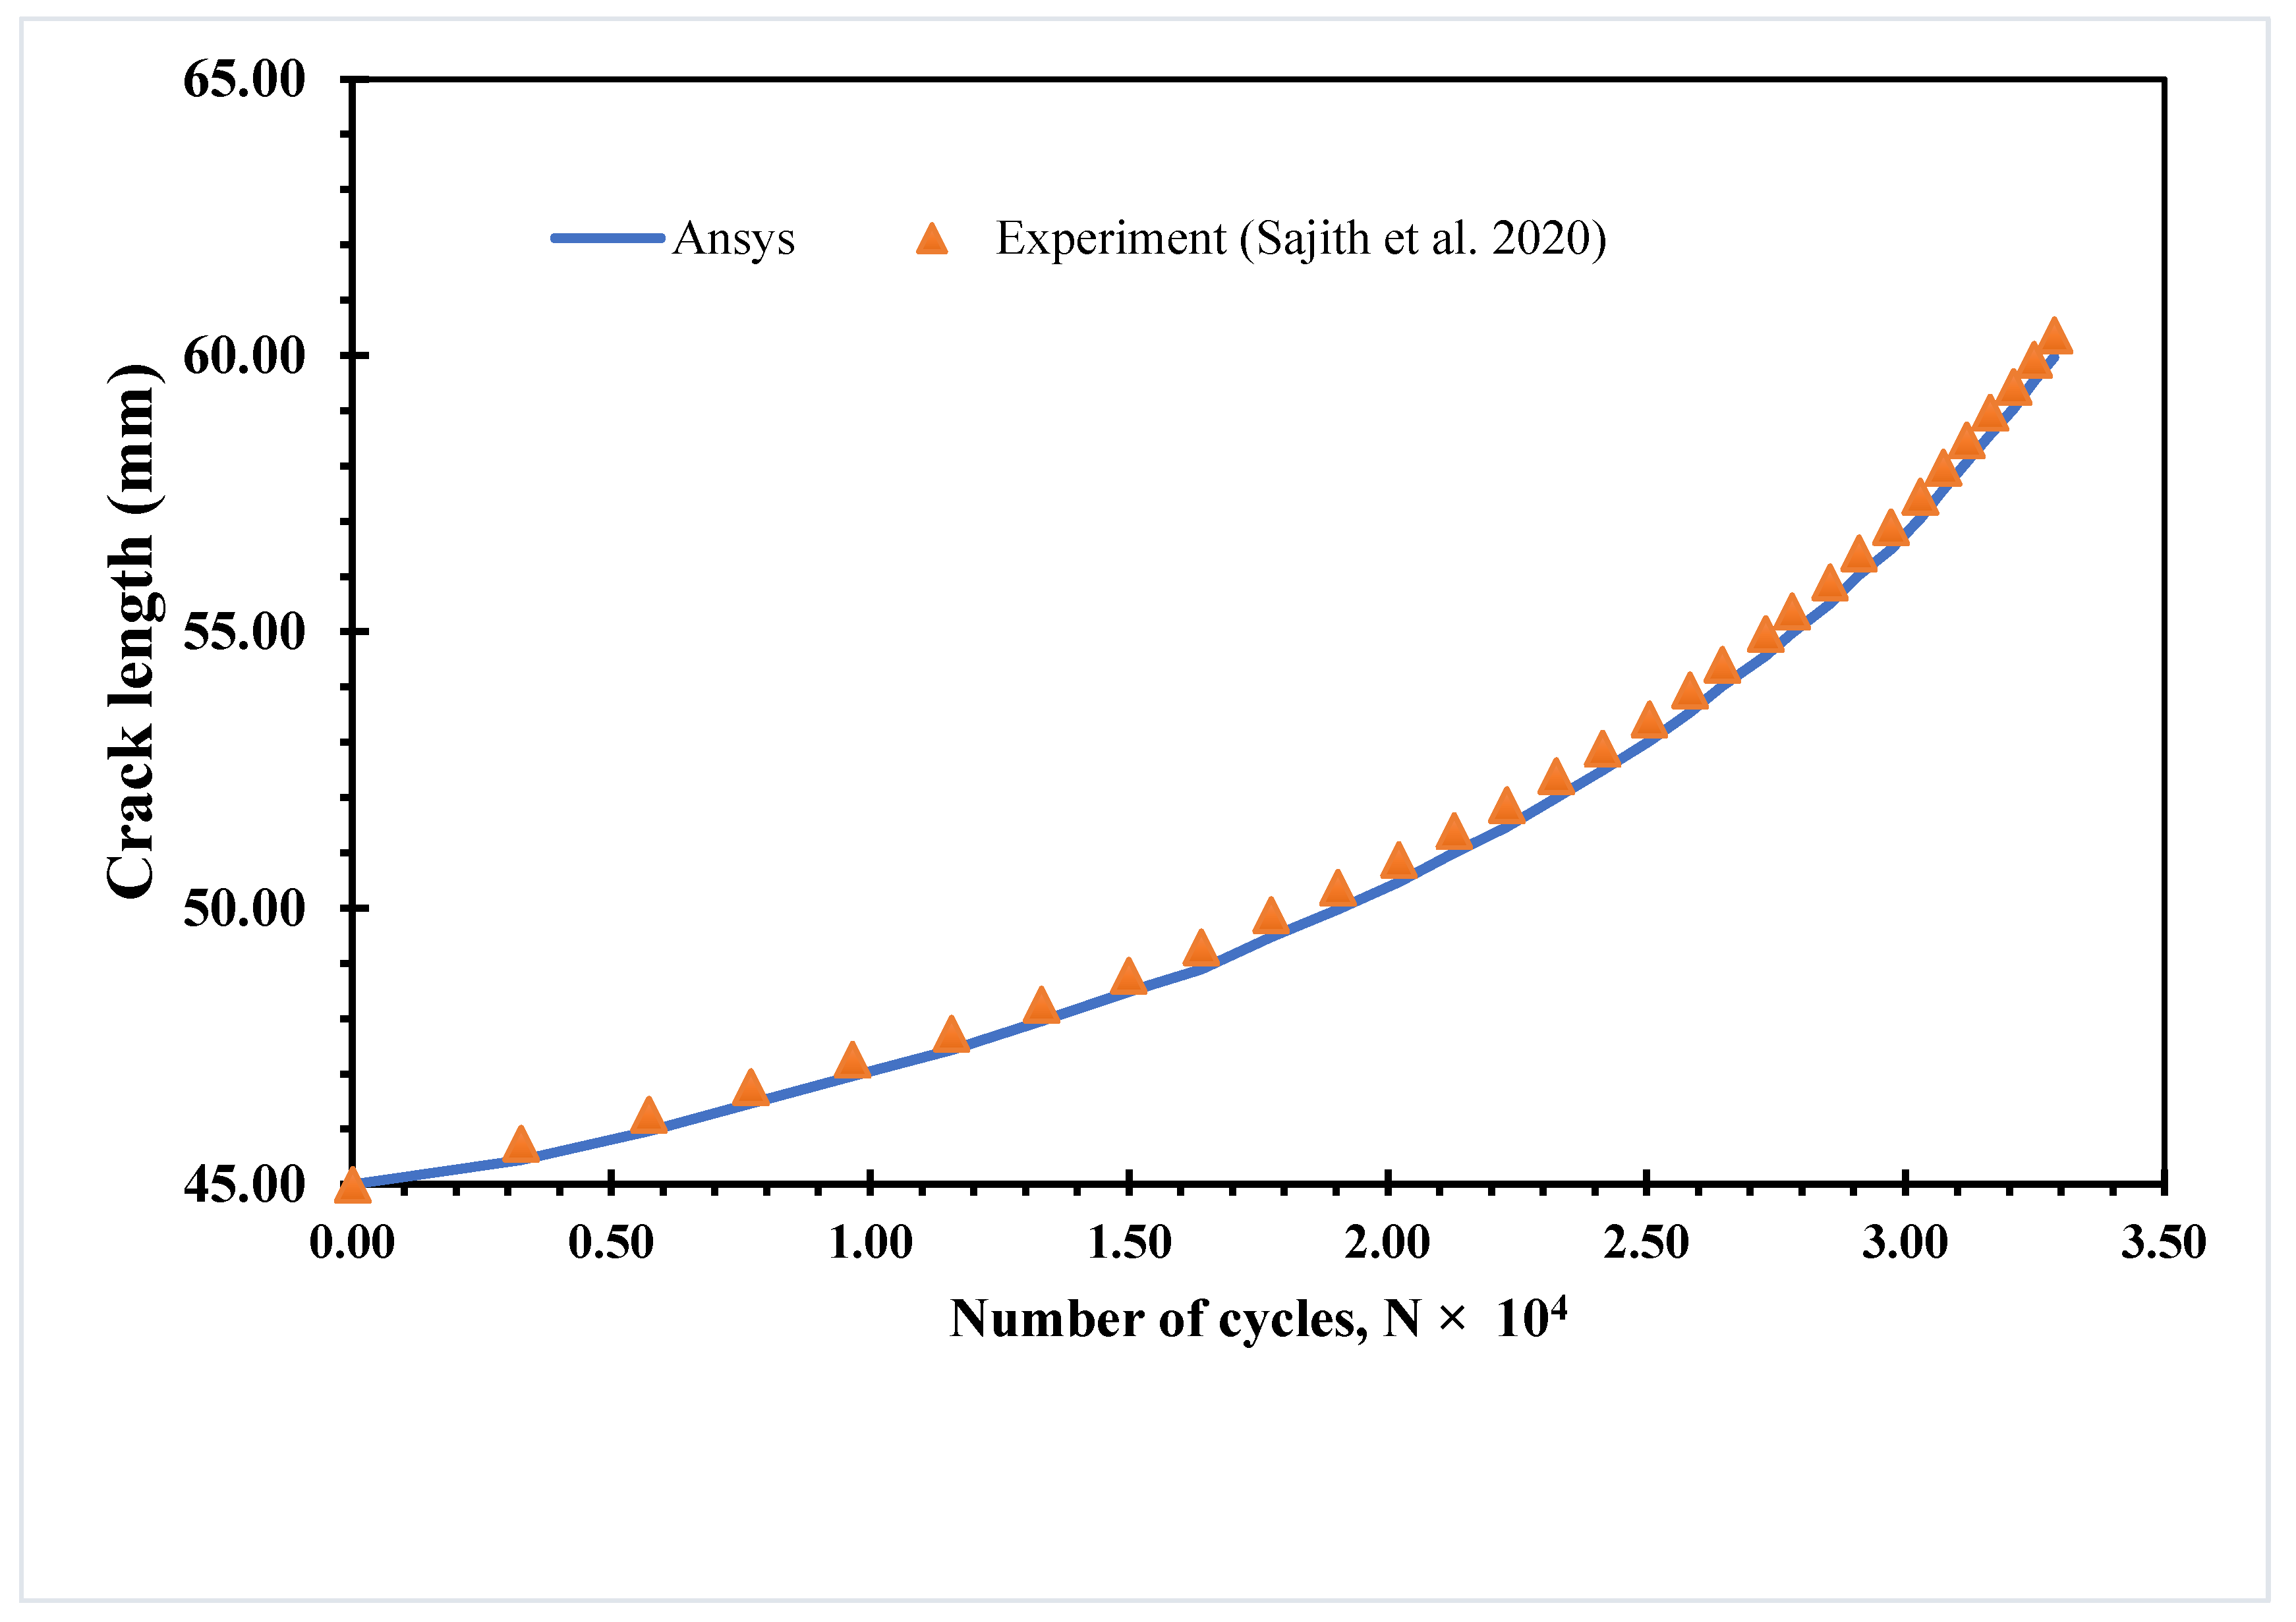
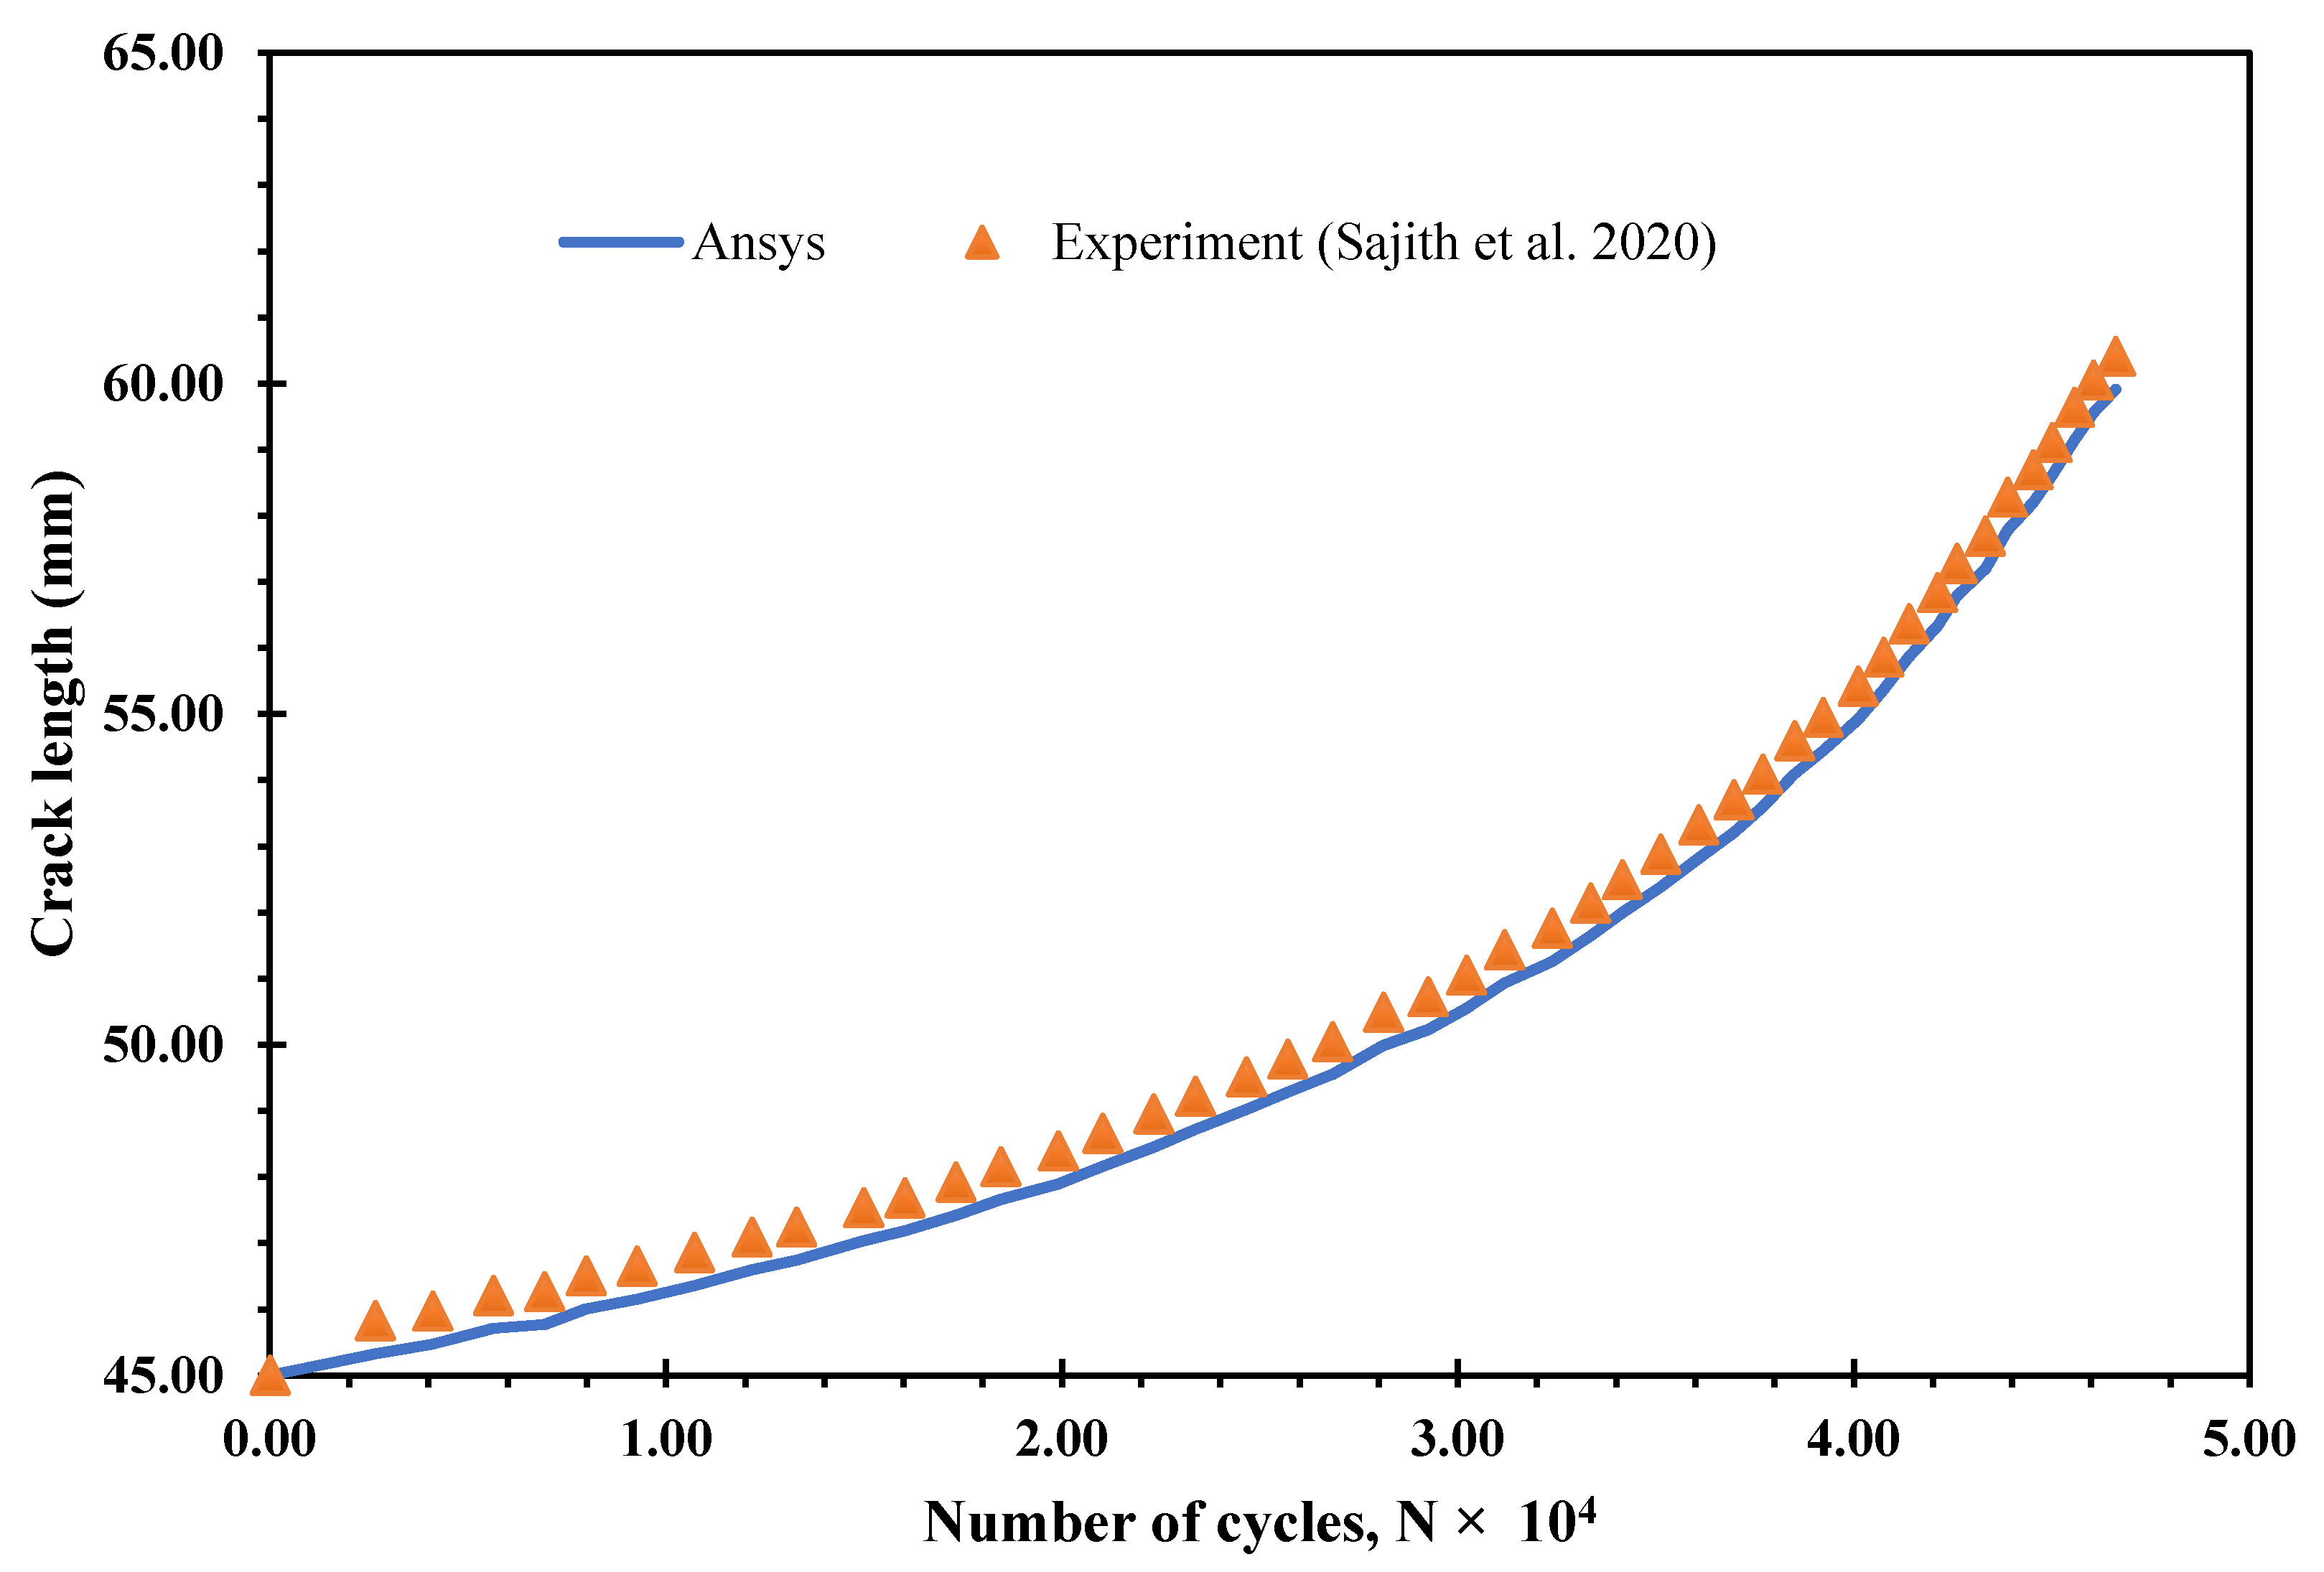
3.1. Single Edge Cracked Plate with a Three-Hole

A rectangular plate with a dimension of 120 mm × 65 mm × 16 mm contains two holes with a diameter of 13 mm near both ends of the plate and a 20-mm hole near the center of the plate, as depicted in Figure 1a. An initial crack of 10 mm is located at the center edge of the plate. The plate is made from Aluminum 7075-T6 with a Young’s Modulus of 71.7 GPa, yield strength of 469 MPa, the ultimate strength of 538 MPa, Paris’ law coefficient, C = 5.27 × 10⁻¹⁰, Paris law exponent, m = 2.947, fracture toughness of 938.25 MPa mm 0.5, and a Poisson’s ratio of 0.33. A 100 N load was applied at the top and bottom holes. The applied force is P = 20 kN with a stress ratio R = 0.1, and the behavior of the material is assumed to linear elastic. The initial mesh generated by Ansys is shown in Figure 1b, with an element size of 1 mm, generating 495,354 nodes and 348,892 elements.
As seen in Figure 2, a straightforward comparison is made of the crack path simulated with ANSYS software on the present study, one from experiment [36], the other three from XFEM [36], XFEM with ABAQUS software [37], and by using XFEM with a controllable crack propagation strategy [38] as displayed in Figure 2a–d. It can be shown that the numerically obtained crack path agrees well with the predicted experimental path.
The effect of thickness on fatigue crack growth parameters was investigated for this geometry using three different thicknesses, 4, 8, and 16. It is noticeable that there no influence of the geometry thickness on the crack extension trajectory. In contrast, there is a more significant influence on the stress and strain distribution as the thickness increased or decreased. Therefore, as thickness increases, the stress–strain field in the crack tip tends to change from the plane–stress state to the plane–strain state, meaning that the crack tip is in the tension state in all three directions and small scope the plastic zone will be limited. As the geometry thickness increases in a plane strain state, critical fracture toughness decreases, and brittle fracture is more likely to occur, which is much more dangerous than ductile fracture.
Consequently, as the geometry thickness is increased, the equivalent Von-Mises stress and the maximum principal stress were decreased with approximately the same ratio as shown in Figure 3. Figure 4 illustrates the equivalent elastic strain distribution for the three different thicknesses and gives additional insight into the effect of thickness on mechanical properties. The equivalent elastic strains decreased as the thickness increased, approximately in the same proportion as the equivalent Von-Mises and maximum principal stresses, as seen in this figure. The stress concentration is greater at the crack tip on the right top of the hole, as shown in Figure 3. The other stress value, which is somewhat lower than the previous value, is concentrated on the mid-right of the hole, providing the continuity of the crack to grow until the right end of the specimen, similar to the experimental study.
Figure 5 and Figure 6 display the estimated values of the two SIFs modes, KI and KII, respectively. As it can be seen in these two figures, the expected values for both KI and KII, while still under plane stress for geometry thicknesses of 4 mm and 8 mm, were very close to each other and much higher than those for 16-mm thickness, which was considered a plane strain condition. The values of KII were increased with negative values, which only affect the crack growth direction to deviate toward the hole.
Since the fatigue life cycles are associated with the equivalent stress intensity factor, the number of cycles changes as Δ K e q changes. The fatigue life cycles for different specimens is as follows: 16 mm start at 9109 and go up to 11,031, 8 mm start at 18,228 and go up to 20,284, 4 mm start at 20,766 and go up to 22,734, as shown in Figure 7.

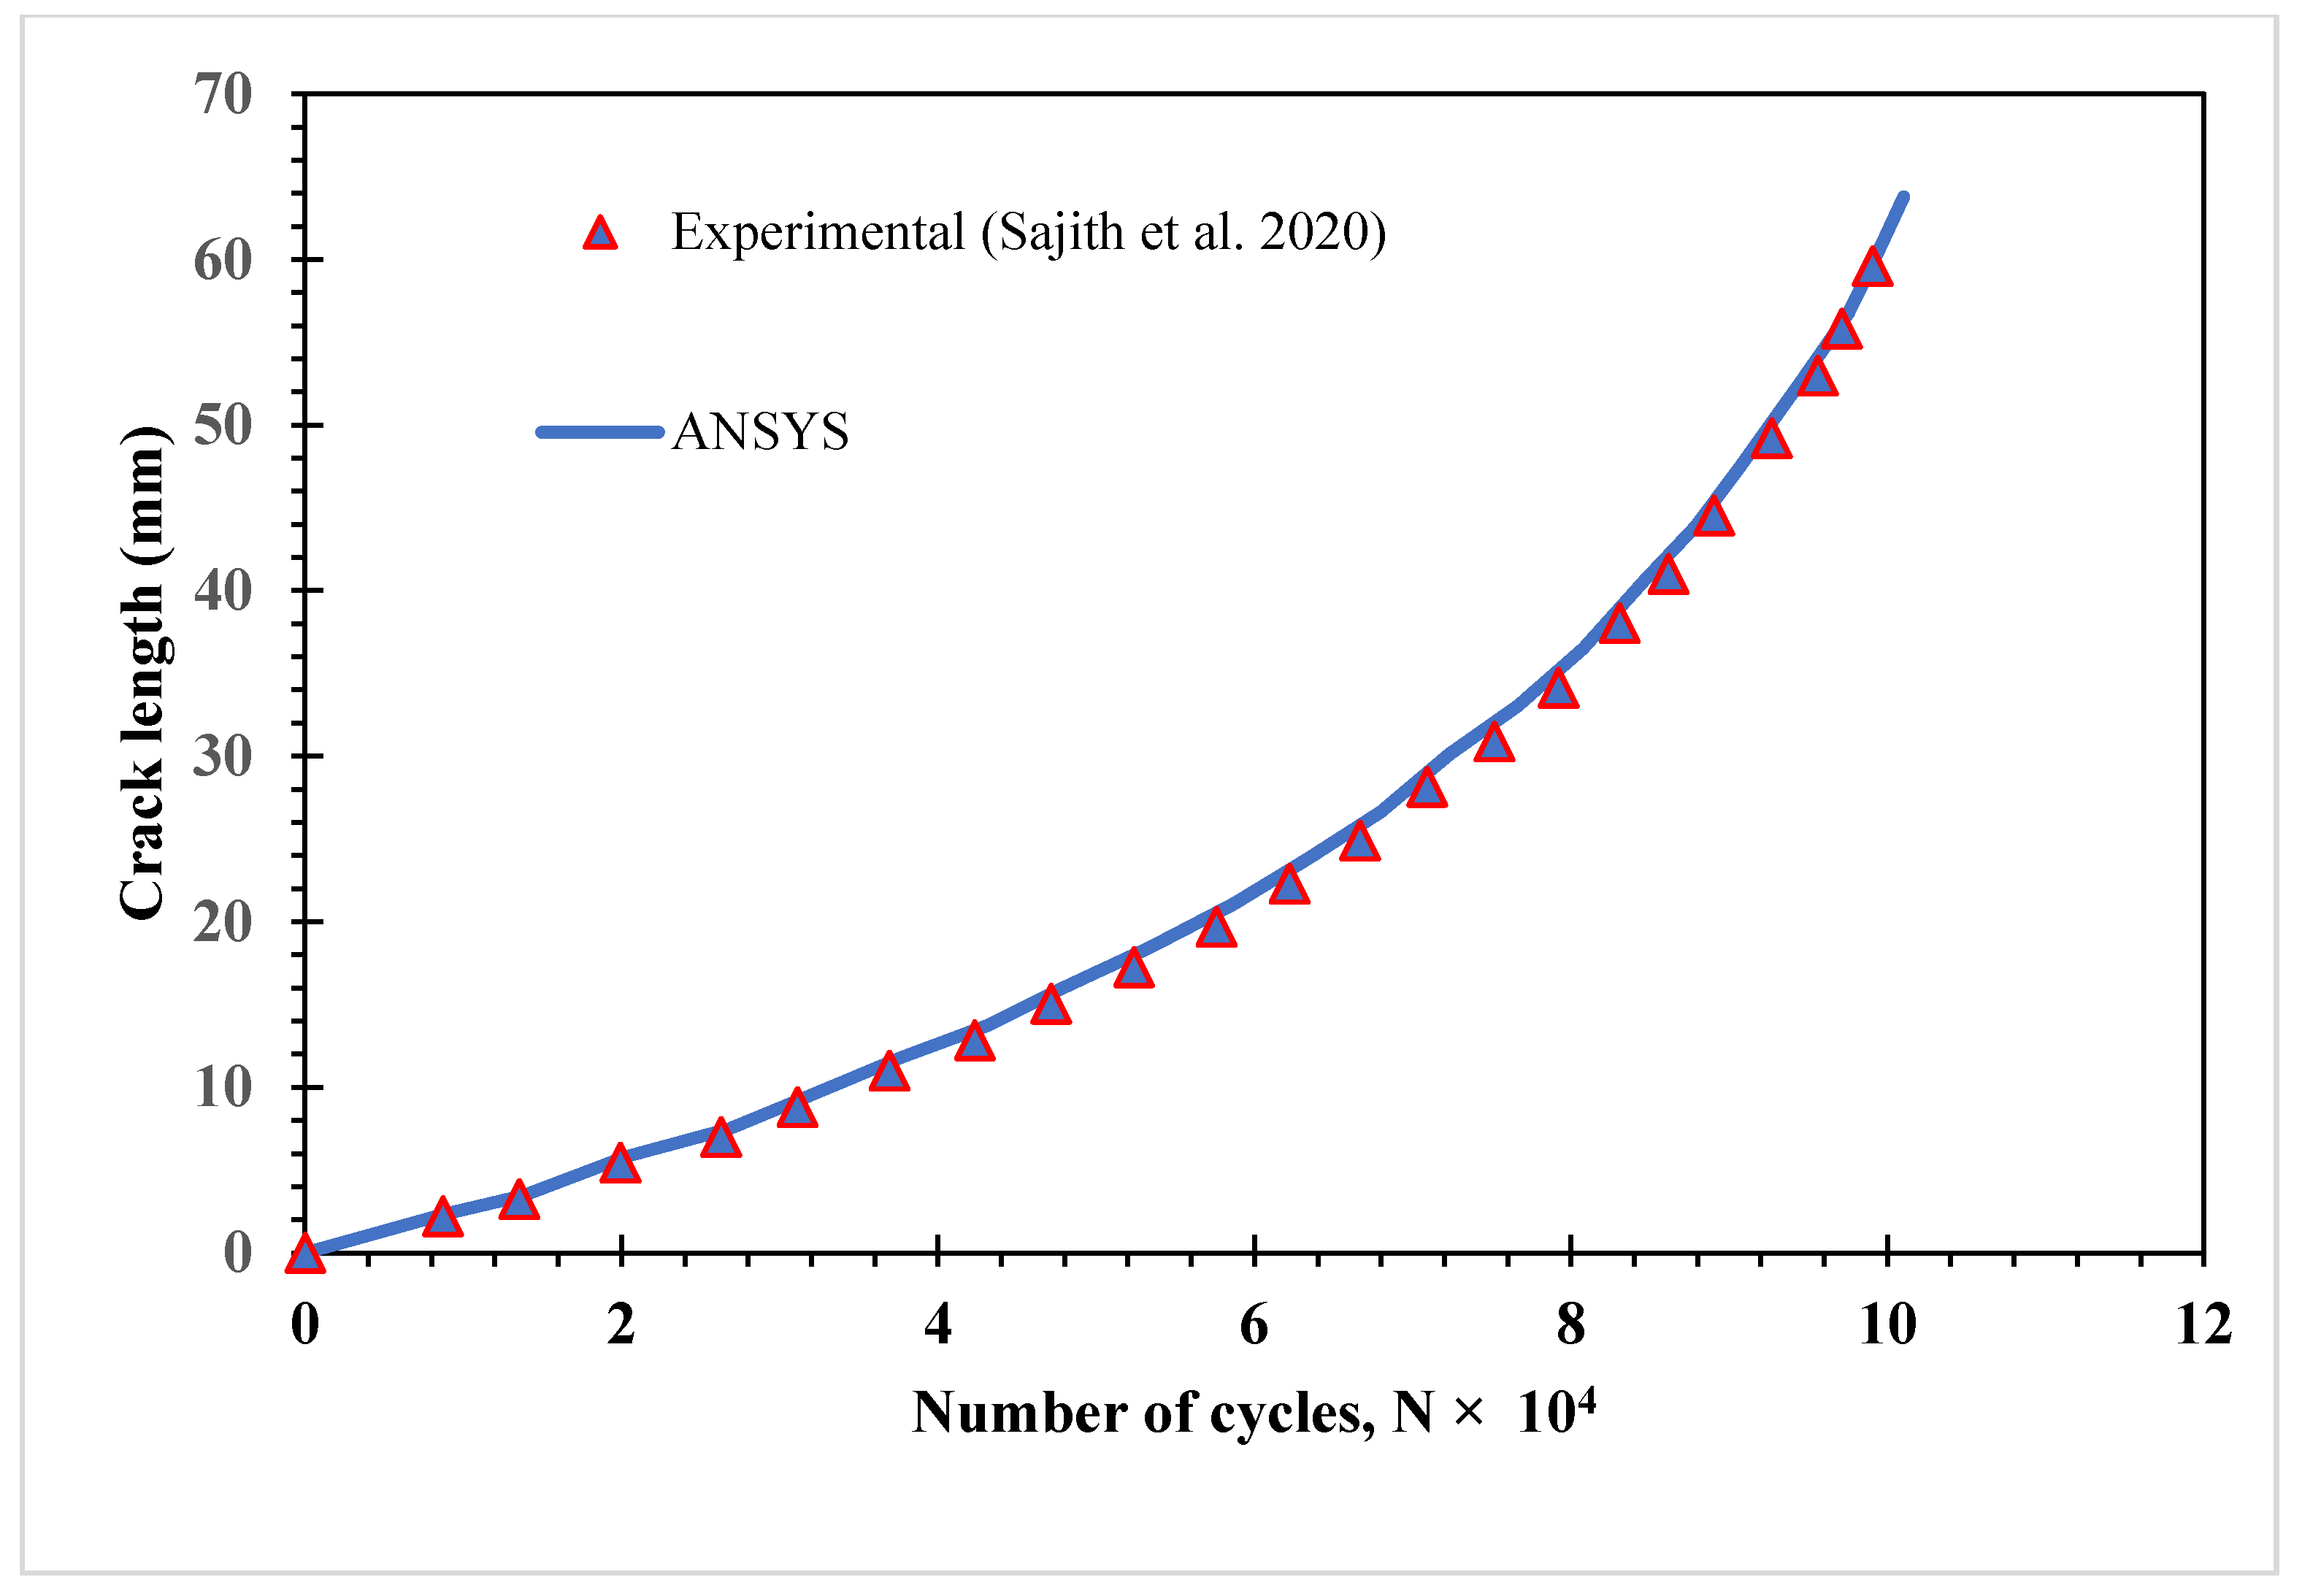
3.2. Compact Tension Shear Specimen (CTS)

Figure 8a shows CTS geometry, while Figure 8b shows its proposed loading angles. The distribution of forces according to the load angles considered in ANSYS is shown in Figure 9. The applied load F is compared with the corresponding loads on other holes of the six holes, based on the given formulations [39]:
F 1 = F 6 = F ( 0.5 cos α + c b sin α )
F 2 = F 5 = F sin α
F 3 = F 4 = F ( 0.5 cos α ( c / b ) sin α )
where c and b are length parameters (c = b = 54 mm) and α is the loading angles as represented by Figure 2. Table 1 shows the results for all loading forces at different loading angles.
The considered material was Aluminum alloy having the following material properties as shown in Table 2:
The simulation is conducted under fatigue loading ratio R = 0.1, applied load F = 14 kN, and the ratio of the initial crack length to the width of the specimen (a/W = 0.5). This simulation considered three different thicknesses, which are 3 mm, 6 mm, and 12 mm, for three angles of loading 30°, 45°, and 60°. The Ansys simulated model shown in Figure 7 is entirely compatible with the experimental work conducted by [40,41,42,43].
Figure 10 shows the typical finite element mesh for each specimen with different thickness associated with the number of nodes and elements simulated by ANSYS. The element size in all simulation was 1 mm, and the total number of nodes and element for the three different thicknesses are shown in Table 3. The geometry is meshed using (Q8) eight-noded isoparametric quadrilateral elements. At each step of the crack propagation, the finite element meshes are completely re-meshed, and the mixed-mode SIFs, KI and KII, are estimated.
The predicted crack growth path for the three different angles and three different thicknesses are shown in Figure 9 through the Von-Mises stress distribution. The effects of loading angles on the crack growth trajectory were demonstrated clearly. Three different thicknesses, 3, 6, and 12, were used to investigate the effect of thickness on fatigue crack propagation for this geometry. The crack growth trajectory was unaffected by the geometrical thickness, whether the thickness increased or decreased. However, there was a significant impact on the stress and strain distribution, as seen in Figure 10 for the corresponding equivalent Von-Mises stress, which decreased with approximately the same ratio as the specimen thicknesses were increased.
Comparisons were made for the predicted crack growth trajectories with different loading angles, as illustrated in Figure 11 with the experimental results obtained by [42] for a 30° loading angle, in Figure 12 with the experimental data reported by [44] for a 45° loading angle, and finally in Figure 13 with the experimental results obtained by [42] for a 60° loading angle. As illustrated in these three figures, the predicted crack extension trajectories were similar to the experimental pathways.
The number of cycles estimated in this investigation for different loading angles of 30°, 45°, and 60° is compared to experimental data reported by [42,44] under mixed-mode loading (I/II), resulting in significant agreements, as shown in Figure 14, Figure 15 and Figure 16.

4. Conclusions

In this study, mixed-mode (I/II) fatigue crack growth investigations were performed on a single edge cracked plate with three holes and different thicknesses as well as for a CTS specimen for different thicknesses and loading angles. It was observed that the geometry thickness did not affect the crack growth trajectory. In contrast, when the thickness of the specimen increased or decreased, it had a more significant impact on the stress and strain distribution. As a result, the stress–strain field at the crack tip tended to move from the plane stress state to the plane strain state as thickness increases, asserting that the crack tip is under tension in all three dimensions and the plastic zone will be constrained in a small scope. Accordingly, as the geometry thickness is increased, the equivalent Von-Mises stress and the maximum principal stress were decreased with approximately the same ratio of increasing the thickness. The fatigue crack grew toward the hole, as predicted, due to unbalanced stresses at the crack tip induced by the hole. In these simulation sequences, holes act as a crack stopper and attract a crack trajectory to grow. These results confirm the algorithm’s ability to identify crack-stopping holes in damage tolerance designs. The predicted fatigue crack propagation paths, stress intensity factors, and fatigue life cycles were validated by other researchers’ experimental and numerical results.

Funding

This research received no external funding.

Institutional Review Board Statement

Not applicable.

Informed Consent Statement

Not applicable.

Data Availability Statement

Not applicable.

Conflicts of Interest

The author declare no conflict of interest.

References

  1. Tada, H.; Paris, P.C.; Irwin, G.R.; Tada, H. The Stress Analysis of Cracks Handbook; ASME Press: New York, NY, USA, 2000; Volume 130. [Google Scholar]
  2. Dirik, H.; Yalçinkaya, T. Crack path and life prediction under mixed mode cyclic variable amplitude loading through XFEM. Int. J. Fatigue 2018, 114, 34–50. [Google Scholar] [CrossRef]
  3. Sih, G.; Liebowitz, H. Mathematical Fundamentals. In Fracture; Academic Press: New York, NY, USA, 1968; Volume 2, pp. 67–190. [Google Scholar]
  4. Hellan, K. Introduction to Fracture Mechanics; McGraw-Hill: New York, NY, USA, 1985. [Google Scholar]
  5. Barsom, J.; Rolfe, S. Fracture and Fatigue in Structure: Application of Fracture Mechanics; American Society for Testing and Materials: Philadelphia, PA, USA, 1999. [Google Scholar]
  6. Broek, D. Elementary Engineering Fracture Mechanics; Springer Science & Business Media: Berlin, Germany, 2012. [Google Scholar]
  7. Belytschko, T.; Black, T. Elastic crack growth in finite elements with minimal remeshing. Int. J. Numer. Methods Eng. 1999, 45, 601–620. [Google Scholar] [CrossRef]
  8. Huynh, H.D.; Nguyen, M.N.; Cusatis, G.; Tanaka, S.; Bui, T.Q. A polygonal XFEM with new numerical integration for linear elastic fracture mechanics. Eng. Fract. Mech. 2019, 213, 241–263. [Google Scholar] [CrossRef]
  9. Surendran, M.; Natarajan, S.; Palani, G.; Bordas, S.P. Linear smoothed extended finite element method for fatigue crack growth simulations. Eng. Fract. Mech. 2019, 206, 551–564. [Google Scholar] [CrossRef]
  10. Rozumek, D.; Marciniak, Z.; Lesiuk, G.; Correia, J. Mixed mode I/II/III fatigue crack growth in S355 steel. Procedia Struct. Integr. 2017, 5, 896–903. [Google Scholar] [CrossRef]
  11. Giannella, V.; Dhondt, G.; Kontermann, C.; Citarella, R. Combined static-cyclic multi-axial crack propagation in cruciform specimens. Int. J. Fatigue 2019, 123, 296–307. [Google Scholar] [CrossRef]
  12. Giannella, V.; Fellinger, J.; Perrella, M.; Citarella, R. Fatigue life assessment in lateral support element of a magnet for nuclear fusion experiment “Wendelstein 7-X”. Eng. Fract. Mech. 2017, 178, 243–257. [Google Scholar] [CrossRef] [Green Version]
  13. Alshoaibi, A.M. Numerical Modeling of Crack Growth under Mixed-Mode Loading. Applied Sciences 2021, 11, 2975. [Google Scholar] [CrossRef]
  14. Shlyannikov, V.; Yarullin, R.; Yakovlev, M.; Giannella, V.; Citarella, R. Mixed-mode crack growth simulation in aviation engine compressor disk. Eng. Fract. Mech. 2021, 246, 107617. [Google Scholar] [CrossRef]
  15. Sih, G.; Barthelemy, B. Mixed mode fatigue crack growth predictions. Eng. Fract. Mech. 1980, 13, 439–451. [Google Scholar] [CrossRef]
  16. Sih, G.; Moyer, E., Jr. Path dependent nature of fatigue crack growth. Eng. Fract. Mech. 1983, 17, 269–280. [Google Scholar] [CrossRef]
  17. Giannella, V. Stochastic approach to fatigue crack-growth simulation for a railway axle under input data variability. Int. J. Fatigue 2021, 144, 106044. [Google Scholar] [CrossRef]
  18. Alshoaibi, A.M. Finite element procedures for the numerical simulation of fatigue crack propagation under mixed mode loading. Struct. Eng. Mech. 2010, 35, 283–299. [Google Scholar] [CrossRef]
  19. Alshoaibi, A.M. Comprehensive Comparisons of Two and Three Dimensional Numerical Estimation of Stress Intensity Factors and Crack propagation in Linear Elastic Analysis. Int. J. Integr. Eng. 2019, 11, 45–52. [Google Scholar] [CrossRef] [Green Version]
  20. Alshoaibi, A.M.; Fageehi, Y.A. 2D finite element simulation of mixed mode fatigue crack propagation for CTS specimen. J. Mater. Res. Technol. 2020, 9, 7850–7861. [Google Scholar] [CrossRef]
  21. Fageehi, Y.A.; Alshoaibi, A.M. Numerical Simulation of Mixed-Mode Fatigue Crack Growth for Compact Tension Shear Specimen. Adv. Mater. Sci. Eng. 2020, 2020. [Google Scholar] [CrossRef] [Green Version]
  22. Chen, H.; Wang, Q.; Zeng, W.; Liu, G.; Sun, J.; He, L.; Bui, T.Q. Dynamic brittle crack propagation modeling using singular edge-based smoothed finite element method with local mesh rezoning. Eur. J. Mech. A Solids 2019, 76, 208–223. [Google Scholar] [CrossRef]
  23. Gomes, G.; Miranda, A.C. Analysis of crack growth problems using the object-oriented program bemcracker2D. Frat. Integr. Strutt. 2018, 12, 67–85. [Google Scholar] [CrossRef] [Green Version]
  24. Fageehi, Y.A.; Alshoaibi, A.M. Nonplanar Crack Growth Simulation of Multiple Cracks Using Finite Element Method. Adv. Mater. Sci. Eng. 2020, 2020. [Google Scholar] [CrossRef] [Green Version]
  25. Mirsayar, M. A generalized criterion for fatigue crack growth in additively manufactured materials–Build orientation and geometry effects. Int. J. Fatigue 2021, 145, 106099. [Google Scholar] [CrossRef]
  26. Paris, P.; Erdogan, F. A critical analysis of crack propagation laws. J. Basic Eng. 1963, 85, 528–533. [Google Scholar] [CrossRef]
  27. Coffin, L. Cyclic Deformation and Fatigue of Metals; Fatigue and Endurance of Metals [Russian translation]; USSR: Moscow, Russia, 1963; pp. 257–272. [Google Scholar]
  28. Wöhler, A. Versuche zur Ermittlung der auf die Eisenbahnwagenachsen einwirkenden Kräfte und die Widerstandsfähigkeit der Wagen-Achsen. Z. Bauwes. 1860, 10, 583–614. [Google Scholar]
  29. Wawrzynek, P.; Carter, B.; Banks-Sills, L. The M-Integral for Computing Stress Intensity Factors in Generally Anisotropic Materials; National Aeronautics and Space Administration, Marshall Space Flight Center: Huntsville, AL, USA, 2005. [Google Scholar]
  30. Citarella, R.; Giannella, V.; Lepore, M.; Dhondt, G. Dual boundary element method and finite element method for mixed-mode crack propagation simulations in a cracked hollow shaft. Fatigue Fract. Eng. Mater. Struct. 2018, 41, 84–98. [Google Scholar] [CrossRef]
  31. Dhondt, G.; Hackenberg, H.-P. Use of a rotation-invariant linear strain measure for linear elastic crack propagation calculations. Eng. Fract. Mech. 2021, 247, 107634. [Google Scholar] [CrossRef]
  32. Bjørheim, F. Practical Comparison of Crack Meshing in ANSYS Mechanical APDL 19.2; University of Stavanger: Stavanger, Norway, 2019. [Google Scholar]
  33. ANSYS. Academic Research Mechanical, Release 19.2, Help System. In Coupled Field Analysis Guide; ANSYS, Inc.: Canonsburg, PA, USA, 2020. [Google Scholar]
  34. Walters, M.C.; Paulino, G.H.; Dodds, R.H., Jr. Interaction integral procedures for 3-D curved cracks including surface tractions. Eng. Fract. Mech. 2005, 72, 1635–1663. [Google Scholar] [CrossRef]
  35. Anderson, T.L. Fracture Mechanics: Fundamentals and Applications; CRC Press: Boca Raton, FL, USA, 2017. [Google Scholar]
  36. Giner, E.; Sukumar, N.; Tarancón, J.; Fuenmayor, F. An Abaqus implementation of the extended finite element method. Eng. Fract. Mech. 2009, 76, 347–368. [Google Scholar] [CrossRef] [Green Version]
  37. Malekan, M.; Carvalho, H. Analysis of a main fatigue crack interaction with multiple micro-cracks/voids in a compact tension specimen repaired by stop-hole technique. J. Strain Anal. Eng. Des. 2018, 53, 648–662. [Google Scholar] [CrossRef]
  38. Cheng, Z.; Wang, H. How to control the crack to propagate along the specified path feasibly? Comput. Methods Appl. Mech. Eng. 2018, 336, 554–577. [Google Scholar] [CrossRef] [Green Version]
  39. Richard, H. Fracture Predictions for Cracks Exposed to Superimposed Normal and Shear Stresses; International Nuclear Information System: Vienna, Austria, 1985. [Google Scholar]
  40. Antunes, F.V.; Branco, R.; Ferreira, J.A.M.; Borrego, L. Stress Intensity Factor Solutions for CTS Mixed Mode Specimen. Frat. Integr. Strutt. 2019, 13, 676–692. [Google Scholar] [CrossRef]
  41. DEMIR, O.; Ayhan, A.O.; Sedat, I.; LEKESIZ, H. Evaluation of mixed mode-I/II criteria for fatigue crack propagation using experiments and modeling. Chin. J. Aeronaut. 2018, 31, 1525–1534. [Google Scholar] [CrossRef]
  42. Sajith, S.; Murthy, K.; Robi, P. Experimental and numerical investigation of mixed mode fatigue crack growth models in aluminum 6061-T6. Int. J. Fatigue 2020, 130, 105285. [Google Scholar] [CrossRef]
  43. Demir, O.; Ayhan, A.O.; İriç, S. A new specimen for mixed mode-I/II fracture tests: Modeling, experiments and criteria development. Eng. Fract. Mech. 2017, 178, 457–476. [Google Scholar] [CrossRef]
  44. Sajith, S.; Shukla, S.; Murthy, K.; Robi, P. Mixed mode fatigue crack growth studies in AISI 316 stainless steel. Eur. J. Mech. A Solids 2020, 80, 103898. [Google Scholar] [CrossRef]
Figure 1. (a) 2D and 3D geometric Details of the single edge cracked plate with a three-hole, (b) Initial mesh.
Applsci 11 05953 g001
Figure 2. Comparison of crack growth trajectory, (a) present study, (b) experimental observation [36], (c) numerical [36], (d) numerical [37], and (e) numerical [38].
Applsci 11 05953 g002
Figure 3. Equivalent Von-Mises stress and maximum principal stress distribution with different geometry thickness.
Applsci 11 05953 g003aApplsci 11 05953 g003b
Figure 4. Equivalent elastic strain distribution with different geometry thicknesses of 4 mm, 8 mm, and 16 mm, respectively.
Applsci 11 05953 g004
Figure 5. Predicted values of KI with different thicknesses.
Applsci 11 05953 g005
Figure 6. Predicted values of KII with different thicknesses.
Applsci 11 05953 g006
Figure 7. Fatigue life cycles versus crack extension for various specimen thicknesses.
Applsci 11 05953 g007
Figure 8. (a) Geometrical details for CTS specimen and (b) loading angles.
Applsci 11 05953 g008
Figure 9. Initial mesh for CTS with different thicknesses: (a) t = 12 mm, (b) t = 6 mm, and (c) t = 3 mm.
Applsci 11 05953 g009
Figure 10. Distribution of the Von-Mises stress for the predicted crack growth path with different loading angles and thicknesses.
Applsci 11 05953 g010
Figure 11. Predicted crack growth trajectory for 30° loading angle: (a) Present study and (b) Experimental [42].
Applsci 11 05953 g011
Figure 12. Predicted crack growth trajectory for 45° loading angle: (a) Present study and (b) [44].
Applsci 11 05953 g012
Figure 13. Predicted crack growth trajectory for 60° loading angle: (a) Present study and (b) Experimental [42].
Applsci 11 05953 g013
Figure 14. Comparison between experimental [42] and simulated fatigue life for loading angle 30°.
Applsci 11 05953 g014
Figure 15. Comparison between experimental [44] and simulated fatigue life for loading angle 45°.
Applsci 11 05953 g015
Figure 16. Comparison between experimental [42] and simulated fatigue life for loading angle 60°.
Applsci 11 05953 g016
Table 1. Forces F1 to F6 as a function of loading angle α.
αF2 = F5F1 = F6F3 = F4
300.5 F0.933 F–0.067 F
450.707 F1.061 F–0.354 F
600.866 F1.116 F−0.616 F
Table 2. Properties of the considered material.
PropertiesMetric Units Value
Elasticity Modulus, E74 GPa
Poisson’s ratio, υ0.33
Yield strength, σy517 MPa
Ultimate strength, σu579 MPa
Threshold SIF, Kth3.15 MPa m
Fracture toughness, KIC32.95 MPa m
Paris’ law coefficient, C4.3378 × 10−7
Paris law exponent, m2.6183
Table 3. Total number of nodes and element for each specimen with different thicknesses.
t = 12 mmt = 6 mmt = 3 mm
No. of nodes897,045623,867443,766
No. of elements615,479419,579288,809
Publisher’s Note: MDPI stays neutral with regard to jurisdictional claims in published maps and institutional affiliations.

