
Evaluation of the Thermal Performance and Energy Efficiency of CRAC Equipment through Mathematical Modeling Using a New Index COP WEUED


Abstract
:1. Introduction
- 5.3 billion internet users (66% of the estimated population in 2023).
- 3.6 global devices and connections per capita.
- Average global speed of fixed broadband of 110 Mbps.
- In North America, 92% of the population will use the Internet.
2. Current Methodology (ASHRAE 90.1-2019 Standard)
- All ratings are at standard atmospheric pressure.
- For the NetSCOP calculation, add allowance for cooling tower fan(s) and heat rejection loop, water pump power input in kW to the unit total input in kW = 5% of the unit net sensible capacity.
- For the NetSCOP calculation, add allowance for dry cooler fan(s) and heat rejection loop glycol pump power input in kW to the unit total input in kW = 7.5% of the unit net sensible capacity.
- For the NetSCOP calculation, add allowance for chilled water pump power input in kW to unit total input in kW (See Equation (1)).
- A: COP at 100% capacity, (kW/kW).
- B: COP at 75% capacity, (kW/kW).
- C: COP at 50% capacity, (kW/kW).
- D: COP at 25% capacity, (kW/kW).
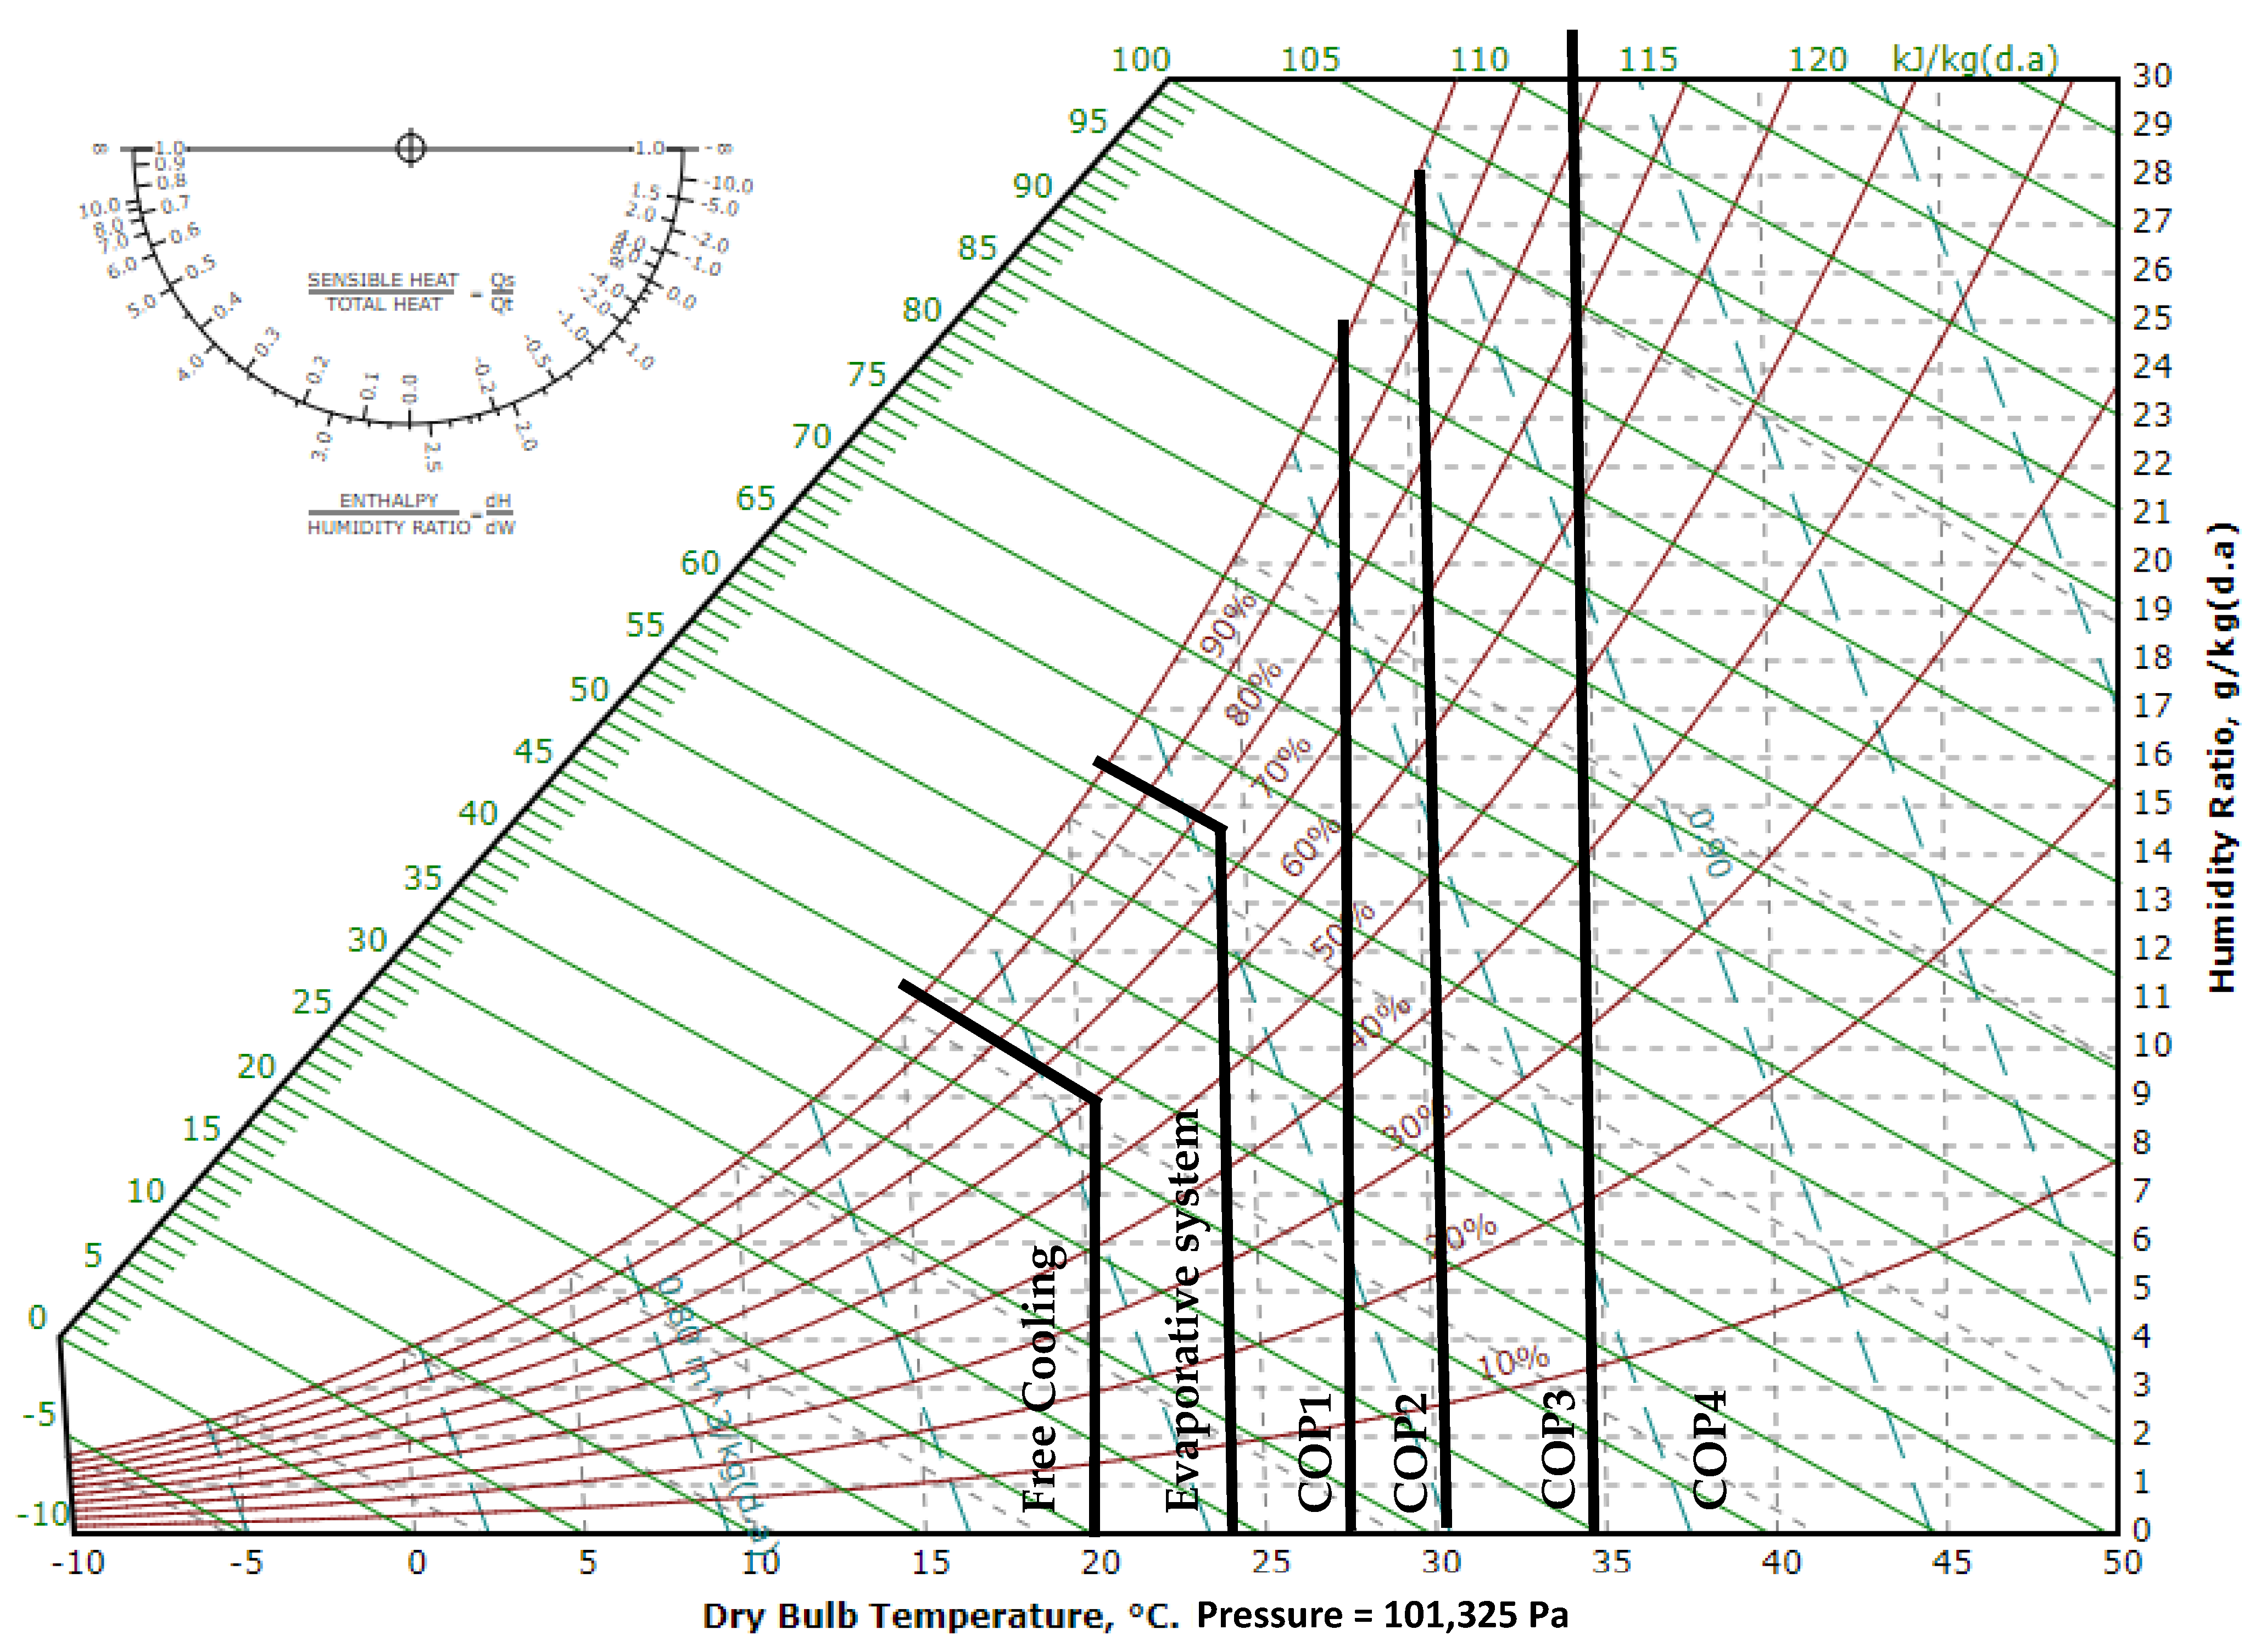
- When the outside air temperature is below 20 °C and the enthalpy is below 42.7979 kJ/kg, only free cooling will be used.
- When the temperature is between 15 and 24 °C and the enthalpy is from 42.7979 to 55.8233 kJ/kg, the evaporative system will be used.
- When the temperature is above 20 °C and the enthalpy is over 55.8233 kJ/kg, the normal system will be used under the following conditions:
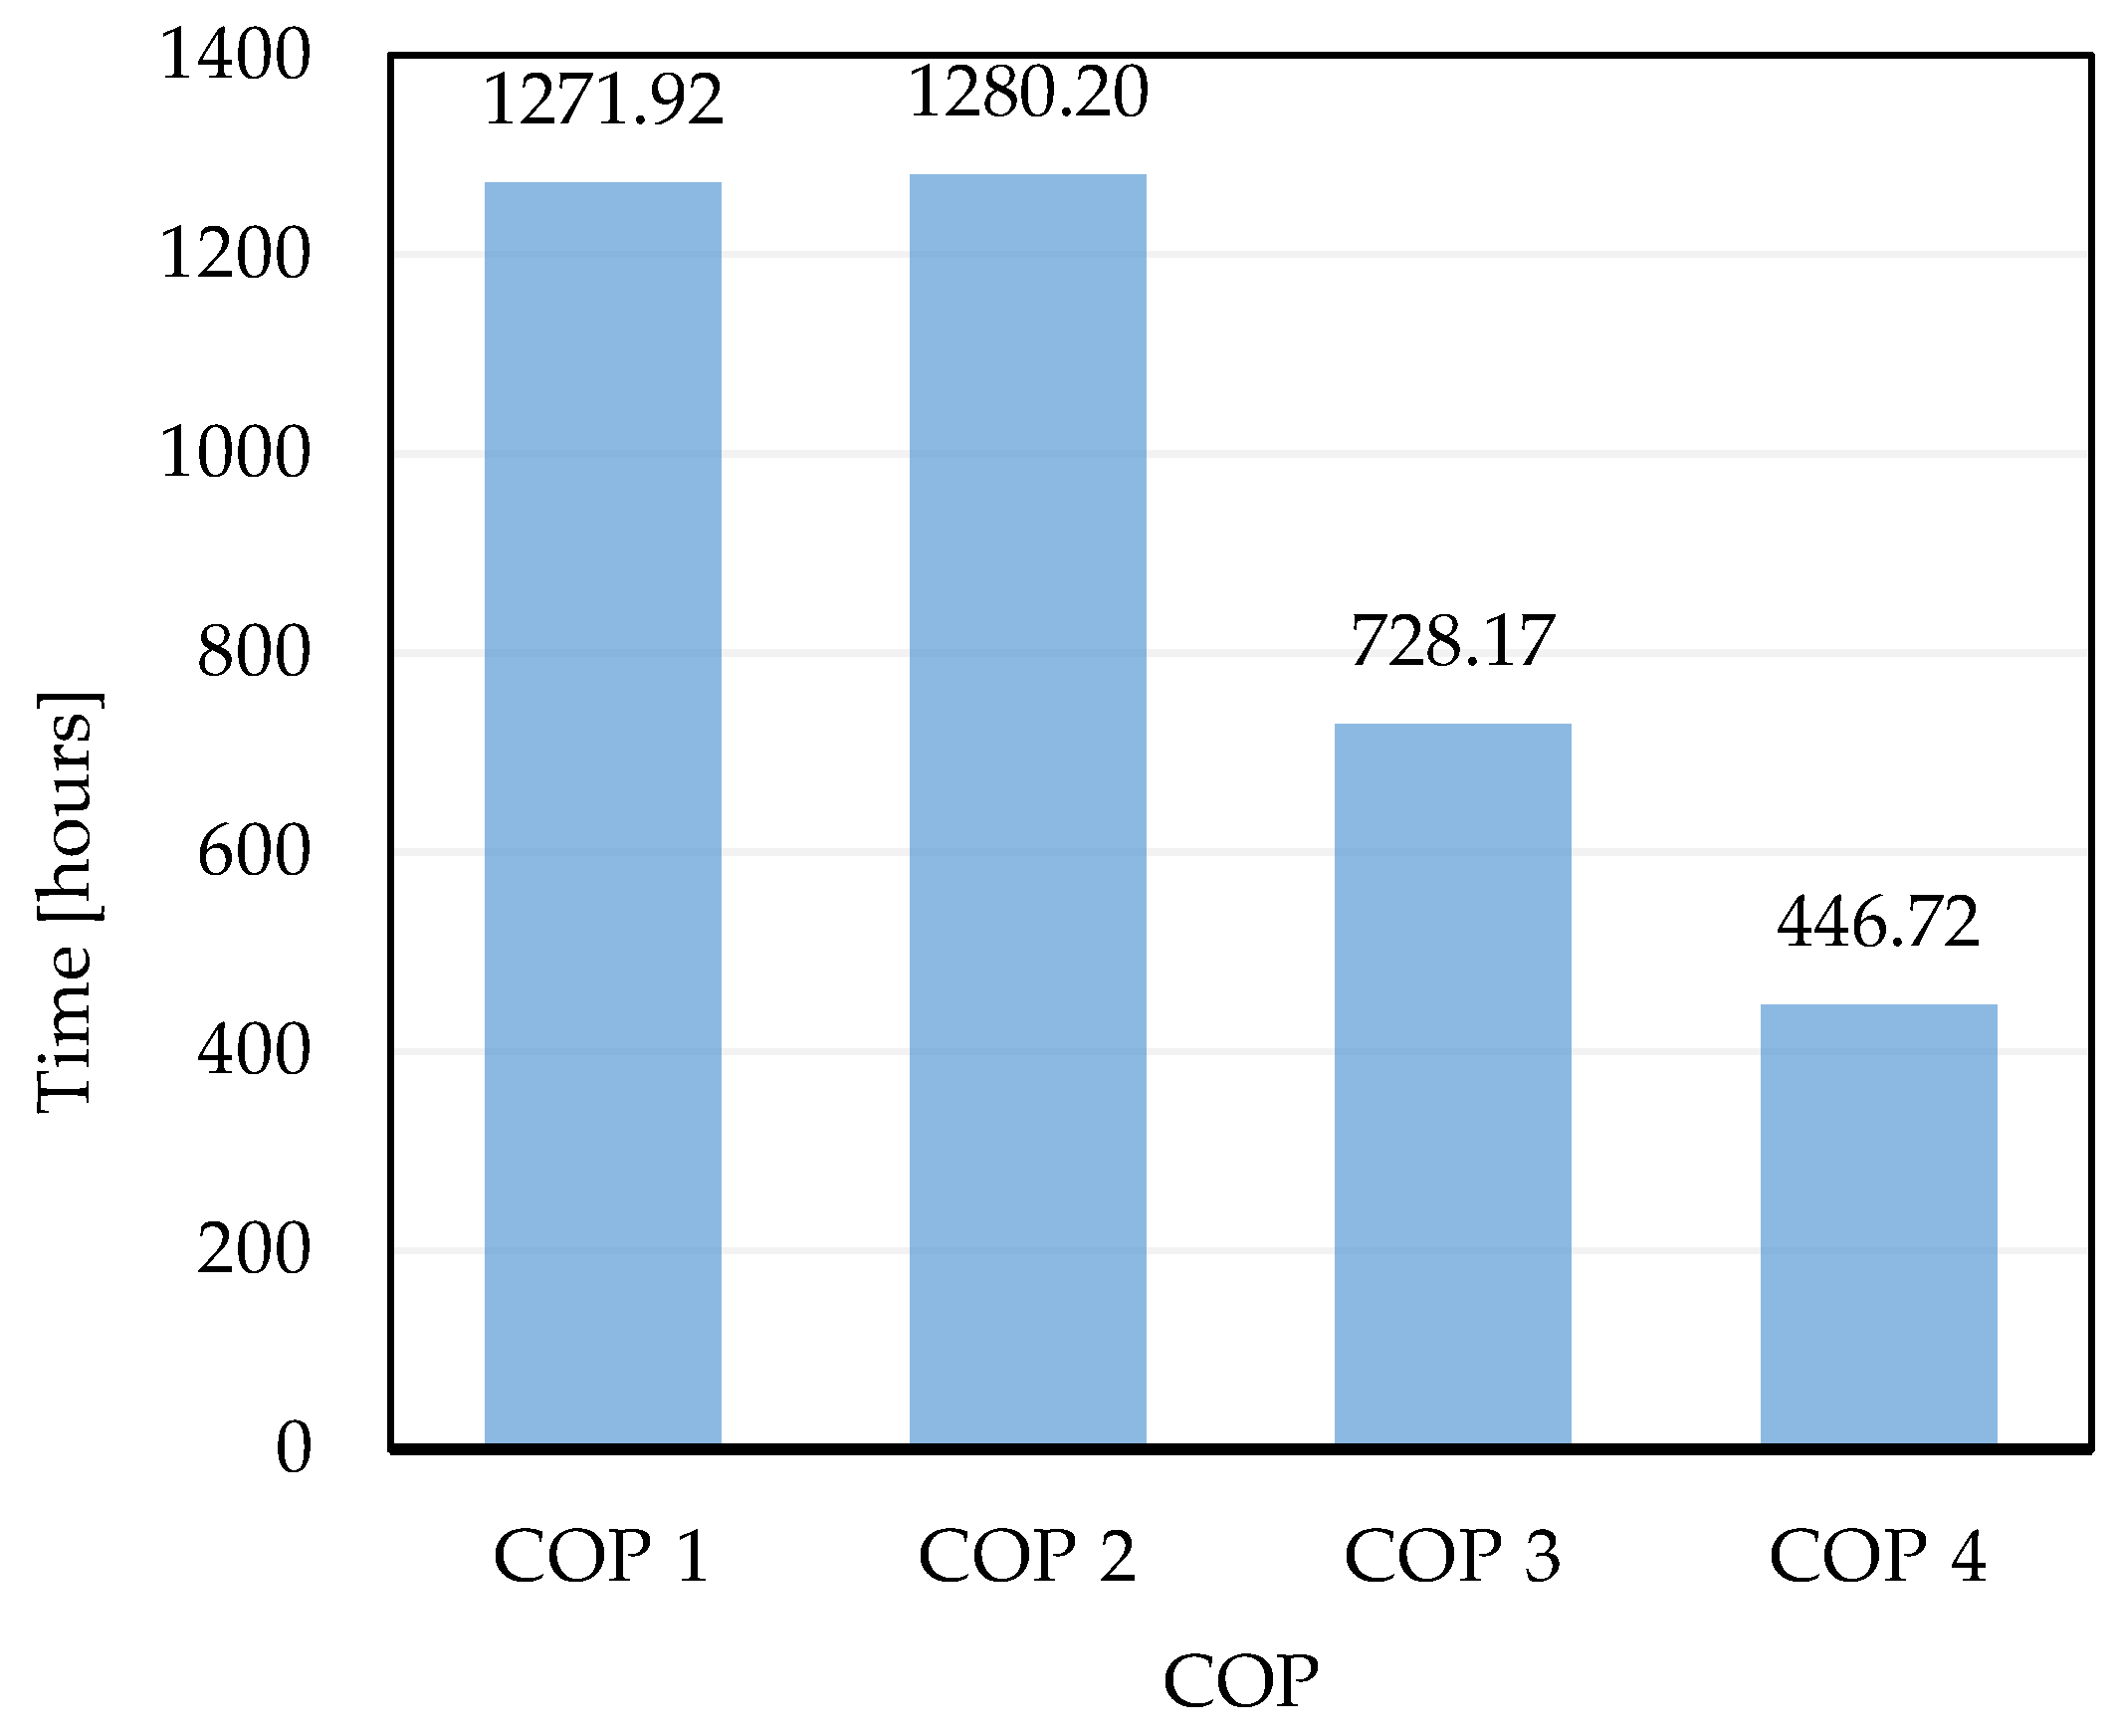
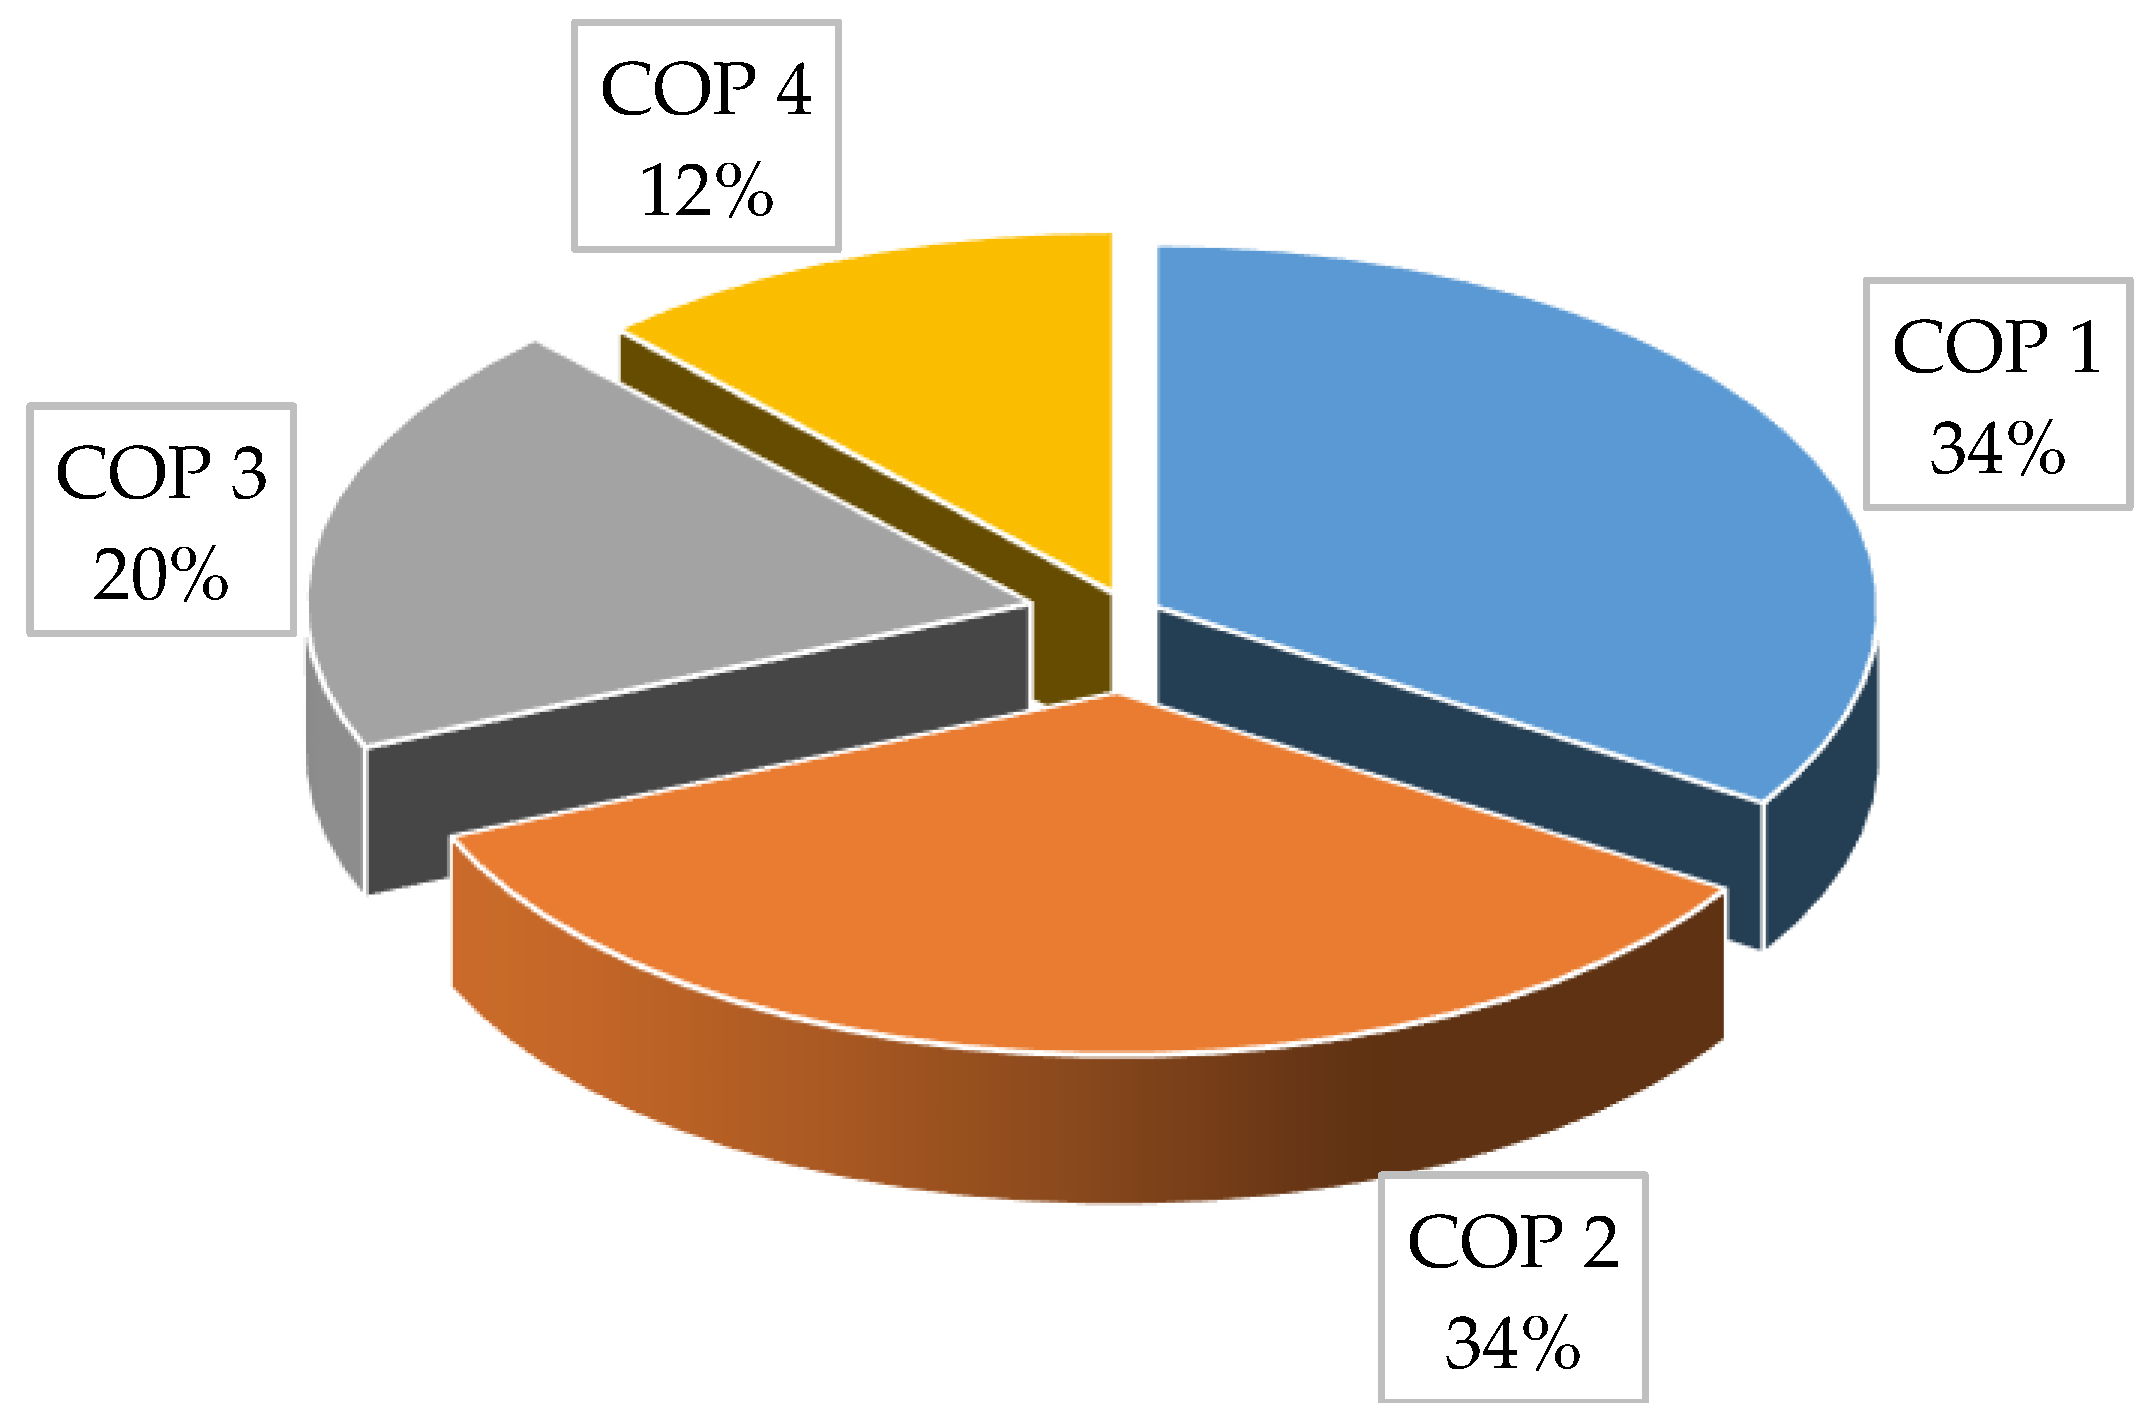
- Air intake temperature between 24.1 and 27 °C, called COP1.
- Air intake temperature between 27.1 and 30 °C, called COP2.
- Air intake temperature between 30.1 and 33 °C, called COP3.
- Air intake temperature above 33.1 °C in any condition, called COP4.
- If a geothermal temperature is available, it will be used to determine the COP, with a differential of 4 °C of the geothermal temperature.
3. New Methodology
- (1)
- Fixed air return temperature conditions equivalent to ASHRAE 90.1-2019, that is, 29 °C with a dew point temperature of 11 °C, thus considering a standard evaporation temperature of 12 °C.
- (2)
- Air intake temperatures in the condenser calculated for four values (levels) shown in Table 7. Each of the values of COP1, COP2, and COP3 are the average values of the EUED methodology, whereas COP4 is the value used by AHRI 1361 for air intake in the condenser.
- (3)
4. Analysis and Discussion
- Sensible cooling capacity = 50 kW;
- Total cooling capacity = 55 kW;
- Inlet air condenser temperature = 35 °C (AHRI 1361 conditions) [16];
- Approach between bubble temperature and condenser air inlet = 10 °C;
- Condensing temperature = 45 °C;
- Evaporating temperature = 10 °C;
- Suction gas superheat = 10 °C (EN 12900-2013 conditions);
- Liquid subcooling (in condenser) = 0 °C (EN 12900-2013 conditions) [17].
- (a)
- With the AHRI 1361 method for CRAC equipment, it is impossible to show the difference between fixed compressors and inverter for data centers in COP evaluations.
- (b)
- It has been proven that even at fixed thermal loads, there is an advantage of an air conditioning system with a variable flow of refrigerant fluid (inverter system).
- (c)
- Just as in AHRI, there are the IPLV and NPLV that use the same formula. The main difference between them is that IPLV is based on AHRI characteristics and NPLV is based on local characteristics. COP WEUED can also be used based on local characteristics. For example, using the same methodology for the city of São Paulo, Equation (2) provides:COP NEUED = ((0.66 × 5.98) + (0.25 × 5.46) + (0.08 × 4.97) + (0.01 × 4.43)) × 0.91 = 5.23 kW/kW
5. Conclusions
Author Contributions
Funding
Institutional Review Board Statement
Informed Consent Statement
Data Availability Statement
Acknowledgments
Conflicts of Interest
Abbreviations
| CRAC | Computer room air conditioner. |
| ASHRAE | American Society of Heating, Refrigeration, and Air Conditioning Engineers. |
| COP | Coefficient of performance. |
| SLR | Sensible heat rate. |
| EUED | Energy Usage Effectiveness Design. |
| WEUEDN | World Energy Usage Effectiveness Design Nonstandard. |
| IPLV | Integrated part load value. |
| LEED | Leadership in Energy and Environmental Design. |
| IT | Information technologies. |
| TC | Technical committee. |
| AHRI | Air-conditioning, Heating, and Refrigeration Institute. |
| NPLV | Non-standard part load value. |
| PUE | Power usage effectiveness |
References
- CISCO. By The Numbers. Projecting the Future of Digital. 2020. Available online: https://www.cisco.com/c/en/us/solutions/executive-perspectives/annual-internet-report/infographic-c82-741491.html (accessed on 12 October 2020).
- Masanet, E.; Shehabi, A.; Lei, N.; Smith, S.; Kooney, J. Recalibrating global data center energy-use estimates. Science 2020, 367, 984–986. [Google Scholar] [CrossRef] [PubMed]
- Lei, N.; Masanet, E. Statistical analysis for predicting location-specific data center PUE and its improvement potential. Energy 2020, 201, 117556. [Google Scholar] [CrossRef]
- Amiri, A.; Ottelin, J.; Sorvari, J. Are LEED-Certified Buildings Energy-Efficient. Sustainability 2019, 11, 1672. [Google Scholar] [CrossRef] [Green Version]
- Ni, J.; Bai, X. A review of air conditioning energy performance in data centers. Renew. Sustain. Energy Rev. 2017, 67, 625–640. [Google Scholar] [CrossRef]
- Santos, A.F.; Gaspar, P.D.; Souza, H.J.L.d. New Data Center Performance Index: Perfect Design Data Center—PDD. Climate 2020, 8, 110. [Google Scholar] [CrossRef]
- NREL. High-Performance Computing Data Center; National Renewable Energy Laboratory (NREL), U.S. Department of Energy: Denver, CO, USA, 2014.
- ASHRAE. Standard 90.1-2019 (SI Edition)—Energy Standard for Buildings Except Low-Rise Residential Buildings (ANSI Approved; IES Co-sponsored); American Society of Heating, Refrigerating and Air-Conditioning Engineers (ASHRAE): Atlanta, GA, USA, 2019. [Google Scholar]
- ASHRAE. ASHRAE TC 9.9—Data Center Networking Equipment—Issues and Best Practices; American Society of Heating, Refrigerating and Air-Conditioning Engineers (ASHRAE): Atlanta, GA, USA, 2016. [Google Scholar]
- ASHRAE. ASHRAE—Thermal Guidelines Classes; American Society of Heating, Refrigerating and Air-Conditioning Engineers (ASHRAE): Atlanta, GA, USA, 2015. [Google Scholar]
- AHRI. AHRI 1360. Performance Rating of Computer and Data Processing Room Air Conditioners; Air-Conditioning, Heating, and Refrigeration Institute (AHRI): Arlington, VA, USA, 2017. [Google Scholar]
- AHRI. AHRI Standard 550/590 (I-P). Performance Rating of Water-Chilling and Heat Pump Water-Heating Packages Using the Vapor Compression Cycle; Air-Conditioning, Heating, and Refrigeration Institute (AHRI): Arlington, VA, USA, 2015. [Google Scholar]
- Santos, A.F.; Gaspar, P.D.; Souza, H.J.L. Evaluation of the Heat and Energy Performance of a Datacenter Using a New Efficiency Index: Energy Usage Effectiveness Design—EUED. Braz. Arch. Biol. Technol. 2019, 62, e19190021. [Google Scholar] [CrossRef]
- United Nations Department of Economic and Social Affairs, Population Division. The World’s Cities in 2018; ST/ESA/SER.A/417 Data Booklet; UN: New York, NY, USA, 2018. [Google Scholar]
- ASHRAE. ASHRAE Weather Data Viewer, Version 5.0; American Society of Heating, Refrigerating and Air-Conditioning Engineers (ASHRAE): Atlanta, GA, USA, 2016. [Google Scholar]
- AHRI. AHRI Standard 1361. Standard for Performance Rating of Computer and Data Processing Room Air Conditioners; Air-Conditioning, Heating, and Refrigeration Institute (AHRI): Arlington, VA, USA, 2017. [Google Scholar]
- ES. DIN EN 12900—Refrigerant Compressors—Rating Conditions, Tolerances and Presentation of Manufacturer’s Performance Data; European Standard (ES), Deutsches Institut fur Normung E.V. (DIN): Berlin, Germany, 2013. [Google Scholar]
- Wen, J.; Wenlun, C.; Bei, C.; Yuyao, H. An inverter testing system for CRAC. In Proceedings of the 2014 International Conference on Intelligent Green Building and Smart Grid (IGBSG), Taipei, Taiwan, 23–25 April 2014; pp. 1–5. [Google Scholar] [CrossRef] [Green Version]
- Cairone, F.; Gagliano, S.; Bucolo, M. Experimental study on the slug flow in a serpentine microchannel. Exp. Therm. Fluid Sci. 2016, 76, 34–44. [Google Scholar] [CrossRef]
- Park, C.Y.; Hrnjak, P. Experimental and numerical study on microchannel and round-tube condensers in a R410A residential air-conditioning system. Int. J. Refrig. 2008, 31, 822–831. [Google Scholar] [CrossRef]


| Equipment Type | Standard Model | Net Sensible Cooling Capacity COP | Minimum Net Sensible COP (kW/kW) | Rating Conditions Return Air (DBT/DPT) | Test Procedure |
|---|---|---|---|---|---|
| Air-cooled | Downflow | <23 kW | 2.70 | 29 °C/11 °C (Class 2) | AHRI 1361 |
| ≥23 and <86 kW | 2.58 | ||||
| ≥86 kW | 2.36 | ||||
| Upflow-duct | <23 kW | 2.67 | |||
| ≥23 and <86 kW | 2.55 | ||||
| ≥86 kW | 2.33 | ||||
| Upflow-nonduct | <19 kW | 2.16 | 24 °C/11 °C (Class 1) | ||
| ≥19 and <70 kW | 2.04 | ||||
| 70 kW | 1.89 | ||||
| Horizontal | <19 kW | 2.65 | 35 °C/11 °C (Class 3) | ||
| ≥19 and <70 kW | 2.55 | ||||
| 70 kW | 2.47 |
| 2008 Classes | 2011 Classes | Applications | Information Technology Equipment | Environmental Control |
|---|---|---|---|---|
| 1 | A1 |  | Enterprise servers, storage products | Tightly controlled |
| 2 | A2 | Volume servers, storage products, personal computers, workstations, laptop, printers | Some control | |
| A3 | Some control, use of free cooling techniques when allowable | |||
| A4 | Some control, near full-time usage of free cooling techniques | |||
| 3 | B | Office, home, transportable environment, etc. | Personal computers, workstations, laptops, printers | Minimal control |
| 4 | C | Point of sale, industrial, factory, etc. | Point of sale equipment, ruggedized controllers or computers, PDAs | No control |
| Equipment Environmental Specifications for Air Cooling | |||||||
|---|---|---|---|---|---|---|---|
| Product Operations | Product Power Off | ||||||
| Class | DBT (°C) | Humidity Range | MDP (°C) | Max. Elevation(m) | Max. ΔT/hour (°C/h) | DBT (°C) | RH (%) |
| Recommend (suitable for all four classes) | |||||||
| A1–A4 | 18 to 27 | −9 °C (DPT) to 15 °C (DPT) and 60% RH | |||||
| Allowable | |||||||
| A1 | 15 to 32 | −12 °C (DPT) and 8% RH to 17 °C (DPT) and 80% RH | 17 | 3050 | 5/20 | 5 to 45 | 8 to 80 |
| A2 | 10 to 35 | −12 °C (DPT) and 8% RH to 21 °C( DPT) and 80% RH | 21 | 3050 | 5/20 | 5 to 45 | 8 to 80 |
| A3 | 5 to 40 | −12 °C (DPT) and 8% RH to 24 °C (DPT) and 85% RH | 24 | 3050 | 5/20 | 5 to 45 | 8 to 80 |
| A4 | 5 to 45 | −12 °C (DPT) 8% RH to 24 °C (DPT) and 90% RH | 24 | 3050 | 5/20 | 5 to 45 | 8 to 80 |
| B | 5 to 35 | 8% RH to 28 °C(DPT) and 80% RH | 28 | 3050 | N.A. | 5 to 45 | 8 to 80 |
| C | 5 to 40 | 8% RH to 28 °C(DPT) and 80% RH | 28 | 3050 | N.A. | 5 to 45 | 8 to 80 |
| Mounting Locations | Standard Model | Cooling (Return Air DBT/DPT) (°C) | Humidification (Return Air DBT/DPT) (°C) |
|---|---|---|---|
| Ceiling mounted unit | Ceiling mounted unit ducted | 24.0/11.0 | 24.0/5.6 |
| Ceiling mounted unit nonducted | |||
| Floor mounted unit | Upflow unit nonducted | 24.0/11.0 | |
| Upflow unit ducted | 29.5/11.0 | ||
| Downflow unit | 29.5/11.0 | ||
| Horizontal flow unit | 35.0/11.0 |
| System Type | Fluid Condition | Test Condition |
|---|---|---|
| Air-cooled units | Entering outdoor ambient DBT (°C) | 35.0 |
| Water-cooled units (typically connected to a common glycol loop) | Entering water temperature (EWT) (°C) | 28.5 |
| Leaving water temperature (LWT) (°C) | 35.0 | |
| Water Flow rate (L/s) | N/A | |
| Glycol-cooled units (typically connected to a common glycol loop) | Entering glycol temperature (°C) | 40.0 |
| Leaving glycol temperature (°C) | 46.0 | |
| Glycol Flow rate (L/s) | N/A | |
| Glycol solutions concentration | 40% Propylene glycol by volume | |
| Chiller-water units (typically connected to a common chilled water loop) | Entering water temperature (EWT) (°C) | 10.0 |
| Leaving water temperature (LWT) (°C) | 16.5 |
| Evaporator (all types) | Unit | Values |
|---|---|---|
| 100% capacity leaving water temperature (LWT) | (°C) | 6.7 |
| Volumetric flow | (m3/h.ton) | 5.45 |
| Fouling Factor | (m2. °C/W) | 0.000018 |
| Water condenser | ||
| 100% capacity entering water temperature (EWT) | (°C) | 29.4 |
| 75% capacity EWT | (°C) | 23.9 |
| 50% capacity EWT | (°C) | 18.3 |
| 25% capacity EWT | (°C) | 18.3 |
| 0% capacity EWT | (°C) | 18.3 |
| Volumetric flow | (m3/h.ton) | 6.81 |
| Fouling Factor | (m2. °C/W) | 0.000044 |
| Air condenser | ||
| 100% capacity entering water temperature (EWT) | (°C) | 35.0 |
| 75% capacity EWT | (°C) | 26.7 |
| 50% capacity EWT | (°C) | 18.3 |
| 25% capacity EWT | (°C) | 12.8 |
| Level | Calculation Temperature (°C) |
|---|---|
| COP1 | 25.5 (COP1 average from 24.1 to 27 °C) |
| COP2 | 28.5 (COP2 average from 27.1 to 30 °C) |
| COP3 | 31.5 (COP3 average from 30.1 to 33 °C) |
| COP4 | 35 (All temperatures above 33.1 °C) |
| No. | City | Country | Population [×1000] |
|---|---|---|---|
| 1 | Tokyo | Japan | 37,468 |
| 2 | Delhi | India | 28,514 |
| 3 | Shanghai | China | 25,582 |
| 4 | São Paulo | Brazil | 21,650 |
| 5 | Mexico City | Mexico | 21,581 |
| 6 | Al-Qahirah-Cairo | Egypt | 20,076 |
| 7 | Mumbai | India | 19,980 |
| 8 | Beijing | China | 19,618 |
| 9 | Dhaka | Bangladesh | 19,578 |
| 10 | Osaka | Japan | 19,281 |
| 11 | New York | USA | 18,810 |
| 12 | Karachi | Pakistan | 15,400 |
| 13 | Buenos Aires | Argentina | 14,967 |
| 14 | Chongqing | China | 14,838 |
| 15 | Istambul | Turkey | 14,751 |
| 16 | Calcutta | India | 14,681 |
| 17 | Manila | Philippines | 13,482 |
| 18 | Lagos | Nigeria | 13,462 |
| 19 | Rio de Janeiro | Brazil | 13,293 |
| 20 | Tianjin | China | 13,215 |
| 21 | Kinshasa | Democratic Republic Congo | 13,171 |
| 22 | Guangzhou | China | 12,638 |
| 23 | Los Angeles | USA | 12,458 |
| 24 | Moscow | Russia | 12,410 |
| 25 | Shenzhen | China | 11,908 |
| 26 | Lahore | Pakistan | 11,738 |
| 27 | Bangalore | India | 11,440 |
| 28 | Paris | France | 10,901 |
| 29 | Bogota | Colombia | 10,574 |
| City | Country | Annual Hours COP1 (24 to 26.9 °C) | Annual Hours COP2 (27 to 29.9 °C) | Annual Hours COP3 (30 to 32.9 °C) | Annual Hours COP4 (≥33 °C) |
|---|---|---|---|---|---|
| Tokyo | Japan | 910 | 674 | 284 | 57 |
| Delhi | India | 879 | 1481 | 1323 | 1873 |
| Shanghai | China | 1190 | 817 | 340 | 125 |
| São Paulo | Brazil | 1.215 | 454 | 147 | 13 |
| Mexico City | Mexico | 2.610 | 1669 | 1168 | 1020 |
| Al-Qahirah-Cairo | Egypt | 1345 | 947 | 785 | 660 |
| Mumbai | India | 1915 | 3412 | 1844 | 468 |
| Beijing | China | 1051 | 526 | 262 | 86 |
| * Dhaka | Bangladesh | 1561 | 2.685 | 1.487 | 794 |
| Osaka | Japan | 959 | 849 | 416 | 130 |
| New York | USA | 545 | 260 | 95 | 18 |
| Karachi | Pakistan | 1201 | 2476 | 1848 | 1053 |
| Buenos Aires | Argentina | 1083 | 389 | 85 | 9 |
| Chongqing | China | 743 | 743 | 437 | 309 |
| Istambul | Turkey | 830 | 443 | 126 | 15 |
| Kolkata (Calcutta) | India | 1561 | 2685 | 1487 | 794 |
| Manila | Philippines | 1959 | 4436 | 2024 | 262 |
| * Lagos | Nigeria | 1345 | 1762 | 1708 | 2686 |
| Rio de Janeiro | Brazil | 2807 | 1533 | 494 | 91 |
| Tianjin | China | 955 | 668 | 321 | 94 |
| * Kinshasa | Dem. Rep. Congo | 2966 | 1746 | 997 | 216 |
| Guangzhou | China | 1737 | 1685 | 822 | 341 |
| Los Angeles | USA | 198 | 63 | 18 | 4 |
| Moscow | Russia | 205 | 85 | 23 | 6 |
| Shenzhen | China | 1708 | 2049 | 911 | 138 |
| Lahore | Pakistan | 985 | 1320 | 1103 | 1525 |
| Bangalore | India | 2164 | 1156 | 520 | 156 |
| Paris | France | 257 | 113 | 42 | 12 |
| Bogota | Colombia | 2 | 0.2 | 0.04 | 0 |
| TOTAL | 36,886 | 37,126 | 21,117 | 12,955 | |
| Average | 1271.92 | 1280.20 | 728.17 | 446.72 | |
| Total Hours | 3727.02 |
| AHRI | COP1 | COP2 | COP3 | COP4 | |
|---|---|---|---|---|---|
| Compressor freq. (Hz) | 73 | 64 | 67 | 69 | 73 |
| Cooling capacity (kW) | 55 | 55 | 55 | 55 | 55 |
| Evaporator capacity (kW) | 55 | 55 | 55 | 55 | 55 |
| Condenser capacity (kW) | 67.5 | 64.1 | 65.6 | 66 | 67.5 |
| COP/EER (kW/kW) | 4.43 | 5.98 | 5.46 | 4.97 | 4.43 |
| Min. cooling capacity (kW) | 26.4 (35 Hz) | 329.6 (35 Hz) | 28.6 (35 Hz) | 27.7 (35 Hz) | 26.4 (35 Hz) |
| Max. cooling capacity (kW) | 56.4 (75 Hz) | 63.5 (75 Hz) | 61.3 (75 Hz) | 59 (75 Hz) | 56.4 (75 Hz) |
| Mass flow (kg/h) | 1240 | 1115 | 1159 | 1186 | 1240 |
| Discharge gas temp. w/o cooling (ºC) | 76.7 | 64.2 | 68 | 71.9 | 76.7 |
| Result COP (kW/kW) | 4.03 | 4.92 | |||
Publisher’s Note: MDPI stays neutral with regard to jurisdictional claims in published maps and institutional affiliations. |
© 2021 by the authors. Licensee MDPI, Basel, Switzerland. This article is an open access article distributed under the terms and conditions of the Creative Commons Attribution (CC BY) license (https://creativecommons.org/licenses/by/4.0/).
Share and Cite
Santos, A.F.; Gaspar, P.D.; de Souza, H.J.L. Evaluation of the Thermal Performance and Energy Efficiency of CRAC Equipment through Mathematical Modeling Using a New Index COP WEUED. Appl. Sci. 2021, 11, 5950. https://doi.org/10.3390/app11135950
Santos AF, Gaspar PD, de Souza HJL. Evaluation of the Thermal Performance and Energy Efficiency of CRAC Equipment through Mathematical Modeling Using a New Index COP WEUED. Applied Sciences. 2021; 11(13):5950. https://doi.org/10.3390/app11135950
Chicago/Turabian StyleSantos, Alexandre F., Pedro D. Gaspar, and Heraldo J. L. de Souza. 2021. "Evaluation of the Thermal Performance and Energy Efficiency of CRAC Equipment through Mathematical Modeling Using a New Index COP WEUED" Applied Sciences 11, no. 13: 5950. https://doi.org/10.3390/app11135950
APA StyleSantos, A. F., Gaspar, P. D., & de Souza, H. J. L. (2021). Evaluation of the Thermal Performance and Energy Efficiency of CRAC Equipment through Mathematical Modeling Using a New Index COP WEUED. Applied Sciences, 11(13), 5950. https://doi.org/10.3390/app11135950