1. Introduction
With the development of new technologies, it is often necessary to modify the materials employed in these technologies. This also applies to the construction industry. Specifically, in the case discussed in this manuscript, in the production of large profile concrete sewer pipes (diameter of 1 m and more). Until recently, construction applications relied on the use of straight pipes with separate elements (especially shafts) installed to change the direction of the main sewer lines. Although not very flexible, this system is still commonly used in most construction works to this day, especially when planning sewers through irregularly built-up areas [
1,
2,
3,
4]. In case of this classic technology, the major elements, i.e., straight concrete pipes, are produced using the vibro-pressing compaction technology. One of its advantages is that the concrete produced in this way, even with a relatively low cement content, is structurally very compact, strong, and sufficiently resistant to those aggressive actions it is usually exposed to in the given area of application [
5,
6].
The new technology, in combination with unique software, allows the production of curved pipes according to customer requirements but at the cost of a necessary inclusion of self-compacting concrete (SCC) in the curved section of a pipe. Due to higher cement (generally binder) paste content, self-compacting concrete is generally less resistant to most aggressive actions than vibro press compacted (VPC) concrete used in the straight section of a pipe [
6]. This fact led to the basic aim of the experiment: to design a SCC that would at least match standard VPC concrete in terms of mechanical properties and durability. This project task has been properly achieved in cooperation with the company Prefa Brno a.s. as part of a project No. TH02020871 (see Funding) and resulted in the development of a SCC with the required parameters (even in several variants). Within the project, two unique test devices were constructed and utilized with corresponding methodologies also being developed at the same time. Thanks to the granted project for the development of a technology to produce pipes with controlled curvature, as well as the materials used here, the development and testing of SCC for the curved part of pipes could be completed.
Complex durability tests followed and a part of them—durability in the sulfate environment—constitutes the core contents of this manuscript.
2. Sulfate Corrosion—Basic Knowledge of the Process
Sulfate corrosion, i.e., by SO
42− ions, was identified in concrete already in the second half of the 19th century. Since then, hundreds of experiments have been conducted and hundreds of manuscripts have been published, e.g., [
7,
8,
9,
10]. Nevertheless, the topic of sulfate corrosion is still relevant. At first glance, sulfate corrosion may resemble a simple process, but it is not [
11,
12]. In order to select suitable parameters to monitor the degree of a corrosion attack and an accurate interpretation of the results, it is necessary to get acquainted with at least the basic facts and contexts. There are a number of marginal conditions, such as the cation type, concentration, temperature and pressure of the acting medium, immersion time, etc. Some need to be considered, others do not. The situation has also been complicated by the fact that various chemical and mineralogical substance forms that cause sulfate corrosion have only been discovered gradually.
The biggest danger is the historically first discovered ettringite, whose complex formula 3CaO·Al2O3·3CaSO4·32H2O clearly indicates what constitutes its danger. If a substance with 32 molecules of water crystallizes, it is obvious that it will expand significantly. Ettringite does not merely expand, it expands very rapidly and substantially. The final volume expansion of the reaction product in regard to the starting components is up to 270%. Identically to ettringite, gypsum CaSO4·2H2O forms under certain conditions during the reaction of sulfates with the components of concrete (cement). Gypsum is also undesirable, but its expansion is lower than that of ettringite.
The last element (for this summary) which has been identified as a possible cause of concrete corrosion by sulfates is the mineral thaumasite CaCO
3·CaSO
4·CaSiO
3·15H
2O, which crystallizes equally to ettringite in a hexavalent system. Like in the case of ettringite, its crystalline structure contains silicon atoms which are surrounded by octahedrons of OH
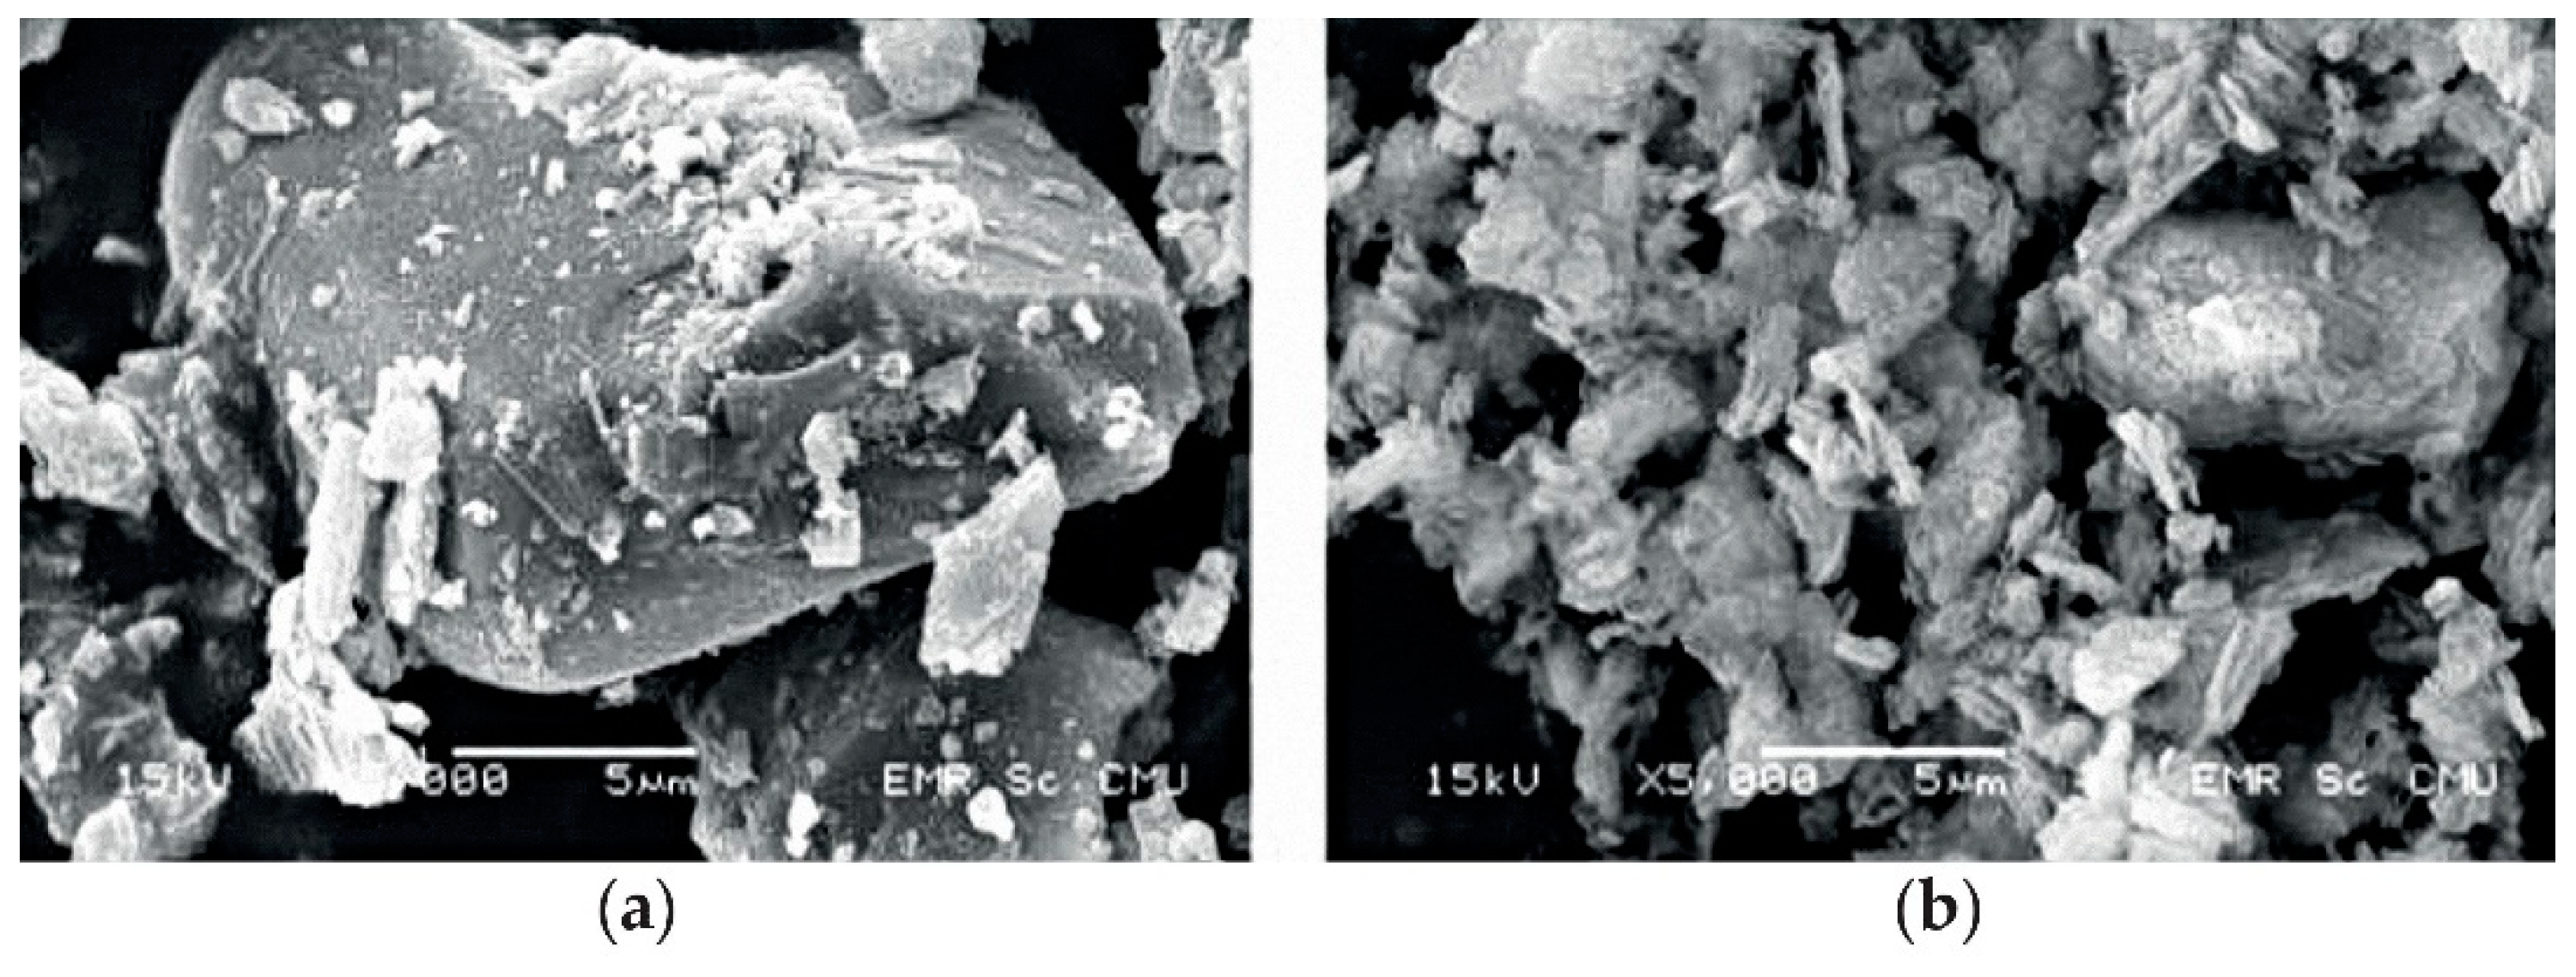
− ions and therefore forms very similar crystals. It should be noted that thaumasite forms in a specific narrow temperature range of 0–5 °C, only (sometimes at higher temperatures at a lower crystallization rate). At the given low temperature, the calcium salts that thaumasite needs for its crystallization are more easily dissolved. As a result, thaumasite is not found in all concretes subjected to sulfate attacks. A comparison of SEM images of ettringite and thaumasite is presented in
Figure 1. The morphological similarity of the crystals is quite evident and it should come as no surprise then that these two minerals used to be confused in the past. Even today, it is not completely clear how and under what conditions thaumasite forms in concrete and whether it can exist without ettringite. In 2020, Chinchón-Payá et al. [
13] stated the following in response to a question about the origin of thaumasite crystals in concrete: “
A certain degree of controversy still exists around the formation of thaumasite and its possible connection with ettringite. The current state of knowledge can roughly be grouped together around the three following theories:
According to the first theory, thaumasite is formed through ettringite by substitution of aluminium for silicon.
In the second case, ettringite acts as a nucleator for the thaumasite formation.
According to the third theory, thaumasite could be formed directly without influence of ettringite in the process at all [
13].
If there are three theories striving to explain one process, then the process is clearly not sufficiently understood. Perhaps that could partially explain why one of the most renowned personalities in the field of concrete technology, Neville, published a critical paper in 2004 with the title
“The confused world of sulphate attack on concrete” [
15]. It is a reaction, among other things, to the non-conceptual nature of research in this field and to the situation where some scientists have turned into participants in a competition for the best SEM image of concrete minerals.
There is agreement, on the other hand, that sulfate corrosion can be classified as corrosive damage caused by the expansion of corrosion products. According to commonly used classifications, it is a type III corrosion—a type designating corrosive actions where the final cause of the destruction of a material is the internal expansion stress in concrete [
16]. It is also crucial to be aware of the nature of the process of a given type or kind of corrosion, especially prior to formulating general and subsequently specific answers to the question of how to prevent that corrosion. We, therefore, follow the above-discussed analysis of the properties of newly formed products with a simplified description of the corrosion process itself.
During sulfate corrosion, SO
42− ions first penetrate the original pore structure of concrete and react with those components of cement or concrete which have the highest affinity to them, i.e., C3A, Al
2O
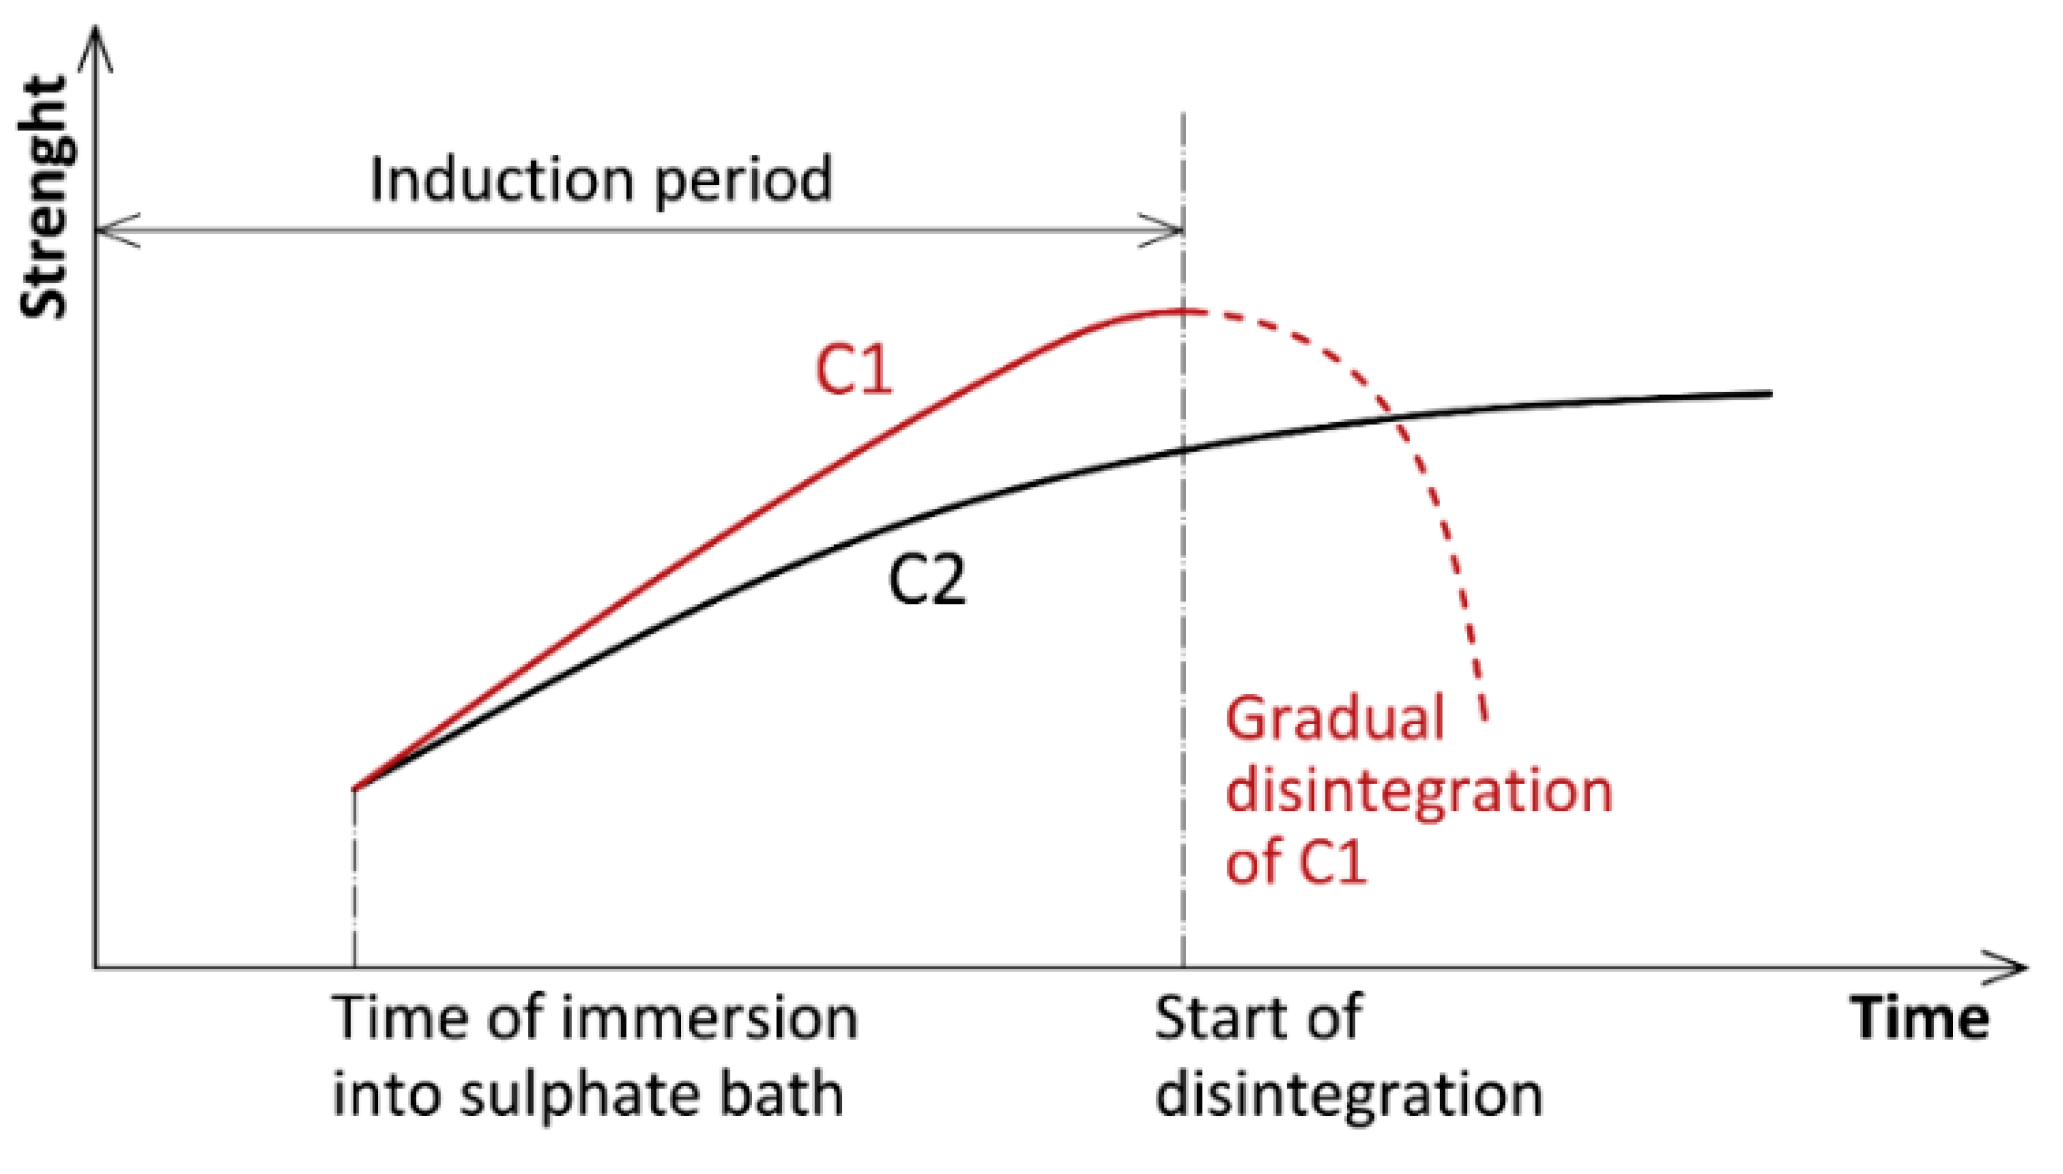
3 and C4AF. The pore structure of concrete is thus filled with the products of the corrosion reaction. The rate of filling depends primarily on the time, temperature and concentration of the attacking sulfates and, logically, also on the properties of the given concrete. Simultaneously with the filling up, i.e., in fact reinforcing of the pore structure, most mechanical properties of the given concrete are consequently temporarily improved. The word “temporarily” designates a paradox of this phenomenon. Less resistant concrete (C1 in
Figure 2) reacts with sulfates more intensively, therefore the whole corrosion process is faster. When compared to the resistant concrete C2, the partial improvement of the properties of the non-resistant concrete C1 is more significant, but also significantly shorter. As a result, when comparing resistance of several concretes, it is not adequate to monitor only their compressive strength (especially for short time experiments), but it is necessary to monitor other parameters that are not deformed by the described phenomenon (mass, length changes, cracking, etc.). However, it is advisable to wait until the samples have disintegrated. Due to their increase in volume, the products of the corrosion reaction (ettringite, etc.) create gradually increasing stresses in the concrete structure. If these stresses exceed the tensile strength of the concrete, the concrete starts to disintegrate—not into dust, but into typical fragments cracked in a direction perpendicular to the direction of the main tensile stresses. Due to the above-mentioned reasons, the work described below does not discuss compressive strength of concrete as an indicator of durability of the tested materials when exposed to sulfates.
Similar experience has been gained by other authors as well [
17,
18,
19,
20]. Interestingly, this possible problem has not been discussed at all in the world’s most published monographs [
5,
6]. On the other hand, Kurdowski [
11] approaches this possible problem very seriously. Simply “The confused world of sulphate attack on concrete”.
The explanation of the sulfate corrosion process described above also implies a way to prevent sulfate corrosion. Basically, there are the following options:
To include materials in the binder/cement which do not react with sulfate ions or react only to a very limited degree;
To produce a very dense, diffusion-limiting matrix of cement paste and aggregate that would make it more difficult or even impossible for sulfates to penetrate the concrete mass;
In contrast to option 2, to produce a matrix with increased pore volume, preferably of not directly communicating pores. The products of sulfate corrosion could then expand into these pores and thus completely or partially eliminate the negative impacts of the corrosion;
To consider a suitable combination of options 1 and 2, or 1 and 3.
The above-mentioned findings (and the resulting conclusions) were the starting platform for both the design of the composition of self-compacting concretes and the corresponding model mortars.
3. Experiment
3.1. Basic Test Methodology
The entire complex test was designed as a double comparison. The data measured at one given interval were compared with each other across the whole spectrum of the tested material variants and the parameters of the specimens in the corrosive environment and in the water bath were compared for each material.
3.2. Model Mortars
To accelerate the corrosion processes and to reduce the experiment’s demands in terms of space and materials, relatively small specimens with dimensions of 22 × 22 × 120 mm were selected for the test. Naturally, these specimens could not be produced with standard concrete; an appropriate model mortar (MM) had to be used instead. The derivation of the model mortar assumed that sulfate corrosion does not attack the aggregate, but only the cement paste.
A model mortar contains the same cement/binder paste as the modeled concrete (i.e., identical components in the same ratio, of course the same water coefficient as well), only the relative paste content in the model mortar is different from the concrete—it is higher. Generally, the increase is between 40% and 80% and depends in particular on the consistency of the modeled concrete, the included plasticizer and the sand used in the MM. The increase coefficient is always maintained at the same level for all the tested model mortars in one series of tests. In the described sulfate resistance test, the increase coefficient was 1.7, i.e., an increase of 70%.
3.3. Design of Resistant Concrete Variants
In general, the design of the MMs was governed by the principles given by the options 1 to 4 discussed at the end of
Section 2. The aim was to find a way to exploit them as effectively as possible. The use of sulfate-resistant cement (SRC) immediately springs to mind. In SRC, mostly the components with strong affinity to SO
4 ions, i.e., C
3A in particular, are restricted. The degree of restriction varies in different standards (max. 5% of C
3A according to ASTM C1012 [
21], max. 3.5% in EN 197-1 [
22]). Other parameters are also often restricted, for instance a cumulative amount (C
3A + Al
2O
3), etc. In regard to the goals of the conducted experiment, it is important to know that most cement producers have abandoned deliberate restrictions of C
3A and other critical components in clinker. It is much more effective to grind Portland clinker with materials that do not react with sulfates. The most commonly used admixtures in cement are latently hydraulic substances, such as granulated blast furnace slag, power plant fly ash or zeolites. Inert substances, such as limestone, are also utilized. Logically, this results in lower class cements, usually CEM III 32.5 or CEM V 32.5, see e.g., [
23]. These cements are suitable in situations where slow setting and slow development of heat of hydration are considered advantageous. However, due to the production cycle, the SCC for the curved section of pipes is required to achieve a compressive strength of at least 20 N/mm
2 after 18 h, so the strength class should be C 50/60. This could hardly be achieved with CEM III 32.5 or CEM V 32.5 cements.
3.4. Model Mortar Components
3.4.1. Cement
All the tested MM variants contained the same cement—ordinary Portland cement (OPC) brand CEM I 42.5 R produced by the cement plant Heidelberger Cement Czech Republic a.s. (Mokrá, Czech Republic).
3.4.2. Ground Blast Furnace Slag (GBFS)
A very finely ground granulated blast furnace slag was used, in this case produced by the company LB Cemix, s.r.o. (Štramberk, Czech Republic) according to its own product standard PN 72 2090 with market branding SMŠ 400. The basic technical characteristic of SMŠ is its high grinding fineness, which is in the case of SMŠ 400 is expressed by the number 400 m
2/kg, which is a guaranteed specific surface area (Blaine). This value (not very large at first glance) is, however, not comparable to similar values of common cements, especially slag ones. In those cases, the slag-clinker composition makes it significantly harder for the slag to be ground and it is, thus, incomparably more coarsely ground in cement mixes. The properties of separately ground GBFS are rather unexpectedly better due to the fine grinding [
24].
3.4.3. Metakaolin (MK)
Metakaolin is a pozzolan type product (not waste) produced by firing kaolin, kaolinitic clays and other suitable raw materials in the temperature range of about 600–900 °C and by subsequent granulometric separation. Pozzolans are siliceous or aluminosilicate fine-grained materials, which acquire their binding properties by a reaction with Ca(OH)2 in the presence of moisture, it is therefore a hydraulically reactive micro filler.
The suitability of metakaolin as an admixture in durable concretes has already been noted previously [
25,
26,
27]. A comparison of fineness of MK and CEM (by comparing the grain size) is presented in
Figure 3.
The described experiment involved metakaolin Mefisto L05 produced by the company České lupkové závody, a.s. (Nové Strašecí, Czech Republic). According to the classification described in [
25]; it is a fine-grained metakaolin, which is also evident from
Figure 3. Additional information can be obtained on the producer’s website [
29].
3.4.4. Fine Ground Limestone (FGL)
Ground limestone has been used as an inactive microfiller in the company Prefa Brno a.s. for many years. According to them, the benefits include lower cement consumption and improvements in the surface quality of the products. The use of FGL was also required in the newly designed concretes. In this case, it was V8 class ground limestone, supplied by CARMEUSE CZECH REPUBLIC s.r.o. from their Vápenka Mokrá plant (Mokrá, Czech Republic).
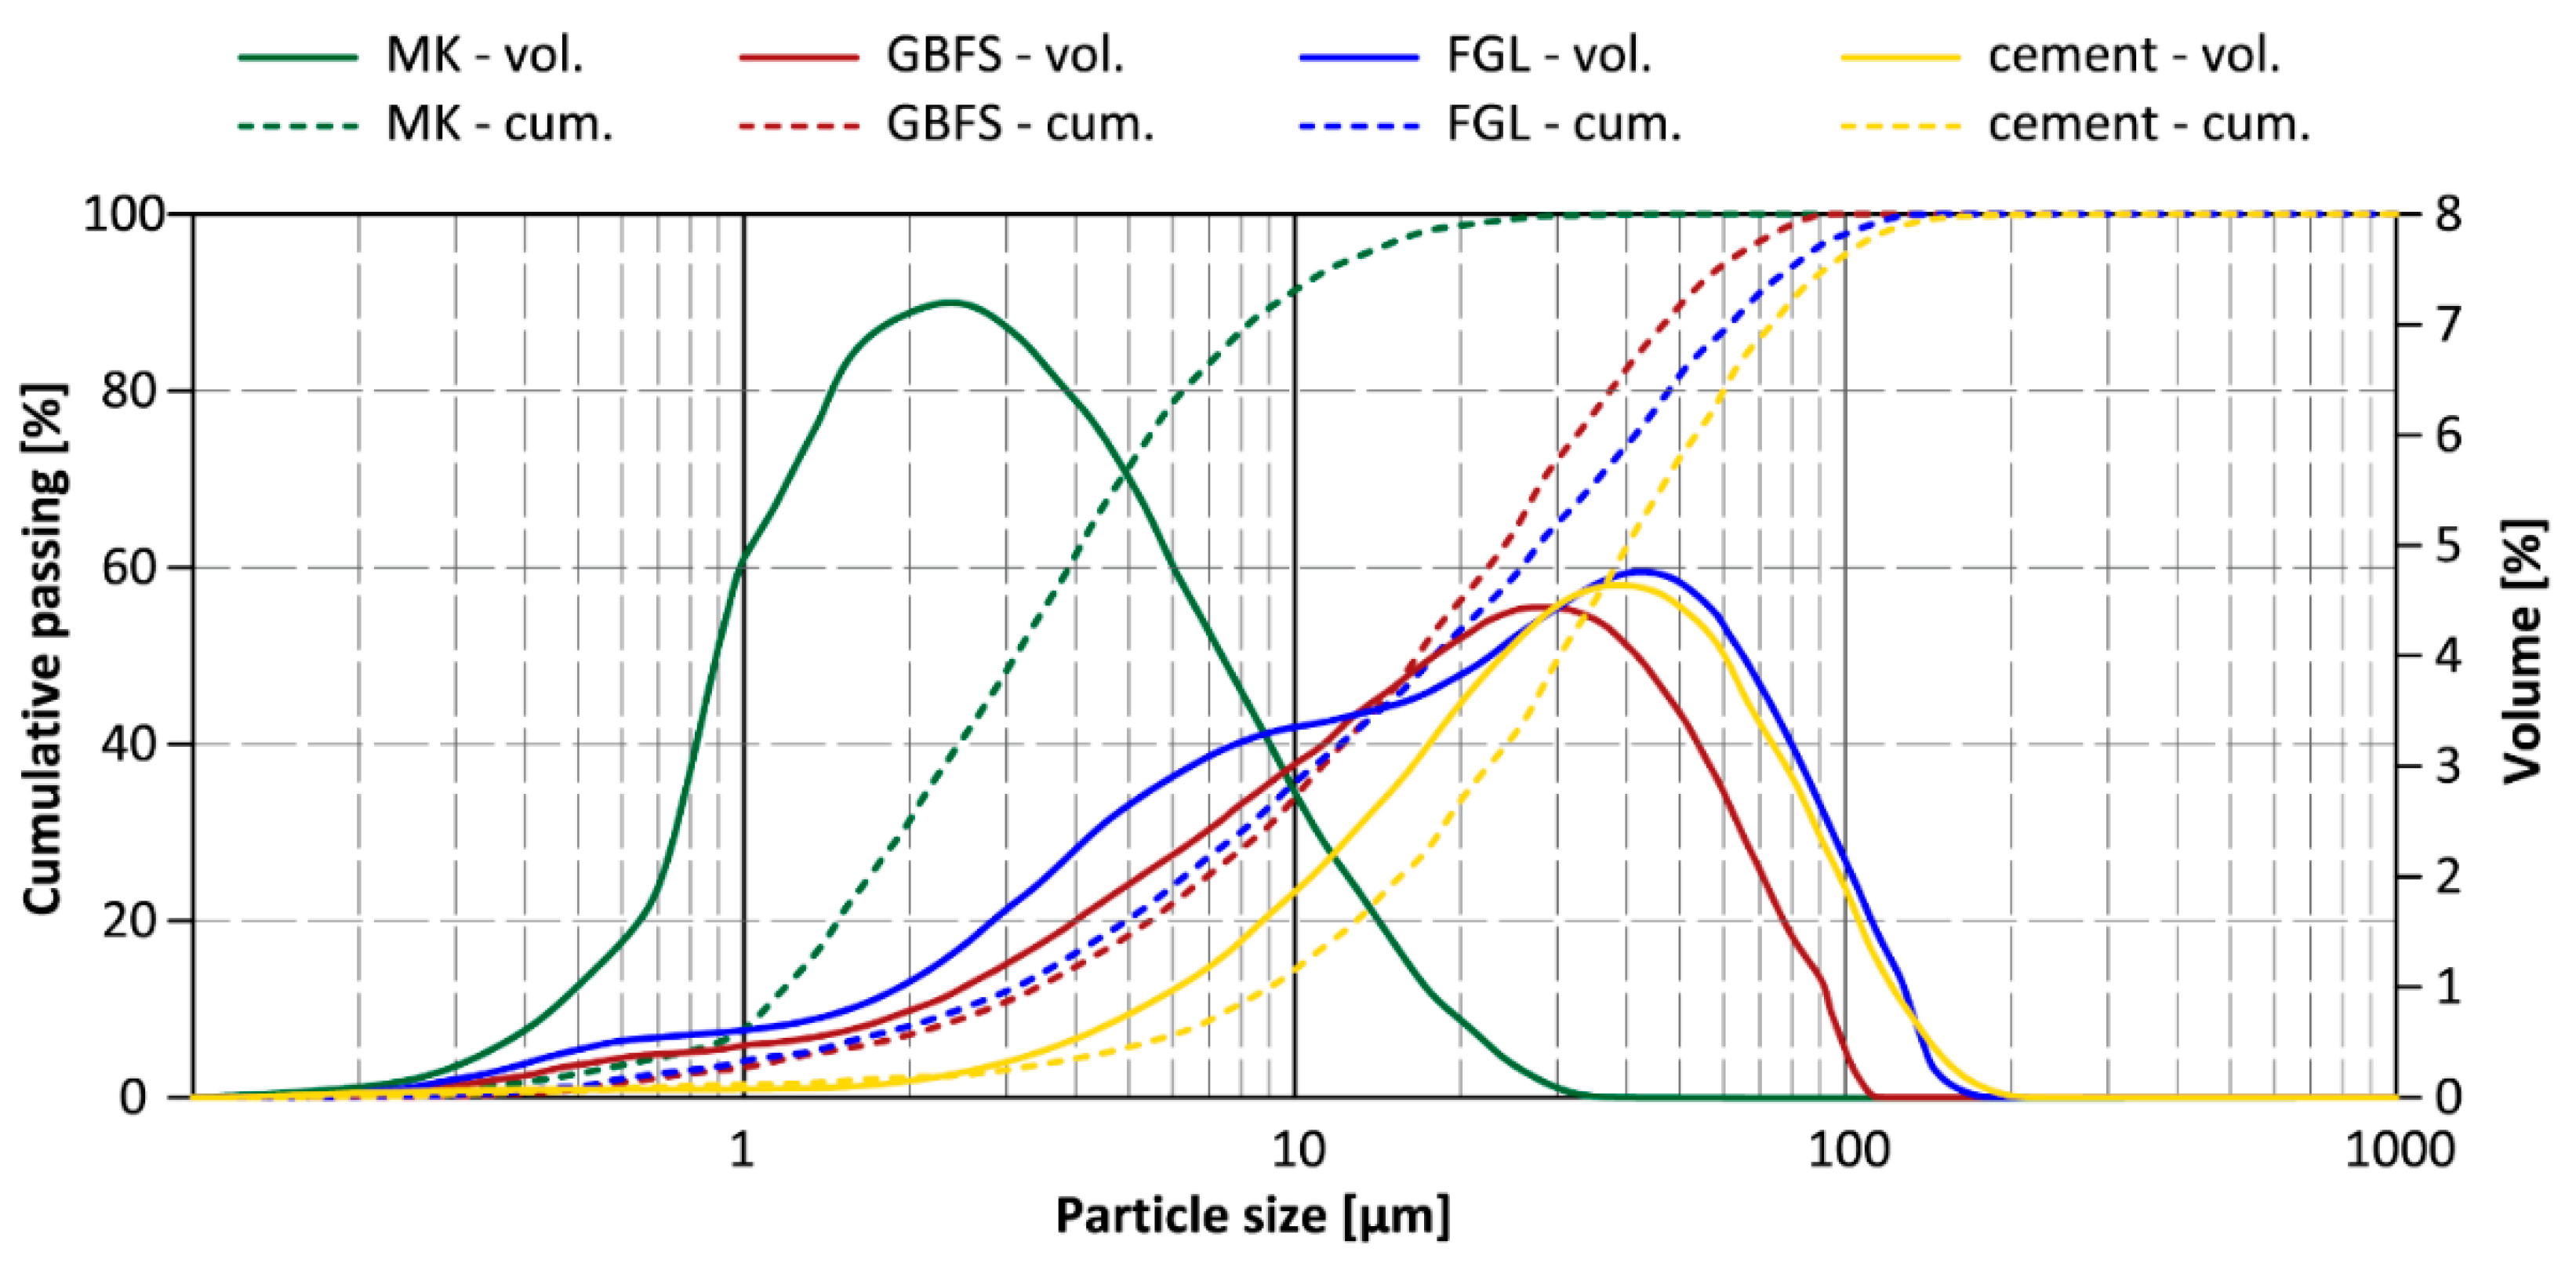
The chemical composition of the used cement and other powder admixtures is given in
Table 1, granulometry is presented in
Figure 4.
3.4.5. Silica Sand (SiS)
Model mortars and small samples require smaller aggregate. The best results have been achieved with washed SiO2 sand (SiS) type PR 31 (fraction 0.3–1.6 mm) and type PR 30 (fraction 0.1–1.0 mm). The used ratio was PR31 (60–70%):(30–40%) PR30. The supplier was the company Provodínské písky a.s. Provodín plant (Provodín, Czech Republic).
3.4.6. Xypex—Crystallization Admixture
The cooperating company, Prefa Brno a.s., was interested in including a crystallization admixture in the experiment. The aim was to determine how the crystallization admixture affects concrete exposed to sulfates. Prefa Brno a.s. supplied the admixture Xypex Admix C-1000 [
30] with the information that it be used in an amount of 2% of cement content. According to the admixture manufacturer, the resistance of the resulting material should be equal to sulfate-resistant cement and should improve workability of fresh concrete. Since no additional instructions on the material substitution were provided, a compromise was chosen—1% of Xypex (i.e., 5.7kg/m
3) substituted the same amount of CEM + FGL and the other 1% was included in addition to the initial binder paste volume.
3.4.7. Set Retarding Admixture
A small amount of a set retarding admixture was used in the composition of the final mixtures, namely the type Centrament Retard 360, a product of the company MC Bauchemie s.r.o. (Žebrák, Czech Republic). A small amount of this admixture retards the initial intensive reaction of cement (binder) with water. As a result, this allows the formation of a larger number of condensing cores and leads to improvements of long-term properties.
3.4.8. Multifunctional Admixtures
During the design and production stage of high-performance concretes (HPC), a key role is played by plasticizing, superplasticizing or even hyperplasticizing admixtures (a term used by the company Mapei). Recently, the term “multifunctional admixtures” has also been used and is probably the most suitable. Multifunctionality of admixtures is currently gaining increasing importance. The individual functions should provide:
sufficient dispersion of cement and all other admixtures (GBFS, MK, FGL);
at the same time, the stability of the prepared composite as a whole;
required workability of the resulting fresh concrete (here SCC);
a time period during which fresh concrete can be transported, pumped and stored as required.
How a PCE admixture behaves depends not only on its composition, but also on the character of the composite in which it is used. It depends on the w/c coefficient, on the predominant binder type (cement—slag—metakaolin), etc. [
31].
The experiment described in this manuscript can be divided into two stages based on the utilized multifunctional admixture:
Stage 1, which involved admixtures from Stachema CZ s.r.o. (Kolín, Czech Republic) and Stage 2, which involved admixtures from MC Bauchemie s.r.o. at the request of Prefa Brno. Both presented groups of admixtures were employed in the final designs of the mixtures to meet the requirements of the project task. Mixtures from Stage 1 were designed first and their alternatives from Stage 2 then followed. Stages 1 and 2 differed not only in the supplier company, but also in the approach of the companies to cooperation.
In the first stage, the company Stachema allowed access to its primary components and the preparation of special multifunctional admixtures with optimal performance for each individual designed mixture. The following were used: Stachement 2180 (standard universal PCE admixture for general use, commercial product), S1, S8 and S9 (special multicomponent admixtures designed for a given MM and concrete within the conducted experiment). In all the cases, the admixtures S1, S8 and S9 exhibited better efficiency than the standard ST2180, but due to trade secrets, no details can be disclosed.
In the second stage, it was only possible to test the available products from MC Bauchemie and choose the one that appeared to be the most suitable [
31]. After a short testing period, which was mainly based on monitoring of efficiency and stability, the two most suitable multifunctional PC admixtures were identified:
PowerFlow 2695 as a universal PCE admixture suitable for a wide w/c range. It has a stabilizing effect on the MMs and shows minimal stickiness. It also exhibits above average efficiency, but this is still around 15% lower than in the case of the special admixtures of the S series, see above;
PowerFlow 3196 This ingredient exhibited exceptional efficiency and stability parameters right from the beginning. After a more detailed analysis of the acquired results, it was discovered that these parameters are achieved by a not negligible air-entrainment of the prepared composite. Nevertheless (or rather because of that), it was used as a variant in the conducted experiment.
3.5. Mixtures and Their Significance
A total of 8 different mixtures were designed and fully tested. The composition and basic physical and mechanical properties of these mixtures are summarized in
Table 2. For simplicity’s sake, the individual MMs were designated with the letter “M” and a serial number. The following can be stated in terms of the significance of the individual mixtures:
M1 and M2 are reference mixtures, with M1 modeling vibro press compacted concrete of the straight section of pipes and M2 modeling the standard SCC which is used by the company Prefa Brno a.s.;
All other model mortars model an improved SCC in some way;
M3 is a MM with the Xypex crystallization admixture and is derived from M2 according to the procedure described in the
Section 3.4.6;
M4 is a MM variant prepared with the requirement not to change the components (type) of the commonly used SCC—it therefore only differs from M2 in the amount of the individual components;
M5 is a variant including GBFS;
M6 is a variant with MK and Stachema admixtures;
M7 and M8 are variants with MK and MC Bauchemie admixtures.
3.6. Production and Basic Properties of the Developed MM Variants
The preparation of all MMs was identical. After fine-tuning the amount of the plasticizer, MMs for all the samples were prepared using a cement mixer. The parameters of the mixer are standardized according to several standards (EN 196-1 [
32], EN 196-3 [
33], ASTM C305 [
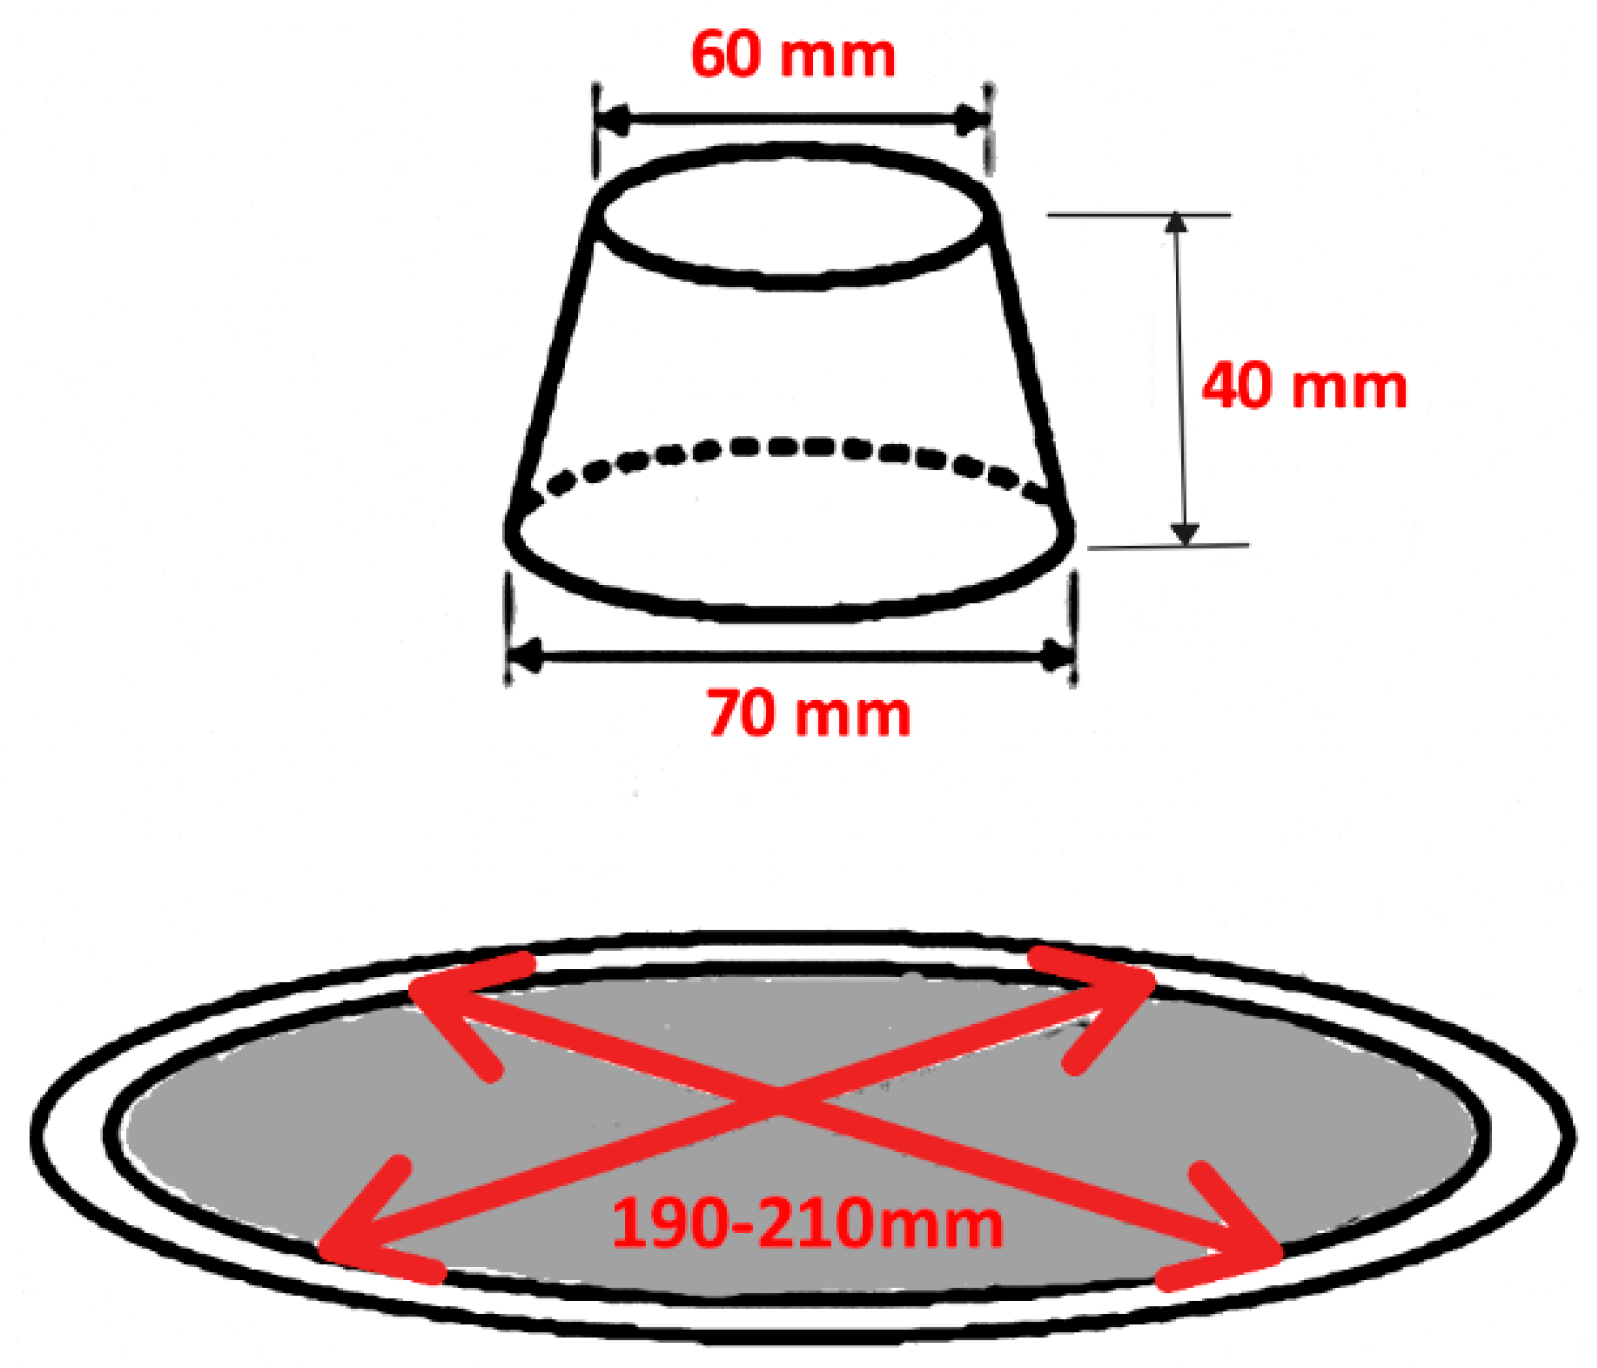
34], etc.). The mixer includes a programmed mixing cycle which allows mixing of all MMs in exactly the same way. The amount of the plasticizing/multifunctional admixture was selected so that the spread of the prepared MM was in the range of 190 mm to 210 mm, see
Figure 5. The only exception was the M1 mortar. It simulated concrete with poor workability used in the straight section of pipes and in the test according to
Figure 5 formed a compact truncated cone which did not flow.
After fine-tuning the consistency of all the mortars, each MM for the following tests was produced in one mixture with a volume of 1.25 L. The following test specimens were produced:
There were a total of 11 test specimens for each MM. The test specimens 40 × 40 × 160 mm were produced using precise steel molds in accordance with EN 196-1 [
32] and employed for the determination of:
The results are presented in
Table 2. The test specimens 22 × 22 × 120 mm were used to determine the resistance of the material to sulfate corrosion. They were produced using special molds, which had been prepared in advance using two-component silicone rubber Lukopren N 1522. The front and back faces of the molds were fitted with measuring pins (form AB, type I) and handling hooks were placed above the mold, all made from stainless steel, see
Figure 6. This ensured that each 22 × 22 × 120 mm specimen was fitted with a handling hook and measuring pins. The test specimens produced with the model mortar M1 were compacted during the production using a vibrating table VSB-40, the test specimens produced with the other mortars were not compacted as they are self-compacting mortars.
All test specimens were left exposed in the moulds for approximately 60 min under standard laboratory conditions—temperature 20 ± 2 °C and ambient humidity 55 ± 10%. The specimens were then covered with a wet cloth and wrapped in a PE foil together with the molds. At the age of 23 to 24 h, all test specimens were removed from the molds and placed into a water bath at a temperature of 20 ± 2 °C. The test specimens 40 × 40 × 160 mm were removed from the water bath at the age of 7 days and were used for the determination of basic properties of the mortars (see above). Density was calculated from data measured on saturated specimens. Flexural strength was determined using a LabTest 6.30 mechanical testing machine (LaborTech) and compressive strength of fractions was determined using an E170 compression device (MATEST) and a DELTA 6-300 testing machine (FORM+TEST). Specimen fractions which were used for the determination of compressive strength at the age of 28 days were returned to the water bath and tested only at the required age.
The test specimens 22 × 22 × 120 mm were also removed from the water bath at the age of 7 days since the sulfate corrosion resistance test started at that age. This relatively early age was chosen for two reasons. The first is the fact that in real applications, precast concrete elements are often installed into a structure (in the case of sewer pipes placed in the ground) at the concrete age of several days, often less than 7 days. The second reason was a high degree of maturity of the mortars at the age of 7 days (assessed based on the ratio of compressive strength at 7 and 28 days of the developed MM samples). Waiting for the age of 28 days would become counterproductive and in addition, the sooner a material is exposed to the given degradation processes, the better its resistance (or lack of resistance) can be assessed.
3.7. Durability Test
The aggressive bath comprised a 5% solution of sodium sulfate (Na2SO4), which after rounding corresponds to 36,000 mg of SO−4 ions per 1 L of the solution. The ratio of the volume of the samples to the volume of the bath was 1:10. The sulfate bath was changed 3 times during the 1-year durability test, each time after 3 months. Including the initial bath, there were 4 bath fillings in total. The water in the reference bath was also changed at the same interval.
The durability test focused on monitoring three characteristics of the model mortar behavior:
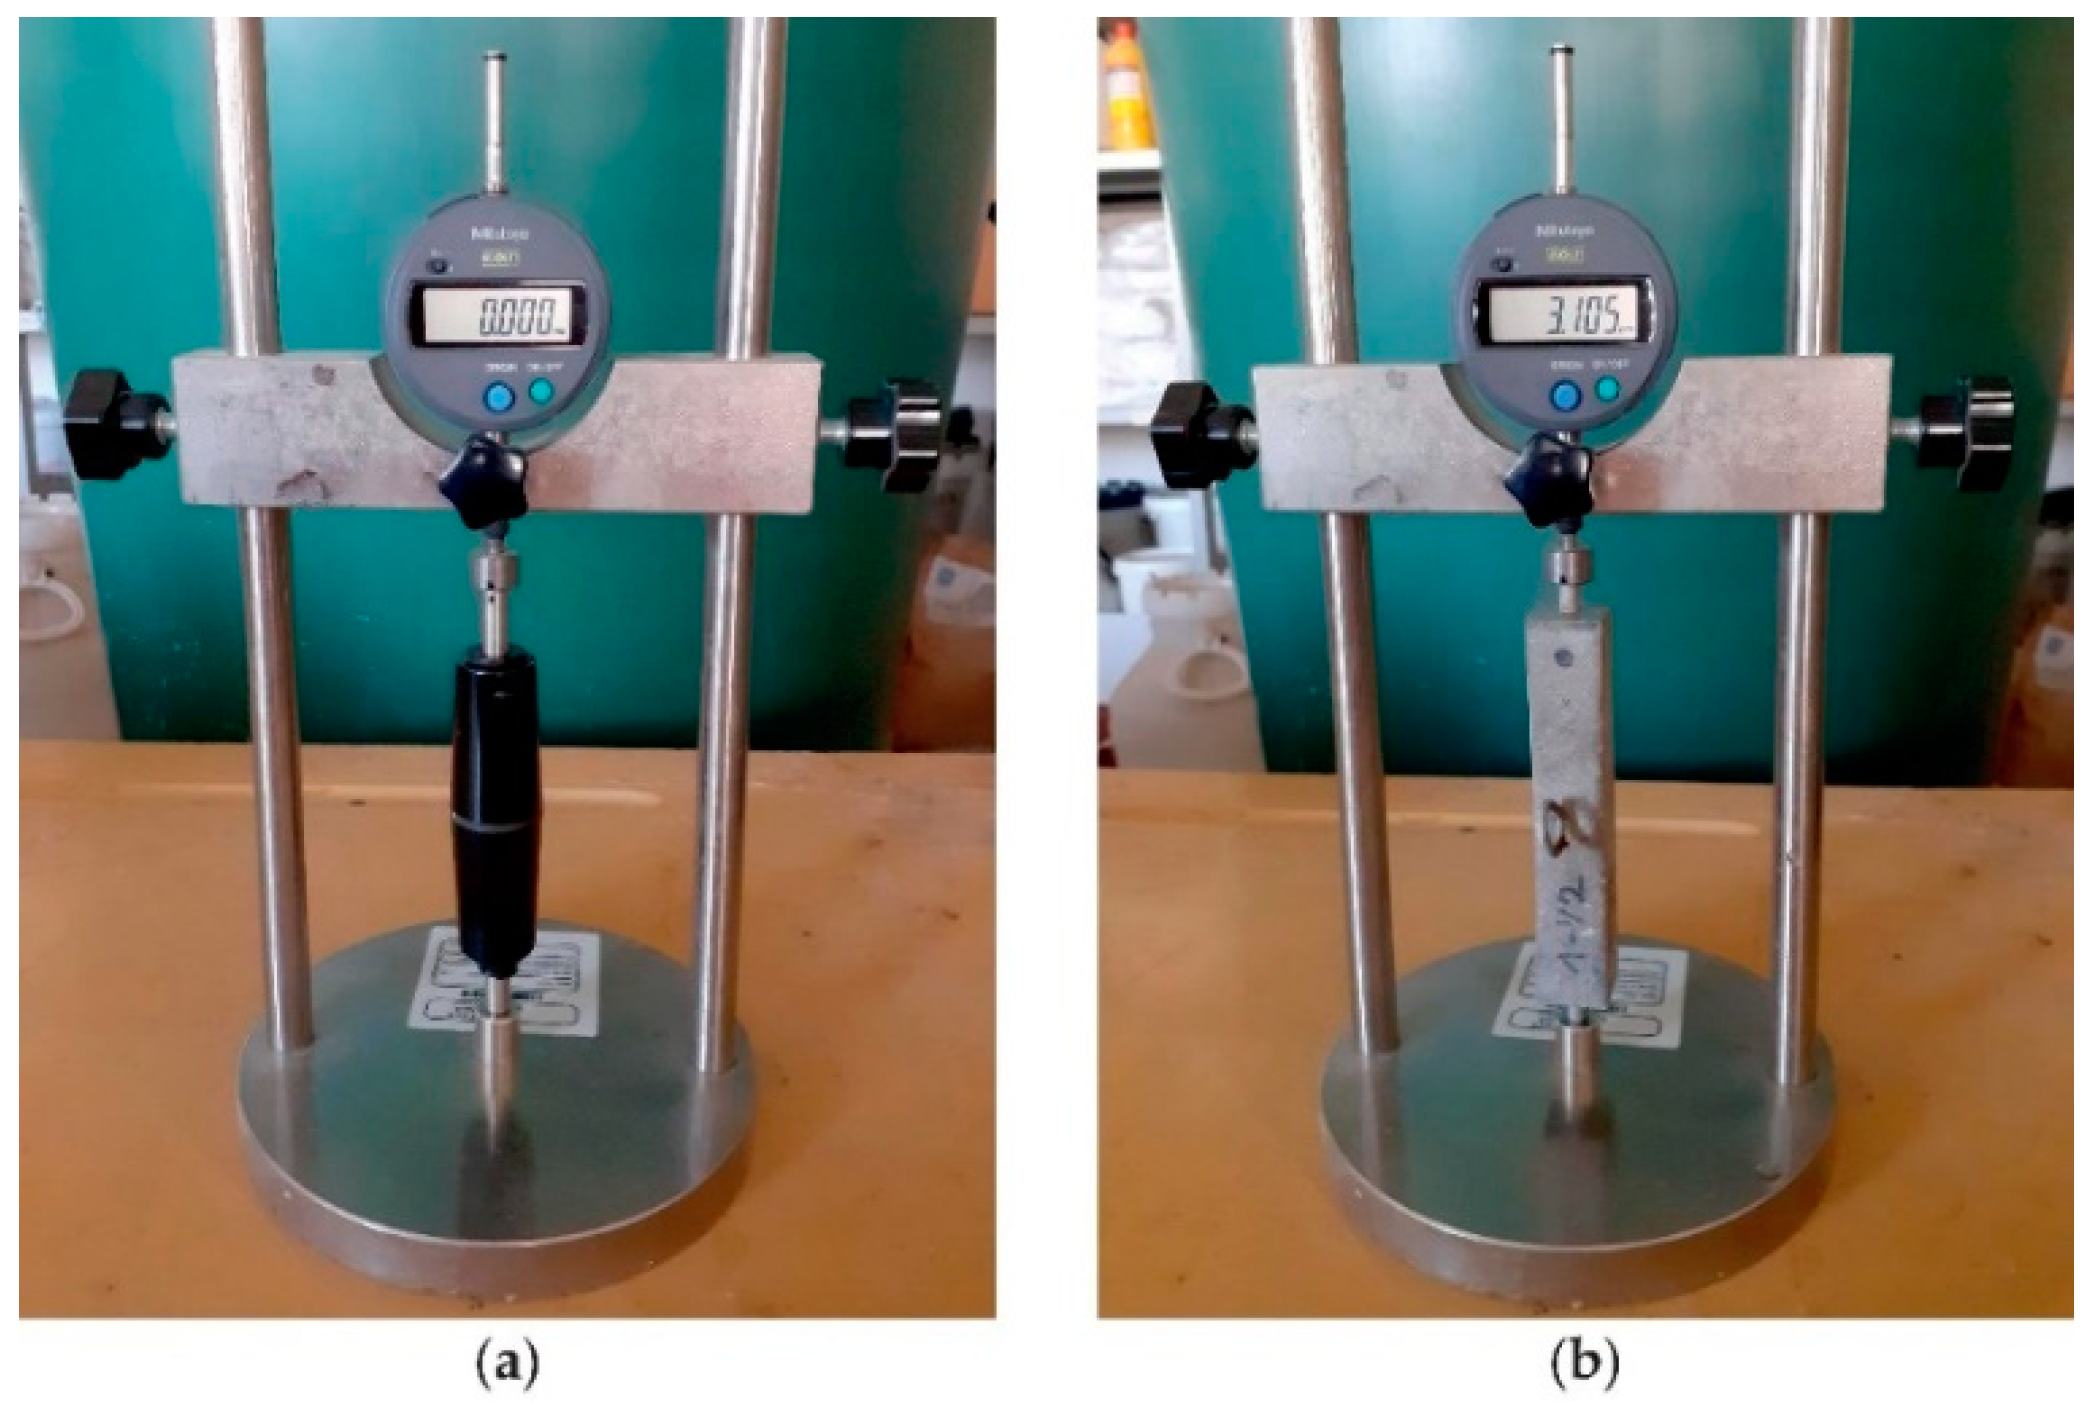
In the case of all the test specimens 22 × 22 × 120 mm, mass and length were determined at the age of 7 days—this was what is known as a zero reading, i.e., a reading before the start of the corrosion test. The length of the test specimens was determined using a shrinkage measuring device, type B—vertical design. The instrument included a digital gauge with an accuracy of 0.001 mm and a calibration rod adjusted to a length of 120 mm, see
Figure 7. Subsequently, half of the test specimens of each mortar were placed in the sulfate bath and the other half back in the water bath—these were reference specimens.
3.7.1. Relative Length Change
Relative length change was determined using the formula:
where
RL is the relative length change in %,
lt is the length of the test specimen at the time
t in mm and
l0 is the original length in mm, meaning the zero reading at the age of 7 days before the specimen placement in the sulfate bath. Relative length changes were monitored at pre-defined test intervals, which were after 30, 60, 90, 150, 210, 300 and 365 days of placement of the MMs into the aggressive bath. The actual age of the MMs was therefore always 7 days older (37 days, 67 days, etc.).
3.7.2. Relative Mass Change
Relative mass change was determined using the formula:
where
RM is the relative mass change in %,
mt is the mass at the given time
t in g,
m0 is the original mass in g (meaning the zero reading at the age of 7 days before the specimen placement in the sulfate bath) and
M is the total mass of the two measuring pins and the handling hook (the weight of the test specimen fittings). In the case of each specimen, the relative mass change of a model mortar was determined without the influence of the weight of the specimen fittings. Relative mass changes were monitored at the same time intervals as in the case of relative length changes.
Length and mass changes were monitored for each MM (M1 to M8) on 4 test specimens placed in a sulfate bath as well as on 4 test specimens placed in the water bath. In addition to the comparison of the results of individual MMs with each other, it was also possible to compare the results of the specimens in the sulfate bath and in the water bath for each MM separately. Graphical outputs therefore distinguish between data acquired from samples in the sulfate bath (marked “s”) and data acquired from the reference samples placed in the water bath (marked “w”).
The values determined from the reference (=stored in the water bath) test specimens of the model mortars have a double significance. Firstly, they were supposed to verify that the corresponding model mortars do not behave irregularly under normal conditions, i.e., do not crack due to internal stresses, do not disintegrate due to lack of water for the hydration reaction, etc. Secondly, it is evident that the set of values for the relative mass change of the test specimens placed in the water bath actually represents an output of a kind of non-standard one-year absorbency test of the individual tested model mortars. The significance of the reference samples in the water bath can therefore be seen especially in the possibility to partially verify the results measured on the MMs placed in the sulfate bath. The assumption is that samples with higher absorbency will also have a structure more susceptible to sulfate penetration and will therefore be less resistant. However, the results acquired in this manner do not consider the influence of the chemistry of a particular model mortar and its binder. Both above mentioned aspects integrally apply only if samples in a sulfate bath are monitored at the same time as well. Consequently, a test of samples placed in a water bath alone cannot substitute a comprehensive test in a sulfate bath, yet it can suitably complement it.
3.7.3. Formation of Hairline Cracks
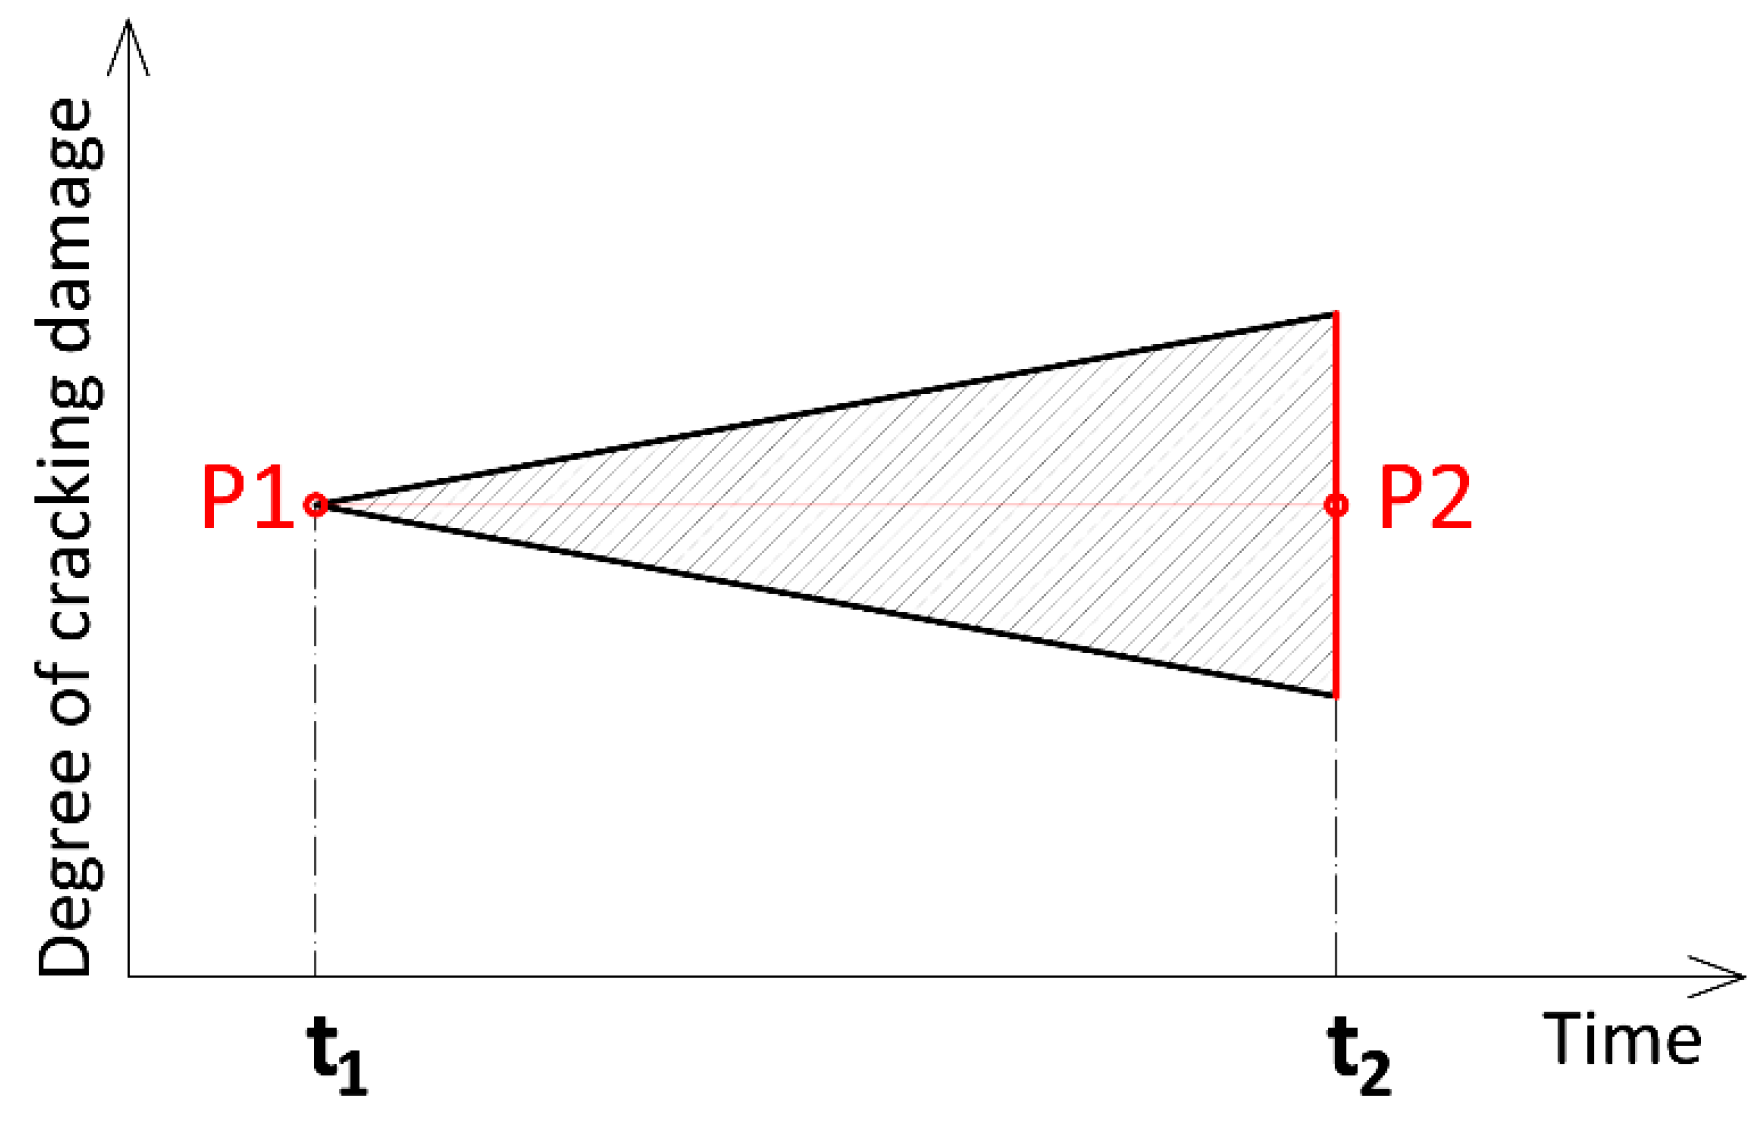
The formation and development of cracks was visually monitored on all test specimens placed in the sulfate bath. The condition of the cracks was monitored not only at the standard test intervals, but significantly more often—always once a week. To make the acquired results of the process of formation and development of cracking of the model mortars more understandable, a graphical method (or graphical supplement) was devised and successfully tested at the research department and allows an easy comparison of the crack formation process of several simultaneously tested materials (here mortars). The method was designated with the abbreviated TBTC (time-bound triangles of cracking). Its formulation was based on the finding that hairline cracking in the case of all samples of all mixtures in the same type of aggressive bath progresses morphologically more or less identically. It basically differs in only two parameters:
Corrosion progresses by first forming hairline cracks along the edges of the test specimens. The formation (time of formation) of the first hairline cracks is represented by point P1 with a time coordinate t
1 in
Figure 8. In the following phase of the corrosion process, new hairline cracks form, still predominantly along the edges of the specimens. Only as time passes and the corrosion attack continues do the existing cracks interconnect along the perimeter of the specimens and concentrate in the corners, where the damage is by far the highest (this is shown in the photographs in
Section 4). Some of the side surfaces of the specimens tend to separate from the core of the specimen. Basically, it can be stated that the average crack width at this stage is approximately 1 mm with the width being larger at the corners and smaller in the center of the specimen. This relatively easily identifiable state can be considered as a limit for TBTC purposes and is marked by a point P2 with a time coordinate t
2 in
Figure 8.
Points P1 and P2 are plotted on the horizontal time axis, point P1 is the vertex of an isosceles triangle and point P2 is the center of its base. The width of the base is not prescribed but should be identical for all compared materials (triangles) in one graph. Only in this way will the TBTC method give an idea of the corrosion rate after the first formation of cracks. In summary, the vertex of the triangle in the case of TBTC represents the beginning of a visible destructive activity of the acting sulfates, its base and time t
2 then represent the moment of considered complete material destruction, and its height (i.e., distance between points P1 and P2) is proportional to the corrosion rate in the interval t
1–t
2. The principle of the construction of TBTC is presented in
Figure 8. In general, however, drawing only one triangle lacks logic since the significance of the TBTC method lies mainly in the fact that it allows an almost instant comparison of resistance of several materials tested simultaneously. In addition, it does not require the production of any other test specimens, it is sufficient to closely observe the existing test specimens (designed, for example, to monitor length and mass changes, as in this experiment).
4. Results and Discussion
At the beginning of the result analysis, it is necessary to briefly discuss the physical and mechanical properties of the prepared MMs (see
Table 2). The requirement was that the SCC strength class be at least C 50/60. Additionally, the MMs were required not to be worse than the vibro press compacted concrete from the straight section of the pipes. The strength class requirement must be verified on concrete; however, this only makes sense for those MMs and corresponding concretes that have successfully passed the durability test. It is already evident that concretes derived from mortars with a compressive strength higher than around 90 N/mm
2 will certainly meet the strength condition. There are five such mortars in the experimental setup. Only reference mortars M1, M2 and M3 did not achieve higher compressive strength than 90 N/mm
2 after 28 days of aging. The worst of them is mortar M3, which is M2 (model mortar for standard SCC) modified with the crystallization admixture Xypex Admix C-1000. This crystallization admixture was the biggest disappointment of the entire tested MM set. The biggest issue of the Xypex Admix C-1000 admixture occurred already during the preparation of the MM, when M3 required a 45% increase in the plasticizer dosage to achieve the same consistency as the initial M2. In absolute terms, this is an increase of 5 kg/m
3, which means, among other things, an increase of the amount of water by 3–4 L/m
3. As a result, M3 was by a few % worse in all indicators than the original M2. In terms of compressive strength, on the other hand, the majority of the other MMs can be evaluated positively as almost all have achieved compressive strengths higher than 100 N/mm
2. An excellent result has been achieved with the MM with GBFS—the average compressive strength after 28 days was 134.4 N/mm
2. This constituted a promising precondition for improved resistance in aggressive sulfate environments.
The following part includes a graphical representation of the parameters of selected corrosion indicators of all the tested model mortars placed in the environment of 5% sodium sulfate, as well as in the water bath. In all the graphs, each plotted point represents an arithmetic mean of the measurements on four test specimens and the error bars represent the sample standard deviation.
4.1. Relative Mass Change
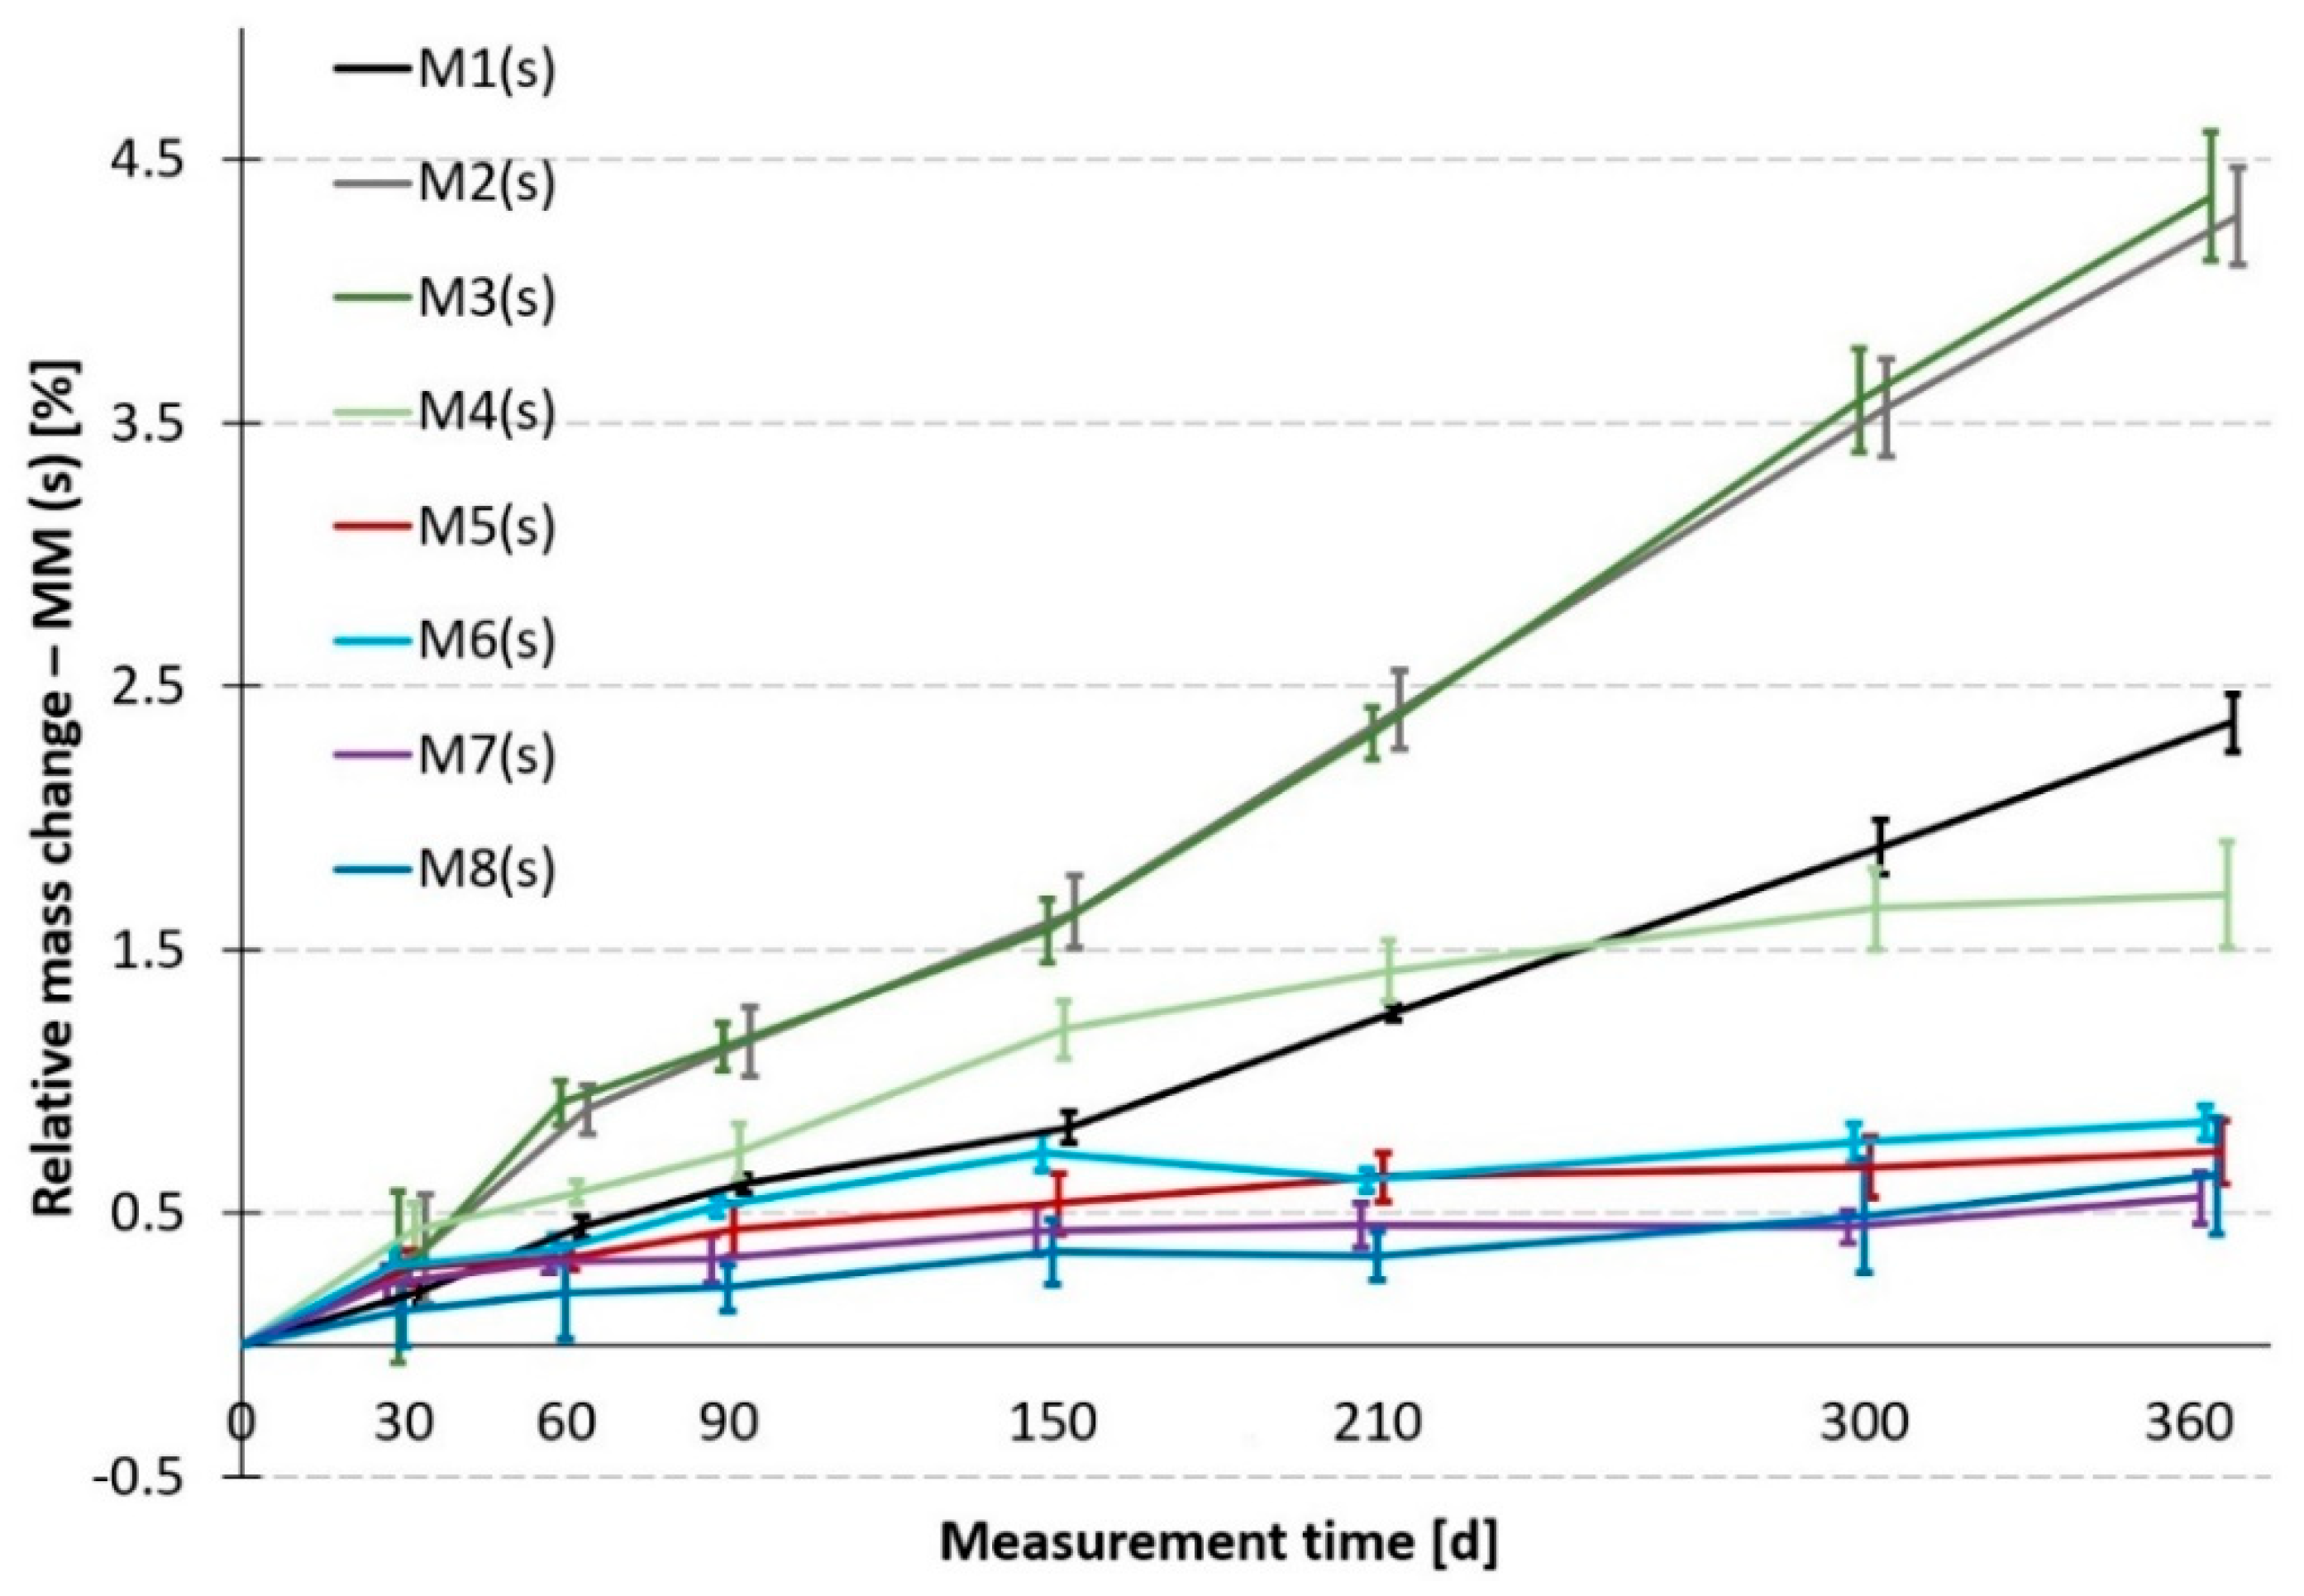
For the sake of clarity, the development of the relative mass changes in the sulfate bath (
Figure 9) and in the water bath (
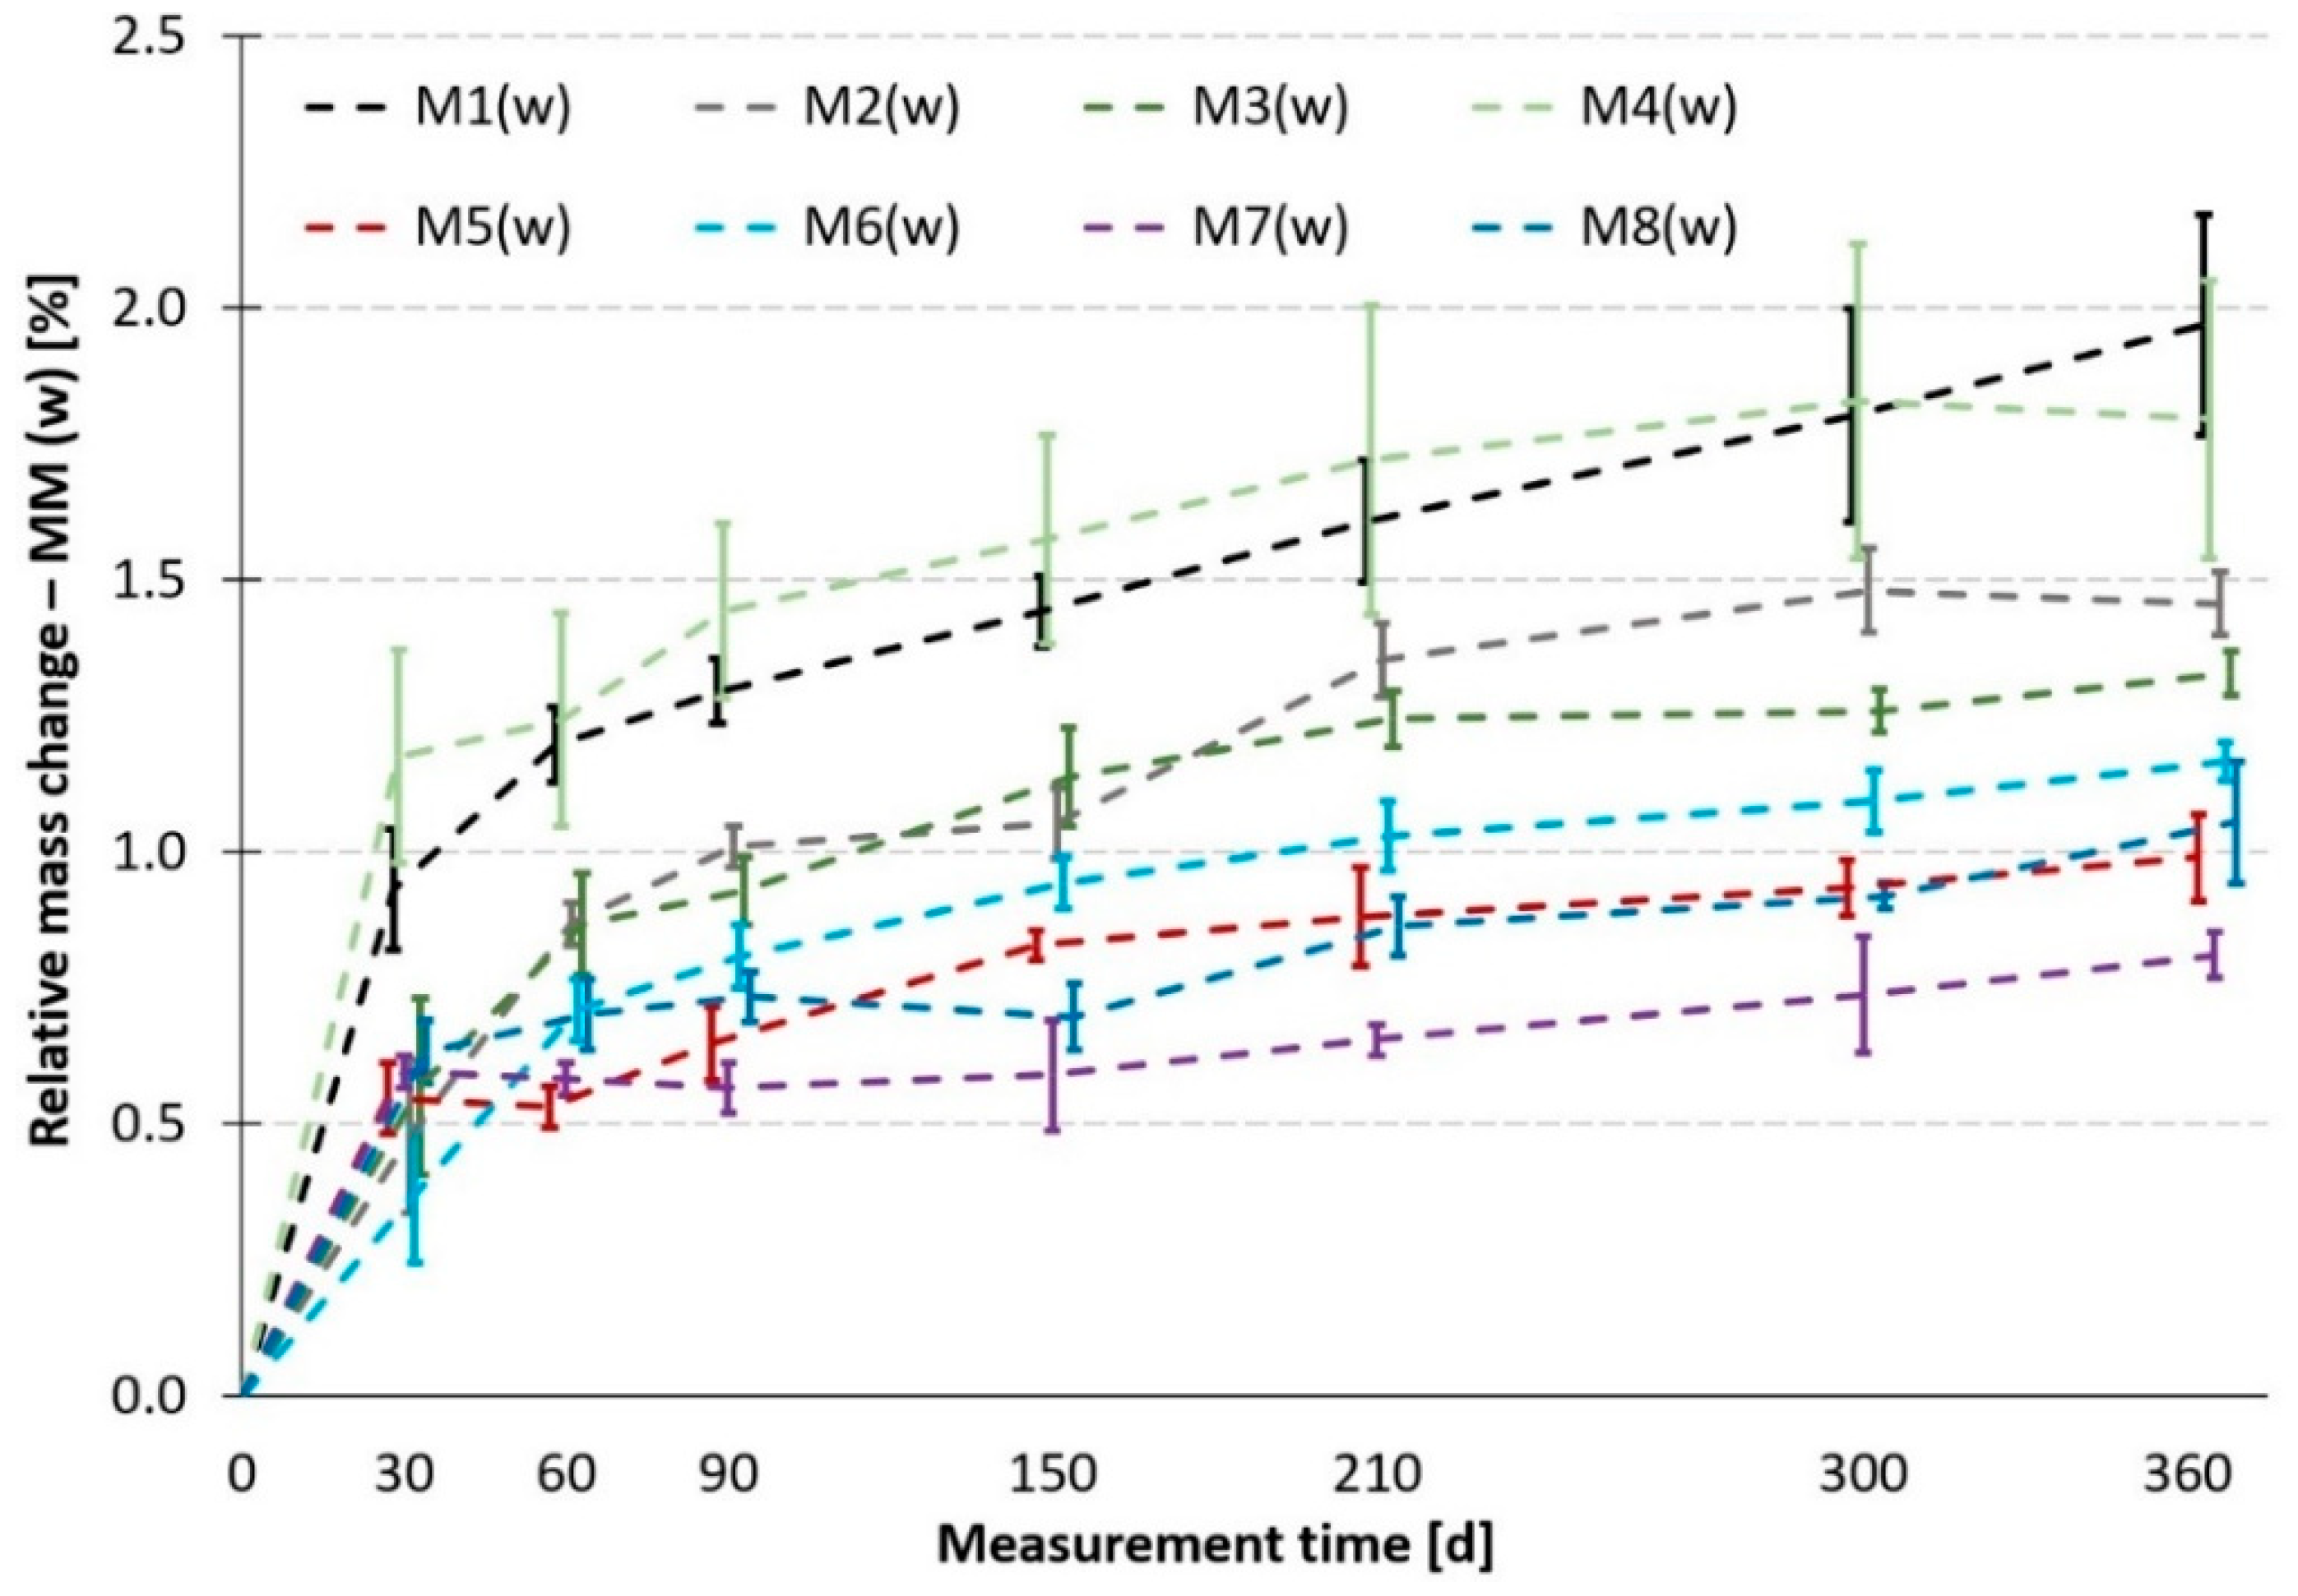
Figure 10) has been plotted separately. Each graph can then be assessed individually, with the results partially verifying each other as described in the
Section 3.7.2. It is not possible to “clean” the values acquired from the samples in the sulfate bath from their natural absorbency, i.e., to subtract the reference values (w) from the values acquired on the parallel samples in the corrosive environment (s). If this happened, the result would often be meaningless data. The structure of individual model mortars develops differently in a sulfate bath than in a water bath. Therefore, changes in mass will be monitored separately for the placement in sulfates (s) and separately in the case of data obtained in the water bath (w).
Figure 9 indicates that the tested materials can be divided into three groups. Group 1 are the worst MMs (they have the highest mass gain). These are materials M2 and M3, which is completely in line with their composition and expectations. Group 2 are MMs of medium resistance. These are mortars M1 and M4, i.e., the reference mortar modeling vibro press compacted concrete and the mortar modeling optimized SCC (which is without special admixtures, however). When compared to groups 1 and 3, they again exhibit corresponding behavior to their composition. Group 3 are MMs of the highest resistance. This group comprises all mortars with a modified binder, i.e., M5 with GBFS and M6 to M8 with metakaolin. A significant benefit is evident in the case of the used admixtures, especially of metakaolin. This corresponds with the results already published [
36,
37].
If data in
Figure 9 and
Figure 10 are compared, it can be stated that the trends in the behavior of individual MMs are not entirely identical. First of all, there is no significant division into 3 groups in regard to absorbency. However, it is true that the best—the least absorbent—are all MMs containing metakaolin or GBFS. An excellent match occurs here with the results from the sulfate bath. The remaining two groups of medium and least resistant materials have practically merged here into one, with the worst materials being mortars M1 and M4. This can be explained, for example, by the high cement paste content in M4, etc. However, as has been mentioned earlier, these are only supplementary results and in addition, exhibit a considerable variance of the measured values.
Regarding the specific project task concerning the entire mass change issue, it can be stated that it was possible to demonstrably prove that the newly developed MMs with metakaolin or GBFS exhibit evidently better parameters than the other mortars.
The project task also implies the obligation to compare the results of the main reference mortar M1 with the newly designed MMs with MK. The findings stated above clearly show that all three MMs with metakaolin exhibit significantly better resistance to sulfates than the reference mortar M1.
4.2. Relative Length Change
Monitoring of relative length changes also included test specimens placed in the sulfate bath (s) and specimens placed in the water bath (w). In this case, the effect of absorbency on length changes is marginal and there is no reason to study it, especially when the given water absorbency (causing a significant increase in the sample mass) does not introduce stresses that would significantly contribute to length changes. These will only occur due to crystal pressures, and only in the case of samples in the sulfate bath. In addition, the determined values range within possible measurement errors, as indicated by data in
Figure 11,
Figure 12 and
Figure 13 in particular. For this reason, the importance of the observed length changes of the samples in the water bath is indeed rather insignificant.
The small significance of length changes of the test specimens from the water bath can be demonstrated somewhat curiously by a comparison of the graphs in
Figure 11 and
Figure 12.
Figure 11 presents only the values of relative length changes acquired from the samples placed in the sulfate bath whereas
Figure 12 includes also the results obtained for the samples placed in the water bath. The graph remained practically unchanged, all the added data were “hidden” in the lower part of the graph among the best results of mortars from the sulfate bath, i.e., among the minimum values.
In summary, it can be stated that the worst results, i.e., the greatest elongations, are exhibited identically to the relative mass changes in the case of mortars M2 and M3. Moreover, mortar M3 with the crystallization admixture Xypex Admix C-1000 is even significantly worse than the mortar without the admixture (M2).
For the presented project, it is again important to compare the result of the main reference mortar M1 with the newly designed MMs (concretes) containing metakaolin (M6, M7 and M8). For this assessment, it is necessary to analyze the detailed graph in
Figure 13. The graph clearly shows that the MMs with metakaolin exhibit a significantly lower elongation than the reference mortar M1. Mortars M2 and M3 have been omitted completely in the selected detailed presentation since they would be outside the displayed part of the graph from the 90-day interval. Model mortars M7 and M8 have yet again essentially identical results.
4.3. Monitoring of Crack Formation and Development, Expressed Using the TBTC Method
Monitoring of crack formation and development was expressed using the TBTC method, whose principle was explained in
Section 3.7.3.
Figure 14 presented below contains a respective graphical representation and an accompanying commentary. During one year of the prescribed testing, cracks formed in four of the eight tested MMs. They appeared after 75 days of exposure in the case of mortars M2 and M3, after 105 days in the case of M1, and after 150 days in the case of M4. The worst of them is again M3, because its triangle has the base in the position of 285 days. In the case of M2, this occurred after 330 days, and with M1 it was 345 days. As regards M4, full crack development did not occur until the end of the experiment (within 365 days), while in the case of M5, the first cracks were recorded only at the official end of the experiment, i.e., after 365 days. There were no cracks recorded within the 365 days of the experiment in mortars M6, M7 and M8. The test specimens from those three mortars were therefore left in the sulfate bath even after the official end of the test, solely for the purpose of a visual inspection (length and mass were no longer determined). All three mortars exhibit the onset of cracking, i.e., the first hairline cracks, after 420 days of placement in the sulfate bath. This marked the definitive end of the test and there was no reason to monitor the samples any longer. The mortars containing metakaolin were again significantly better than M1 and all the others.
Figure 15 shows the condition of the model mortar M6 when the first hairline cracks were detected (in the case of TBTC, the vertex of the triangle is shown at this time).
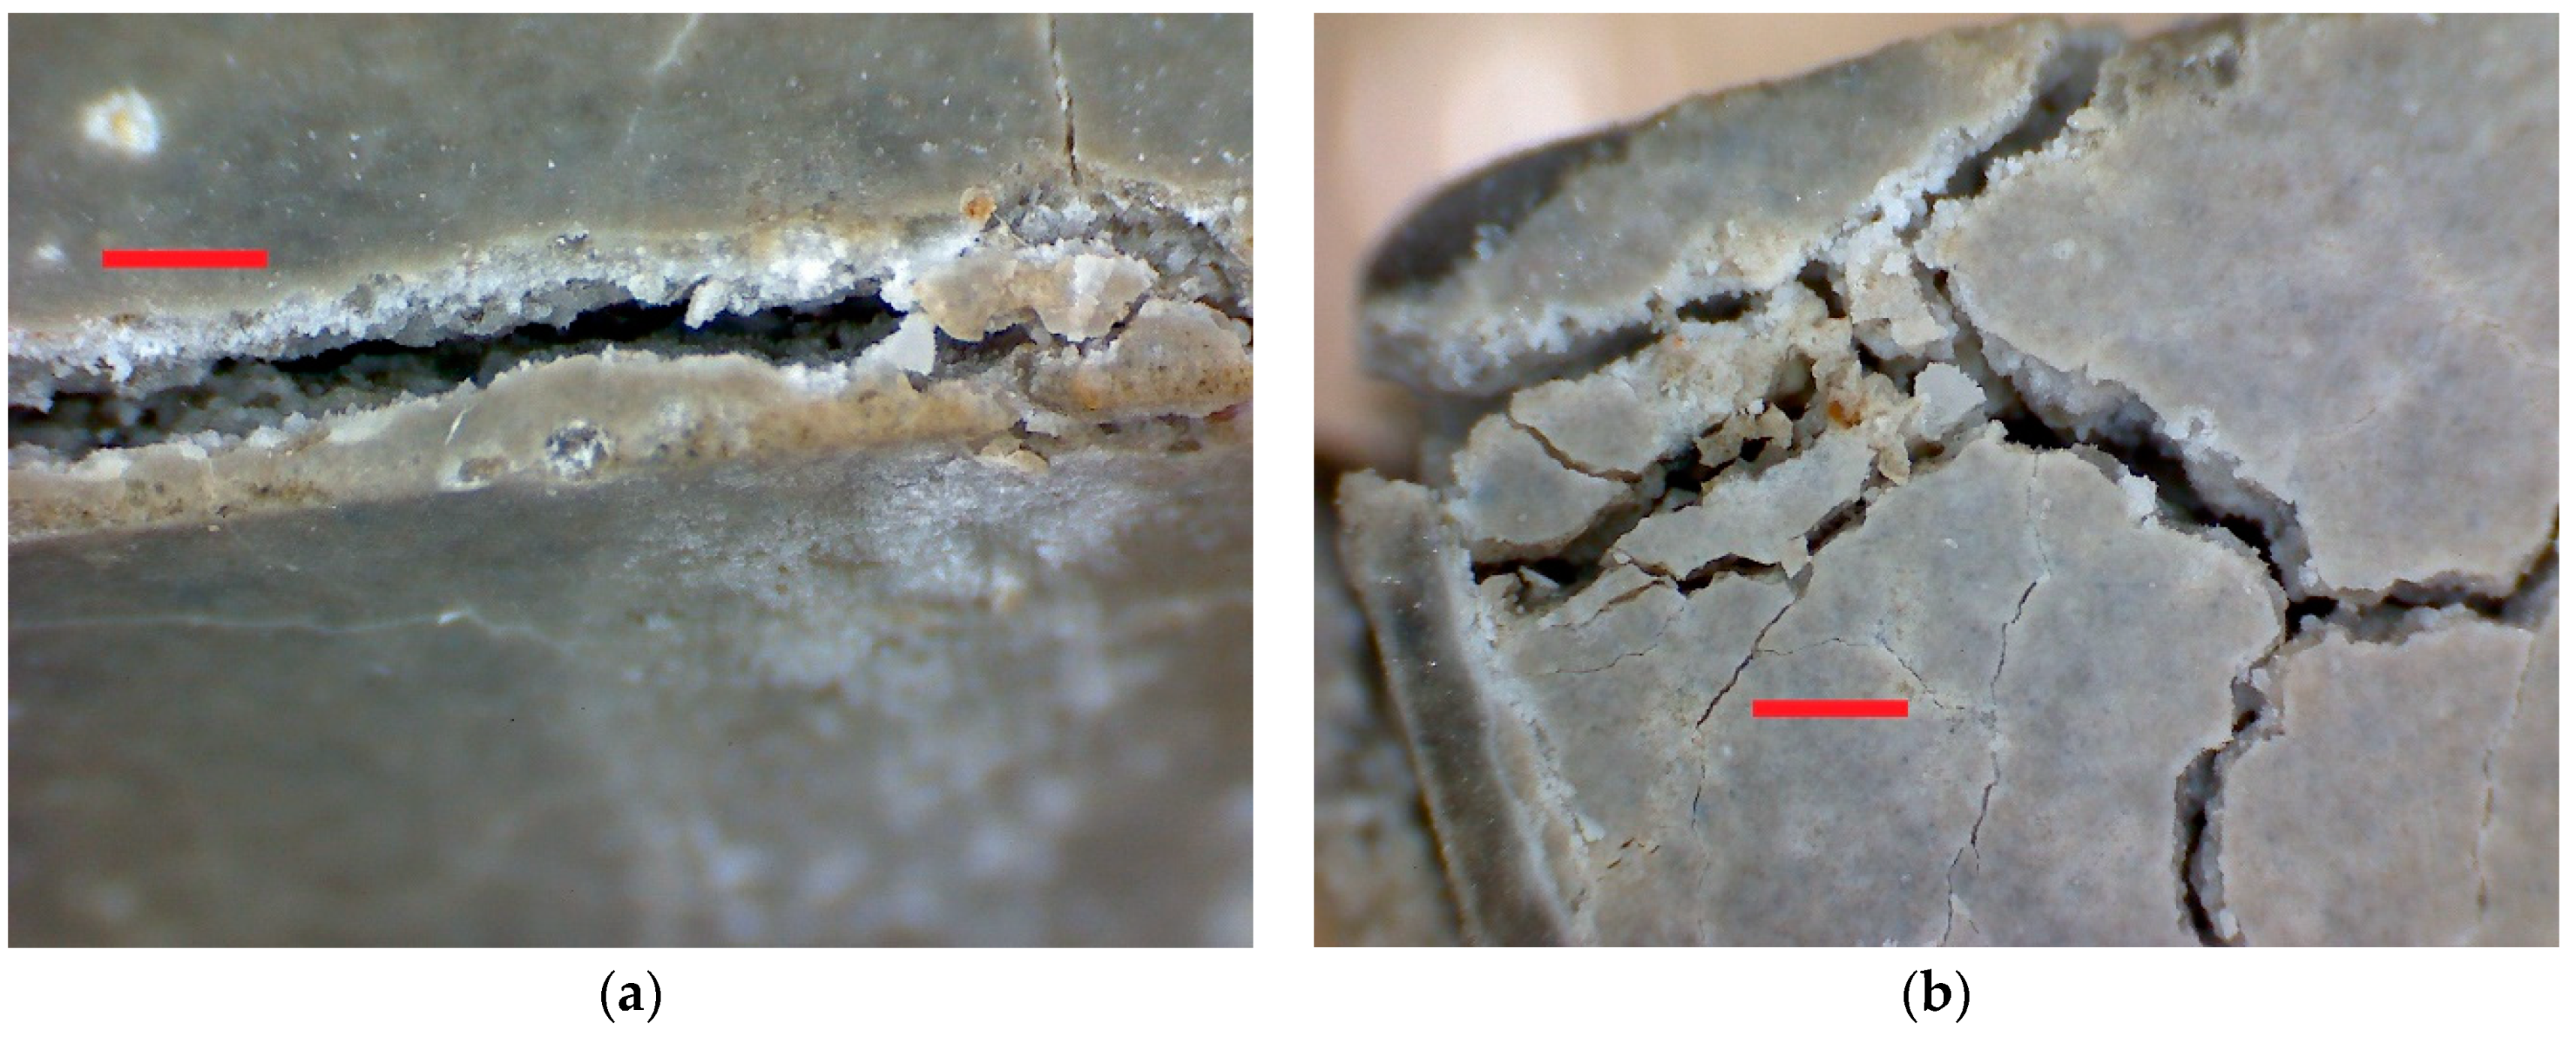
Figure 16 and
Figure 17 show the condition of the model mortar M3 at the time of limit cracking damage (represented by point P2 in
Figure 8).
Larger cracking of the corner parts of the small beams is caused by a more intensive supply of sulfates, which penetrate the specimen from two directions. This can be prevented, for example, by applying epoxy resin to the front and back faces [
16]; however, we did not do so to ensure comparability of the results with other experiments.


