Article

Experimental Evaluation of Connectors Performance for Modular Double-Skinned Composite Tubular Wind Turbine Tower

Coastal Development and Ocean Energy Research Center, Korea Institute of Ocean Science and Technology, 385 Haeyang-ro, Yeongdo-gu, Busan 49111, Korea
*
Author to whom correspondence should be addressed.
Appl. Sci. 2021, 11(13), 5899; https://doi.org/10.3390/app11135899
Submission received: 7 June 2021 / Revised: 22 June 2021 / Accepted: 22 June 2021 / Published: 25 June 2021
(This article belongs to the Topic Advances on Structural Engineering)

Abstract

:
Three types of connectors were proposed and tested for a modular double-skinned composite tubular (DSCT) wind turbine tower, which is composed of two concentric steel tubes filled with concrete between them. The three proposed types were a socket type connector, an H-type connector, and a bolted–welded with shear key connector. Using the proposed connectors, three modular DSCT tower specimens and a single-body specimen were built. Then, quasi-static tests were conducted to evaluate the performance of the three types of connectors, and their behavioral characteristics and failure modes were analyzed. The test results showed that the bolted–welded with shear key connector specimen exerted an almost equal moment resisting capacity as the single-body specimen; however, the other modular specimens exerted only half the moment resisting capacity of the single-body specimen. Moreover, the results showed that the bolted–welded with shear key connector is applicable in a modular DSCT wind turbine tower as it has equal ductility, maximum lateral displacement, and energy dissipation as the single-body specimen.

1. Introduction

The current trend of increasing wind turbine capacities requires the use of longer blades that increase the overall turbine weight [1]. Correspondingly, it is necessary to increase the height and diameter of the wind turbine tower to support longer blades and a heavier turbine. Currently, wind turbines are generally equipped with steel tower supports [2]. However, a high tower results in a large slenderness ratio, which poses a risk of buckling failure. There have been actual cases of tower failures [3,4]. In addition, excessive increase in tower diameter could induce increased stresses from wind load and from offshore environmental conditions. Therefore, a new wind tower design that could minimize the increase in tower diameter and ensure safety from buckling failure is necessary.
There are different types of wind turbine towers that can replace existing steel towers: a concrete tower [5], a hybrid tower [6], an internally confined hollow reinforced concrete (ICH RC) tower [7], a double-skinned concrete tubular (DSCT) tower [8], a tower using composite materials, etc. Concrete and hybrid towers have been commercialized in Europe and the US; studies on applying ICH RC and DSCT towers to the supporting structures for a wind turbine have been conducted in Korea [9,10].
A DSCT column filled with concrete between the inner tube and outer tube was suggested by Shakir-Khali and Illouli [11] and was studied by other researchers. Han et al. [12,13] studied a nonlinear concrete material model considering the confinement effect inside the column; additionally, they also conducted studies on a nonlinear analysis model of the DSCT column. Won et al. [14] conducted research on connections between the pier and segment and between the pier and basement.
In this study, modular DSCT columns were designed and experimented to develop a modular DSCT wind turbine tower as shown in Figure 1. Three DSCT columns having different types of module joints were proposed. Three specimens with modularized DSCT columns and one specimen of a single-body DSCT column without any connection were constructed. The performances of the four specimens were evaluated by quasi-static tests and were compared.

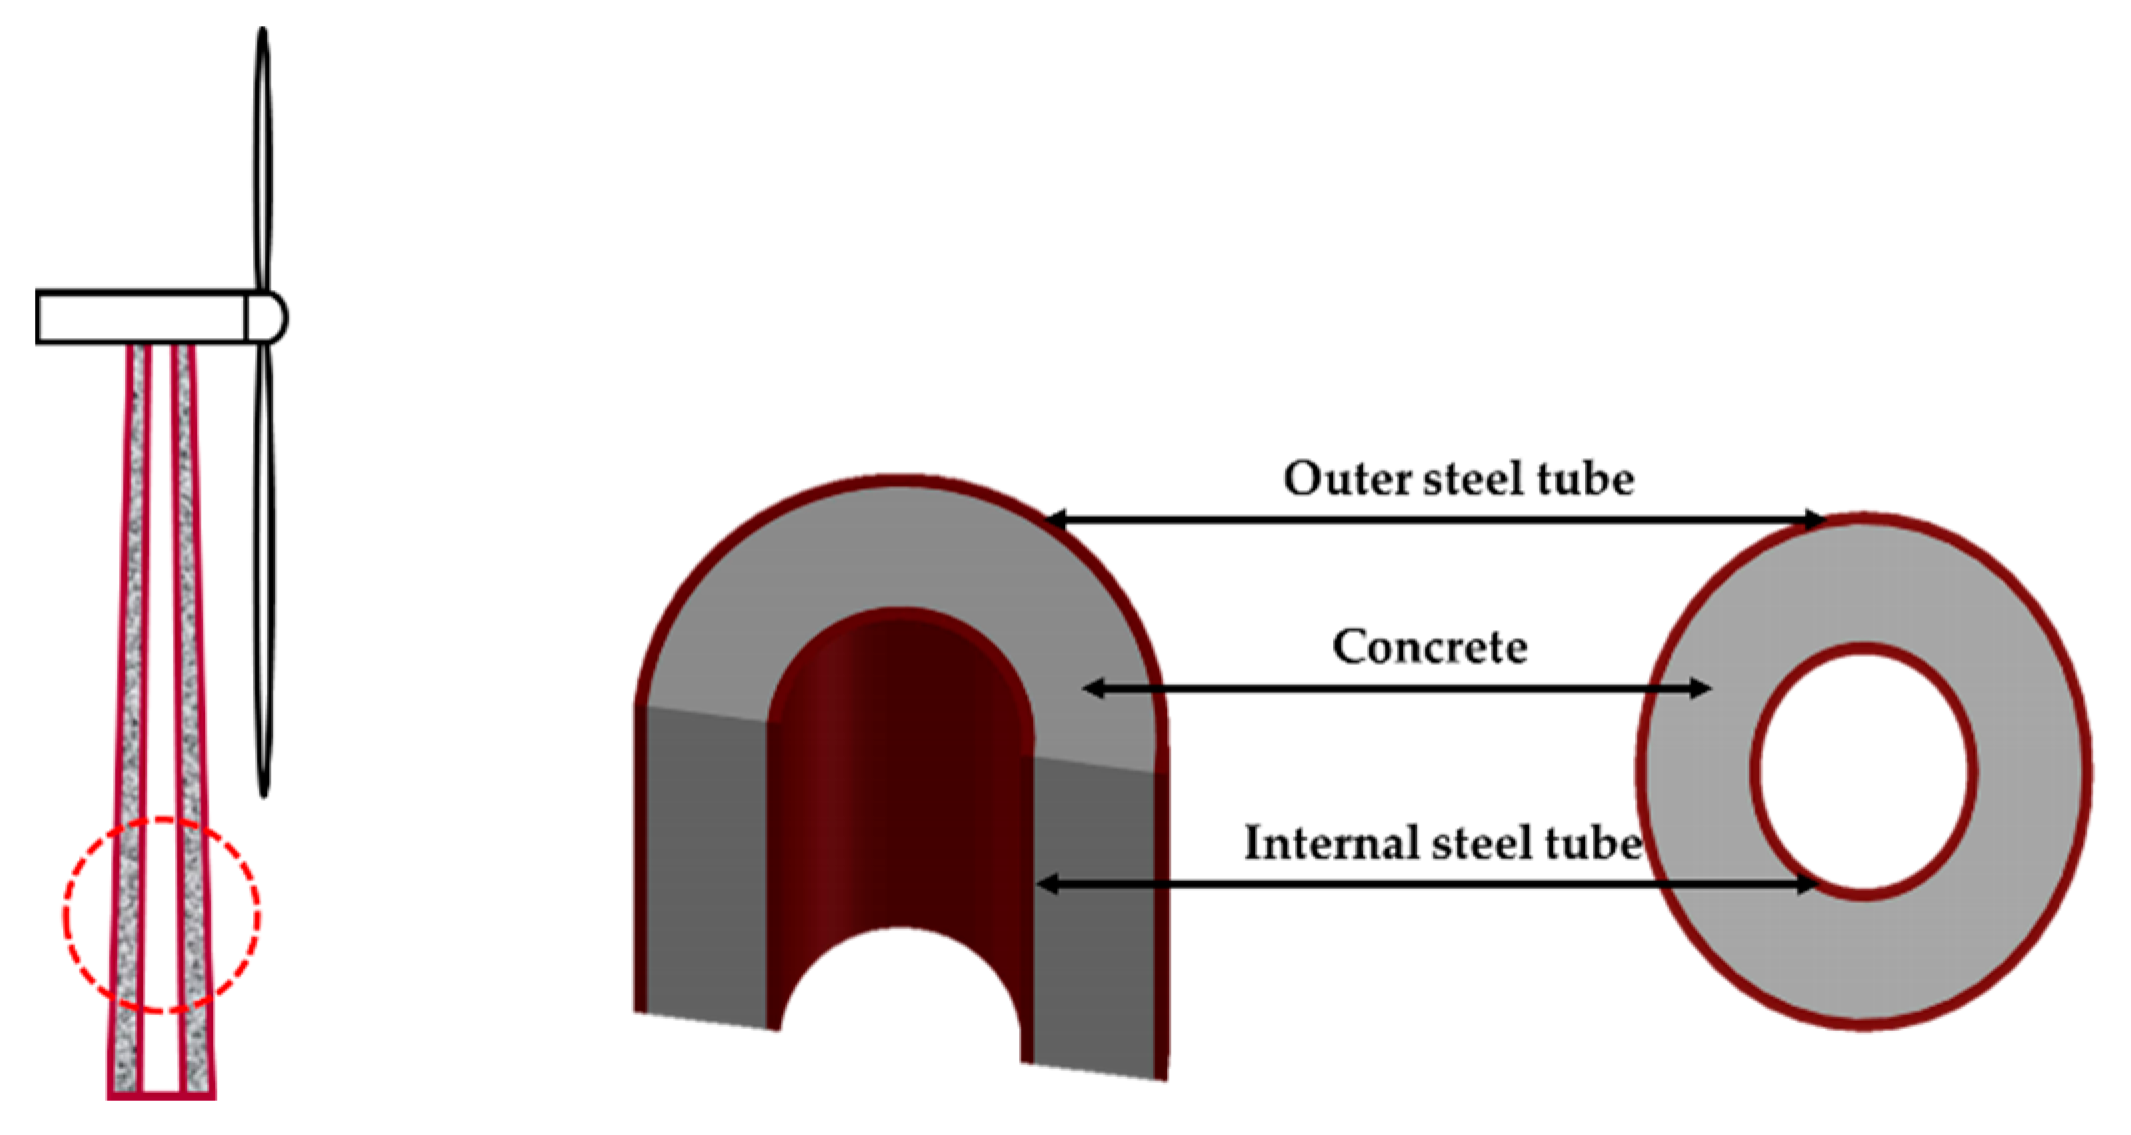
2. Design of DSCT Specimens

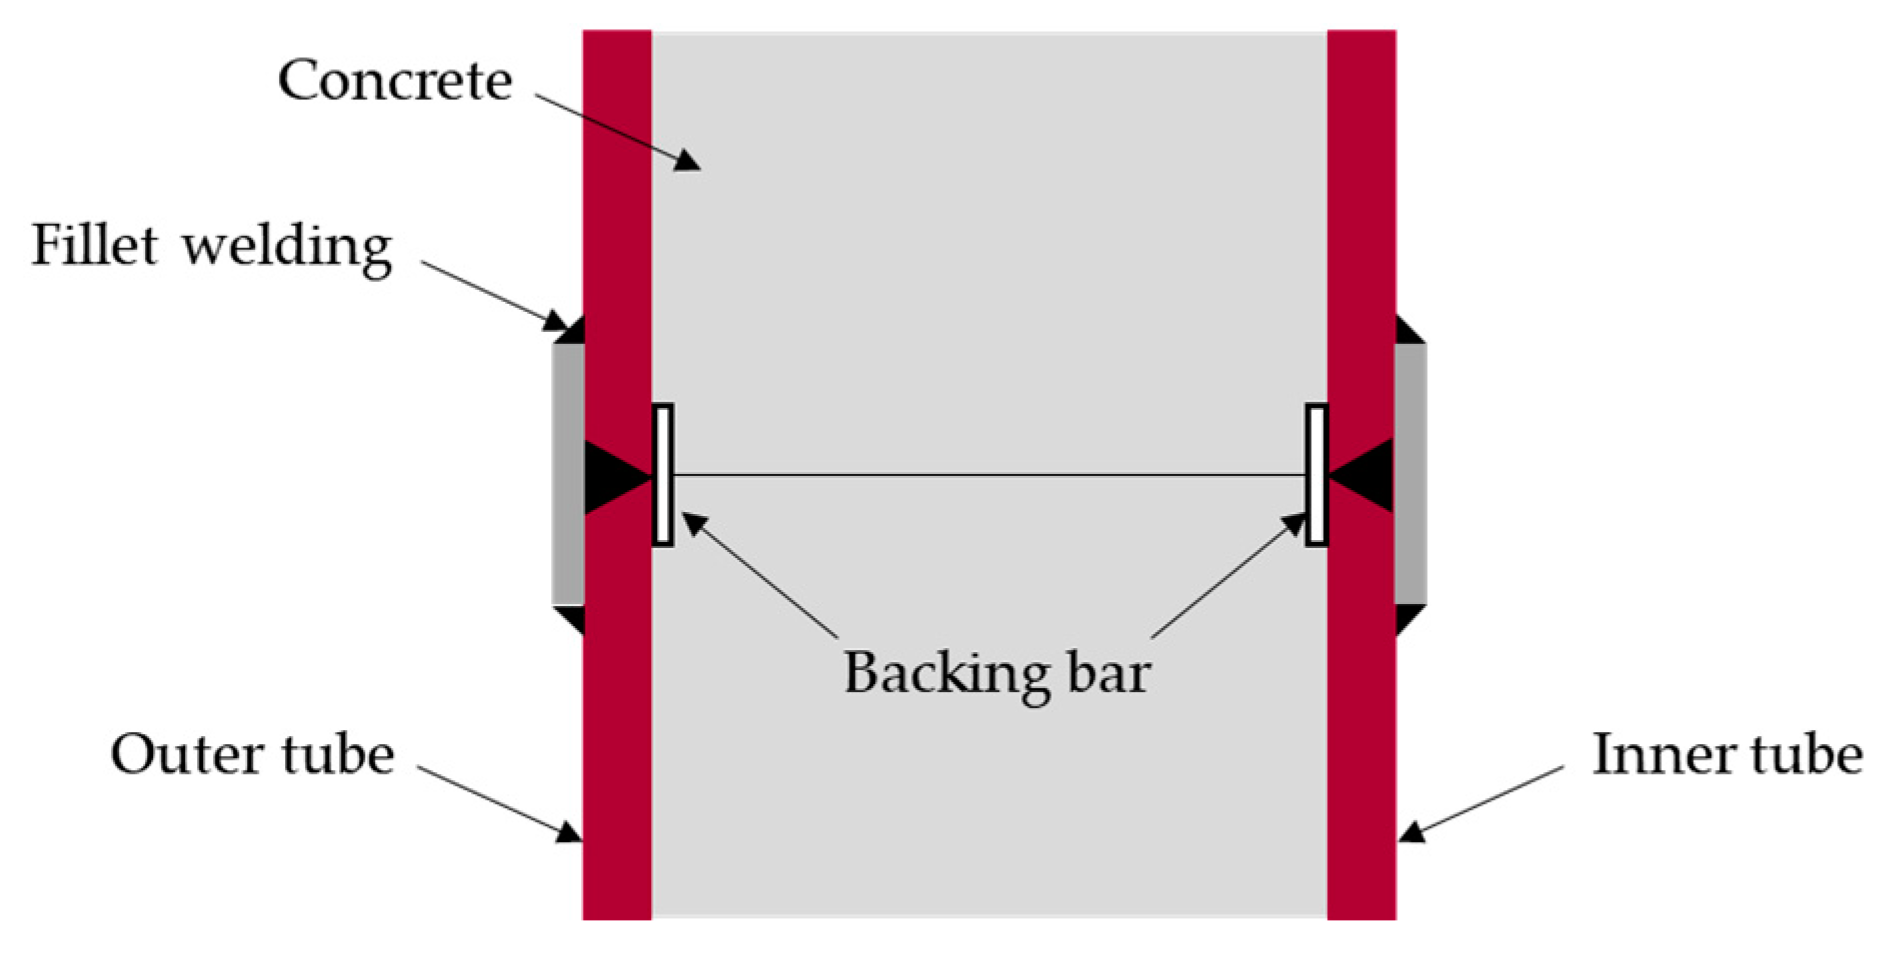
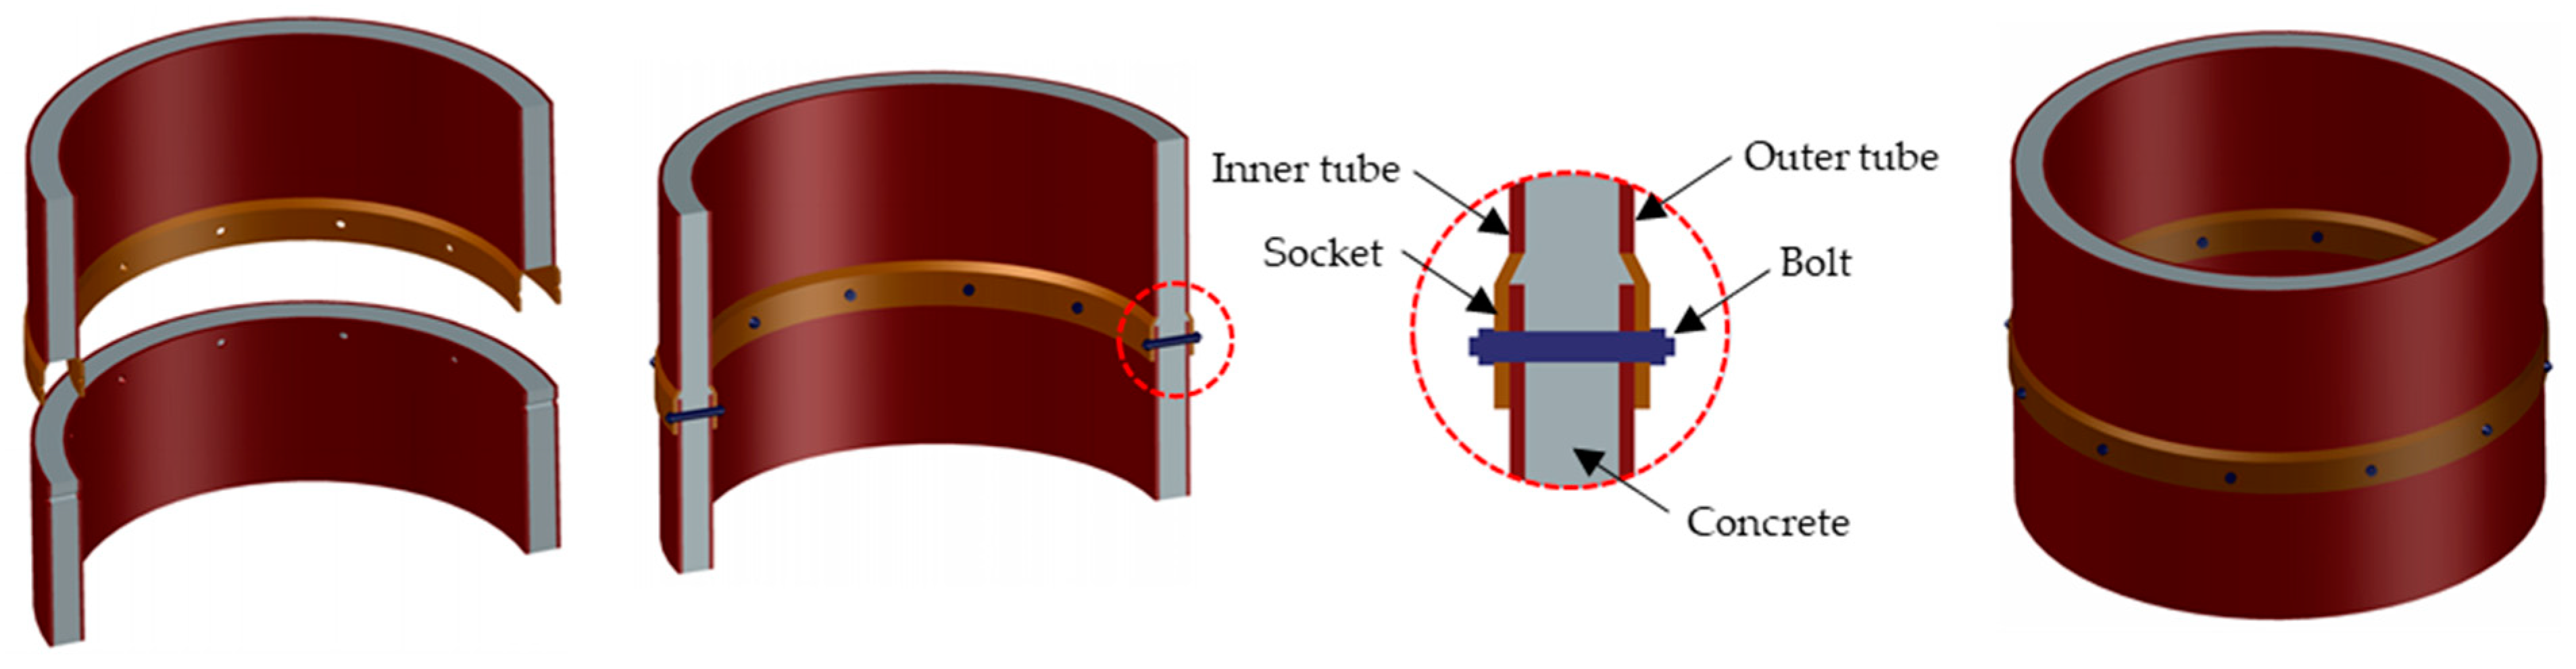
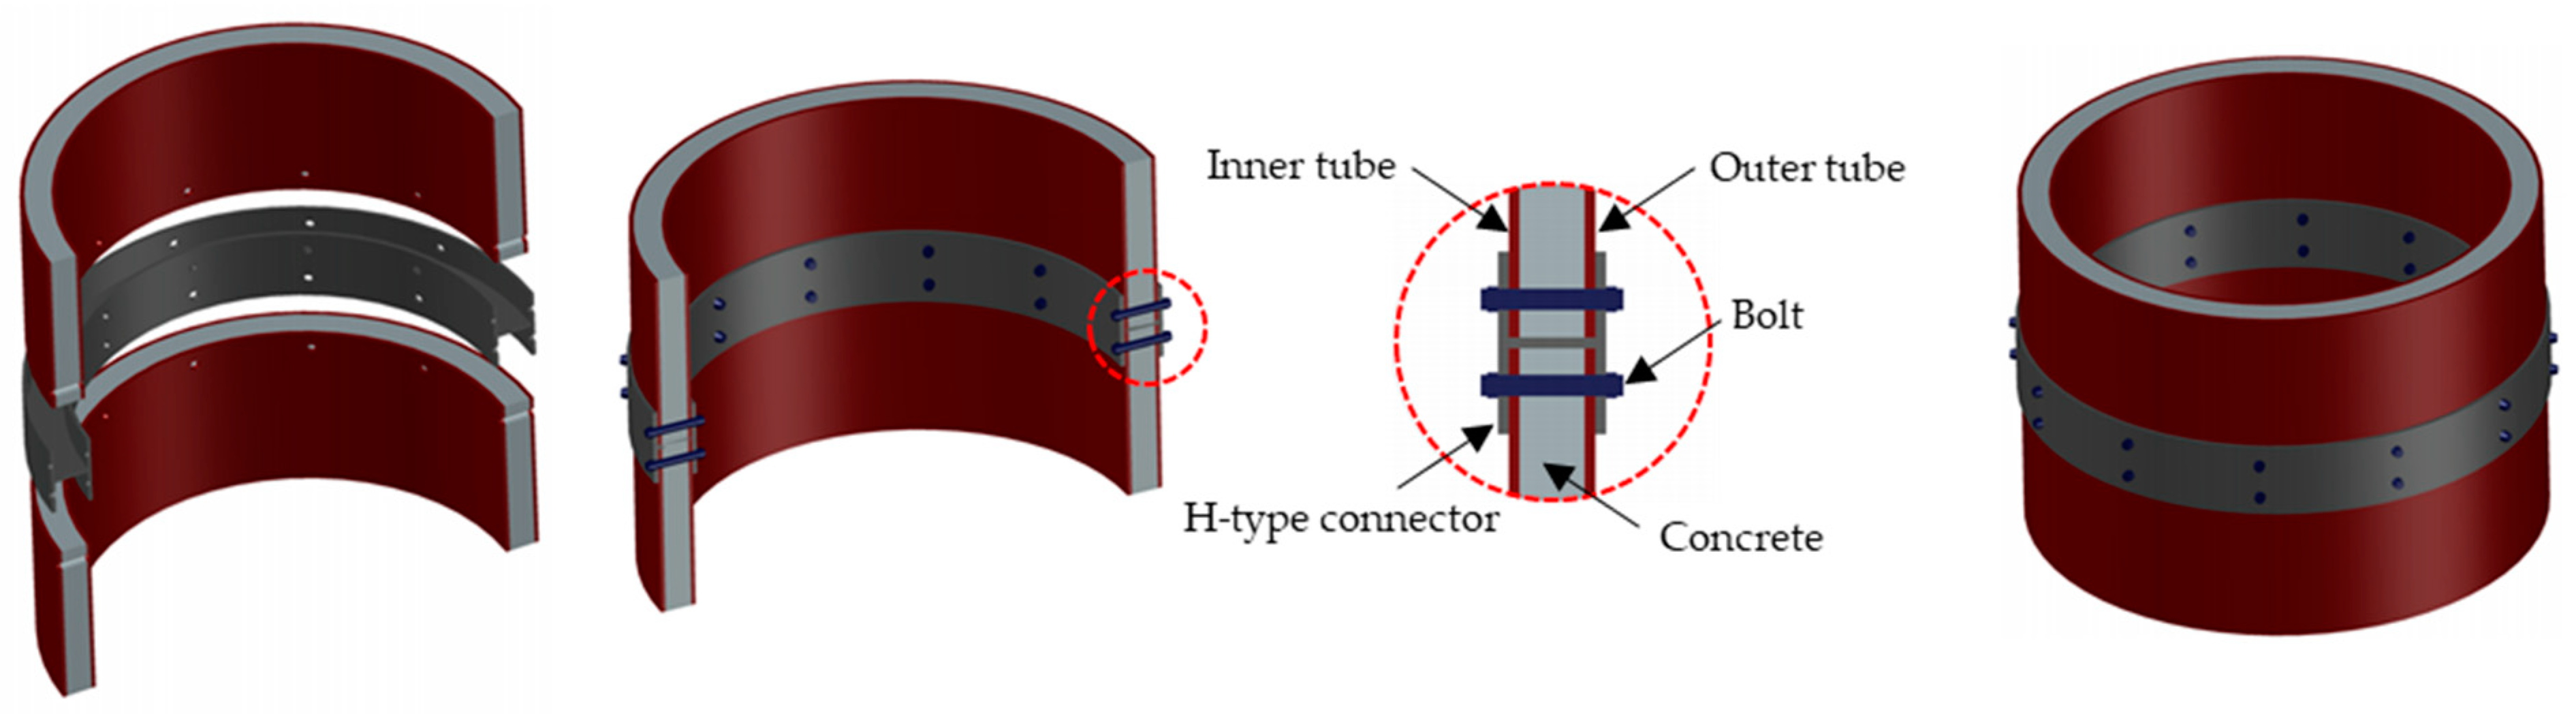
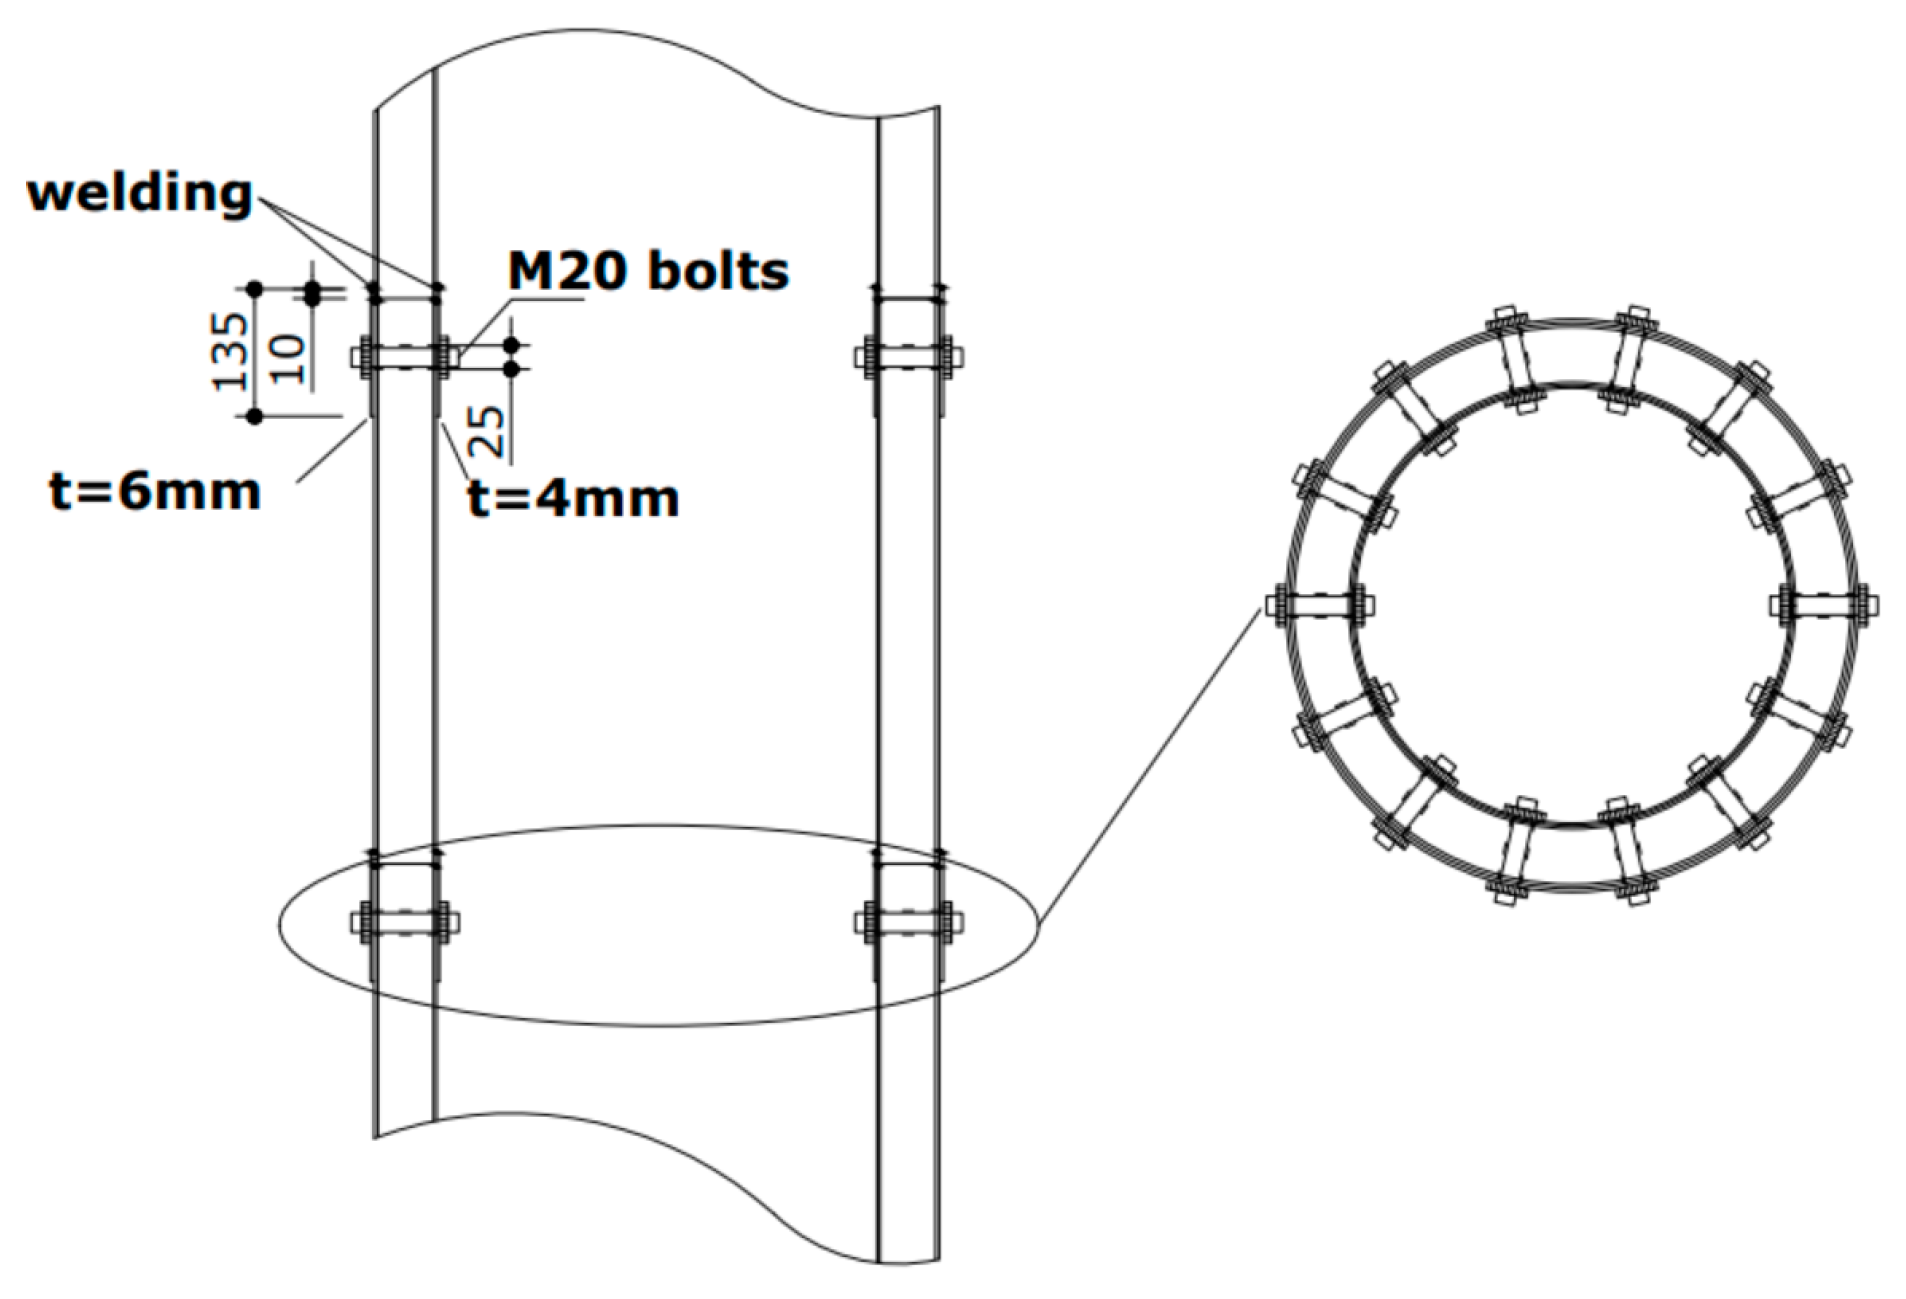
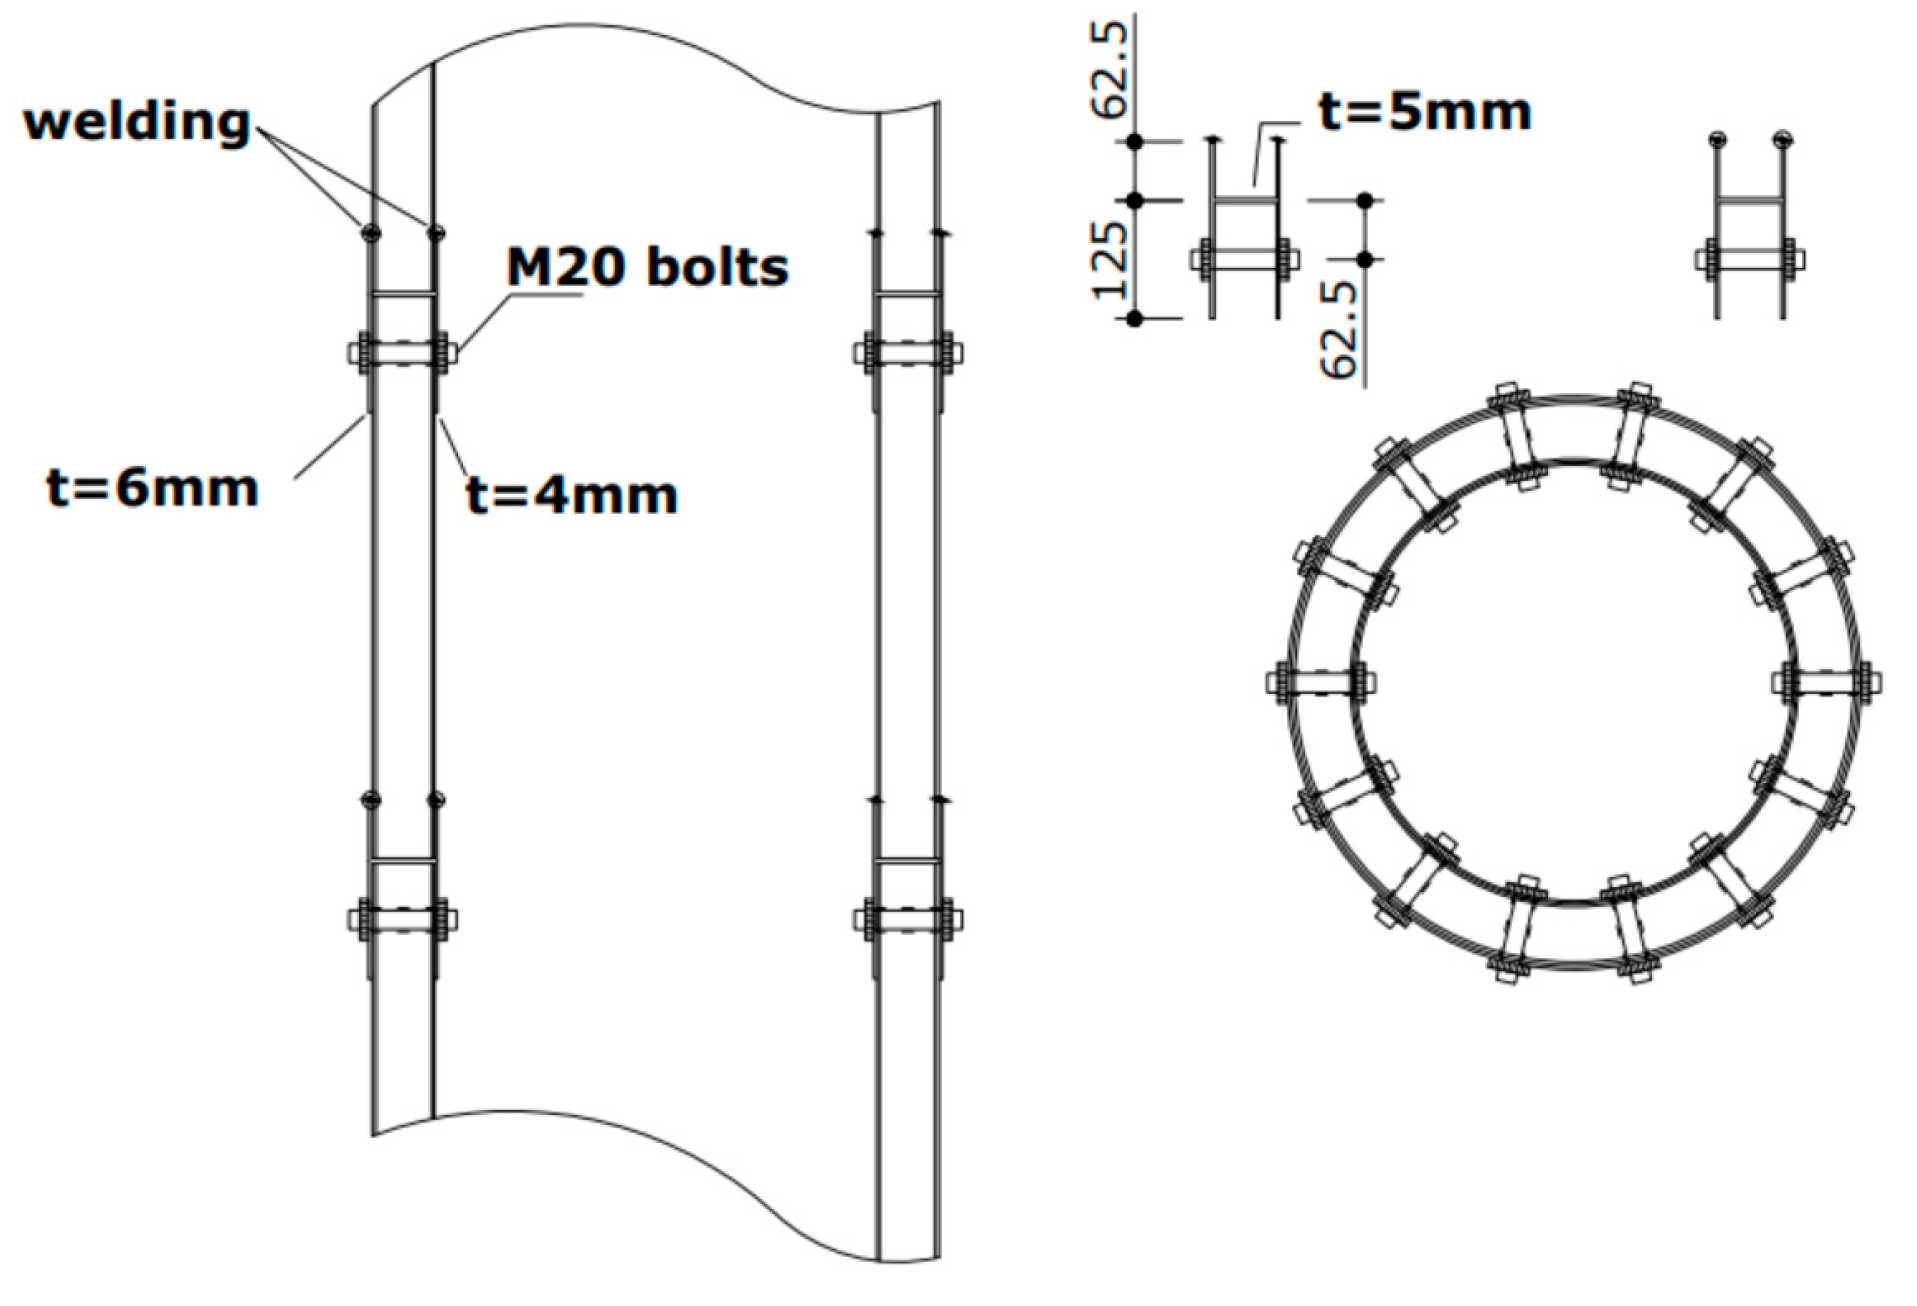
2.1. Types of Module Joints

A DSCT wind turbine tower consists of concrete between the inner and outer tubes; therefore, it is heavier than a steel tower and a high capacity tower crane is required to build a single-body DSCT wind turbine tower. In terms of construction and transportation, modularizing a DSCT wind turbine tower could enhance economic feasibility. Modular joints that can be assembled onsite are required for the construction of a modular DSCT wind turbine tower; the joints should be developed and designed to sustain the stresses of the tower.
There are three main methods of assembling the modules of a DSCT wind tower: connecting the inner tubes and outer tubes as shown in Figure 2, connecting concrete by using shear keys as shown in Figure 3, and joining all three of them as shown in Figure 4.
In this study, three types of module joints were developed and their performances were confirmed by experiments. The first is a socket type connection (Type-S) between the upper and lower modules as shown in Figure 5.
The second type of module joint is similar to Type-S; however, there is an H-shaped connector between modules as shown in Figure 6 (Type-H). In this type, an H-shaped connector is attached to the upper module by welding or by bolting; then, the upper module is assembled with the lower module by bolting at the construction site. Figure 7 shows the last type of joint that links all three components of a DSCT wind turbine tower: inner tubes are connected by bolting, outer tubes are joined by welding, and concrete parts are linked with shear keys fixed by injecting mortar (Type-W).

2.2. Section Design

The cross-section of the single-body DSCT wind turbine tower was designed before the modularized DSCT tower. Considering the capacity of loading equipment, the outer diameter of the specimen was selected as 600 mm. The thickness of the outer tube was determined as 4 mm, which is the minimum value to avoid the local buckling failure of the outer tube. Therefore, the diameter of the outer tube was 596 mm. The hollow ratio of the specimen was set as 0.8 and the outer diameter of the inner tube was determined as 474 mm. Table 1 lists the properties of the used materials for pre-analysis. The height from the top of the base to the loading point was set as 2050 mm.
The required thickness of the inner tube was calculated using Equations (1) and (2) [13]. Equation (1) was used for calculating the minimum thickness ( t y ) required to resist yield failure, and Equation (2) was used for determining the minimum thickness ( t bk ) to prevent buckling failure.
t y = D i f o t y t o t D f y
t b k = 6 2.27 D i 2 f o t y t o t D E i t
where
D i : inner diameter of confined concrete (=outer diameter of inner tube),
D : outer diameter of confined concrete (=inner diameter of outer tube)
f o t y : yield strength of outer tube
t o t : thickness of outer tube
f y : yield strength of inner tube
E i t : modulus of elasticity of inner tube.
The design thickness of the inner tube should be greater than the value calculated from Equations (1) and (2). The required minimum thickness from Equation (1) was 3.2 mm, while 2.2 mm was the result using Equation (2). The thickness of the inner tube was finally designed as 3.2 mm.

2.3. Design of Type-S Joint

Type-S is one of the socket type joints, and it is installed by attaching steel plates at upper modules similar to those shown in Figure 5 and Figure 8. The tower modules are built in a factory at Hwasung, Korea, and are then assembled at the site (Suwon, Korea) where the tower is installed by bolting. They are about 30 km far from each other. This bolting connection is generally considered more convenient than welding connection on the field. However, the joint strength will be reduced if there is bolt failure or friction reduction.
The tower specimen was divided into three modules; 850 mm, 600 mm, 600 mm height from the bottom. As shown in Figure 8, the modules were designed with a 135 mm socket height, 6 mm outer steel socket thickness, and 4 mm inner steel socket thickness. The upper and lower modules were connected using 14 M20 bolts which had diameters of 20 mm.

2.4. Design of Type-H Joint

Type-H, which is a joint similar to Type-S, is achieved by inserting H-shaped connectors between the upper and lower modules. The H-connector can be connected to the upper module by welding or bolting; the upper and lower modules can be linked at the site where the tower is constructed. The H-connector used has a 6 mm outer flange, 4 mm inner flange, and 5 mm horizontal plate thickness. The upper module and the H-connector were linked first by welding. Then, they were assembled with the lower modules onsite. The width of the flange attached to the upper modules was 62.5 mm, and that at the lower modules was 125 mm. The lower modules were coupled by 14 M20 bolts as shown in Figure 9.

2.5. Design of Type-W Joint

Type-W shown in Figure 10 is a joint where the outer tubes are connected by groove penetration welds, inner tubes are connected by bolting connections, and concrete parts are coupled by injecting mortar between the upper and lower modules. The modular DSCT tower using Type-W joint has the same appearance as that of the single-body DSCT tower; however, it has to be welded onsite, preferably by an automatic welding system, which is convenient for onsite construction. For increasing the shear strength capacity, shear keys of 30 mm height were built, and the concrete parts between the upper and lower modules were assembled by adding mortar. The flanges for connecting the inner tubes were designed with 50 mm width and 3.2 mm thickness, and they were coupled by 12 M20 bolts. In the view of mechanics, Type-S and Type-H connect modules by their shear strength, Type-W connects modules its tensile strength.

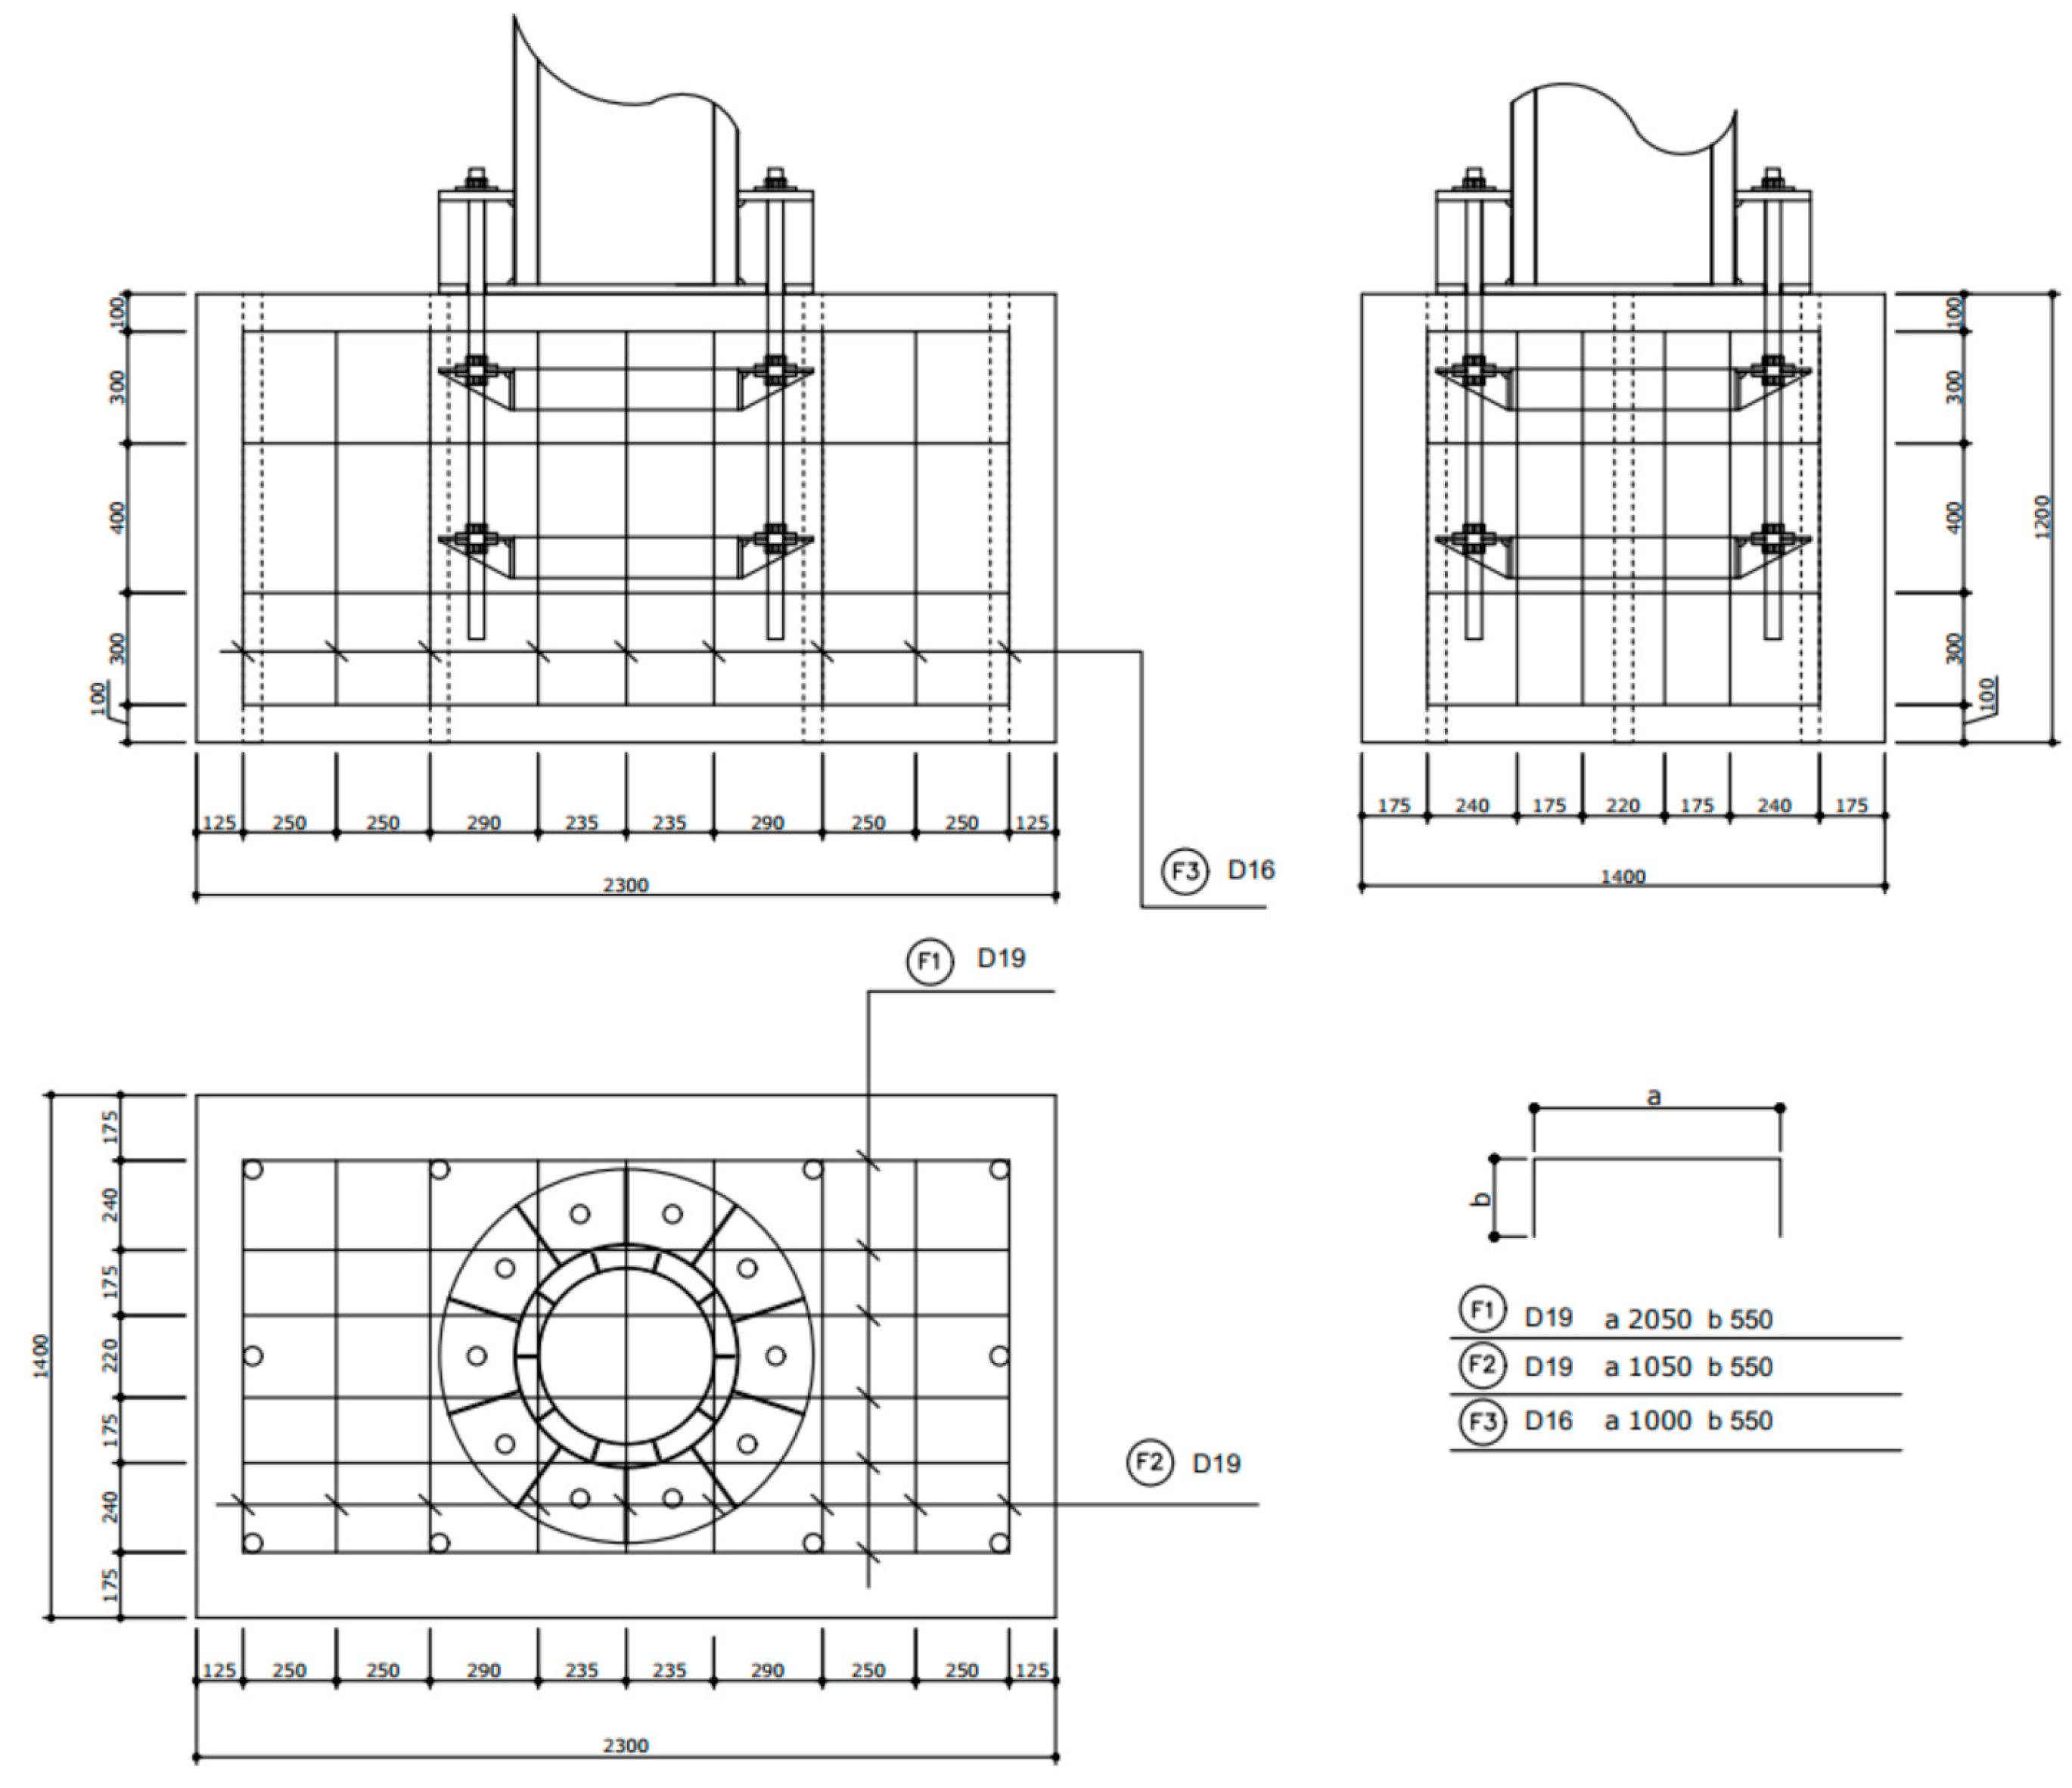
2.6. Design of Footing

The footings for the specimens were designed by using reinforced concrete. Figure 11 shows the base plate, which has a 275 mm height for both upper and lower plates; the width of the upper base plate was 200 mm. The thickness and width of the rib plates between base plates were 10 mm and 120 mm, respectively; ten high tensile bolts were used. The inner tube was welded with the lower base plate and triangular rib plates were attached. The thickness of the upper base plate was 25 mm.
An anchor plate should be installed to connect the base plate to the footing. The anchor plate had a ring shape as shown in Figure 12, and it was installed by using anchor bolts and nuts. Two anchor plates were inserted in the footing to fix the anchor bolts. Concrete reinforcements were distributed to avoid cracks and damages as shown in Figure 13.
Each tower specimen was designed to be composed of three modules. The lowest module at the tower bottom has a height of 850 mm, and both the two other modules have a height of 600 mm. Figure 14 shows the designed specimen. The total height of the tower specimen, from top of the footing to the loading point, was 2050 mm.

2.7. Design of Tower Specimens
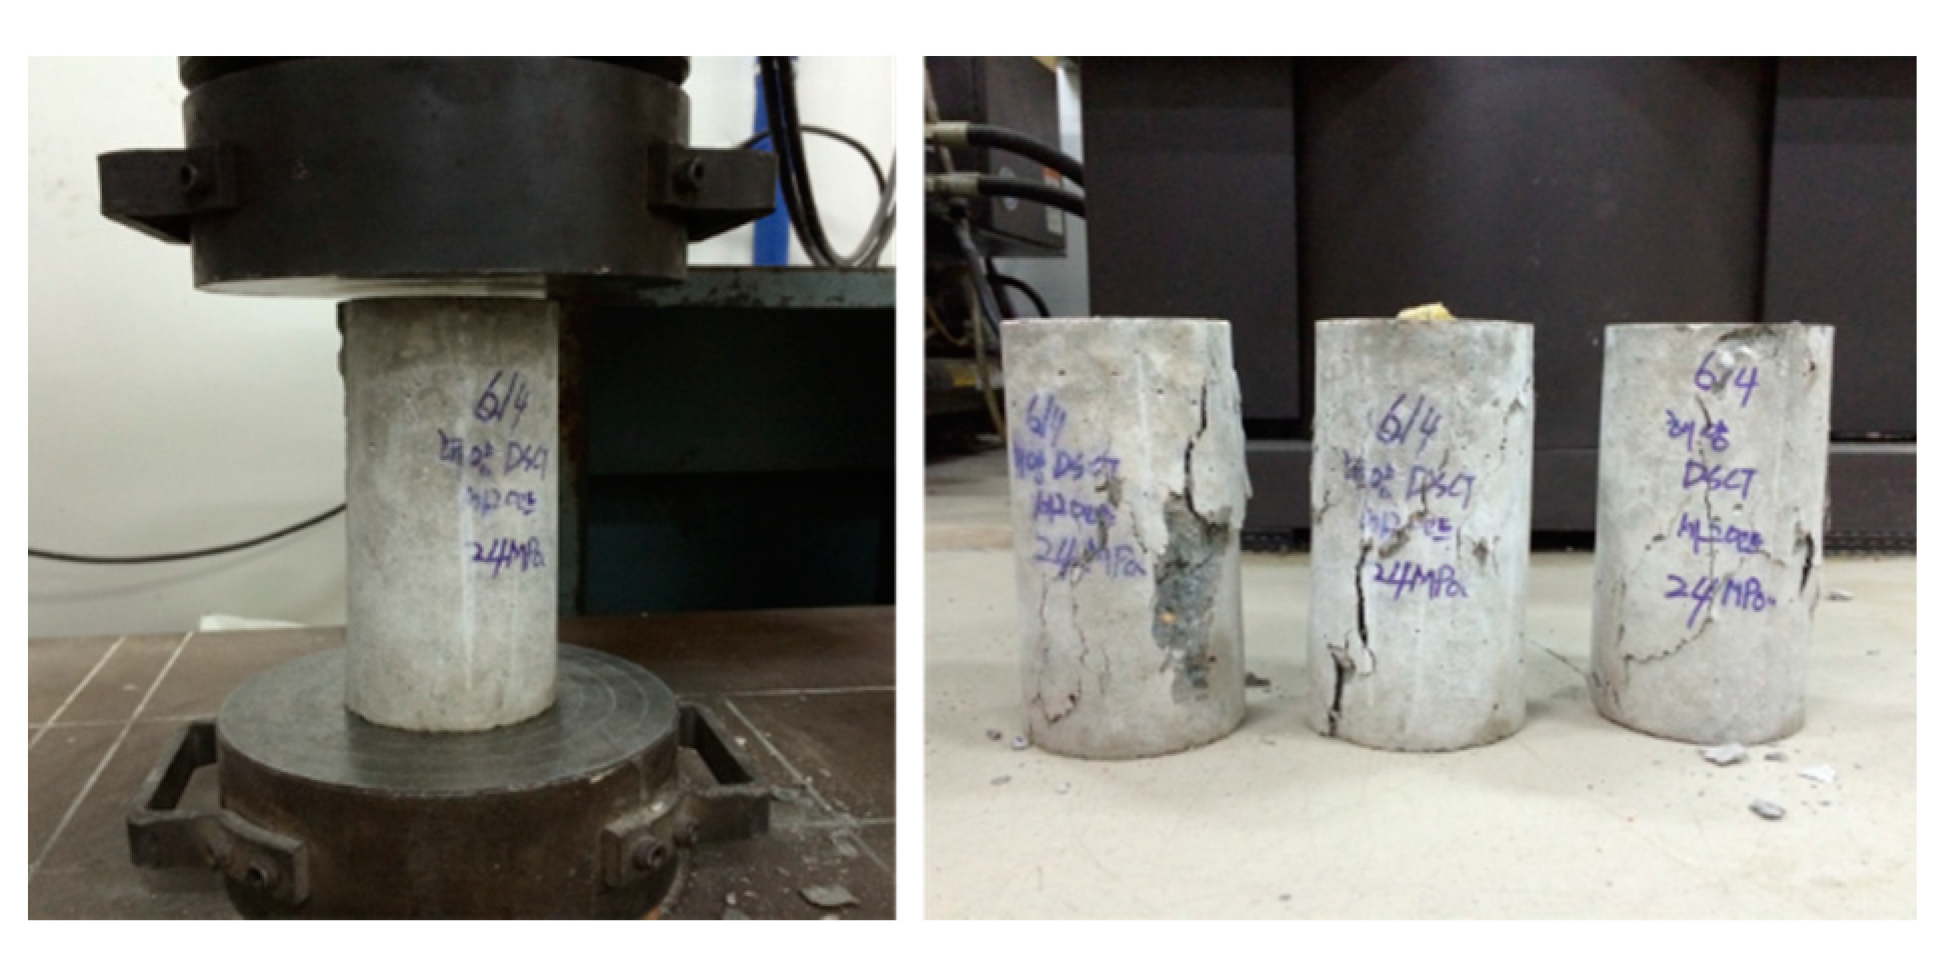
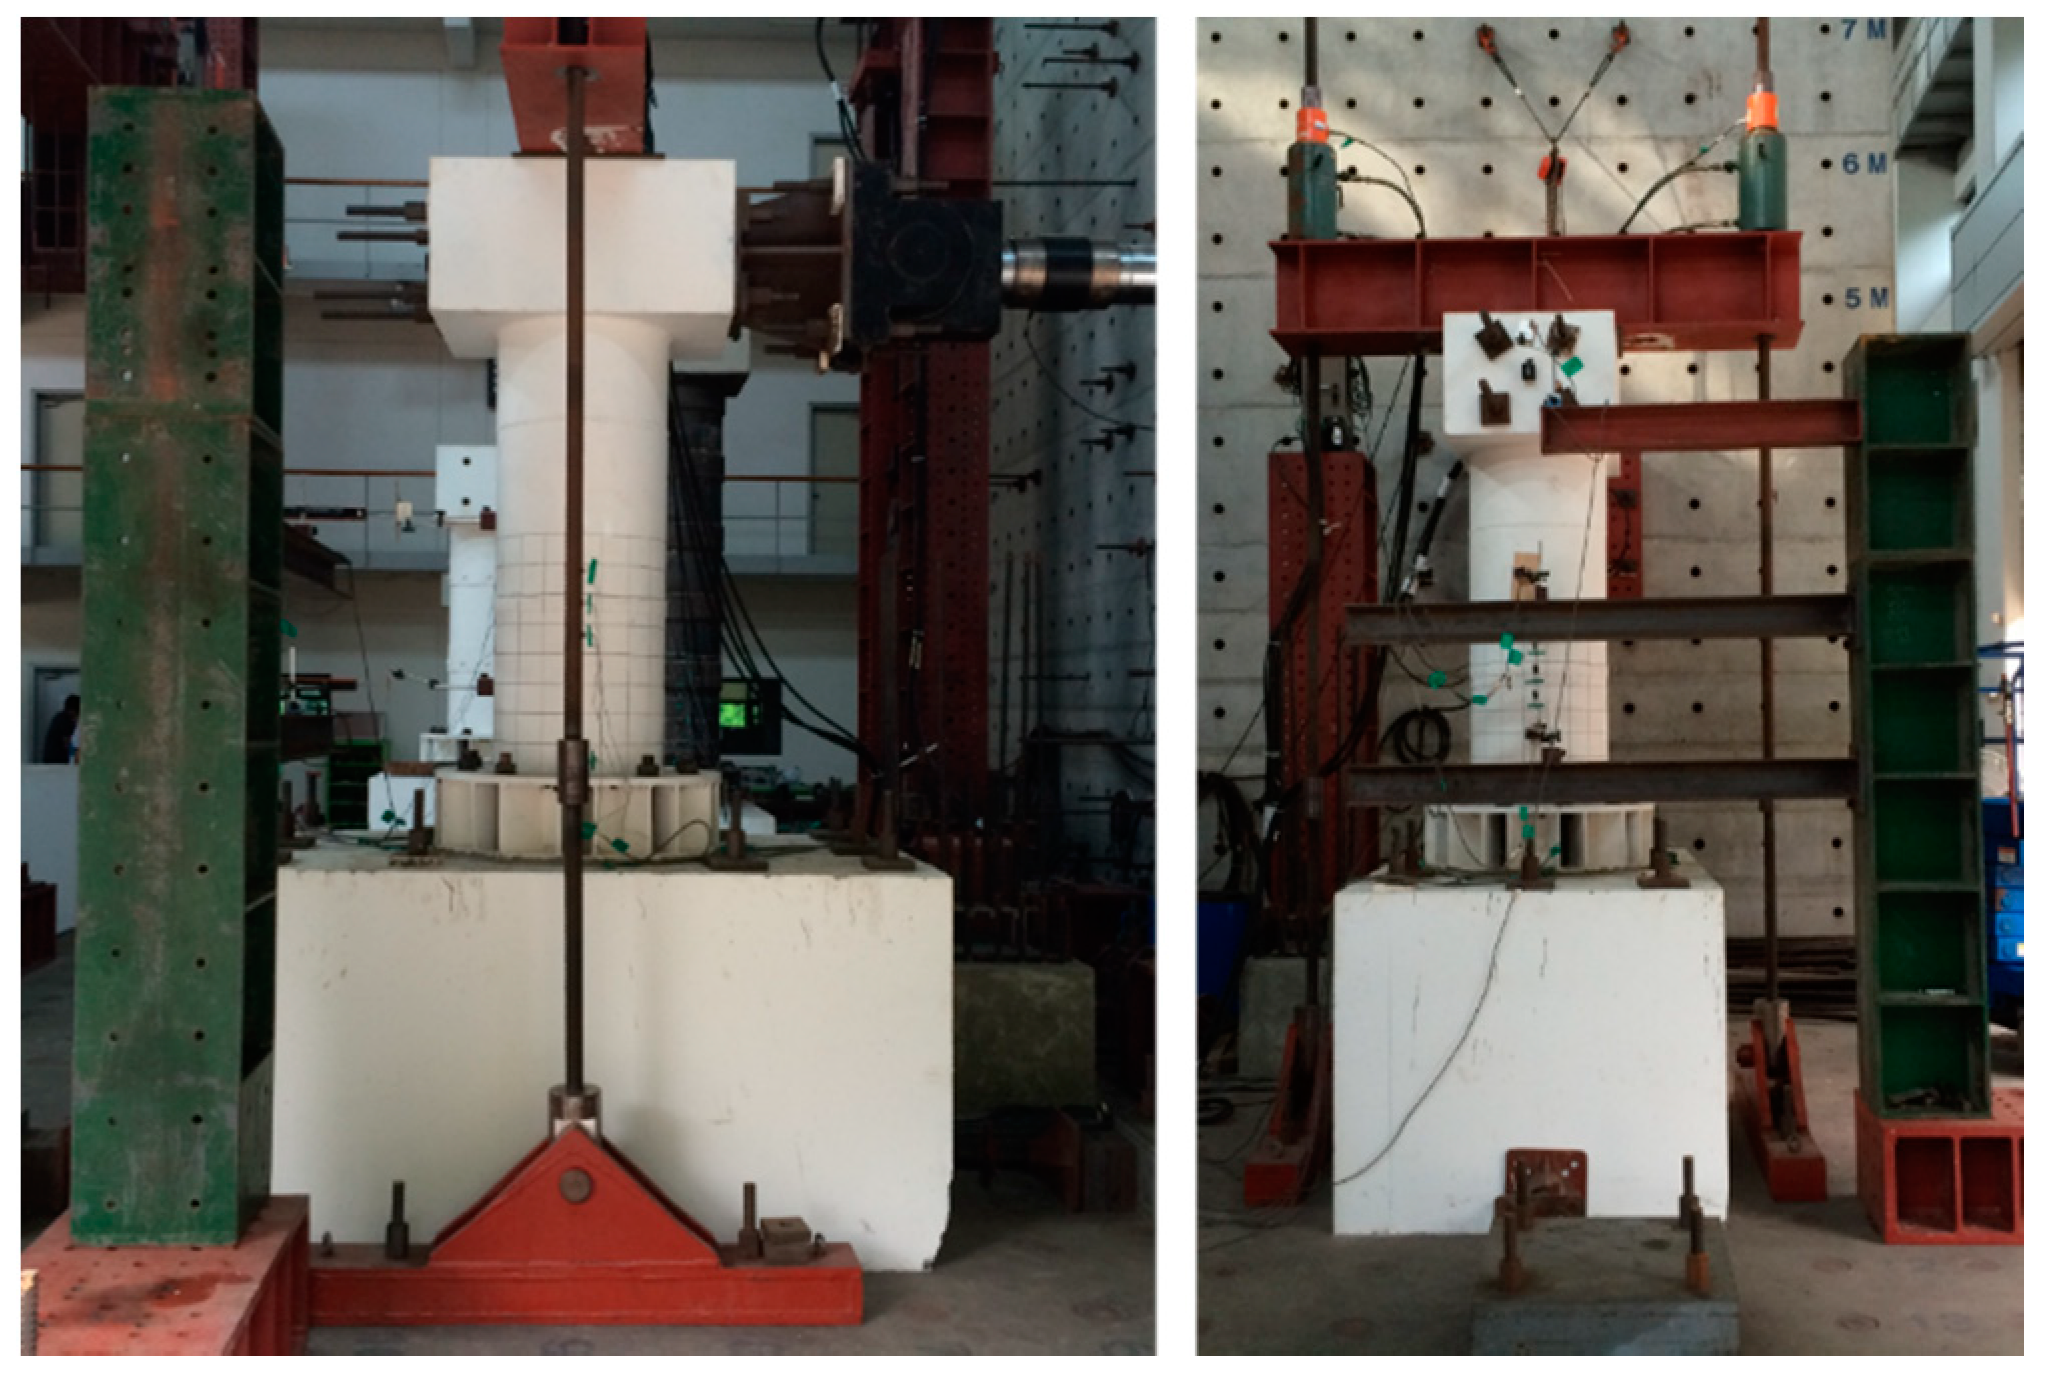
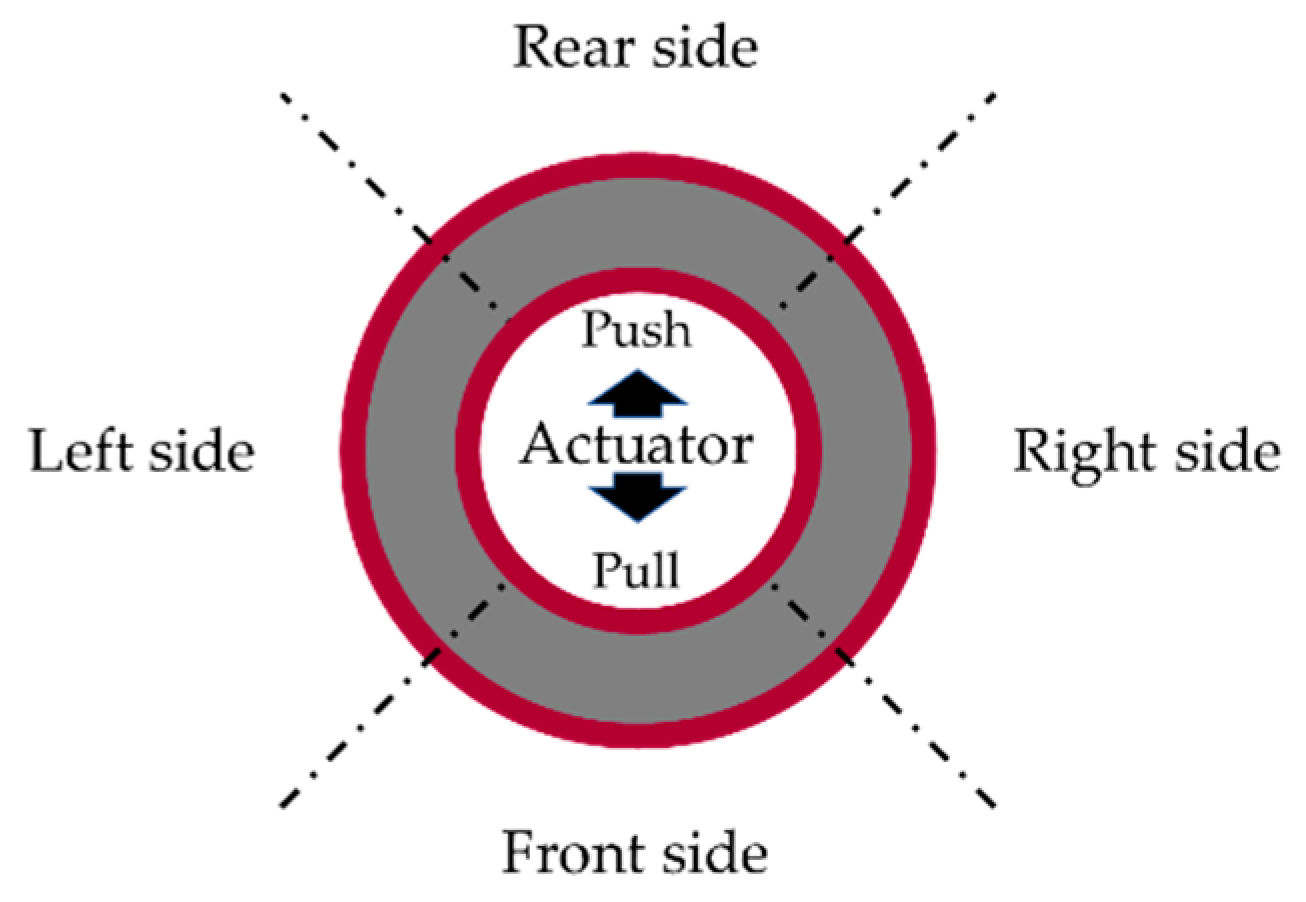
Based on the joint design results, four types of modular tower specimens were constructed: the single-body specimen (SP-0), specimen using Type-S joint (SP-S), specimen with H-connectors (SP-H), and specimen using Type-W joint (SP-W). There were no commercial steel tubes with the same diameter as the designed tubes; therefore, fabricated SS400 steel tubes, which had 245 MPa yield strength and 400 MPa ultimate strength, were used to construct the specimens. All the other steel parts of the specimens were also made of SS400 materials. Figure 15 shows each specimen under construction. For SP-H, the modules and H-connectors were planned to be coupled by bolting both the upper and lower modules; however, the upper side was welded and the lower side was bolted for convenience in construction. Ordinary Portland cement with a maximum aggregate of 25 mm and a 120 mm slump was used for the modules of the tower specimens. The nominal strength of concrete was 24 MPa. For the footing and the loading area located at the top of the tower specimens, high strength concrete having a 40 MPa nominal strength was used. Concrete molds were made when placing the concrete in the specimens; they were tested after seven days and during the start of the modularized column specimen testing. The average concrete strength was 20.57 MPa after seven days and 29.5 MPa after 28 days. Table 2 lists the compressive strengths of the concrete from the mold tests, and Figure 16 shows the tested concrete molds.
Before the experiment, the behavior of the designed single-body specimen (SP-0) applying the measured concrete strength was analyzed using CoWiTA [15]. This analysis is based on the nonlinear concrete model from Mander et al. [16] and the nonlinear steel model by Han et al. [17] with consideration of the confining effect of concrete. The axial load-bending moment (P–M) interaction curves in Figure 17 show the results for the case considering the confinement effect and the case that did not apply the confinement effect. The maximum moment was 876.67 kN-m, which could be converted into a maximum lateral force of 427.64 kN in the case considering the confinement effect. For the case without considering the confinement effect, the maximum moment was 634.27 kN-m, and the maximum lateral force could be calculated as 209.40 kN. The balanced axial force was 2189.02 kN in the case considering the confinement effect and was 1103.57 kN in the case that did not include the confinement effect. The maximum lateral displacement Figure 18 and Figure 19 show the applied concrete model and steel model, respectively.

3. Experiments

3.1. Experimental Program
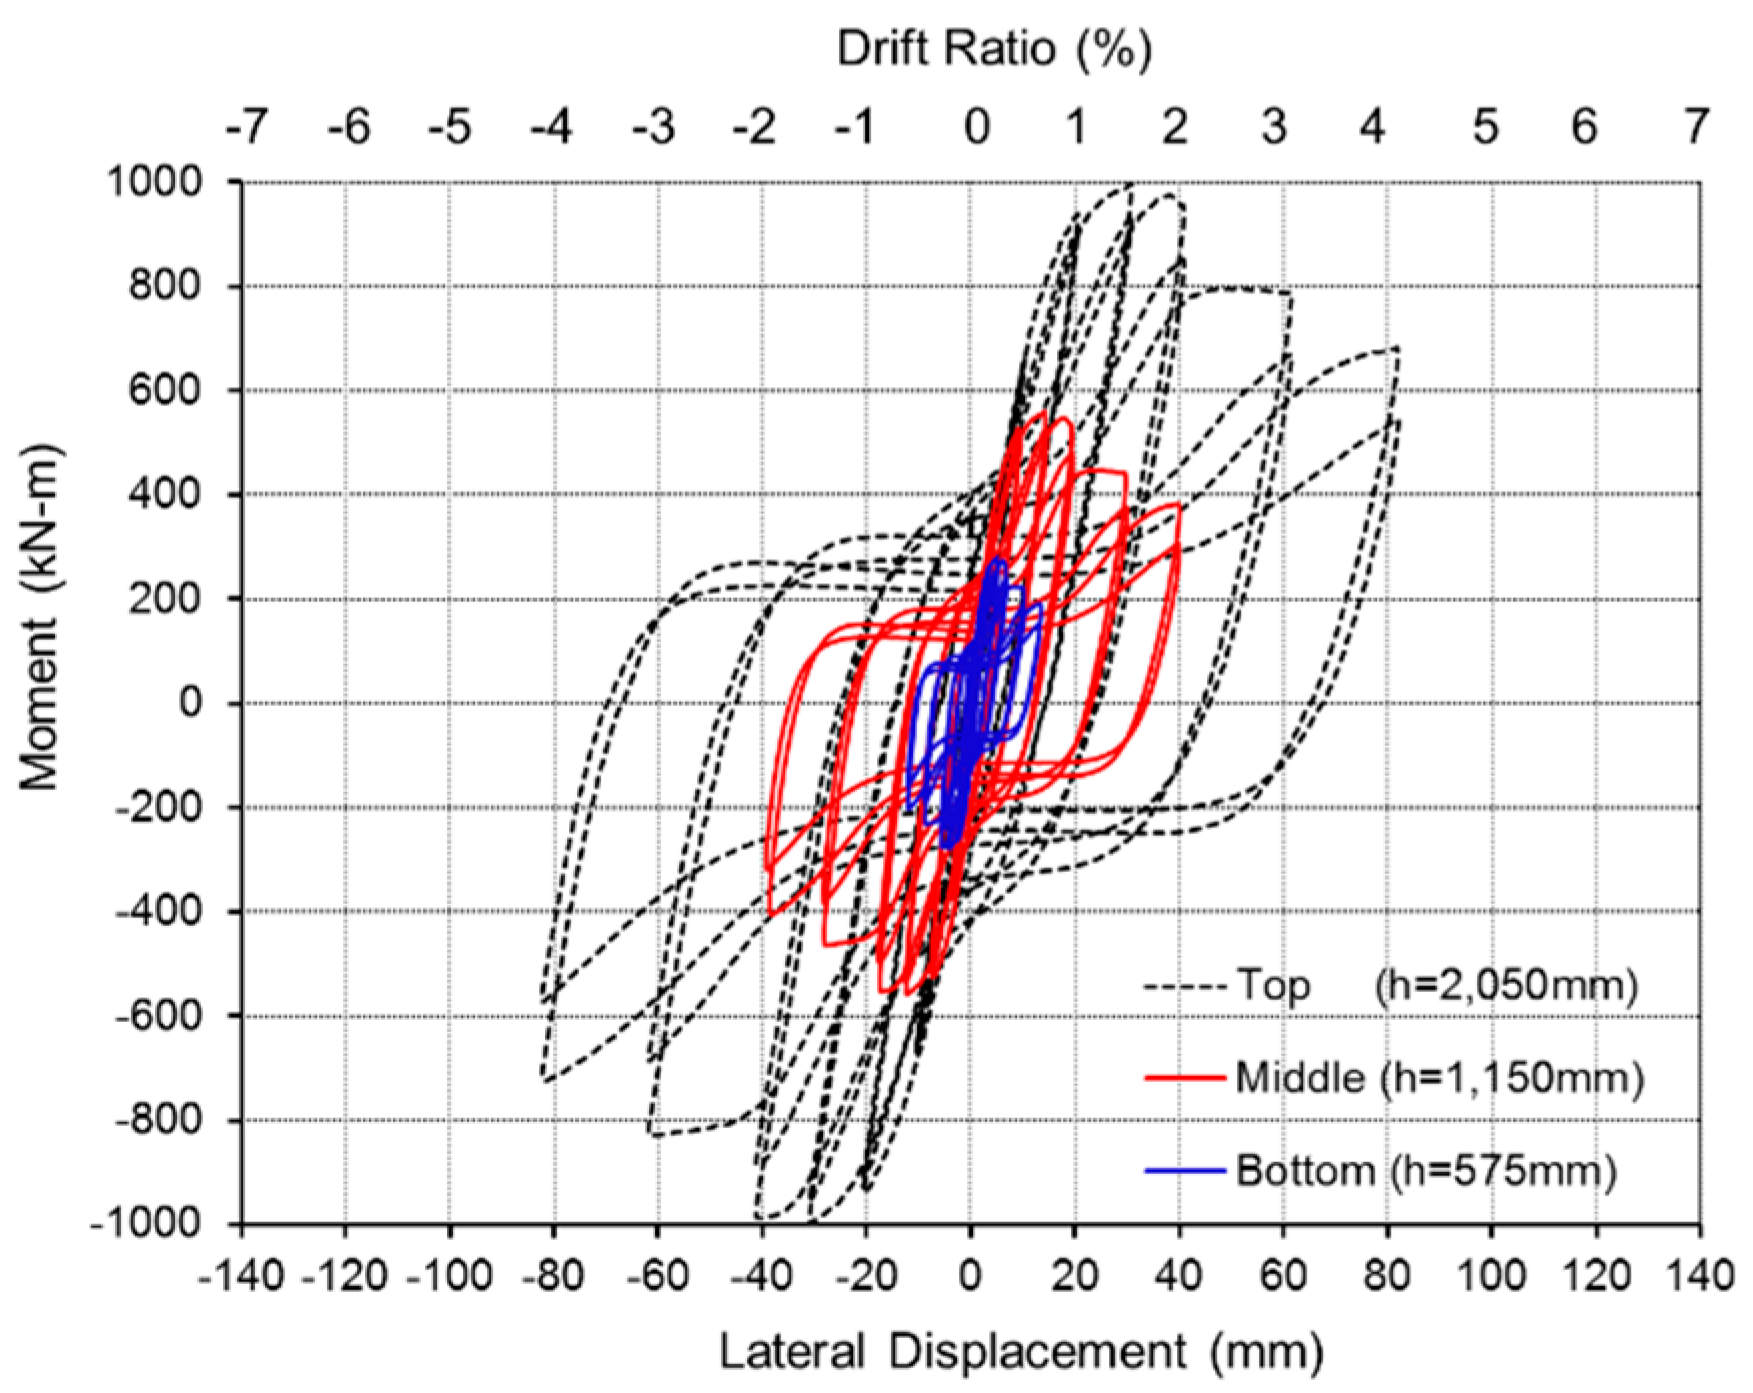
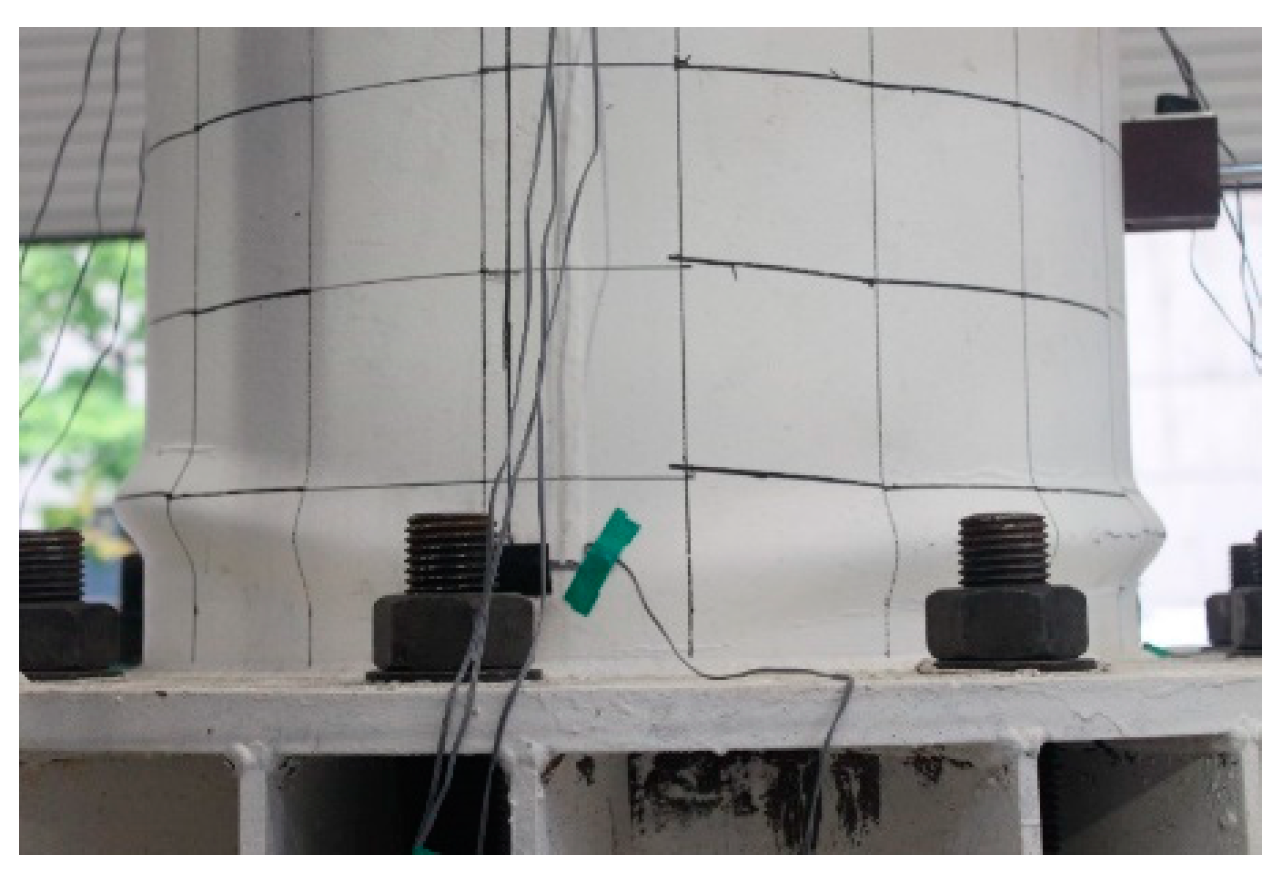
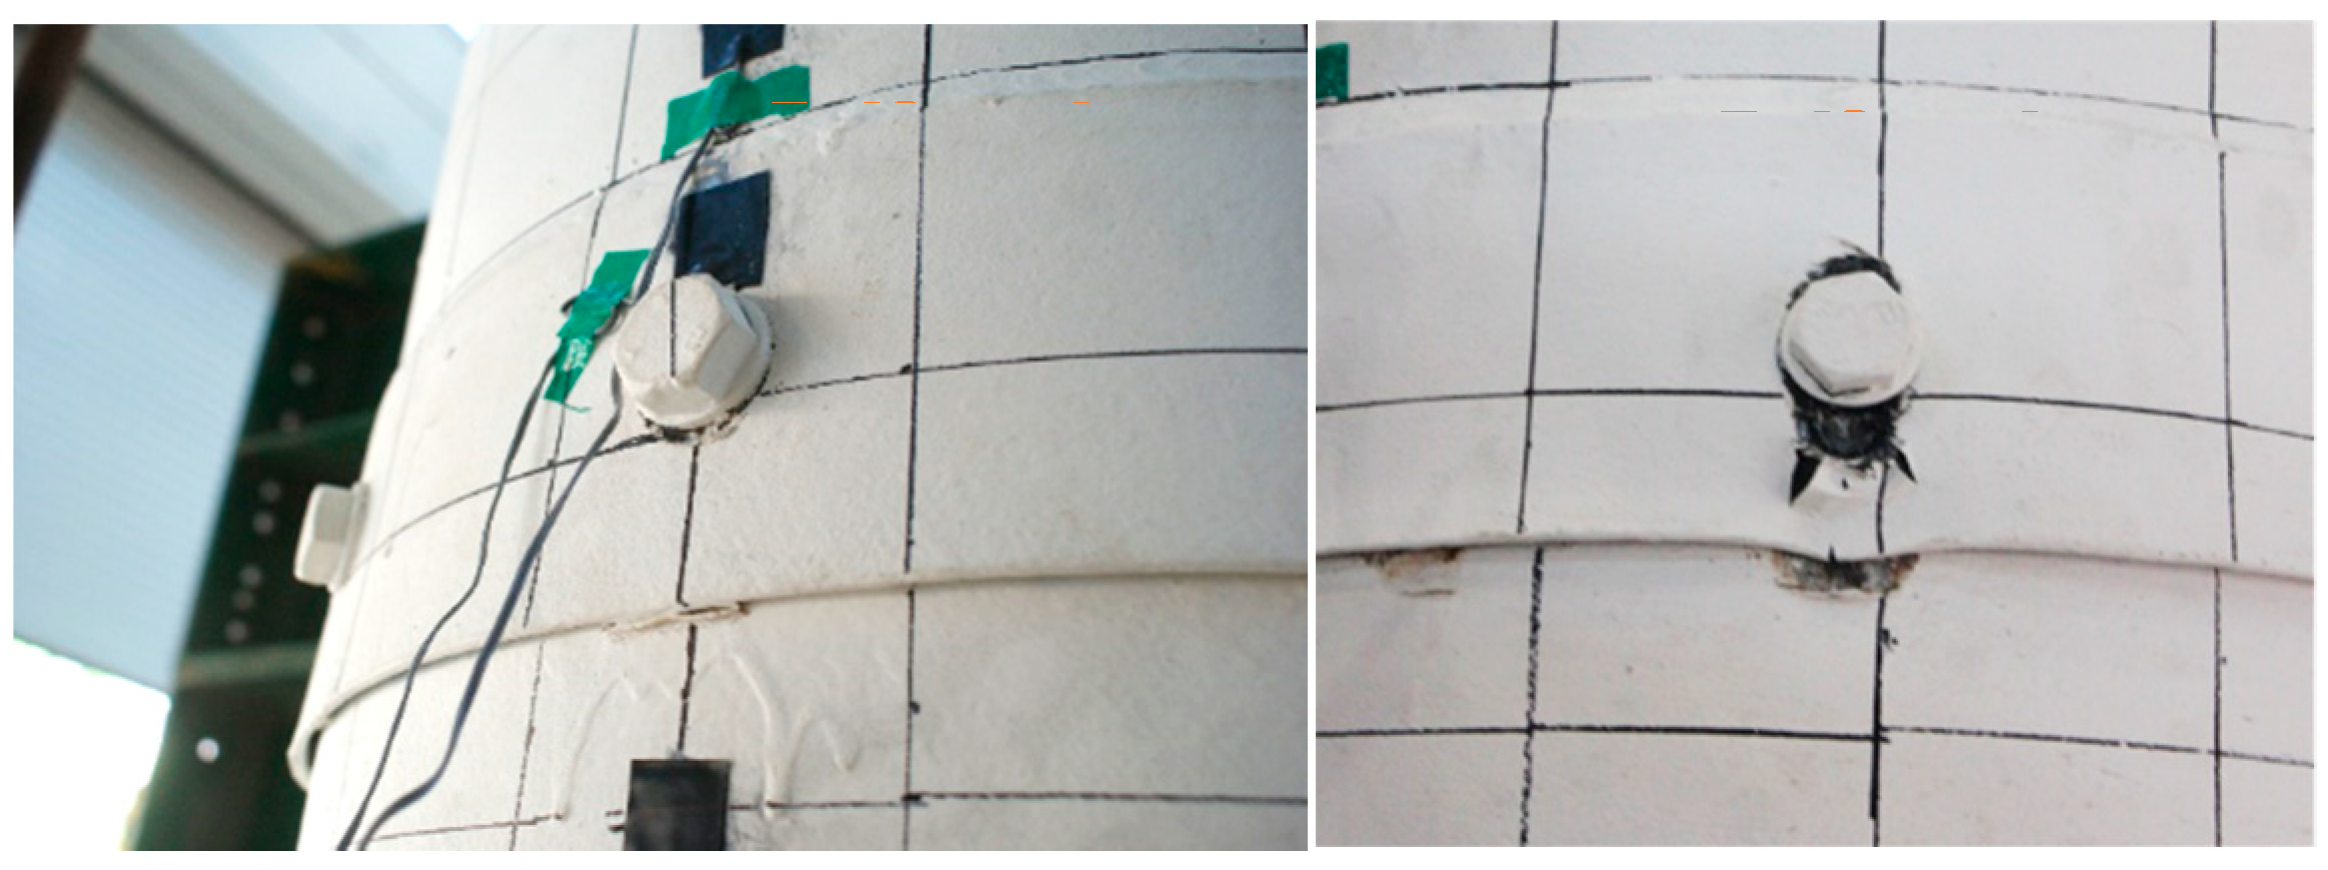
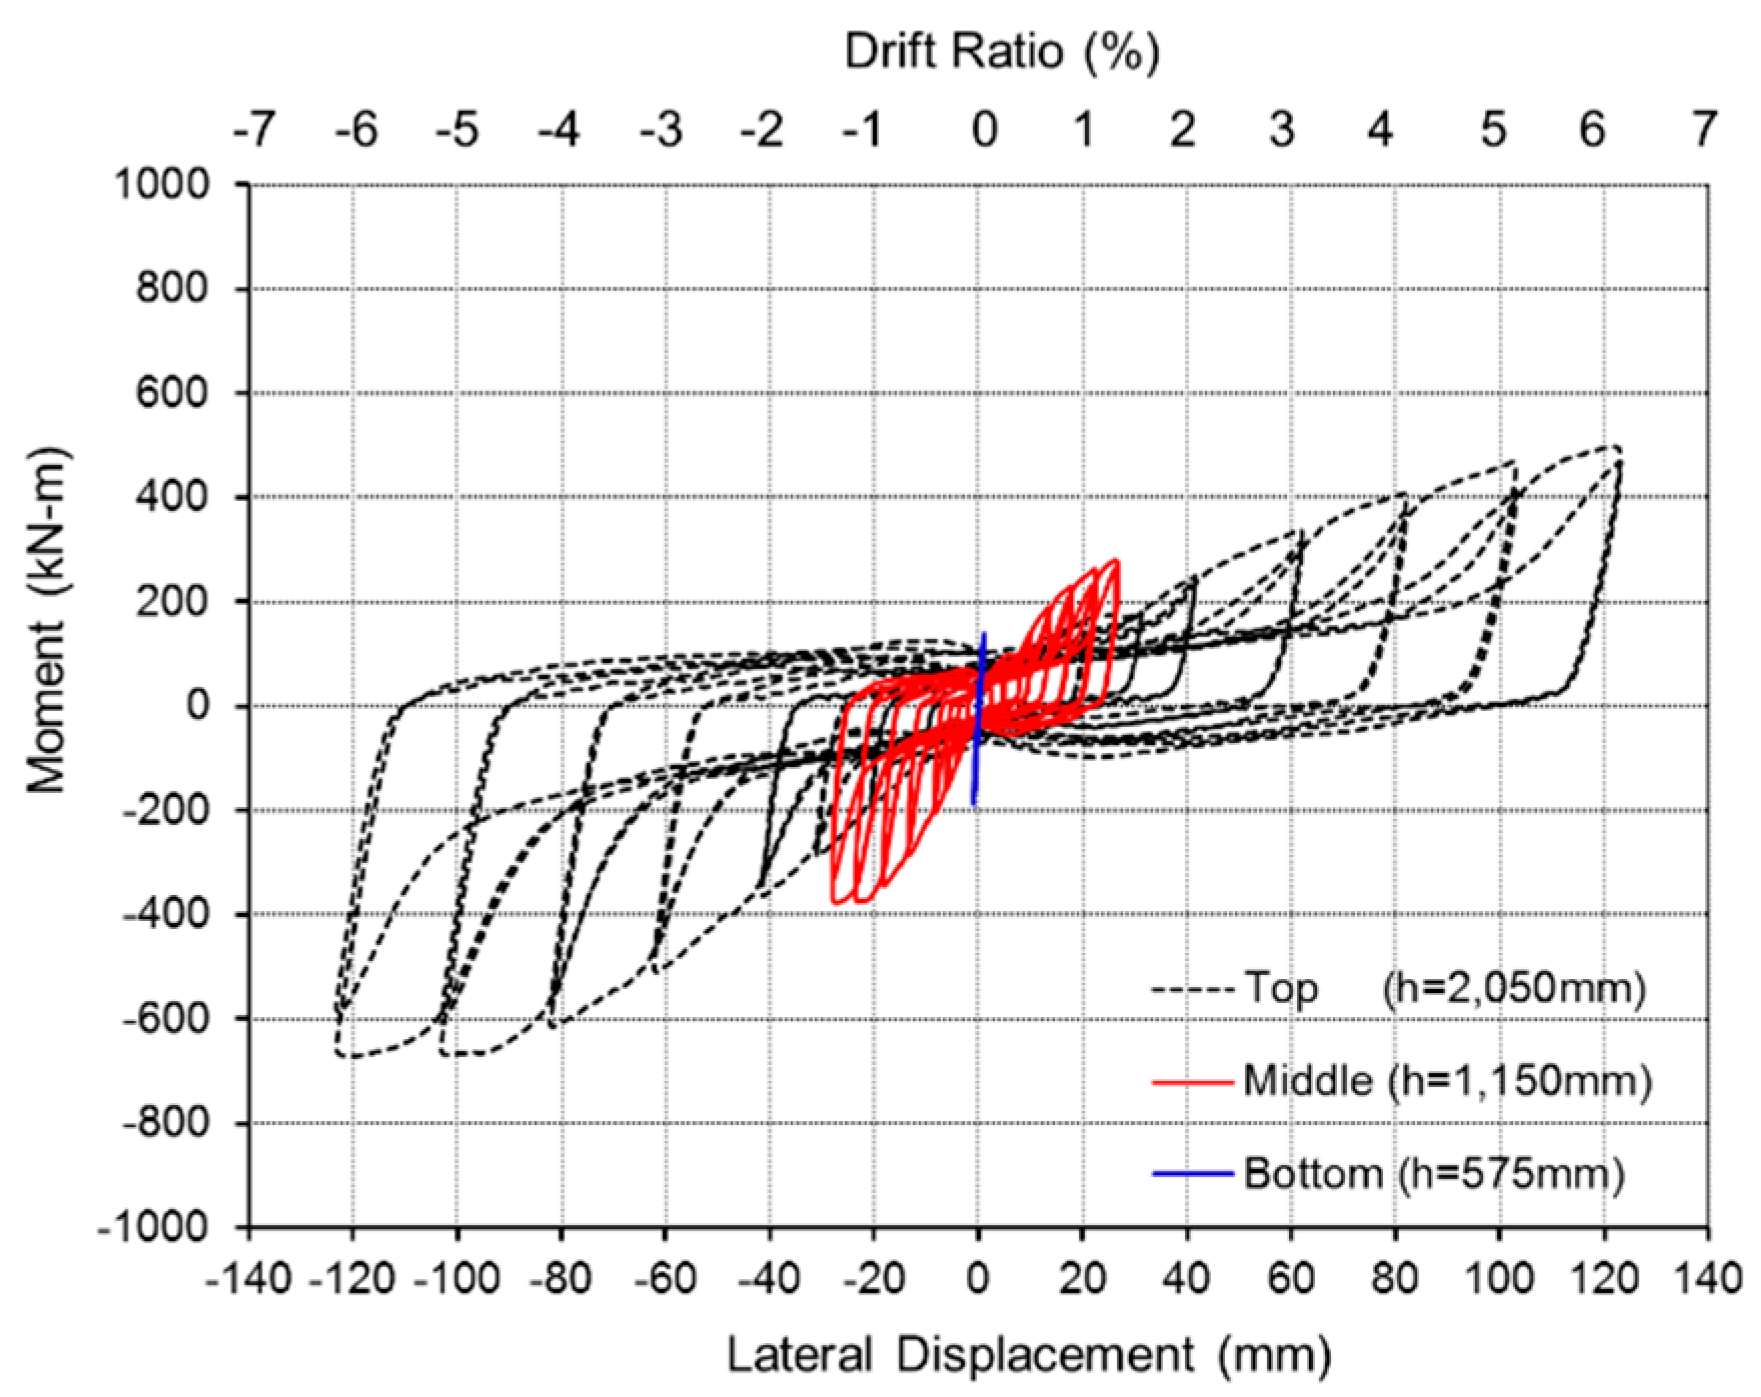
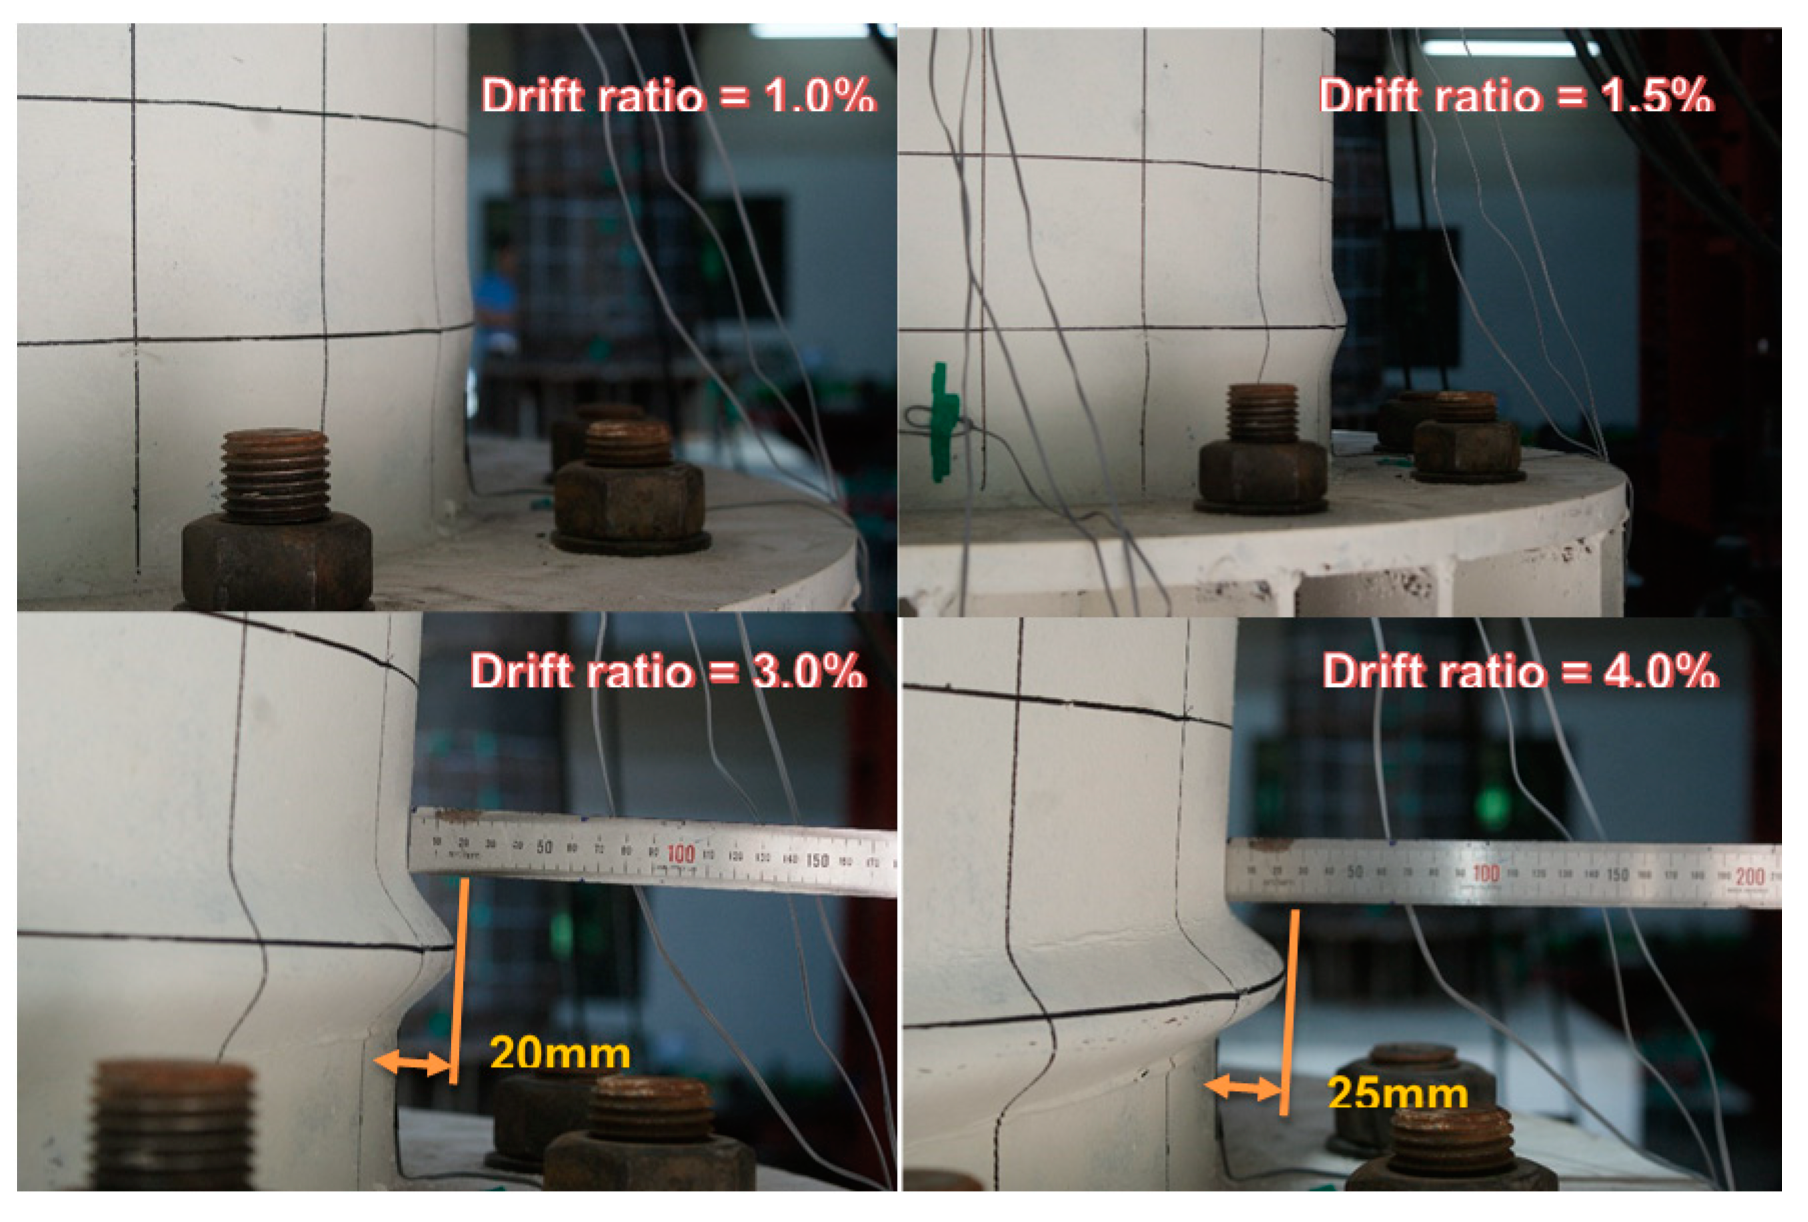
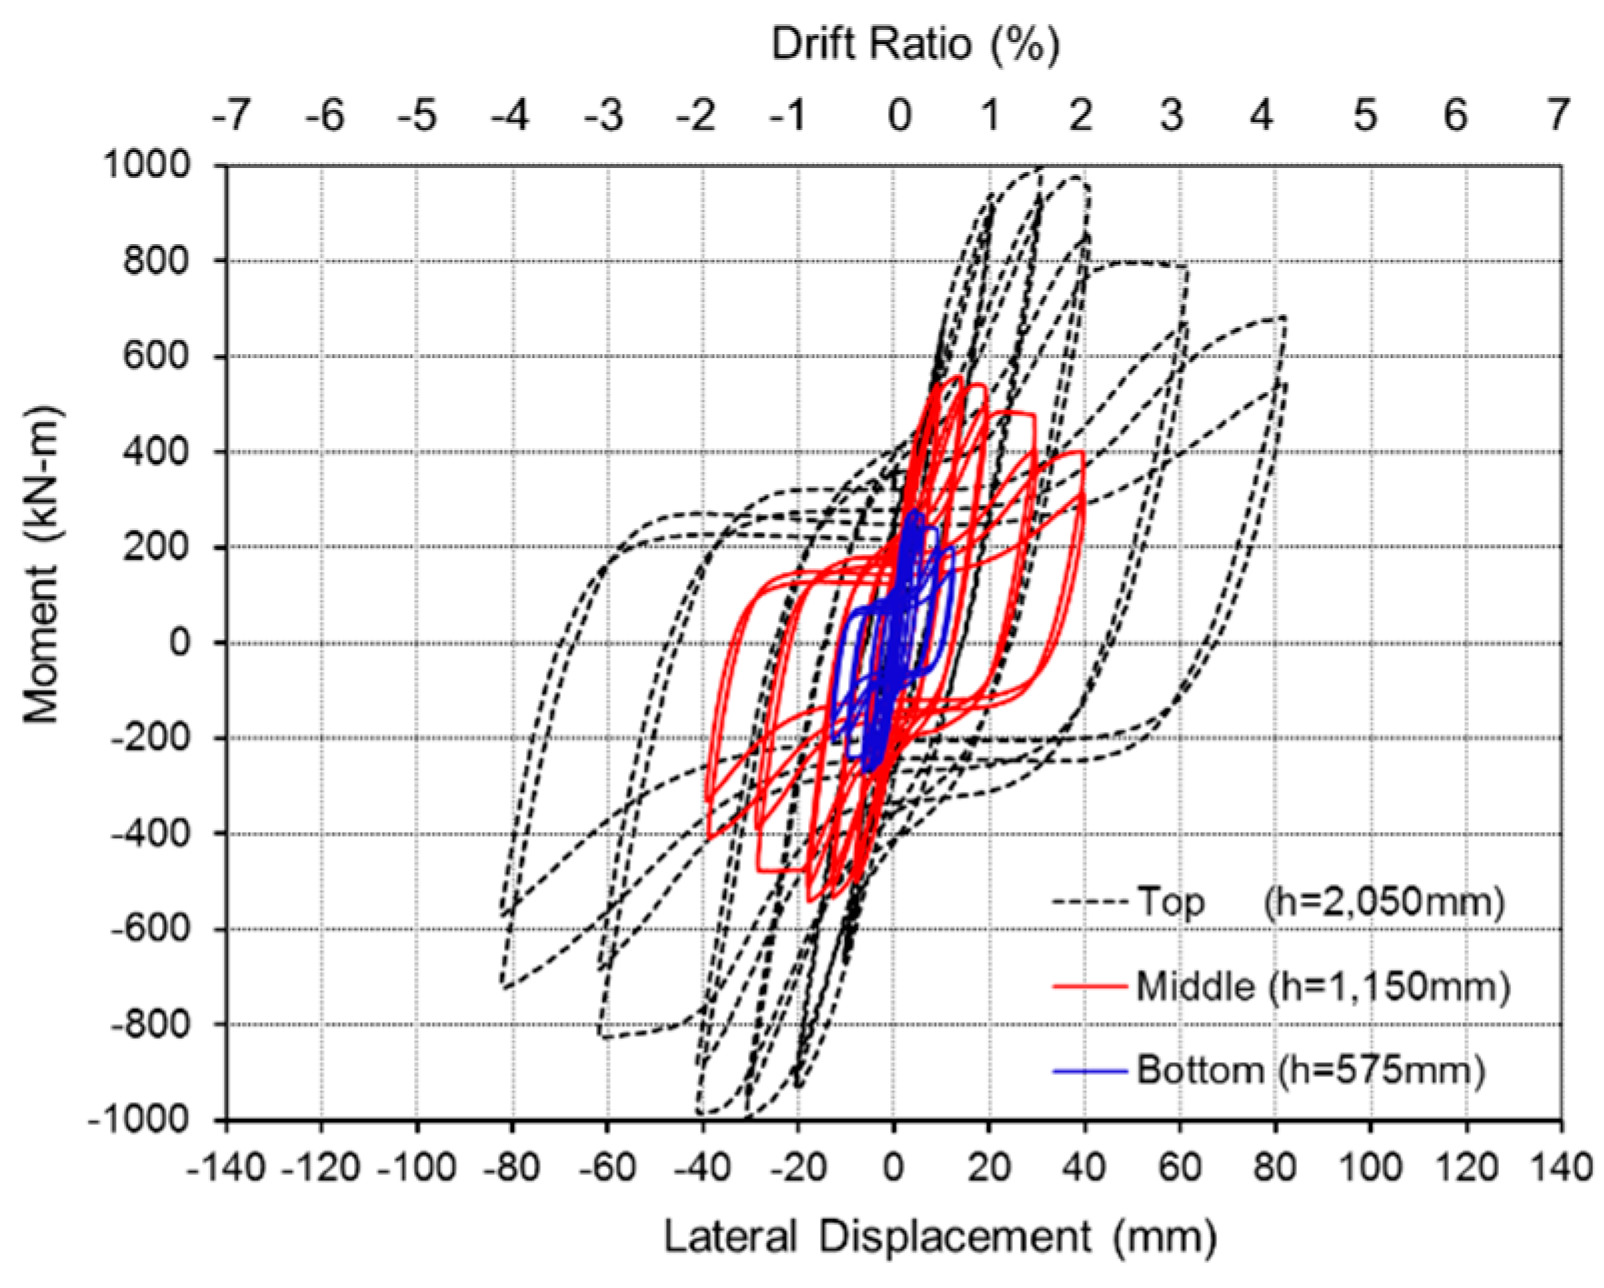
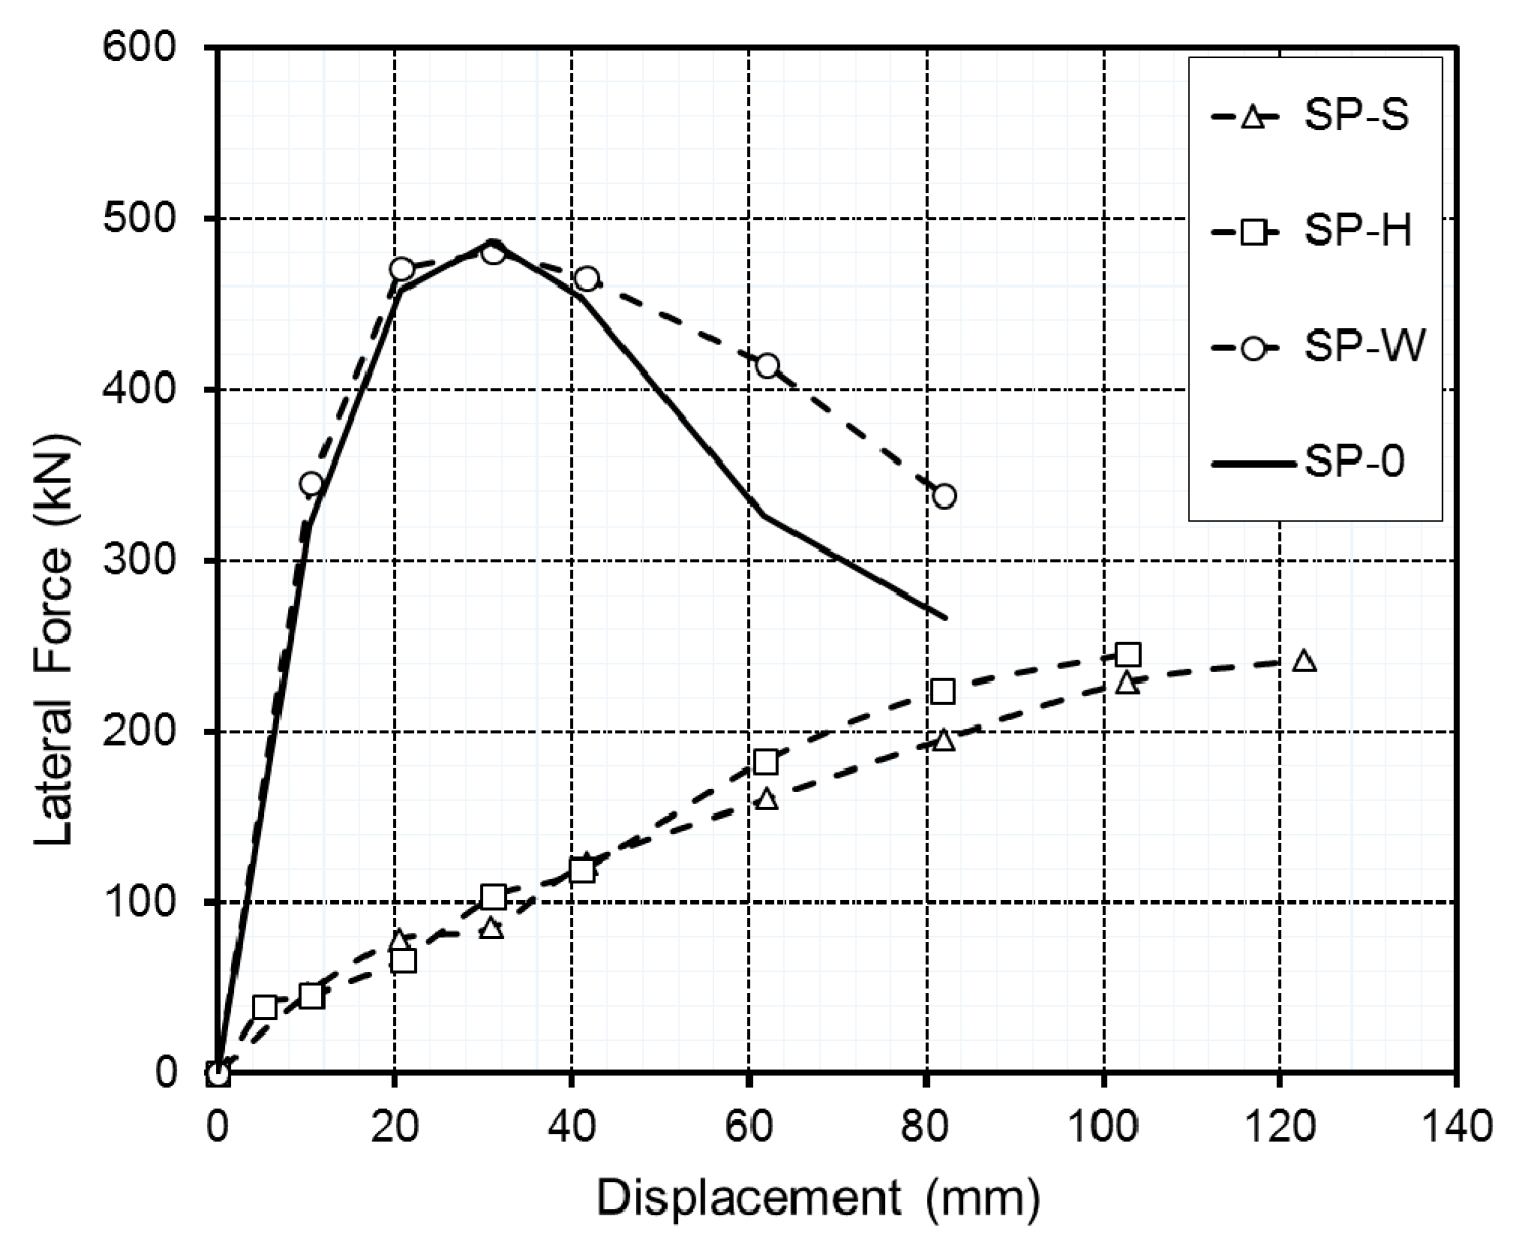
Quasi-static tests were performed to evaluate the bending strengths of modular DSCT tower specimens with three different connections. For the initial axial load in this experiment, the result of the case that did not include the confinement effect was considered; finally, 1000 kN of axial load was constantly applied. Cyclic lateral loads were applied at the height of 2050 mm of a specimen with displacement control as the loading schedule shown in Figure 20. The hydraulic actuator pushed and pulled the loading part of specimens repeatedly in two cycles. The maximum available displacement range of the hydraulic actuator was ±250 mm, and the maximum load capacity was 2000 kN. Figure 21 shows the installed specimen.
Linear variable differential transformers (LVDTs) were installed on the specimen at heights of 575 mm, 1150 mm, and 2050 mm from the top of the footing to measure the lateral displacement. For the observation of the surface of the specimen during the test, the areas of the surface were defined as shown in Figure 22.

3.2. Test Result

In case of SP-0, the outer steel tube at the front side began to buckle when the drift ratio was 1.0% (≒20 mm). The maximum moments were measured as 996.83 kN-m when the specimen was pushed and 996.98 kN-m when the actuator pulled the specimen so that the averaged maximum moment was 996.92 kN. This is 12% higher value than the expected maximum moment from the pre-analysis by using CoWiTA. After that, the load was decreased to 80% of the maximum load when the drift ratio was 4.0% (displacement: −82.215 mm), and then the experiment was completed. The maximum displacement was 82.195 mm by averaging the values from pushing and pulling cases. Figure 23 shows the load–displacement hysteresis curves of SP-0. The specimen finally fractured by buckling of the outer tube in the plastic hinge as shown in Figure 24.
SP-S refers to the specimen using the socket type connection by friction coupling of bolts. After a 1.0% drift ratio, the laterally applied load at the top of the specimen was not completely transferred to the bottom of the specimen owing to the deformation of bolt-holes; hence, the LVDT at the bottommost module detected only a slight displacement. The bolts lost their friction after being released at 1.0% drift ratio, and the module joints were torn when the drift ratio was 6% as shown in the right side of Figure 25; the experiment was completed at that test level. It appears the connecting plate did not have enough thickness. There was a small space between the bolts and bolt-holes during the manufacturing process for easy assembly.
The load–displacement hysteresis curve for SP-S is shown in Figure 26. The maximum moment was 583.25 kN-m (push: 498.72 kN-m and pull: 672.28 kN-m), which was only 58.6% of the maximum moment on SP-0 (996.92 kN-m). The maximum displacement was 123.275 mm.
For the SP-H joint, the connector was welded to the upper module and was then bolted to the lower module. Similar to the SP-S case, the bolt connection lost its bearing stress by the excessive deformation of the bolt-holes. As Figure 27 shows, the connections began to lose friction at the space between the bolts and the bolt-holes when the drift ratio was 0.5%; then the joints failed by shear stress by the bolts when a 5% drift ratio was applied. In the right side of Figure 28, it is observed that the connecting plate welded to the upper module moved upward. It was supposed that the connecting plate should have larger thickness. In addition, it seems that the tolerance between the bolts and bolt holes contributed to the loss of bearing stress. By the excessive deformation of the bolt-holes, the lateral load was not completely transferred the bottom of the specimen. Finally, it caused the failure of the connecting plate. Figure 28 shows the load–displacement hysteresis curve for SP-H. The maximum moment was 541.04 kN-m (push: 503.03 kN-m, pull: 579.04 kN-m), which was only 54.3% of the maximum moment on SP-0. The maximum displacement was 102.885 mm.
For the case of SP-W, the outer tube above the base plate started to locally buckle when the drift ratio was 1.0%. The maximum load was measured when the drift ratio was 1.5%. After that, the load decreased to below 80% of the maximum load when the lateral displacement reached a 4.0% drift ratio, and the experiment was terminated. As the loading steps went by from 1.0% to 4.0% drift ratio, the displacement of the outer tube by local buckling increased. When the drift ratio was 3.0%, the height of buckling deformation was about 20 mm; it extended up to 25 mm when the drift ratio was 4.0%. Figure 29 shows the states of the locally buckled shape of the outer tube when the drift ratio was 1.0%, 1.5%, 3.0%, and 4.0%, respectively.
The moment–displacement hysteresis curve is shown in Figure 30. The maximum moment was 982.012 kN-m (push: 999.17 kN-m, pull: 964.85 kN-m), which is 98.5% of the maximum moment of SP-0 (996.92 kN-m). For the push-over of the actuator against the specimen, the maximum moment of SP-W was larger than SP-0. Therefore, the specimen using the Type-W joint had enough strength to exert equal performance to the single-body specimen. Connection using a Type-W joint could be applied to the modular DSCT wind turbine tower. The maximum lateral displacement at the loading point was 82.185 mm, which is almost the same as that of SP-0. Table 3 shows the summary of test results.
In the cases of SP-S and SP-H, the specimens did not exert their performances, which the authors had expected, because of the early failure of the connections. For these two cases, the experiments were stopped early, and the results were not analyzed in detail. In this study, the results for SP-W specimen and SP-0 were mainly compared and analyzed.
The load–displacement envelope curves are compared in Figure 31. The envelope curves were plotted by using averaged measured values for both push-over and pull-over. As mentioned previously, the maximum loads in SP-0 and SP-W were similar and equal to 486.30 kN and 479.03 kN, respectively; their behaviors were analogous to each other until the maximum displacement. In the cases of SP-S and SP-H, the behavior of the connection plate was expressed as the governing behavior because the lateral load was not completely transferred to the lower module by the premature failure of the connections.
As a result of calculating the yield displacement and ultimate displacement by using the method suggested by Park [18], the yield displacement, ultimate displacement, and displacement ductility of SP-0 were 15.7 mm, 52.3 mm, and 3.33, respectively. For SP-W, the yield displacement was 15.6 mm, ultimate displacement was 69.9 mm, and displacement ductility was calculated as 4.48, which is larger than that of SP-0. This results from the larger moment resisting capacity of SP-W after peak load. Figure 32 shows the energy dissipation with drift ratio; it can be observed that SP-W similarly dissipated energy with SP-0.

4. Conclusions

In this study, the lateral behavior performance tests were carried out for four new-type wind turbine tower specimens. Three specimens were modular DSCT wind turbine towers with different module connections and the other was a single-body DSCT wind turbine tower. Quasi-static tests were performed and the results were compared to determine which type of connection made a modular DSCT wind turbine tower to behave like a single-body DSCT wind turbine tower.
As a result, the specimen using Type-W joint (SP-W) performed 98.5% of the maximum strength compared to the single-body specimen (SP-0). Additionally, the results of the maximum displacement of SP-W showed almost the same as that of SP-0. On the other hand, the experimental results of the connection Type-H and Type-S showed their connection plate failed. The SP-H and SP-S was confirmed that they did not perform enough to behave as the single body DSCT. The modular connections using connection Type-H and Type-S are not suitable to be used for wind turbine towers because of the stress concentration around the bolting area.
Finally, it appears to be the most recommendable connection type for a modular DSCT wind turbine tower is the connection Type-W.

Author Contributions

Conceptualization, T.H.H.; methodology, T.H.H.; validation, S.K.; investigation, S.K.; data curation, H.H.; writing—original draft preparation, S.K.; writing—review and editing, T.H.H.; visualization, S.K. and H.H.; supervision, T.H.H.; project administration, T.H.H.; funding acquisition, T.H.H. All authors have read and agreed to the published version of the manuscript.

Funding

This research work was funded by the “Korea Agency for Infrastructure Technology Advancement (KAIA) grant funded by the Ministry of Land, Infrastructure and Transport (Grant 21CTAP-C164018-01)” and by the “Development of marine waste recycling technologies for the life extension of marine and port structures (KIOST Project Number: PE99933)”.

Institutional Review Board Statement

Not applicable.

Informed Consent Statement

Not applicable.

Acknowledgments

This research work was supported by the “Korea Agency for Infrastructure Technology Advancement (KAIA) grant funded by the Ministry of Land, Infrastructure and Transport (Grant 21CTAP-C164018-01)” and by the “Development of marine waste recycling technologies for the life extension of marine and port structures (KIOST Project Number: PE99933)”.

Conflicts of Interest

The authors declare no conflict of interest.

References

  1. Doagou-Rad, S.; Mishnaevsky, L., Jr.; Bech, J.I. Leading edge erosion of wind turbine blades: Multiaxial critical plane fatigue model of coating degradation under random liquid impacts. Wind Energy 2020, 23, 1752–1766. [Google Scholar] [CrossRef]
  2. Furlanetto, A.; Gomes, H.M.; de Almeida, F.S. Design Optimization of Tapered Steel Wind Turbine Towers by QPSO Algorithm. Int. J. Steel Struct. 2020, 20, 1552–1563. [Google Scholar] [CrossRef]
  3. CWIF. Summary of Wind Turbine Accident Data to 30 June 2020. Available online: http://www.caithnesswindfarms.co.uk/AccidentStatistics.htm (accessed on 10 July 2020).
  4. Ma, Y.; Martínez-Vázquez, P.; Baniotopoulos, C. Wind turbine tower collapse cases: A historical overview. Proc. Inst. Civ. Eng. Struct. Build 2019, 172, 547–555. [Google Scholar] [CrossRef] [Green Version]
  5. INNEO. Precast Concrete Wind Towers. Available online: http://www.inneo.es/index.php/en/home.html (accessed on 6 May 2021).
  6. Tindall. Innovative and Economical. Available online: https://tindallcorp.com/markets/power-energy/ (accessed on 5 May 2021).
  7. Han, T.H.; Won, D.H.; Kim, S. Applicability of double-skinned composite tubular member for offshore wind turbine tower. J. Korean Soc. Hazard Mitig. 2013, 31, 55–65. [Google Scholar] [CrossRef] [Green Version]
  8. Han, T.H.; Yi, J.; Yoon, G.; Won, D.H.; Yoo, S. Structural behavior analysis of DSCT wind power tower for 5 MW turbines considering large displacement effect. J. Korean Soc. Hazard Mitig. 2016, 15, 51–61. [Google Scholar] [CrossRef] [Green Version]
  9. Kim, S.; Hong, H.; Han, T. Behavior of an Internally Confined Hollow Reinforced Concrete Column with a Polygonal Cross-Section. Appl. Sci. 2021, 11, 4302. [Google Scholar] [CrossRef]
  10. Kim, S.; Hong, H.; Han, T.H. Section design and analysis of ICH RC tower supporting 5 MW wind turbine. In Proceedings of the OCEANS 2016 MTS/IEEE Monterey, Monterey, CA, USA, 19–23 September 2016; pp. 1–5. [Google Scholar]
  11. Shakir-Khalil, H.; Illouli, S. Composite columns of concentric steel tubes. In Proceedings of the Conference on the Design and Construction of Non-Conventional Structures, London, UK, 8–10 December 1987; Volume 1, pp. 73–82. [Google Scholar]
  12. Han, T.H.; Stallings, J.M.; Kang, Y.J. Nonlinear concrete model for double-skinned composite tubular columns. Constr. Build Mater. 2010, 24, 2542–2553. [Google Scholar] [CrossRef]
  13. Han, T.H.; Won, D.H.; Kim, S.; Kang, Y.J. Performance of a DSCT column under lateral loading: Analysis. Mag. Concr. Res. 2013, 65, 121–135. [Google Scholar] [CrossRef]
  14. Won, D.H.; Han, T.H.; Lee, D.J.; Kang, Y.J. A Study of pier-segment joint for fabricated internally confined hollow CFT pier. J. Korean Soc. Steel Constr. 2010, 22, 161–171. [Google Scholar]
  15. Han, T.H.; Hong, H.; Kim, S. CoWiTA Manual 2018; Korea Institute of Ocean Science and Technology: Ansan, Korea, 2018. [Google Scholar]
  16. Mander, J.B.; Priestly, M.J.N.; Park, R. Seismic Design of Bridge Piers; Research Report No. 84-2; University of Canterbury: Christchurch, New Zealand, 1984; pp. 47–95. [Google Scholar]
  17. Han, T.H.; Won, D.H.; Yi, G.; Kang, Y.J. Behavior of internally confined hollow RC columns. J. Korea Concr. Inst. 2009, 21, 649–660. [Google Scholar] [CrossRef] [Green Version]
  18. Park, R. Ductility evaluation from laboratory and analytical testing. In Proceedings of the Ninth World Conference on Earthquake Engineering, Tokyo, Japan, 2 August 1988; Volume 8. [Google Scholar]
Figure 1. Cross section of DSCT wind turbine tower.
Applsci 11 05899 g001
Figure 2. Connecting steel tubes.
Applsci 11 05899 g002
Figure 3. Shear keys for concrete connection (left: protruding type, middle: doughnut type, right: bolt type).
Applsci 11 05899 g003
Figure 4. Connection by bolting, welding, and injected mortar.
Applsci 11 05899 g004
Figure 5. Socket type (Type-S).
Applsci 11 05899 g005
Figure 6. H-type connector (Type-H).
Applsci 11 05899 g006
Figure 7. Bolting, welding, and shear key connector (Type-W).
Applsci 11 05899 g007
Figure 8. Socket type connector (Type-S).
Applsci 11 05899 g008
Figure 9. H-connector (Type-H).
Applsci 11 05899 g009
Figure 10. Bolted–welded with shear key connector (Type-W).
Applsci 11 05899 g010
Figure 11. Base plate.
Applsci 11 05899 g011
Figure 12. Anchor plate.
Applsci 11 05899 g012
Figure 13. Footing.
Figure 13. Footing.
Applsci 11 05899 g013
Figure 14. Design of tower specimen.
Applsci 11 05899 g014
Figure 15. Three types of specimen modules (a) Type-S specimen module, (b) Type-H specimen module, (c) Type-W specimen module.
Applsci 11 05899 g015
Figure 16. Tested concrete molds.
Applsci 11 05899 g016
Figure 17. P–M interaction curves of designed specimen from CoWiTA.
Applsci 11 05899 g017
Figure 18. Concrete model for CoWiTA.
Applsci 11 05899 g018
Figure 19. Steel model for CoWiTA.
Applsci 11 05899 g019
Figure 20. Loading plan.
Applsci 11 05899 g020
Figure 21. Setup of specimen.
Applsci 11 05899 g021
Figure 22. Definition of specimen direction.
Applsci 11 05899 g022
Figure 23. Load–displacement hysteresis curve of SP-0.
Applsci 11 05899 g023
Figure 24. Buckling failure of outer tube of PS-0.
Applsci 11 05899 g024
Figure 25. Failure of connecting plate of SP-S.
Applsci 11 05899 g025
Figure 26. Load–displacement hysteresis curve of SP-S.
Applsci 11 05899 g026
Figure 27. Buckling failure of outer tube of SP-H.
Applsci 11 05899 g027
Figure 28. Load–displacement hysteresis curve of SP-H.
Applsci 11 05899 g028
Figure 29. Buckling failure of outer tube of SP-W.
Applsci 11 05899 g029
Figure 30. Load–displacement hysteresis curve of SP-W.
Applsci 11 05899 g030
Figure 31. Load–displacement envelope curve.
Applsci 11 05899 g031
Figure 32. Comparison of energy dissipation.
Applsci 11 05899 g032
Table 1. Material properties for section design.
MaterialPropertyValue (MPa)
SteelModulus of elasticity205,000
Yield strength245
Ultimate strength400
ConcreteCompressive strength24
Table 2. 28-day compressive strength of concrete.
Specimen No.Compressive Strength (MPa)
130.70
228.23
329.58
Average29.50
Table 3. Test results.
SpecimenMaximum LoadMaximum Displacement
Moment (kN-m)Lateral Force (kN)ComparisonLateral Displ. (mm)Comparison
SP-0996.83486.26100%82.195100%
SP-S583.25284.5158.5%123.275150%
SP-H541.04263.9254.3%102.885125%
SP-W982.01479.0398.5%82.185100%
Publisher’s Note: MDPI stays neutral with regard to jurisdictional claims in published maps and institutional affiliations.

