Abstract
The double-stranded B-form and A-form have long been considered the two most important native forms of DNA, each with its own distinct biological roles and hence the focus of many areas of study, from cellular functions to cancer diagnostics and drug treatment. Due to the heterogeneity and sensitivity of the secondary structure of DNA, there is a need for tools capable of a rapid and reliable quantification of DNA conformation in diverse environments. In this work, the second paper in the series that addresses conformational transitions in DNA thin films utilizing FTIR spectroscopy, we exploit popular chemometric methods: the principal component analysis (PCA), support vector machine (SVM) learning algorithm, and principal component regression (PCR), in order to quantify and categorize DNA conformation in thin films of different hydrated states. By complementing FTIR technique with multivariate statistical methods, we demonstrate the ability of our sample preparation and automated spectral analysis protocol to rapidly and efficiently determine conformation in DNA thin films based on the vibrational signatures in the 1800–935 cm−1 range. Furthermore, we assess the impact of small hydration-related changes in FTIR spectra on automated DNA conformation detection and how to avoid discrepancies by careful sampling.
1. Introduction
In the last 20 years, Fourier transform infrared spectroscopy (FTIR) has become a popular technique for studying different types of biological samples due to it being fast, inexpensive and non-destructive. The immense rise in research can be found in the field of biomedicine, with distinct goals of the development and use of (FT)IR techniques in standardized clinical applications [1]. Numerous reports utilizing FTIR spectroscopy extend it to various medical applications, from cancer detection and differentiating of normal and abnormal biomaterial to monitoring treatment efficacy [1,2,3,4,5,6,7]. Furthermore, the application of FTIR biospectroscopy aims to understand and characterize the changes in the secondary structure of biomolecules, prior to the histologic manifestation of the disease, i.e., changes on deoxyribonucleic acid (DNA) found inside the nucleus of the cell. In addition to the classical analysis of FTIR spectra (univariate analysis of frequencies, absorbance intensities, and integrated intensities of bands), many new studies in bioscience (including the ones listed above) deploy multivariate, chemometric techniques in order to extract the most information from the obtained FTIR data [8,9]. Authors not only utilize multivariate statistical methods in order to enhance the detection ability of FTIR spectroscopy but also to automate and facilitate the analysis of a large number of spectra required for biomedical application in an objective manner. Thus, multivariate statistical methods—such as the principal component analysis (PCA), support vector machine (SVM) algorithm, principal component regression (PCR), and partial least squares (PLS)—have become very popular and useful tools utilized to complement the classical spectral analysis.
Ever since the three-dimensional double-helical model of DNA was proposed, the interest for this biomacromolecule has been increasing rapidly, and now it is considered the most important molecule of modern life-science [10]. Even though many secondary structures of DNA are known today, the helical double-stranded B-form and A-form DNA are researched extensively due to their important biological roles in gene expression and cellular functions. Importantly, it was found that inconsistencies in those structures can lead to the discovery of different malignancies and pathogens in cells and tissues and may hinder or facilitate progress towards treatment [11,12]. Thus, the correct identification of DNA conformation is a relevant step for the studies where conformational transitions in DNA are used as the basis for cancer or damage detection in DNA samples [11,13,14,15,16]. However important, the biological aspect of DNA is not the only aspect researched extensively. Due to the DNA conformational and structural heterogeneity, the DNA molecule is an interesting bionanomaterial and valuable resource exhibiting a great potential for the future developments in material science and biotechnology. DNA-based sensors, colloidal crystal engineering with DNA, and various three-dimensional (3D) nano-structured functional materials, including DNA superconductors and nanowires, are only a few examples how the electric, magnetic, and optical properties of DNA can be tailored and utilized [17,18,19].
The DNA samples in which the helical structure assumes A-form or B-form can be obtained from various physical states of DNA, such as solutions, gels, thin films and crystals, and from different DNA types ranging from short oligonucleotides to genomic DNA. FTIR spectroscopy, a non-destructive and sensitive molecular technique, proved to be one of the few experimental methods capable of elucidating DNA structural features in a such diverse and heterogeneous milieu [11]. However, it is not without shortcomings. Due to a variety of local microenvironments, fluctuations, and dynamics of the DNA structure, the vibrational energy levels of individual functional groups in DNA can be greatly affected, resulting in variations in IR vibrational spectra even when standard materials, such as calf thymus or salmon testes DNA, are utilized. Consequently, the determination and quantification of DNA conformation in various types of samples is often not unambiguous but is subjected to a number of factors from the hydration of the sample—DNA concentration, temperature, etc.—to the researcher’s experience. Inconsistencies in the reported spectral profiles of two DNA conformations (A- and B-form) and misinterpretation of the spectral features are, unfortunately, not the only obstacles needed to be overcome. Some of the issues hindering the application of FTIR DNA studies still remain unresolved and include the lack of computational methods capable of the quantification of DNA conformation in objective manner, automation of spectral analysis which would enable rapid handling of large numbers of spectra and computerized assessment of the quality of the spectra, which is paramount for the quality assurance in clinical studies and application of DNA-based functional material. Even though the automated procedure for the quantification of DNA concentration from FTIR spectra was attempted [16], no such methods were reported for the quantification of DNA conformation. Thus, the automation of DNA spectral analysis and development of computational methods capable of the quantification of DNA conformation remain an open field not yet fully explored that could help to overcome the drawbacks of the current methods in DNA spectral analysis.
In our previous research [20], we provided a detailed report on the dynamics of A- to B-form transitions in DNA thin films of different hydrated states based on a statistical analysis of a large number of spectra in the backbone region from 1350 to 750 cm−1. The hydration of DNA thin films was systematically controlled by the time spent in a desiccator chamber (from 3 to 40 min) and conformation- and hydration-related signatures were resolved. Based on band shape analysis (peak fitting), an estimate of %B-form for the 3–40 min films was calculated utilizing integrated intensities of the 860, 836, and 805 cm−1 bands. However, due to a large number of samples (over 350 thin films), this type of DNA conformation analysis proved to be complex and time consuming as each spectrum had to be analyzed individually.
The main aim of this work (in contrast to our previous one) is to facilitate and automate the spectral analysis of DNA thin films of different spectral profiles and conformations. In order to achieve this goal, we extend the previously presented spectral range to the DNA base region, 1800–1350 cm−1, and exploit the spectral information obtained in the 900–750 cm−1 region (namely, the calculated fraction of B-form) in order to develop automated computerized procedures (models) capable of the following: (a) the quantification of %B-form and (b) categorization of DNA thin films spectra of different conformations and hydration states based on spectral fingerprint. We utilize the well-known and widely accessible computer algorithms: the PCA decomposition, SVM classification, and PC regression, and show, to our knowledge, for the first time the ability of the machine-learning algorithms to determine DNA conformation in thin films. Furthermore, we assess the ability of models to correctly determine (a) and (b) in different DNA spectral regions: the base region from 1800 to 1350 cm−1, region of asymmetric phosphate vibration from 1350 to 1155 cm−1 and region of symmetric phosphate vibration from 1155 to 990 cm−1. This allows us to understand the contributions of different spectral parts of DNA to overall conformation- and hydration-related vibrational signatures. We believe that this approach to sample preparation and automated spectral analysis can find further application in the related spectral techniques and, more importantly, various types of biological samples.
2. Materials and Methods
2.1. Preparation of DNA Solutions and Thin Films, and Data Collection
The dry threads of DNA sodium salt from salmon testes obtained from Sigma-Aldrich Corp. (St. Louis, MO, USA) were dissolved for 48 h in 10 mM NaCl water solution at 4 °C to a final DNA concentration of 5 g/L (15 mM DNA phosphate and 7.5 mM DNA base pairs). In order to obtain thin films, 30 μL of the respective DNA stock solutions were deposited on optical grade silicon transmission windows (Nicodom, Prague, Czech Republic) and placed inside a desiccator chamber under active vacuum (rotary vacuum pump, Leybold GmbH, Kein, Germany) for 3, 5, 10, 15, 20, 25, and 40 min, thus obtaining over 350 DNA thin films of different hydrated states. The details of sample preparation (solutions and thin films), number of spectra per desiccation time, as well as the routinely performed sample characterization, such as protein content, pH and conductivity, were presented in our previous work [20].
FTIR spectra of thin films were recorded at 25 °C on a PerkinElmer Spectrum GX spectrometer (Perkin Elmer, Waltham, MA, USA) equipped with a nitrogen cooled MCT detector and KBr beam splitter in transmission mode with the 4 cm−1 resolution and 64 co-added scans. Raw data were later processed in the Kinetics add-on for MATLAB 2010 (MathWorks, Natick, MA, USA) through which spectra were baseline-corrected and normalized using the band at 966 cm−1 (deoxyribose C-C stretching mode). Next, all spectra obtained under the same conditions were averaged using the eFTIR software (EssentialFTIR, Monona, WI, USA) and standard deviations were calculated using OriginPro 2019 (OriginLab Corp., Northampton, MA, USA). For easier identification, the abbreviations for DNA thin films and spectra of different hydrated states used were 3 min film/spectra, 5 min film/spectra, etc. Finally, control measures based on the aging of the sample were carried out; subsequent spectra were taken over the course of 240 min after their removal from the desiccation chamber in order to ensure that the same result is obtained once the samples are exposed to ambient conditions.
2.2. Multivariate Analysis
In order to develop automated methods capable of resolving different conformational spectral profiles and, consequently, determine DNA conformation based on FTIR data, the following multivariate statistical methods were utilized on pre-processed spectra in the PLS_Toolbox add-on for MATLAB: the decomposition of data by the principal component analysis (PCA), classification of data by the support vector machine discriminant analysis algorithm (SVM), and principal component regression (PCR) of data.
2.2.1. Principal Component Analysis
PCA is a multivariate statistical method used to reduce the dimensionality of a dataset to a new set of variables called principal component (PC) scores and loadings [21]. A PCA model is built so that the maximum variance of the dataset is captured: each principal component is calculated in a way to capture as much of the variation (within the dataset) as possible with the first PC capturing most of the variance, while each successive PC accounts for decreasing proportion of the variance. With the PC scores calculated, each sample within the dataset can be presented in the principal component space (PC score plot) with similar samples having similar PC scores and, consequently, similar positions in the PC score plots. Thus, intra-sample relationship and clustering of the data can be observed with the help of the PCA modeling. This is especially useful in dealing with spectra as they tend to comprise hundreds of variables; in our case, entire spectral range extends to 1150 wavenumbers, i.e., 1150 variables. However, with the PCA model hundreds of spectral features related to the variance within the dataset can be reduced to a set of several variables, for example scores on PC1 and PC2, and presented in a two-dimensional PCA score plot.
The decomposition of data in the principal component space was done on pre-processed spectra in the entire spectral range from 1800 to 650 cm−1; the data array includes absorbance values of all the wavenumbers in the named region. The used parameters for PCA analysis were: the singular value decomposition (SVD) algorithm, cross validation venetian blinds with 10 splits, and the generalized least squares weighting (GLSW) filter declutter threshold set to 0.02 (program default setting). GLSW is often used as a multivariate filter capable of removing background and interference signals by identifying unwanted covariance structures [22]. In preliminary studies, the number of principal components varied from 1 to 20; however, only the results for the models obtained using first four and five PCs were used in further analysis in order to avoid contributions from noise and overfitting. The obtained principal component scores were then presented in the PC1 versus PC2 score plot generated within the PLS toolbox without any alterations and enhancements.
2.2.2. Support Vector Machine
The support vector machine (SVM) is a kernel-based machine learning algorithm with binary and multiclass classification ability [23,24]. It is based on embedding the original data into a high dimensional vector space and defining decision boundaries by introducing decision hyperplanes on a training data capable of separating objects of different classes. After the SVM model has been trained from the calibration dataset (and the optimum separation between classes has been determined), the validation dataset comprising of new, unintroduced data is used in order to assess the classification ability of the built SVM model. In order to build the best model possible, calibration and validation datasets can be changed and various optimizations, such as variable selection, preprocessing of original data or PCA and PLS compression, can be deployed. Additionally, a cross-validation of a calibration dataset can be performed in the form of randomized n-fold splits: a calibration dataset is randomly divided into n groups and each group is successively excluded and the SVM model trained on the remaining groups and validated against the excluded group. This provides additional information on validation of each model built in SVM.
In order to elucidate the connection between vibrational signatures in the base and phosphate region (1800–935 cm−1) with conformational signatures in the 900–750 cm−1 region, several SVM models were built. The models were trained with different datasets and in different spectral ranges and validated with the 5-fold cross-validation splits and validation dataset. The data arrays contained absorbance values of all the wavenumbers in the respective regions used to build the SVM models including the entire DNA spectral region from 1800 to 650 cm−1 and four partial DNA regions: 1800–935, 1800–1550, 1320–1155, and 1155–990 cm−1. The used parameters were the C-support vector classification (C-SVC), radial kernel type with PCA X-block compression (5 PCs) and GLSW filter (0.02). For the reader’s convenience, the calibration and validation datasets, as well as other parameters of each of the models are presented in the respective section of Results.
2.2.3. Principal Component Regression
In addition to PCA, the principal component regression (PCR) can be used to determine the linear regression of the PC scores (X) and the property of interest (Y) [21,25]. The regression coefficient (R2) can be used to assess the correlation between X and Y and the PCR model can be used to predict unknown Y value of a new sample based on its X scores. To evaluate the model performance, several figures of merit, such as R2 values and root mean square errors (RMSE), can be used. The equations of these figures of merit are widely covered in the relevant literature [21,25] and are beyond the scope of this work. However, we provide their brief description and interpretation. High R2 values indicate that a significant portion of Y-variance can be explained by the model (R2 = 1 denotes 100% variance captured by the model), while low R2 values indicate a poor model that does not predict Y values better than chance. In addition to R2 values, the root-mean-square error of calibration, cross-validation, and validation (prediction) datasets (RMSEC, RMSECV and RMSEP, respectively) can be used as quality measurements or goodness of fit tests. RMSEC/P are the standard deviations of the errors, i.e., the differences between the measured and predicted Y values.
In order to predict %B-form in DNA thin films from spectral features in the 1800–935 cm−1 region, different PCR models were trained against known DNA conformations. Data arrays contained absorbance values of all the wavenumbers in the respective regions used to build the PCR models. To evaluate the role of distinct spectral regions in %B-form predictions separately, calibration datasets (10- and 40-min films) with different spectral ranges were utilized and the prediction ability of different models was assessed with validation sets consisting of 15–25 min films. In order to avoid overfitting, the models were built with the first two to three PCs and GLSW filter (0.02). As explained above, the quality of each model was evaluated on the basis of the obtained R2 and RMSEP values. The details of each PCR model are summarized in the respective section of Results.
3. Results
In our previous work [20], we analyzed the vibrational signatures of DNA thin films under different hydration conditions obtained by controlling the time spent in a vacuum chamber, from 3 to 40 min. The main absorption bands of DNA thin films of different hydrated states were presented in the range from 1350 to 750 cm−1 and assigned according to the literature. On the basis of the visual categorization of the spectra, a detailed band shape analysis in the phosphate (1150–1000 cm−1) and sugar-phosphate (900–750 cm−1) region and an estimate of %B-form calculated utilizing integrated intensities of the 860, 836, and 805 cm−1 bands, a rough classification of the spectra into two groups was obtained: 3 and 5 min films are in the first, and 10–40 min films are in the second group. In the first group, 3- and 5-min films showed distinct spectral signatures in the sugar-phosphate region, 900–750 cm−1, corresponding roughly to 40% and 60% B-form, respectively. On the other hand, the spectral signatures of 10–40 min films all showed higher level of B-form, about 75%, indicating the end of conformational transitions after 10 min. Details related to the formation kinetics of the B-form, as well as relevant calculations are presented in our previous work [20]. Next, it was shown that the changes in phosphate and sugar-phosphate vibrations, namely the 1232, 1089, 1055, 1030, and 765 cm−1 bands, originate from the changes in the hydration of thin films and are mostly unrelated to the conformational changes that seem to saturate after 10 min (changes on the ≈890, 860, 837, and 805 cm−1 bands). In this work, we expand the spectral range, and for the first time present vibrational signatures in the base region, 1800–1350 cm−1. We first try to detect and untangle the signatures related to conformational transitions from the hydration-related signatures in the base region and then develop automated procedures for DNA conformation quantification.
3.1. Vibrational Signatures of DNA Thin Films in Base Region
In Figure 1, the average spectra of 3, 5-, 10-, 15-, and 40-min films in the 1800–970 cm−1 range are presented (for details see Materials and Methods). The vibrational bands in the spectral region from 1800 to 1350 cm−1 are mostly due to the C=O, C=N, and C=C vibrations of purine and pyrimidine rings of DNA (base vibrations), while the vibrations in the range from 1350 to 970 cm−1 belong to the vibrations of the DNA backbone (for a more detailed assignment of backbone vibrations see our previous work [20]). Specifically, the absorption maximums observed near 1710 and 1661 cm−1 are dominantly due to the C=O vibrations of guanine and thymine, the maximum near 1609 cm−1 is mostly due to the C=N vibrations of adenine, while the band at ≈1490 cm−1 originates from the C=N vibrations in cytosine and guanine [26,27,28,29,30]. Several weaker bands also appear in the spectra; however, we leave them unassigned as the details of their changes are beyond the scope of this work.
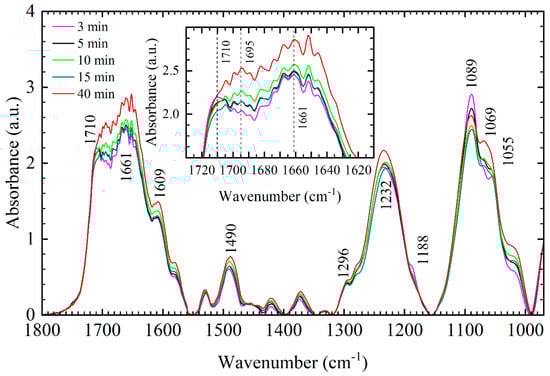
Figure 1.
The average FTIR spectra of DNA thin films of different hydration levels in the 1800–970 cm−1 range: 3 min film (purple), 5 min film (black), 10 min film (light green), 15 min film (dark green), 40 min film (red). Inset: enlarged view of the respective DNA thin film in the base region (1730–1610 cm−1). Numbers denote identified bands of 10 min film.
The spectral changes observed in the base region between different films presented in the main panel of Figure 1 can be rated as changes in the shape of the absorption curve and changes in the absorption intensity of the bands. Namely, the region between 1715 and 1685 cm−1, that contains the C=O band at 1710 cm−1, experiences spectral reshaping, while in the rest of the base region the bands retain their shape and show only an increase in the absorption intensity. Spectral reshaping in the 1715–1685 cm−1 region is most evident in the inset of Figure 1: the 3 min film reflects a distinct shape compared to the 10–40 min films mostly due to the lower absorption intensity near 1695 cm−1. In 10–40 min films, the absorption curve shape in the 1730–1610 cm−1 region is mostly unaffected by an increase of desiccation time, only a steady increase in the absorption intensity is evident. Namely, the bands at 1661, 1609, and 1490 cm−1, but other weak base bands as well, show a continuous absorption intensity increase as the desiccation time increases (see Figure 1). The intensity increase of the base bands is also followed by the intensity increase of the asymmetric PO2− vibration (Figure 1) and integrated intensity increase of those bands. The integrated intensity increase of the large absorption band in the 1800–1550 cm−1 region and asymmetric and symmetric PO2− vibrations in the 1320–1155 and 1155–990 cm−1 region, respectively, are presented in Figure 2 and are more evident for 20–40 min films. Note that 10–40 min films all have roughly the same %B-form (≈75%), so the observed intensity increase and integrated intensity increase for 20–40 min films are more likely the result of slight changes in hydration rather than changes in conformation.
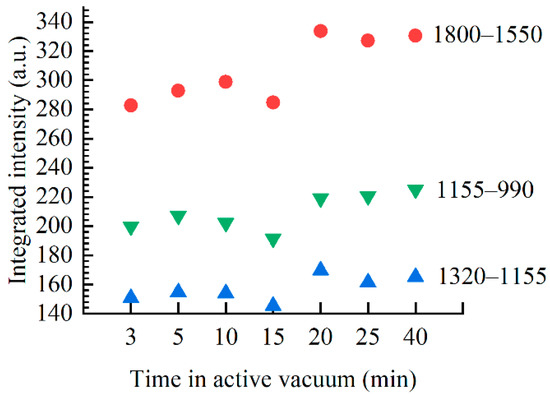
Figure 2.
Integrated intensity as a function of time in active vacuum for three distinct spectral regions: the base region from 1800 to 1550 cm−1 (red circles), asymmetric phosphate vibration from 1320 to 1155 cm−1 (blue upright triangles) and symmetric phosphate region from 1155 to 990 cm−1 (inverted green triangles). The increased integrated intensity of the 2040 min films compared to the 3–15 min films indicates hydration-related changes in thin films for all three regions rather than conformational changes.
Note that no frequency shifts of the bands are observable in the entire base region. The changes in the shape of the absorption curve in the 1720–1620 cm−1 region are most likely caused by the dissimilar intensity changes of bands, i.e., the variations in the intensity of closely overlapped bands, with their individual frequencies unchanged. Similar behavior, spectral reshaping without frequency shifts of constituent modes, was found for phosphate vibrations in the 1350–990 cm−1 region [20]. We give more detailed interpretation of the changes in the base and phosphate region in Discussion.
3.2. Principal Component Analysis
In order to develop multivariate models capable of determining %B-form in DNA thin films, we first utilized PCA for the decomposition of all spectra in the principal component space. Figure 3 shows the score plot of all 369 spectra in the 1800–650 cm−1 range built with the first four principal components: in the PC1 versus PC2 score plot a strong clustering of the spectra with respect to the time spent in a vacuum chamber is evident. PC1 accounts to ≈15% of total variance, with the 3 and 5 min spectra obtaining only negative PC1 scores, while the 10–40 min spectra obtain only positive PC1 scores. This strong separation along the PC1 axis correlates well with the previously established grouping with respect to conformation with the 3 and 5 min films reflecting more A-like conformation, while the 10–40 min films all show mostly B-form. However, as the 10 and 15 min spectra score slightly different on the PC1 axis than the 20–40 min films, it can be reasoned that PC1 variance accounts for conformational and other differences in the spectra. Strong contenders are hydration-related features as the 20–40 min films obtain similar PC1 scores, different from the 10 and 15 min films. Note that in Figure 2 the integrated intensities of the base and phosphate bands of 20–40 min films showed similar grouping, which was correlated to hydration effects as after 10 min there are no more conformational changes.
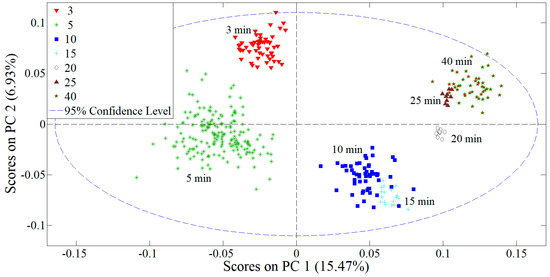
Figure 3.
PC1 versus PC2 score plot in the decomposition model obtained using the first four PCs and data array containing wavenumbers in the 1800–650 cm−1 range (entire spectral region captured by FTIR). The plot indicates clustering of the spectra with respect to time spent in a vacuum chamber.
To conclude, the PC analysis revealed that DNA films associated with the lower level of B-form, 40–60%, have negative PC1 scores (3 and 5 min films), while the films associated with the high level of B-form, ≈75%, all have positive PC1 scores (10–40 min films). Additionally, further (sub)grouping of the 10–40 min spectra based on the PC1 and PC2 scores was observed: the 10- and 15-min films in the first cluster have similar PC1 and PC2 scores, opposed to the 20–40 min films in the second cluster. Such decomposition of data in the PC score plot served as a good indication how two different types of SVM and PCR models can be trained and validated. The first type of model would be based on the classification of spectra with respect to desiccation time, i.e., entire data can be classified into seven respective classes (3–40 min films) and the model would be validated on how well it can predict spectral signatures related to each desiccation time. The second type of model is based on the classification of spectra with respect to %B-form: entire data would be classified into three respective classes, 3, 5, and 10–40 min spectra, all representing different levels of B-form, as determined in our previous work.
3.3. Classification by SVM
In order to build the best automated model capable of resolving conformational signatures in DNA thin films, the SVM models were trained with different datasets and in different spectral range and then validated against unused spectra. For easier identification, the following nomenclature was chosen: the models with different calibration sets are denoted by numbers—SVM1, SVM2, etc.—while the models calculated for different spectral regions are denoted by letters (a), (b), etc. The results of all models, as well as their respective calibration and validation datasets are presented in Table 1.

Table 1.
Summary of SVM models and obtained validation results. The abbreviation used for datasets is ds. The SVM0 model was trained to classify spectra according to seven distinct desiccation times (seven classes), from 3 to 40 min, while SVM1-SVM6 models were trained on the spectra categorized with respect to the level of B form: class 1 (40%, 3 min film), class 2 (60%, 5 min film) and class 3 (75%, 10–40 min films). The respective spectral regions (in cm−1) included in the model are indicated in the columns above the number of spectra obtained per class. Label # spectra represents the size of the validation ds (the total number of spectra per each class included in the validation dataset), while the success rate is the ratio of correctly classified spectra and the size of the validation ds.
The initial classification model, SVM0, was built in order to test the ability of the algorithm to sort all 369 spectra with respect to the time spent in a vacuum chamber (seven classes representing 3–40 min films) in the entire spectral region, 1800–650 cm−1. Out of each class of 3–40 min films, approximately 80% of samples were randomly chosen to form a calibration dataset (294 spectra), while the rest was used as a validation dataset (75 spectra). In this way, the model is trained on the calibration dataset that includes all respective desiccation times (all seven classes) and, even though the validation dataset introduces unused spectra, a great amount of variability is already introduced into the calibration dataset. Out of 75 spectra from the validation set, only two spectra were misclassified, yielding over 97% classification success rate: two 40 min films were misclassified as 25 min films. Such a high classification rate indicated that the spectral profiles of each desiccation time are indeed unique and that the SVM algorithm is able to correctly classify a large number of data with respect to their spectral fingerprint.
As our previous work showed that the 3- and 5-min films have distinct conformation signatures compared to the 10–40 min films, the classification ability of samples with respect to three different levels of B-form was tested. Seven classes representing respective vacuum times were replaced by three classes representing different levels of %B-form: class 1 (40%, 3 min films), class 2 (60%, 5 min films), and class 3 (75%, 10–40 min films). We note that %B-form was calculated using the integrated intensity ratios of conformation bands as shown in our previous work [20,31].
The first classification of samples with respect to %B-form (SVM1) was performed on the previously presented dataset with randomly chosen 294 and 75 spectra in the calibration and validation set, respectively. The SVM1 models were calculated with respect to three classes of B-form (see the previous paragraph) for three different spectral regions: (a) the base and phosphate region from 1800 to 935 cm−1, (b) base region from 1800 to 1550 cm−1 and (c) asymmetric PO2 region from 1320 to 1155 cm−1. The (a) and (b) models had 100% success rate (75 correct), whereas the (c) model misclassified three spectra, one from each class, yielding 96% success rate. Such high levels of success rates for all three SVM1 models, (a)–(c), confirms that the spectral characteristics, indicated by visual inspection as well as machine-determined, in the base and phosphate region are tightly related to conformational changes observed in the 900–750 cm−1 region. However, note that the training of the SVM1 model was done on the calibration dataset that included a portion of spectra from all desiccation times (3–40 min films), the same as the validation dataset, which means that the calibration model already accounts for most of the variability in the spectra.
In order to simulate a real-life application, it is important to evaluate models for predicting samples with an unexpected variability. This was achieved by building calibration datasets that include three different classes of B-form; however, only certain desiccation times are selected for calibration, representing a more realistic model, with an entire unknown class of samples added to the validation dataset. The SVM2–SVM5 models were all built in such a way: different combinations of desiccation times were chosen as the calibration datasets and tested for selected spectral regions.
The first classification of samples with respect to B-form (classes 1–3) based on new samples added to the validation set was SVM2. The calibration set included 333 spectra of 3-, 5-, 10-, and 40-min films (all three classes), while the validation set included 36 spectra of 15, 20, and 25 min films (only class 3). The model was calculated for four spectral regions: (a) the base and phosphate region from 1800 to 935 cm−1, (b) base region from 1800 to 1550 cm−1, (c) asymmetric PO2 region from 1320 to 1155 cm−1, and (d) symmetric PO2 region from 1155 to 990 cm−1. The SVM2 models (a)–(c) had 100% success rate (36 correct), while the (d) model for the symmetric PO2 region misclassified 1 spectrum, yielding 97% success rate. Such high success rates, regardless of the spectral region, for the models in which validation was performed on newly introduced spectra, provide an excellent basis not only for the classification of spectra but also for the estimation of %B-form. This is particularly interesting for the model (a) where, utilizing the SVM classification, an unknown %B-form for the 15–25 min spectra was determined as ≈75% with 100% success rate based on the spectral signatures in the 1800–935 cm−1 region.
In order to challenge the classification ability, the SVM2 calibration dataset was deliberately reduced until it crashed and then expanded with the fewest number of spectra possible to regain correct classification (SVM3 and SVM4). In the SVM3 model, 10 min films were removed from the training and included into the validation. The calibration dataset included 279 spectra of the 3-, 5-, and 40-min films (all three classes), while the validation set included 90 spectra of the 10-, 15-, 20-, and 25-min films (only class 3) and was performed in the 1800–935 cm−1 region. Without the 10-, 15-, 20-, and 25-min films in the calibration dataset, the success rate fell to less than 25% (22 out of 90 spectra were classified correctly) indicating that the 3-, 5-, and 40-min films are not sufficient to train a good model. In other words, the extent of spectral differences between the 5- and 40-min films is big enough for the model to fall apart. In order to improve the SVM3 model, we expanded the calibration set with 18 spectra of 15 min film so that the calibration set of SVM4 included 297 spectra of the 3-, 5-, 15-, and 40-min films (all three classes), while the validation set included 72 spectra of the 10-, 20-, and 25-min films (only class 3) and was performed in the 1800–935 cm−1 region. This significantly improved the success rate to over 80% (only 13 misclassified spectra out of 72), which suggests that the 40 min films in the 1800–935 cm−1 region (compared to the 10- and 15-min films) also contain certain spectral features not entirely related to conformation, as discussed in our previous work.
Two final SVM classification models, SVM5 and SVM6, were based on the idea of the minimization of the calibration dataset still capable of resolving different levels of B-form in the spectra. In the SVM5 model, the calibration dataset included 288 spectra of the 3-, 5-, and 10-min films (all three classes), while the validation dataset included 81 spectra of 15-, 20-, 25-, and 40-min films (only class 3) and was performed in the 1800–935 cm−1 region. The model yielded 100% success rate with none misclassified spectra in 15–40 min films, suggesting two things: there is no significant conformational difference between the 10 and 15–40 min films, as argued in our previous work, and that the sample group of 10 min films is diverse enough to provide a strong model for classification based on %B-form. On the other hand, the SVM3 and SVM4 models, that based the prediction of %B-form on the 40 min spectra, proved to be inferior. This can be easily understood looking at the sample group of 40 min films, which contains less spectra, has less spectral variability and has certain aspects unrelated to conformation present in the spectra (mostly phosphate groups).
The final step of the SVM model evaluation (by introducing unseen spectra to the validation dataset) was to include previously obtained DNA thin film spectra from our spectral library and test it against the calibration dataset of SVM5 model. Three spectra of DNA thin films obtained several years ago in our lab were processed in the same manner and used as the validation dataset. Note that the library spectra chosen for validation were obtained from DNA solutions of the same concentration, deposited on the same substrate (Si windows) and recorded on the same instrument, but in a setup with a different vacuum pump (a rotary vacuum pump of the same class but different manufacturer). For the validation spectra, the previously calculated integrated intensity ratio of conformation markers estimated B-form at the level of ≈60%, which corresponds to class 2 spectra from this work. This final model, SVM6, was trained by the same calibration dataset as SVM5 (3-, 5-, and 10-min films) in the range from 1800 to 935 cm−1 and resulted in 100% success rate. Thus, the SVM model trained on the 3-, 5-, and 10-min spectra (DNA films prepared for the purpose of this work) proved to account enough data variability even to determine %B-form for DNA thin films with unexpected variability, same as the data obtained for the purpose of other works.
3.4. Principal Component Regression
In this section, we present the final multivariate method, PCR, utilized to validate the correlation of spectral signatures in the 1800–935 cm−1 region and DNA conformation as indicated from calculations. Two models build, PCR1 and PCR2, were trained on the 3-, 5-, 10-, and 40-min spectra and validated by introducing an unknown spectra of 15-, 20-, and 25-min films and performed in four distinct regions: (a) the base and phosphate region from 1800 to 935 cm−1, (b) base region from 1800 to 1550 cm−1, (c) asymmetric PO2 region from 1320 to 1155 cm−1 and (d) symmetric PO2 region from 1155 to 990 cm−1.
The first model, PCR1, was intended mostly to see whether %B-form can be correctly predicted for DNA thin films of different desiccation times from the vibrational signatures of the base and phosphate regions, (a)–(d). The calibration dataset in the PCR1 model was trained against an estimate of %B-form, calculated for each desiccation time as described previously. The results for the regression model PCR1 calculated for the region (a), 1800–935 cm−1, are presented in Figure 4, while the results of the PCR1 model for regions (b)–(d) are presented in Table 2. As indicated from Figure 4, %B-form in 15-, 20-, and 25-min films is correctly determined by the PCR1 (a) model and a high R2 value of 0.922 indicates a very good correlation of vibrational signatures in the base and phosphate region to %B-form. The PCR1 (b)–(d) models proved inferior compared to the PCR1 (a) model with R2 values of 0.875, 0.838, and 0.847, respectively.
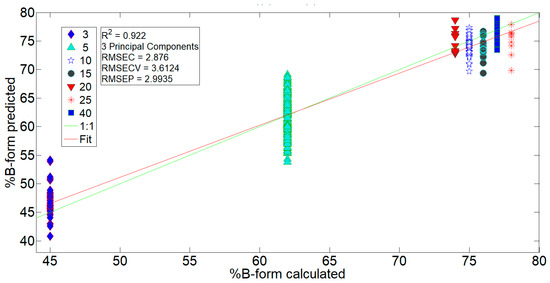
Figure 4.
Results for the regression model PCR1 calculated for the 1800–935 cm−1 region. Data were trained against calculated %B-form on the 3-, 5-, 10-, and 40-min spectra and then validated by the 15-, 20-, and 25-min spectra. For details see Table 2.
Table 2.
The summary of the PCR models and obtained values for goodness-of-fit parameters which include R2 values and errors, the root-mean-square error of calibration (RMSEC), cross-validation (RMSECV), and validation (RMSEP). The abbreviation used for datasets is ds. The PCR1 model was trained with respect to seven distinct desiccation times (seven classes), from 3 to 40 min, while PCR2 was trained with respect to the level of B-form: class 1 (40%, 3 min film), class 2 (60%, 5 min film) and class 3 (75%, 10–40 min films). The respective spectral regions (in cm−1) included in the model are indicated in the columns.
The second model, PCR2, was intended to determine the correlation of spectra with respect to three classes representing different levels of %B-form: class 1 (40%, 3 min film), class 2 (60%, 5 min film) and class 3 (75%, 10–40 min films). The results of the PCR2 model for the region (a), 1800–935 cm−1, are presented in Figure 5, while the details of the PCR2 (b)–(d) models can be found in Table 2. In the PCR2 (a) model, the class of 15-, 20-, and 25-min films was correctly determined as class 3 with a high R2 value of 0.929, while the PCR2 (b)–(d) models proved inferior with R2 values of 0.882, 0.848, and 0.856, respectively.
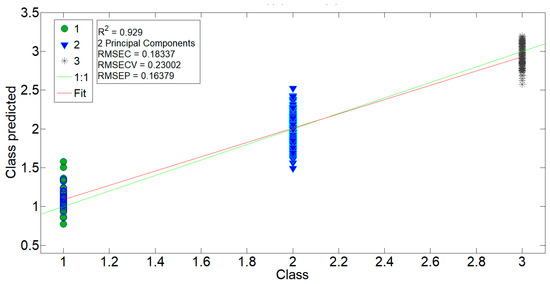
Figure 5.
Results for the regression model PCR2 calculated for the 1800–935 cm−1 region. Data were trained against their respective class on the 3-, 5-, 10-, and 40-min spectra and then validated by the 15-, 20-, and 25-min spectra. For details, see Table 2.
When the PCR1 and PCR2 models are compared, the PCR2 model seems superior with grater R2 values for all four regions, (a)–(d). Since 10–40 min films all have similar values of %B-form (≈75%), the accuracy of PCR is impaired as the differences in %B-form calculated between those groups of spectra are in fact negligible, i.e., resolving 75% and 76% B-form obtained from the relation for estimation of %B-form is not viable. Consequently, a slightly better model, PCR2, is obtained when 10–40 min spectra are all classified as single group, class 3.
Finally, we would like to mention that the datasets prepared for the PCR1 (a) and PCR2 (a) models were utilized to obtain results by the PLS regression. Similar results were obtained by PLS models and, as they did not provide additional information, they are not presented in this work.
4. Discussion
The analysis of bands in three distinct DNA spectral regions: the base region from 1800 to 1350 cm−1, phosphate region from 1350 to 935 cm−1 and sugar phosphate region from 900 to 750 cm−1, showed that the bands in the sugar-phosphate region, mostly undergo one-directional spectral changes with respect to the time spent in a vacuum chamber (frequency shifts and changes in the absorption intensity and integrated intensity). On the other hand, the base and phosphate vibrations tend to display dissimilar spectral changes with respect to the desiccation time, which greatly impedes the spectral analysis. From the inset of Figure 1, it is evident that the major absorption bands situated at 1710, 1661, and 1609 cm−1 do not exhibit frequency shifts, but rather dissimilar changes in the intensities that result in general reshaping of the absorption curve in the 1720–1620 cm−1 interval. Thus, 3 min film, which corresponds to ≈40% B-form, attains an interesting and distinct shape in the base region with A-like conformation mostly due to the low absorption intensity near 1695 cm−1. As argued previously, 3 min film is obtained just after it was formed from the DNA solution, thus preventing attainment of equilibrium during the transition and finally resulting in more disordered A-like conformation. Similar behavior, a low intensity near the 1695 cm−1 vibration in A-form DNA and sensitivity to changes in hydration was observed in [11]; however, no further interpretation was given by the authors. Thus, it appears that the intensity of vibration near 1695 cm−1 is highly susceptible to both conformation transitions and changes in hydration [32]. This is further confirmed by the large intensity increase of the named band in the case of 40 min films observed in Figure 1. Even though the conformational markers are stable in 40 min films and reflect ≈75% B-form, the increased absorption intensity in the 1720–1620 cm−1 interval, confirmed by the integrated intensity increase (see Figure 2), points to a decreased number of water molecules situated in the outer-hydration shells of DNA, as argued in [20]. To conclude, the univariate analysis of the base bands, the same as the previous analysis of the bands in the phosphate region, proved that spectral signatures of the two respective forms are not as easily resolved without the information on conformational markers (the 860, 837, and 805 cm−1 bands) since they exhibit dissimilar spectral changes depending on hydration conditions. Furthermore, conformational variations in the spectra were only disentangled due to the information being obtained from different DNA thin films, with the 3-, 5-, 10-, and 40-min films being the cornerstone of this analysis. This means that the determination of DNA conformation by means of reading the frequencies and intensities of individual base and phosphate vibrations in different DNA samples, i.e., univariate analysis is highly unlikely to be rapid and accurate. It is more likely that the accurate conformation quantification for a large number of different DNA samples will require special skill and will be time-consuming. This is especially important in cases where a large number of spectra have to be processed in a short time interval, such as different medical applications, indicating that some level of multivariate analysis should be used instead.
The PCA analysis, SVM classification and PC regression of data proved useful techniques in (a) the quantification of %B-form and (b) categorization of DNA thin films spectra of different conformation and hydration states based on spectral fingerprints in several regions. The main aim of this work was to provide an automated computerized model capable of determining %B form in DNA thin films based on the vibrational signatures in the 1800–935 cm−1 region. The SVM classification proved highly successful in determining the level of B-form. SVM1, SVM2, and SVM5 all had 100% success rate in 1800–935 cm−1 region and, together, correctly determined the B-form level for 192 different spectra of DNA thin films. Furthermore, 100% classification success rate was obtained for the SVM1 and SVM2 models in the base region from 1800 to 1550 cm−1 providing an insight that perhaps only this small part of the DNA spectrum could be used for the quantification of B-form. This is important for the studies where it might not be possible to collect any spectra below 1000 cm−1, or if the phosphate groups exhibit spectral changes due to a presence of different reagents. Particularly interesting, the SVM6 model correctly determined the level of B-form in the DNA spectra obtained on a slightly different instrumental setting. An ideal model would, of course, be capable of determining levels of B-form from the DNA spectra obtained in different laboratories but in similar experimental conditions. However, as DNA spectral profiles in different reports are rarely the same, this effort seems challenging at best without the standardization of DNA sample preparation.
The PCA analysis and SVM classification (mainly the SVM3 and SVM4 models) provided even further insight into b) the distinction of conformation- and hydration-related effects in DNA thin films. Firstly, PCA showed interesting subgrouping of the 10- and 15-min spectra versus the 20-, 25-, and 40-min spectra (Figure 3), showing that B-form DNA thin films of different hydration levels have distinct vibrational signatures. This was then further confirmed by the inability of the SVM3 model to correctly determine %B-form in 10–25 min films when trained on the 3-, 5-, and 40-min spectra. Distinct spectral characteristics of the 40 min films due to changes in hydration provided too much variability for the model, even though B-form level is the same as in the 10–40 min films. However, when the 15 min spectra were introduced in the same training, in the SVM4 model, the classification ability of the 3-, 5-, 15-, and 40-min calibration datasets drastically improved. This attests to how sensitive FTIR spectroscopy is when it comes to the secondary structure of DNA. Even though the conformation stays the same in 10–40 min films, small variations in the base and phosphate region are visible in the spectra with slight changes in hydration level. (Un)fortunately, slight changes in the dielectric medium surrounding DNA can induce a spatial anisotropy of electric fields, which induces changes in molecular electric dipoles which affect native DNA vibrations. The heterogeneity in the local microenvironments is, in our case, most likely caused by the changes in hydrated water dipoles found in the water layers in DNA atmosphere. This is most pronounced for the asymmetric phosphate vibration, found at ≈1232 cm−1. In our previous work [20], it was found highly susceptible to the changes in hydration, exhibiting frequency oscillations and variations in intensity. In this work, the quantification of the B-form based on the vibrational signatures in the region (c), 1350–1155 cm−1, where the asymmetric PO2− vibration dominates the spectrum, was by far the worst for both the SVM and PCR modeling (Table 1 and Table 2). The symmetric phosphate vibration, on the other hand, was found less sensitive to environmental changes [33], exhibits no frequency shifts and, consequently, performs better in the SVM and PCR modeling. The vibrations in the base region seem to be the least affected, displaying only small variations in intensity once B-form is stable. DNA bases are situated on the inside of the backbone, stabilized by inter-base hydrogen bonds and, consequently, shielded from changes in the local environment in farther layers of the DNA atmosphere. Thus, the SVM classification based on the vibrational signatures of the base region yields the highest success rate of the three (sub)regions studied, (b)–(d).
Finally, we address the issue of the assessment of the quality of the spectra paramount for quality assurance in clinical studies. Many of the biospectroscopy diagnostic studies rely on chemometric methods to differentiate between the normal and abnormal biomaterial since the differences in the spectra are not obvious upon a simple visual inspection. In the case of DNA studies, this seems to be of great importance since the variation in the spectra can be caused by the slightest changes in environment as demonstrated in this work. By implementing quality assurance protocols, such as the one presented here, the artefacts caused by the sampling techniques and acquisition of the spectra can be minimized, ensuring that differences in the samples provided by multivariate statistical methods originate from pathologies and not from the artefacts.
5. Conclusions
In this work, we complemented FTIR spectroscopy of DNA thin films with multivariate statistical tools, PC analysis and SVM and PCR machine learning algorithms in order to develop automated computerized methods capable of (a) the quantification of DNA conformation and (b) categorization of DNA thin films spectra of different conformations and hydration states based on spectral fingerprint in the 1800–935 cm−1 region. Working on a large number of carefully obtained spectra from systematically controlled hydration conditions, we were able to utilize the SVM learning algorithm to successfully determine the level of B-form in DNA thin films based on the vibrational signatures in four distinct regions: (a) the base and phosphate region from 1800 to 935 cm−1, (b) base region from 1800 to 1550 cm−1, (c) asymmetric PO2 region from 1320 to 1155 cm−1, and (d) symmetric PO2 region from 1155 to 990 cm−1. Furthermore, we demonstrate that both the PC analysis and SVM modeling can provide successful categorization (classification) of DNA thin films based on their respective conformations and hydration states. We also demonstrate the sensitivity of DNA spectra to environmental conditions: even slight changes in DNA hydration can severally hinder the quantification of DNA conformation, both researcher- and computer-determined. We believe that this approach to sample preparation and automated spectral analysis can find further application in related spectral techniques and, more importantly, various types of biological samples.
Author Contributions
Conceptualization, K.S. and S.D.B.; methodology, K.S. and S.D.B.; formal analysis, K.S.; investigation, K.S., S.D.B.; data curation, K.S., S.D.B.; writing—original draft preparation, K.S.; writing—review and editing, K.S. and S.D.B.; supervision, S.D.B.; funding acquisition, S.D.B. All authors have read and agreed to the published version of the manuscript.
Funding
This research and publication was co-financed by the European Union through the European Regional Development Fund, Operational Programme Competitiveness and Cohesion, under grant agreement no. KK.01.1.1.01.0008, Reproductive and Regenerative Medicine—Exploring New Platforms and Potentials.
Institutional Review Board Statement
Not applicable.
Informed Consent Statement
Not applicable.
Conflicts of Interest
The authors declare no conflict of interest. The funders had no role in the design of the study; in the collection, analyses, or interpretation of data; in the writing of the manuscript, or in the decision to publish the results.
References
- Sahu, R.K.; Mordechai, S. Spectroscopic techniques in medicine: The future of diagnostics. Appl. Spectrosc. Rev. 2016, 51, 484–499. [Google Scholar] [CrossRef]
- Sahu, R.; Mordechai, S. Fourier transform infrared spectroscopy in cancer detection. Future Oncol. 2005, 1, 635–647. [Google Scholar] [CrossRef] [Green Version]
- Su, K.-Y.; Lee, W.-L. Fourier Transform Infrared Spectroscopy as a Cancer Screening and Diagnostic Tool: A Review and Prospects. Cancers 2020, 12, 115. [Google Scholar] [CrossRef] [Green Version]
- Wood, B.R.; Quinn, M.A.; Burden, F.R.; McNaughton, D. An investigation into FTIR spectroscopy as a biodiagnostic tool for cervical cancer. Biospectroscopy 1996, 2, 143–153. [Google Scholar] [CrossRef]
- Zelig, U.; Barlev, E.; Bar, O.; Gross, I.; Flomen, F.; Mordechai, S.; Kapelushnik, J.; Nathan, I.; Kashtan, H.; Wasserberg, N.; et al. Early detection of breast cancer using total biochemical analysis of peripheral blood components: A preliminary study. BMC Cancer 2015, 15, 408. [Google Scholar] [CrossRef] [Green Version]
- Kalmodia, S.; Parameswaran, S.; Yang, W.; Barrow, C.J.; Krishnakumar, S. Attenuated Total Reflectance Fourier Transform Infrared Spectroscopy: An analytical technique to understand therapeutic responses at the molecular level. Sci. Rep. 2015, 5, 16649. [Google Scholar] [CrossRef] [Green Version]
- Zawlik, I.; Kaznowska, E.; Cebulski, J.; Kolodziej, M.; Depciuch, J.; Vongsvivut, J.; Cholewa, M. FPA-FTIR Microspectroscopy for Monitoring Chemotherapy Efficacy in Triple-Negative Breast Cancer. Sci. Rep. 2016, 6, 37333. [Google Scholar] [CrossRef] [Green Version]
- Ami, D.; Doglia, S.M.; Mereghetti, P. Multivariate Analysis for Fourier Transform Infrared Spectra of Complex Biological Systems and Processes. In Multivariate Analysis in Management, Engineering and the Sciences; Freitas, L., Ed.; IntechOpen: London, UK, 2013. [Google Scholar] [CrossRef] [Green Version]
- Li, Q.; Wang, W.; Ling, X.; Wu, J.G. Detection of Gastric Cancer with Fourier Transform Infrared Spectroscopy and Support Vector Machine Classification. BioMed Res. Int. 2013, 2013, 942427. [Google Scholar] [CrossRef]
- Dahm, R. Friedrich Miescher and the discovery of DNA. Dev. Biol. 2005, 278, 274–288. [Google Scholar] [CrossRef] [Green Version]
- Wood, B.R. The importance of hydration and DNA conformation in interpreting infrared spectra of cells and tissues. Chem. Soc. Rev. 2016, 45, 1980–1998. [Google Scholar] [CrossRef]
- Han, Y.; Han, L.; Yao, Y.; Li, Y.; Liu, X. Key factors in FTIR spectroscopic analysis of DNA: The sampling technique, pretreatment temperature and sample concentration. Anal. Methods 2018, 10, 2436–2443. [Google Scholar] [CrossRef]
- Dovbeshko, G.I.; Gridina, N.Y.; Kruglova, E.B.; Pashchuk, O.P. FTIR spectroscopy studies of nucleic acid damage. Talanta 2000, 53, 233–246. [Google Scholar] [CrossRef]
- Sofińska, K.; Wilkosz, N.; Szymoński, M.; Lipiec, E. Molecular Spectroscopic Markers of DNA Damage. Molecules 2020, 25, 561. [Google Scholar] [CrossRef] [Green Version]
- Dovbeshko, G.I.; Chegel, V.I.; Gridina, N.Y.; Repnytska, O.P.; Shirshov, Y.M.; Tryndiak, V.P.; Todor, I.M.; Solyanik, G.I. Surface enhanced IR absorption of nucleic acids from tumor cells: FTIR reflectance study. Biopolymers 2002, 67, 470–486. [Google Scholar] [CrossRef]
- Whelan, D.R.; Bambery, K.R.; Puskar, L.; McNaughton, D.; Wood, B.R. Quantification of DNA in simple eukaryotic cells using Fourier transform infrared spectroscopy. J. Biophotonics 2013, 6, 775–784. [Google Scholar] [CrossRef]
- Pi, K.; Liu, J.; Van Cappellen, P. Direct Measurement of Aqueous Mercury(II): Combining DNA-Based Sensing with Diffusive Gradients in Thin Films. Environ. Sci. Technol. 2020, 54, 13680–13689. [Google Scholar] [CrossRef]
- Zhu, J.; Lin, H.; Kim, Y.; Yang, M.; Skakuj, K.; Du, J.S.; Lee, B.; Schatz, G.C.; Van Duyne, R.P.; Mirkin, C.A. Light-Responsive Colloidal Crystals Engineered with DNA. Adv. Mater. 2020, 32, 1906600. [Google Scholar] [CrossRef]
- Shani, L.; Michelson, A.N.; Minevich, B.; Fleger, Y.; Stern, M.; Shaulov, A.; Yeshurun, Y.; Gang, O. DNA-assembled superconducting 3D nanoscale architectures. Nat. Commun. 2020, 11, 5697. [Google Scholar] [CrossRef]
- Serec, K.; Šegedin, N.; Krajačić, M.; Dolanski Babić, S. Conformational Transitions of Double-Stranded DNA in Thin Films. Appl. Sci. 2021, 11, 2360. [Google Scholar] [CrossRef]
- Gemperline, P. Practical Guide to Chemometrics; CRC Press: Boca Raton, FL, USA, 2006. [Google Scholar]
- Nespeca, M.G.; Piassalonga, G.B.; de Oliveira, J.E. Infrared spectroscopy and multivariate methods as a tool for identification and quantification of fuels and lubricant oils in soil. Environ. Monit. Assess. 2018, 190, 72. [Google Scholar] [CrossRef] [Green Version]
- Cristianini, N.; Shawe-Taylor, J. An Introduction to Support Vector Machines and Other Kernel-Based Learning Methods; Cambridge University Press: Cambridge, UK, 2000. [Google Scholar]
- Cervantes, J.; Garcia-Lamont, F.; Rodríguez-Mazahua, L.; Lopez, A. A comprehensive survey on support vector machine classification: Applications, challenges and trends. Neurocomputing 2020, 408, 189–215. [Google Scholar] [CrossRef]
- Adams, M.J.; Barnett, N.W. Chemometrics in Analytical Spectroscopy; Royal Society of Chemistry: Northampton, UK, 2007. [Google Scholar]
- Babić, S.D.; Serec, K. Sodium and manganese salt DNA thin films: An infrared spectroscopy study. Spectrochim. Acta Part A Mol. Biomol. Spectrosc. 2020, 241, 118646. [Google Scholar] [CrossRef]
- Banyay, M.; Sarkar, M.; Graslund, A. A library of IR bands of nucleic acids in solution. Biophys. Chem. 2003, 104, 477–488. [Google Scholar] [CrossRef]
- Letellier, R.; Ghomi, M.; Taillandier, E. Interpretation of DNA Vibration Modes: I-The guanosine and cytidine residues involved in Poly(dG-dC).Poly(dG-dC) and d(CG)3.d(CG)3. J. Biomol. Struct. Dyn. 1986, 3, 671–687. [Google Scholar] [CrossRef]
- Letellier, R.; Ghomi, M.; Taillandier, E. Interpretation of DNA Vibration Modes II-The Adenosine and Thymidine Residues Involved in Oligonucleotides and Polynucleotides. J. Biomol. Struct. Dyn. 1987, 4, 663–683. [Google Scholar] [CrossRef]
- Serec, K.; Babic, S.D.; Podgornik, R.; Tomic, S. Effect of magnesium ions on the structure of DNA thin films: An infrared spectroscopy study. Nucleic Acids Res. 2016, 44, 8456–8464. [Google Scholar] [CrossRef] [Green Version]
- Liquiers, J.; Taillandier, E.; Peticolas, W.L.; Thomas, G.A. The Infrared and Raman Spectra of the Duplex of d(GGTATACC) in theCrystal Show Bands Due to Both the A-form and the B-form of DNA. J. Biomol. Struct. Dyn. 1990, 8, 295–302. [Google Scholar] [CrossRef]
- Pevsner, A.; Diem, M. Infrared Spectroscopic Studies of Major Cellular Components. Part II: The Effect of Hydration on the Spectra of Nucleic Acids. Appl. Spectrosc. 2001, 55, 1502–1505. [Google Scholar] [CrossRef]
- Pohle, W.; Bohl, M.; Bohlig, H. Interpretation of the influence of hydrogen bonding on the stretching vibrations of the PO2− moiety. J. Mol. Struct. 1990, 242, 333–342. [Google Scholar] [CrossRef]
Publisher’s Note: MDPI stays neutral with regard to jurisdictional claims in published maps and institutional affiliations. |
© 2021 by the authors. Licensee MDPI, Basel, Switzerland. This article is an open access article distributed under the terms and conditions of the Creative Commons Attribution (CC BY) license (https://creativecommons.org/licenses/by/4.0/).